Comparison of landslide forecasting services in Piedmont (Italy) and Norway, illustrated by events in late spring 2013 - NHESS
←
→
Page content transcription
If your browser does not render page correctly, please read the page content below
Nat. Hazards Earth Syst. Sci., 18, 1351–1372, 2018
https://doi.org/10.5194/nhess-18-1351-2018
© Author(s) 2018. This work is distributed under
the Creative Commons Attribution 4.0 License.

Comparison of landslide forecasting services in Piedmont (Italy) and
Norway, illustrated by events in late spring 2013
Graziella Devoli1,2 , Davide Tiranti3 , Roberto Cremonini3 , Monica Sund1 , and Søren Boje1
1 Department of Hydrology, Norwegian Water Resources and Energy Directorate (NVE), Oslo, 0368, Norway
2 Department of Geosciences, University of Oslo, Oslo, 0316, Norway
3 Department of Natural and Environmental Risks, Regional Agency for Environmental Protection of Piedmont (ARPA

Piemonte), Turin, 10135, Italy

Correspondence: Graziella Devoli (gde@nve.no)

Received: 16 November 2017 – Discussion started: 27 November 2017
Revised: 9 April 2018 – Accepted: 18 April 2018 – Published: 17 May 2018

Abstract. Only few countries operate systematically na-            significantly damaged roads, railways, buildings and other
tional and regional forecasting services for rainfall-induced      infrastructure in both countries.
landslides (i.e., debris flows, debris avalanches and shallow         This case study shows that large synoptic pattern can
slides), among them Norway and Italy. In Norway, the Nor-          produce different natural hazards in different parts of Eu-
wegian Water Resources and Energy Directorate (NVE) op-            rope, from sandstorms at low latitudes, to flood and land-
erates a landslide forecasting service at national level. In       slides when the system moves across the mountain regions.
Italy, the Regional Agency for Environmental Protection,           These secondary effects were effectively forecasted by the
ARPA Piemonte, is responsible for issuing landslide warn-          two landslide warning services, operating in different parts
ings for the Piedmont region, located in northwestern Italy.       of Europe. The landslide risks were also properly communi-
A daily hazard assessment is performed, describing both ex-        cated to the public some days in advance. This analysis has
pected awareness level and type of landslide hazard for a se-      allowed the establishment of fruitful international collabora-
lected warning region. Both services provide regular land-         tion between ARPA Piemonte and NVE and the future ex-
slide hazard assessments based on a combination of quan-           change of experiences, procedures and methods relating to
titative thresholds and daily rainfall forecasts together with     similar events.
qualitative expert analysis. Daily warning reports are pub-
lished at http://www.arpa.piemonte.gov.it/rischinaturali and
www.varsom.no, last access: 7 May 2018.
   In spring 2013, ARPA Piemonte and the NVE issued                1   Introduction
warnings for hydro-meteorological hazards due to the arrival
of a deep and large low-pressure system, called herein “Vb         One of the targets proposed by the Sendai Framework (UN,
cyclone”. This kind of weather system is known to produce          2015) is to substantially increase the availability of access to
the largest floods in Europe. Less known is that this weather      multi-hazard early warning systems and disaster risk infor-
pattern can trigger landslides as well.                            mation to the public by 2030 (UN, 2015). It also emphasizes
   In this study, we present the experiences of NVE and            the need for enhancing preparedness, response, recovery, re-
ARPA Piemonte in the late spring of 2013. The Vb cyclone           habilitation and reconstruction in order to reduce natural dis-
influenced weather throughout Europe over a long period,           aster risk and that response actions must be focused within
from the end of April until the beginning of June 2013. How-       and across sectors, by states, at local, national, regional and
ever, major affects were observed in the first half part of this   global level.
period in Piedmont, while in Norway, major damage was re-             UNISDR (2009) defined an early warning system (EWS)
ported from 15 May to 2 June 2013. Floods and landslides           as “a set of capacities needed to generate and disseminate
                                                                   timely and meaningful warning information to enable indi-

Published by Copernicus Publications on behalf of the European Geosciences Union.
1352                                      G. Devoli et al.: Comparison of landslide forecasting services in Italy and Norway

vidual, communities and organizations threatened by a haz-             c. Debris flows and debris floods occur usually in steep
ard to act appropriately and in sufficient time to reduce the             channels, starting as stream bed erosion or from soil
possibility of harm or loss”. To be efficient, EWSs should in-            slides, debris slides or debris avalanches from a steep
clude four elements: knowledge of the physical mechanisms                 bank, entraining material downslope.
that cause the hazard and the exposed elements at risk; the
technical capacity to continuously monitor the hazard and to         See Hungr et al. (2014) for more details.
develop changing scenarios to issue warnings; the communi-              These main types of soil slip develop in steep slopes and
cation of the warning and the capacity to translate the pre-         are characterized by high rate of movement, varying from
diction into warning and action plans (Cloutier et al., 2015).       rapid to extremely rapid events. They occur in different types
Worldwide there are many EWSs currently operated for var-            of soil: residual soils, colluvial, pyroclastic, fluvial and tills
ious types of natural hazards, including landslides.                 deposits or organic soils. Near infrastructure and buildings
   Landslides are a serious hazard in many countries, caus-          soil slides may occur in artificial loose fills. They are trig-
ing significant loss of lives yearly (Petley, 2012; Haque et         gered by short duration rainfall events (minutes to hours),
al., 2016) and large damage to infrastructure. Landslides            due to rapid infiltration and percolation of water in the thin
are defined as “the movements of a mass of rock, debris              soil material.
or earth down a slope” (Cruden and Varnes, 1996) and are                Debris flows are known to be the most destructive ones,
classified based on the failure mechanisms and the type              because of their high velocity and long run-outs; debris
of material (Hungr et al., 2014). However, other parame-             avalanches are also quite destructive as they usually occur
ters like rate of movement (e.g., velocity) and the size and         in clusters and due to their potential to spread out in the de-
depth of sliding surface, among others, can be used to clas-         positional area. Soil and debris slides, even if relatively shal-
sify them. Using velocity as a criteria, the so-called “rapid        low and of small size, occur in clusters, causing significant
landslides” are those with velocity > 1.8 m h−1 , and “ex-           damage to infrastructure and even loss of life if they occur
tremely rapid” are those with velocity larger than 5 m s−1           close to inhabited areas. They occur over a large area all at
(Cruden and Varnes, 1996). It is sometime useful to classify         the same time and often simultaneously with floods making
landslides based on type of triggering factors, thus expres-         damage much more extensive.
sions like “earthquake-induced landslides”, “rainfall-induced           The occurrence of these types of landslides has become
landslides”, “precipitation-induced landslides”, “weather-           more frequent and, as population and infrastructure have in-
induced landslides” and “snowmelt-induced landslides” are            creasingly expanded into landslide-prone areas, their impacts
often used in literature (Baum and Godt, 2010; Calvello,             on society have become more dramatic. Recent studies shows
2017; Katsura et al., 2008; Rodríguez et al., 1999; Havenith         that these could be potentially enhanced under a changing
et al., 2016). The landslides triggered by short- or long-           climate (Stoffel et al., 2014; Gariano and Guzzetti, 2016 and
duration intense rainfall are in general called rainfall-induced     reference therein).
landslides or precipitation-induced landslides, while if abun-          Effective landslide warnings have become essential ele-
dant snowmelt is causing them, snowmelt-induced landslides           ments of integral risk management worldwide, since they are
is often used. The expressions weather-induced, rainfall-            a cost-effective risk mitigation measure and in some regions
induced and snowmelt-induced landslides have been used as            the only suitable option for a sustainable landslide risk man-
general terms to include both landslides triggered by rainfall       agement (Glade and Nadim, 2014). EWSs for landslides are
and/or by snowmelt, especially in mountainous areas cov-             designed to detect events that precede a landslide in time to
ered by snow, where they can occur simultaneously espe-              issue an imminent hazard warning (Di Biagio and Kjekstad,
cially during spring.                                                2007) and initiate actions to mitigate and to reduce the po-
   The landslide types triggered by rainfall and snowmelt            tential damage and allow people to get to safety.
episodes are usually in the category of slide- and flow-type            The development of landslide EWSs has not been uniform
landslides (Hungr et al., 2014). The following types are com-        worldwide, and a few public resources have been invested in
monly observed:                                                      the past for their establishment, probably because the land-
                                                                     slides losses are perceived as private economic losses, like in
  a. Soil slides (e.g., clay/silt planar slides) and debris slides
                                                                     USA (Baum and Godt, 2010). Apart from the case of Hong
     (e.g., gravel/sand/debris slides) are usually of small size
                                                                     Kong, where the first landslide EWS was organized in 1977
     (volume inferior to 5000 m3 ), and are shallow slides
                                                                     and is still operative (Chan et al., 2003), in other countries,
     with a sliding surface of 1–2 m deep that occur within
                                                                     it was at the end of the 1990s that most of the EWSs started
     the soil material or at contact with the underlying less
                                                                     to be developed (D’Orsi et al., 1997). In the 1980s, in USA,
     permeable bedrock (as also observed by Zêzere et al.,
                                                                     there were two attempts of EWSs. The first recorded debris
     2015). They are planar slides; however, a few rotational
                                                                     flow early warning attempt was done in the spring of 1984 in
     ones may occur, especially in clay/silted soils.
                                                                     the state of Utah, while in the San Francisco Bay Area of Cal-
  b. Debris avalanches occur often in open slopes, initiating        ifornia the first experimental operating landslide EWS started
     as shallow planar soil or debris slides.                        in 1985, but a decade later both were closed, because of a

Nat. Hazards Earth Syst. Sci., 18, 1351–1372, 2018                           www.nat-hazards-earth-syst-sci.net/18/1351/2018/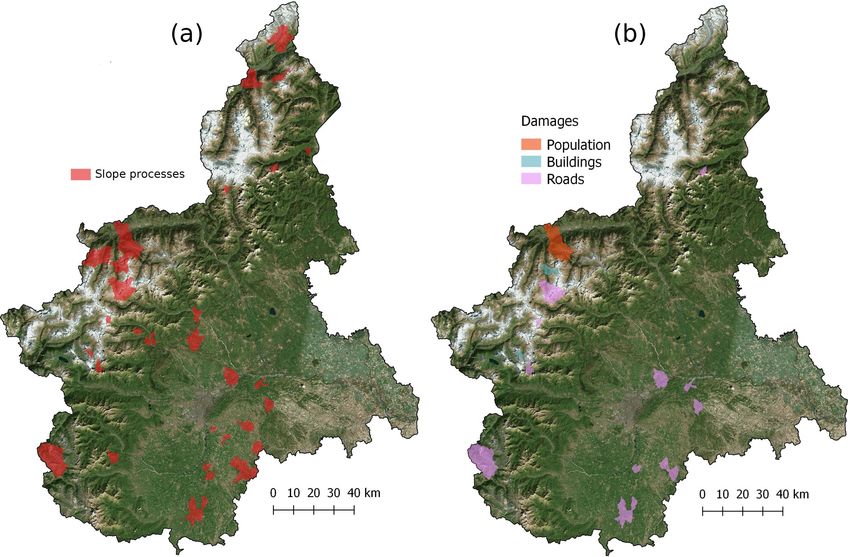
G. Devoli et al.: Comparison of landslide forecasting services in Italy and Norway                                              1353

shortage of personnel and lack of adequate funding (Baum            Wood et al. (2016) investigated the synoptic weather trends
and Godt, 2010).                                                    and landslide in the European Alps. The meteorological con-
   EWSs are technical feasible for some types of landslides.        trol on the distribution of debris flows in Iceland was also
Overview and classification of existing landslide EWSs are          investigated by Decaulne and Sæmundsson (2007). Large
presented in Thiebes et al. (2012), Bazin (2012) and later          synoptic weather events were investigated in southern Nor-
Stähli et al. (2015). The latter authors have proposed an           way (Devoli et al., 2017). Understanding the relationships of
overview and a classification of existing early warning sys-        weather, climate, precipitation and landslide occurrence will
tems for rapid mass movements (e.g., debris flows and               allow the prediction of certain types of weather development
snow avalanches) where three main categories are identified:        and allow states and the public to be better prepared.
(i) alarm, (ii) warning and (iii) forecasting. Another recent          Literature shows that few examples describe how warning
summary of existing weather-induced landslide EWSs is pre-          systems work, what their performances are or how they are
sented in Calvello (2017) in which systems are differentiated       received by the public or other stakeholders. The compari-
as local and territorial. The literature shows that many local      son of different EWSs and specifically their operation is even
early warning systems exist at specific sites, for rockslides,      rarer and a quite unexplored topic. To our knowledge a few
deep-seated complex landslides and debris flows where ex-           have been made (e.g., Baum and Godt, 2010; Lagomarsino et
tensive monitoring instrumentation provides detailed infor-         al., 2015; Zêzere et al., 2015) but they mainly compare some
mation (i.e., Bardoux et al., 2009; Blikra et al., 2013; Mi-        technical components, like the application and performance
choud et al., 2013 and references therein). The territorial         evaluation of different thresholds in the same area. The vari-
EWSs have acquired importance in the last 15–20 years and           ous EWSs consist of different components, and therefore it is
especially after the Hyogo Framework for Action (2005–              important to analyze not only the performance of the single
2015), adopted by the World Conference on Disaster Re-              components, but the performance of the entire system. How-
duction (UNISDR, 2005). They are mainly constrained to              ever, components like expert knowledge decision are difficult
forecast the occurrence of rainfall-induced landslides (i.e.,       to judge in objective way and there are no methods in place.
Osanai et al., 2010; Baum and Godt, 2010; Jakob et al.,             The lack of comparison among existing EWSs is also due to
2012; Liao et al., 2010; Pumo et al., 2015; Segoni et al.,          the fact that many EWSs are still not fully operative or they
2014; Lagomarsino et al., 2013; Tiranti and Rabuffetti, 2010;       have recently started operation, and therefore lack data for
Ponziani et al., 2013; Huang and Hong, 2010).                       analysis.
   Many countries have spent recent decades working on                 Norway and Italy have a long tradition of flood forecast-
preparing the technical basis for early warnings, by under-         ing, but only in (relatively) recent years have efforts been
standing landslide initiation, defining rainfall thresholds, in-    made to design, develop and operate landslide forecasting
stalling real-time monitoring instruments and organize pro-         services, often in synergy with flood and/or snow avalanche
totypes of landslide warning systems, but a few of them be-         forecasting. The Norwegian Water Resources and Energy Di-
came operational. In agreement with other authors (Segoni           rectorate (NVE) operates a landslide forecasting and warning
et al., 2015) in general the potential of EWSs is not yet fully     service at national level (in Norwegian Jordskredvarsling)
exploited by governments and decision-makers.                       since 2013. The service is relatively new. Since its begin-
   A broad range of literature exists on the definition of em-      ning, its focus has been on its design and implementation at
pirical rainfall thresholds for the possible landslide initiation   the national level, not describing its function to an interna-
or description of single components of the system (Segoni           tional audience. The emphasis has been on the establishment
et al., 2018 and references therein). The thresholds may de-        and training of forecasters, on the development of existing
fine the rainfall, soil moisture or hydrological conditions that,   web tools used for flood and snow avalanche forecasting to
when reached or exceeded, are likely to trigger landslides.         include landslide-related parameters and thresholds, and on
Therefore, successful prediction of landslide hazards in large      the establishment of routines, implementation and updating
regions greatly depends on ability to link meteorological con-      landslide thresholds and definition of warning and perfor-
ditions with various types and extents of slope failures. In the    mance evaluation criteria (Colleuille et al., 2017; Devoli et
prevention of rainfall- and snowmelt-induced landslides at          al., 2014; Boje et al., 2014). The performance of the service
territorial level, the recognition of the relationship between      was recently tested using the event, duration, matrix perfor-
large-scale patterns and landslides occurrence is important         mance (EduMaP) method in Piciullo et al. (2017) and the de-
to investigate. The synoptic weather and landslides occur-          scription of the entire service is given in (Krøgli et al., 2017).
rence has been demonstrated in a few works. Large-scale                In Italy the landslide hazard assessment is not national
pattern phenomena such as El Niño and the North Atlantic            but regional. In Piedmont the regional environmental agency
Oscillation (NAO) change slowly and impact both precipi-            (Regional Agency for Environmental Protection, ARPA) is
tation regime and temporal occurrence of different landslide        responsible for the daily landslide hazard assessments and
types in different areas of the world have been demonstrated.       emission of landslide warnings and operated the local EWS
In 2005, Trigo et al. (2005) found connections between the          since 2008 (Tiranti and Rabuffetti, 2010).
NAO index and the occurrence of landslides in Portugal.

www.nat-hazards-earth-syst-sci.net/18/1351/2018/                           Nat. Hazards Earth Syst. Sci., 18, 1351–1372, 2018
1354                                        G. Devoli et al.: Comparison of landslide forecasting services in Italy and Norway

Figure 1. (a) Physiography of Piedmont, TO stands for Turin; (b) slope distribution of Piedmont; (c) density distribution of shallow landslides
(from 1962 to 2016) compared with the geological/structural sketch map of Piedmont: (1) Quaternary; ALPS: (2) Austroalpine domain
(pre-Alpine crystalline basement and Palaeozoic cover); (3) Penninic domain (Permian–Mesozoic–Tertiary metamorphic cover; (4) Penninic
domain (Helminthoid flysch units); (5) Penninic domain (pre-Triassic crystalline basement); (6) Helvetic domain (Permian–Mesozoic cover);
(7) Helvetic domain (pre-Alpine crystalline basement and Carboniferous cover); APENNINE and HILLS: (8) internal margin foredeep
deposits; (9) epi-Ligurian sequences (epi-sutural basins deposits unconformably covering the Ligurian units); (10) epi-Ligurian sequences
(Oligo–Miocene of Langhe); (11) Ligurian and sub-Ligurian units (nappes, locally ophiolitic bearing); (a) Front of tectonic units (limits of
different paleogeographic domains); (b) Neotectonic deformation zones.

   In this study, we compare two examples of forecast and                 2     Study areas
warning services for rainfall and snowmelt-induced land-
slides successfully operating in Piedmont, northwestern Italy,            Although the two areas are located at different latitudes, both
and in Norway. The main objective of this study is to shows               are characterized by complex orography and similar geo-
how the two services are organized, but also how they op-                 logical surficial processes. Moreover, according to Peel et
erated and performed under the same large synoptic pattern                al. (2007), both the Norwegian mountains (Nordryggen) and
that hit Europe in 2013.                                                  the Italian Alps belong to the same Köppen–Geiger climate
   Another important objective of this work is to demonstrate             class.
that the weather synoptic systems, known as Vb cyclones,
are often responsible for intense rainfall events and associ-             2.1    Piedmont region, Italy
ated with high temperatures producing intense snowmelt in
many European countries, triggering not only large floods                 The Piedmont region is complex from a geomorphologi-
but also many landslides. Quite often forecasting services fo-            cal and geological point of view. Its territory is shaped
cus on the analysis of the climatic and meteorological con-               by mountain environments (western Alps and subordinate
ditions in their own region, forgetting that the rainfall can be          Apennine with peaks ranging from 1000 to 4800 m a.s.l.),
part of larger processes and landslide can occur across mul-              hills (Torino hill, Monferrato hills and Langhe with an ele-
tiple municipalities, regions and even countries at the same              vation range of 400–700 m a.s.l.), and alluvial plains (200–
time. An example is the landslides triggered by Hurricane                 300 m a.s.l.), surrounded by the Alps and Apennines on three
Mitch in 1998 across Central America (i.e., Bucknam et al.,               sides (Fig. 1a). The western Alps are characterized by a com-
2001; Cannon et al., 2002) or the landslides triggered by the             plex double-verging structure with asymmetrical transversal
storm Desmond on 4 and 5 December 2015 in the UK and                      cross-section (Roure et al., 1990, 1996; Pfiffner et al., 1997),
Norway. The study aims to demonstrate that cooperation be-                subdivided into three main structural sectors. (1) South-
tween countries and between operational landslide warnings                Alpine domain characterizes the internal sector (the colli-
is necessary and the increased knowledge of weather system                sional system upper plate consists in Hercynian and pre-
patterns and shared experiences can enhance forecast leading              Hercynian bedrock formed by lower continental and upper
time and improve daily landslide hazard assessment.                       mantle rocks). (2) Helvetic–Dauphinois domains constitute
                                                                          the external sector, representing the European foreland zone,
                                                                          formed by Hercynian intrusive massifs system and Meso-

Nat. Hazards Earth Syst. Sci., 18, 1351–1372, 2018                                 www.nat-hazards-earth-syst-sci.net/18/1351/2018/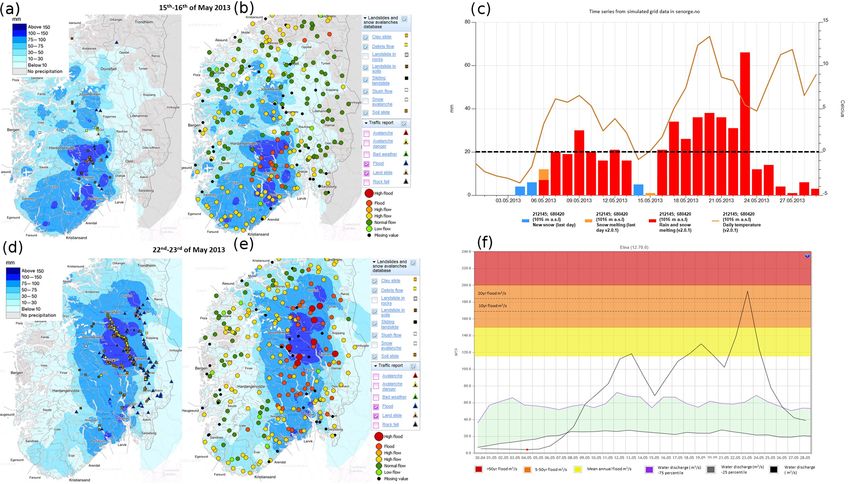
G. Devoli et al.: Comparison of landslide forecasting services in Italy and Norway                                          1355

zoic flysch cover. (3) Frontal thrust of Penninic domain and
the Insubric front (Malusa and Vezzoli, 2006) bound the
axial sector formed by Hercynian and pre-Hercynian con-
tinental rocks and Hercynian metasedimentary formations,
oceanic lithosphere rocks and ocean fronting continental
boundaries and orogenic flysch units. During the Quaternary,
wide glaciers occupied Alpine valleys and were molded by
glacial pulsations. Locally, glacial landforms and deposits
were modified by Holocene fluvial/torrential processes as-
sociated with widespread landslides (Soldati et al., 2006).
   The geology of hilly environment is mainly formed by
Oligo–Miocene sedimentary strata, originated during the
Tertiary Piedmont Basin where the lowest term of sedimen-
tary sequence is formed by shallow-sea deposits, while deep
marine environment (turbidite deposits up to 4 km thickness)
represents the upper part of the sedimentary sequence. The
stratigraphic succession is due to Oligocene marine trans-
gression made by the alternation of marls, sandstones and
shales (about 5–50 cm thickness); strata dipping NW with
8–15◦ inclination. Sin-sedimentary tectonics controlled the
thickness and lateral interdigitations of the stratigraphic suc-
cessions. The northward movement of the Padan thrust belt
                                                                   Figure 2. Mean annual precipitation (MAP) in Piedmont from 1913
(Falletti et al., 1995) caused the progressive uplifting of the
                                                                   to 2012 (source: ARPA Piemonte).
basin which has occurred since the Langhian. The sedimen-
tary sequence lies on Alpine metamorphic units by unconfor-
mity (Biella et al., 1987, 1992; Gelati and Gnaccolini, 1988).       – sub-Alpine: dry season during winter, main maximum
Apennine units are poorly represented within the borders of            during fall and secondary maximum during spring;
Piedmont, mainly represented by Ligurian, sub-Ligurian and
epi-Ligurian units (Fig. 1b).                                        – sub-continental: dry season during winter, main maxi-
   As shown in Fig. 1c, the main occurrence of shallow land-           mum during fall and a secondary maximum during sum-
slides (density interpolation map of 33 000 shallow land-              mer.
slides occurred from 1962 to 2016) corresponds with the epi-
Ligurian sequences (Oligo–Miocene of Langhe: hilly envi-           2.2   Østlandet region, Norway
ronment), the Helvetic domain (pre-Alpine crystalline base-
ment and Carboniferous cover: northwestern Alps), the Pen-         The region Østlandet in southeastern Norway also has a com-
ninic domain (pre-Triassic crystalline basement: northern          plex geomorphological and geological setting. The region in-
Alps), the internal margin foredeep deposits (hilly environ-       cludes eight administrative counties. The highest mountains
ment) and the epi-Ligurian sequences (epi-sutural basins de-       are in the northern and western part of the area with max-
posits unconformably covering the Ligurian units: Torino           imum elevations up to 2469 m a.s.l., observed in the Jotun-
hill).                                                             heimen area. The region is mostly hilly, with dominant land-
   The spatial distribution of annual rainfall shows high          forms represented by glacially scoured valleys directed N–
precipitation in the northern areas with more than                 S in the eastern sector, facing NW–SE in the western sec-
2100 mm year−1 , and low precipitation in the eastern part         tor, congregating around the Oslofjord (Fig. 3a). The valleys
of the plains with less than 700 mm year−1 (Fig. 2). The           Østerdalen and Gudbrandsdalen are the longest in the coun-
monthly distribution of precipitation in Piedmont shows a          try. The region contains also some very large areas of low-
bimodal distribution, with two peaks during spring and fall,       land surrounding the Oslofjord. The longest river and wa-
and two minimums during winter and summer. Four rain-              tercourses, Glomma, and the biggest lake, Mjøsa, are also
fall regimes (three continental and one Mediterranean) can         located in this region. Southeastern Norway contains exten-
be differentiated:                                                 sive areas with forest and rich arable land. From a geolog-
                                                                   ical point of view, this region is dominated by bedrock of
  – pre-Alpine: dry season during winter, main maximum             the Baltic shield, characterized by Precambrian basement
    during spring and secondary maximum during fall;               rocks (e.g., granites, granodiorite, gneisses, amphibolites,
                                                                   rhyolite, gabbro, diorite and meta-sediments). In the north-
  – sub-coastal: dry season during summer, main maximum            ern sector rocks within the Caledonian orogen (e.g., sand-
    during fall and a secondary maximum during spring;             stone, schist, amphibolite, mica schist, phyllite conglomer-

www.nat-hazards-earth-syst-sci.net/18/1351/2018/                          Nat. Hazards Earth Syst. Sci., 18, 1351–1372, 2018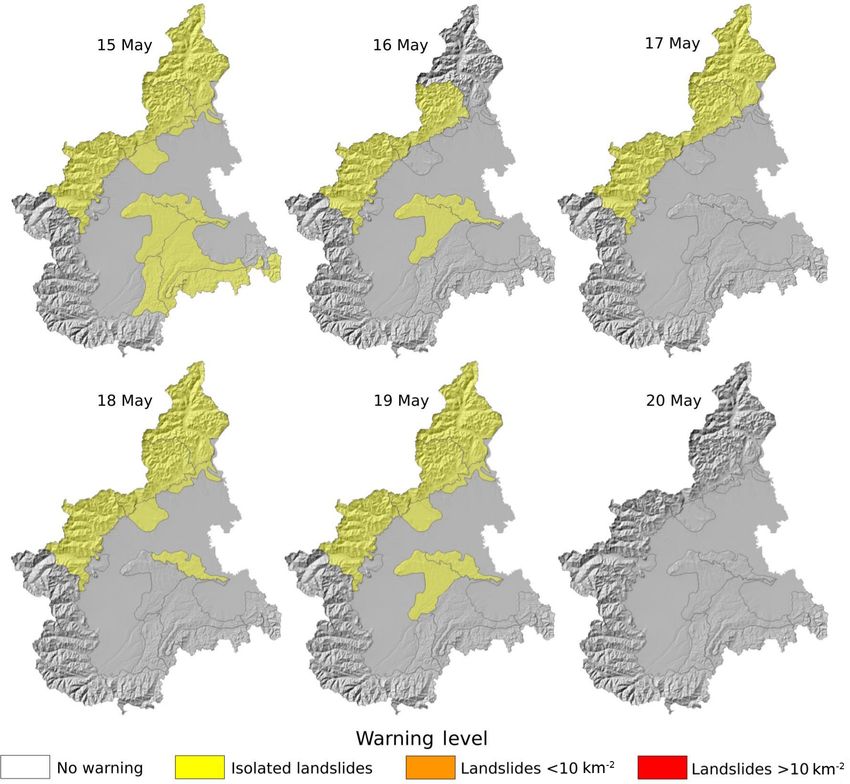
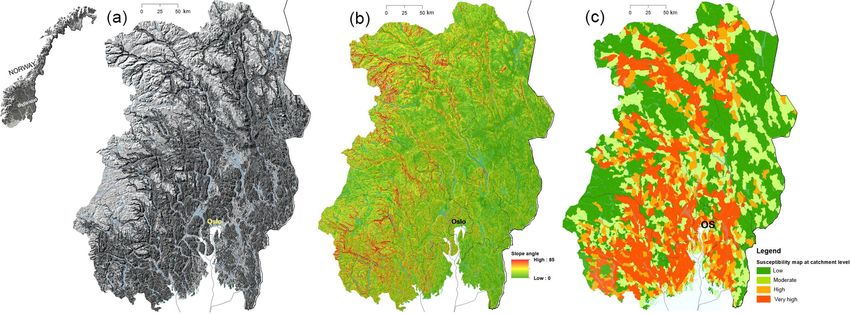
1356                                        G. Devoli et al.: Comparison of landslide forecasting services in Italy and Norway

Figure 3. Østlandet region: (a) physiography; (b) slope distribution; (c) landslide susceptibility map (unit: first-order catchment).

ate) prevail. Cambro–Silurian sedimentary rocks (e.g., shale,
limestone and phyllite) and Permian volcanic rocks (syenite,
granite monzonite, porphyritic rocks and basalt) occur within
the Oslo Graben (Solli and Nordgulen, 2006). Quaternary de-
posits that cover the bedrock are mainly left by glacial pro-
cesses. Continuous till deposits cover large areas of the hilly
mountains and valley sides and floors, with a variable thick-
ness from 0.5 to a couple of meters. The bottom of the valleys
is mainly covered by thick fluvial and glaciofluvial deposits.
Till deposits have a large heterogeneity in terms of granu-
lometry and composition. The amount and the composition
varies as function of the bedrock, in some places the till de-
posits are covered by landslide deposits, which occurred after
glaciation. Marine clay deposits are observed in the southern
sector of the region.
   Most of the rainfall-induced landslides in the region oc-
cur in proximity of steep slopes, (Fig. 3b) covered by till de-
posits, especially where there is a large clay mineral content
that reduces the water infiltration and provides more surficial
runoff. The red areas in Fig. 3c, show where landslides sus-
ceptibility is high in the region. Two sectors are most prone
to landslides: the steep slopes of glacially scoured valleys
oriented N–S and NW–SE, covered by till deposits, where
mainly debris flows and debris avalanches are observed, and
the southern sector, where marine clay deposits are prevalent.
Here clay slides and quick clays slides may form, the latter
triggered mainly by human activities.                                     Figure 4. Mean Annual Precipitation (MAP) of Østlandet region.
   Based on Köppen classification, the climate of the region
varies from a tundra type (ET) in the northwestern part, to
subarctic (Dfc) in the central part. The warm summer humid
continental type (Dfb) and oceanic type (Cfb) are mainly ob-              mer. Deficits of precipitation are observed at Skjåk where the
served in the southern sector and along the southern coast-               annual precipitation is of about 317 mm (water equivalent) or
line. In this region, the climate is mainly characterized by              Biri with 754 mm annual precipitation. The area has a nor-
cold winter and warm summer. The amount of precipitation                  mally stable snow cover during winter, with normal annual
in form of rainfall and snow varies depending on the area                 maximum (1971–2000) around 1000 mm in the mountains
(i.e., valley floor and mountain), but in general this area is the        (Fig. 4). The annual medium temperature ranges from −7 ◦ C
driest of Norway with low precipitation, mostly during sum-               in the mountain area to 7 ◦ C in the coastal area.

Nat. Hazards Earth Syst. Sci., 18, 1351–1372, 2018                                 www.nat-hazards-earth-syst-sci.net/18/1351/2018/
G. Devoli et al.: Comparison of landslide forecasting services in Italy and Norway                                            1357

3     The landslide forecasting services in Piedmont region               zones are
      and in Norway
                                                                          I = 25 · D −0.45 Zone 1,                              (1)
The warning services herein presented are classified as “ter-                          −0.65
                                                                          I = 40 · D           Zone 2,                          (2)
ritorial” (Calvello, 2017) and they can be classified as both
“forecasting-type” and “warning-type” services (Stähli et al.,
                                                                          where I is the rainfall mean intensity (mm h−1 ) and D
2015) because they predict the level of danger, and the occur-
                                                                          is the rainfall duration (h). More details are reported in
rence of multiple landslides over a warning area and at regu-
                                                                          Tiranti and Rabuffetti (2010).
lar intervals (e.g., daily), but also because data interpretation
and the initial alert are based on predefined thresholds. Ex-
                                                                      – TRAPS (Translational/Rotational slides Activation Pre-
perts consult prediction models, thresholds and analyze ob-
                                                                        diction System) is operated to forecast deep-seated
servations to forecast the regional danger levels, which are
                                                                        translational and rotational slides in the hilly environ-
communicated widely in a bulletin. The main goal of these
                                                                        ment. TRAPS analyzes 60 days of antecedent precip-
services is to save lives, to reduce landslide risks for roads,
                                                                        itation, including water from snowmelt (Tiranti et al.,
railways and settlements, and also increase safety and pre-
                                                                        2013).
dictability. In addition, to contribute to a better foundation
for emergency preparedness at local level, services provide         ARPA Piemonte daily evaluates the EWS responses to issue
continuous information on conditions and expected develop-          a regional warning to civil protection units, municipalities
ment to national and regional authorities and the public.           and citizens regarding the occurrence of slope processes. All
   As stated in Sect. 1, both the services are designed to          the EWSs responses are displayed and managed through a
forecast the occurrence of rainfall- and snowmelt-induced           WebGIS interface (Fig. 5) that allows a real-time estimation
landslides, i.e., shallow landslides and debris slides, debris      of hazard scenarios induced by observed and/or forecasted
avalanches and debris flows (Hungr et al., 2014); the Norwe-        weather conditions. All the Piedmont EWSs operate contin-
gian landslide forecasting and warning service is also respon-      uously and automatic warnings are issued by e-mail and SMS
sible for slush-flow warning. Table 1 summarizes the main           to experts.
characteristics of the services herein described, showing sim-
ilarities and differences.                                          3.2   The Norwegian landslide forecasting and warning
                                                                          service
3.1    Piedmont’s landslide forecasting service
                                                                    The landslide assessment is done by a forecaster, who con-
The Regional Warning System for Geo-Hydrological hazards
                                                                    sults weather forecasts, landslides thresholds and other rele-
of ARPA Piemonte includes three independent early warn-
                                                                    vant hydro-meteorological parameters daily. This informa-
ing systems (EWSs), based on empirical rainfall thresholds
                                                                    tion is available as raster data with 1 km2 resolution and
and designed ad hoc for different typology slope processes,
                                                                    presented as thematic maps at http://xgeo.no, last access:
whose triggering is generally determined by precipitation
                                                                    7 May 2018, a portal that assist experts in the daily forecast-
with different intensity over different durations:
                                                                    ing of floods, snow avalanches and landslides (Krøgli et al.,
    – DEFENSE (DEbris Flows triggEred by storms – Now-              2017). Here, weather prognoses, forecasted thresholds and
      casting SystEm) is operated to forecast the occurrence        hydro-meteorological parameters are published daily for the
      of channelized debris flows in small Alpine catchments.       following 6 days. The portal also visualized past interpolated
      DEFENSE works by the combination of the GIS en-               weather observations, thresholds and others parameters. Be-
      vironment of different Alpine catchments, classified by       sides the thematic maps, the forecaster on duty may need to
      the clay weathering index, and instantaneous rainfall in-     consult real-time hydro-meteorological observations, in par-
      tensity (mm h−1 ), provided by the weather radar using a      ticular groundwater level or water discharge values at spe-
      storm-tracking algorithm (Tiranti et al., 2014). The use      cific stations within the possible warning area. These data
      of quantitative precipitation estimates (QPEs) by the C-      are also available at the same website: http://xgeo.no.
      band weather radar is limited to Alpine areas where the          The weather prognosis, temperature and precipitation are
      radar visibility is good and uncertainties limited. More      obtained from AROME MetCoOp model (used in the Scan-
      details on the operational weather radar operated by          dinavian regions as a short-term forecast model for the first
      ARPA Piemonte can be found in Davini et al. (2011);           3 days) and EC model (a global long-term European model,
      Cremonini and Bechini (2010).                                 for the following 3 days). The models operate in 24 and
                                                                    3 h resolution. Temperature and precipitation are also used
    – SMART (Shallow landslides Movements Announced                 as input variables in two hydrological models (Krøgli et al.,
      through Rainfall Thresholds) is operated to forecast          2017). The main model is a distributed version of the con-
      shallow landslides in mountain area (zone 1) and hilly        ceptual HBV model (Beldring et al., 2003) that divides the
      environments (zone 2). Threshold equations in the two         country into grid cells, each one modeled as a separate basin

www.nat-hazards-earth-syst-sci.net/18/1351/2018/                           Nat. Hazards Earth Syst. Sci., 18, 1351–1372, 2018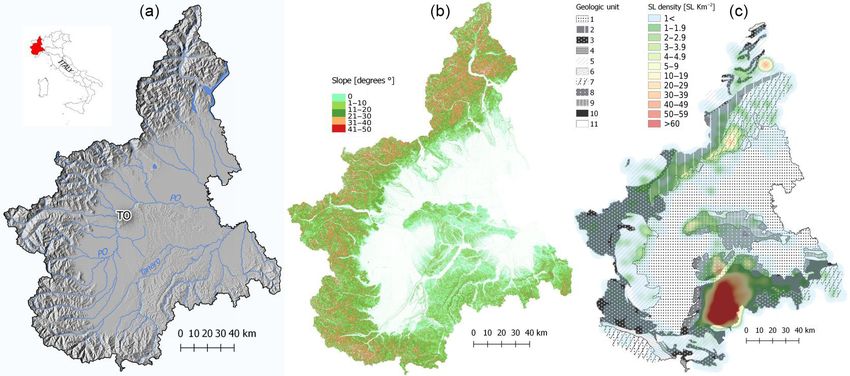
1358                                                G. Devoli et al.: Comparison of landslide forecasting services in Italy and Norway

Table 1. Characteristics of the EWS from ARPA Piemonte and Norway.

   EWS                             Piedmont, Italy                                      Norway
   Operators                       ARPA Piemonte (Regional government)                  NVE (National government)
   Activated                       2008                                                 2013
   Status                          operative (daily)                                    operative (daily)
   Landslide types                 shallow translational slide; channelized debris      shallow translational slide; channelized debris flow;
                                   flow; rotational slide                               debris avalanches; slush flows
   Type of triggering              rainfall and snowmelt                                rainfall and snowmelt
   Thresholds for different        yes                                                  no
   type of landslides
   Rainfall/water input            rainfall from rain gauge and weather radar           water supply (rain + snowmelt) and soil moisture, in-
                                                                                        terpolated from HBV model
   Type of thresholds              ID thresholds for Alpine and Hilly environ-          water supply vs. degree of soil saturation;
                                   ments for shallow slides;                            water supply vs. degree of soil saturation + landslide
                                   radar hourly intensity rainfall thresholds for de-   susceptibility;
                                   bris flows in Alpine catchments;                     water supply vs. degree of soil moisture + soil frost
                                   antecedent precipitation thresholds for transla-
                                   tional/rotational slides in hilly environment
   Methods for threshold           statistical approach                                 statistical approach
   definition                      (Tiranti and Rabuffetti, 2010; Tiranti et al.,       (Boje et al., 2014)
                                   2013, 2014)
   Weather forecast                COSMO I7 NWP model: for the first 3 days             AROME MetCoOp model for the first 3 days as 1 km2
                                   with 6 h resolution;                                 raster maps, with 24 and 3 h resolution;
                                   weather radar QPE and storm-tracking now-            EC model for the following 3 days as raster maps 1 km2
                                   casting                                              resolution
                                                                                        + daily briefing with meteorologist on duty
                                                                                        + visual inspection of radar during summer
   Monitoring instruments          multi-sensor weather gauges (< 400);                 multi-sensor weather gauges (∼ 400);
                                   two weather radars                                   groundwater level (80); water discharge (∼ 350); other
                                                                                        instruments (snow water equivalent; soil water content
                                                                                        and soil temperature)
   Released warning                every day, before 13:00                              every day, before 11:00 and updated before 15:00
   Warning valid                   from 13:00 to 24:00                                  from 07:00 the day of publication to 07:00 of the fol-
                                                                                        lowing day (08:00 to 08:00 daylight
                                                                                        savings time)
   Warning days                    36 h (D0 and D1)                                     first 3 days (D0, D1 and D2)
   Warning zone                    fixed (catchment)                                    variable (county/group of municipalities)
   Number of warning               4                                                    4
   levels
   Warning web page                http://www.arpa.piemonte.gov.it/rischinaturali,      www.varsom.no, last access: 7 May 2018
                                   last access: 7 May 2018
   Broadcast media                 internet                                             internet, CIM (crisis information management)
   Susceptibility map              1 : 100 000 scale (Tiranti and Rabuffetti, 2010);    catchment level (Bell et al., 2014)
                                   Alpine catchments (Tiranti et al., 2014)             1 : 50 000 scale (Fischer et al., 2012)
   Landslide database              > 35 000 landslides and debris flows                 > 57 000 mass movements∗
                                   https://webgis.arpa.piemonte.it/, last access:       www.skredregistrering.no, last access: 7 May 2018
                                   7 May 2018
   Landslide verification          internet, social media, newspapers and field         internet, http://regobs.no, last access: 7 May 2018,
   after events                    observations                                         newspapers and field observation
   Primary references              Tiranti and Rabuffetti (2010); Tiranti et            Colleuille et al. (2017); Piciullo et al. (2017); Krøgli et
                                   al. (2013, 2014, 2016); Stoffel et al. (2014)        al. (2017)
 ∗ landslides + snow avalanches + submarine landslides

Nat. Hazards Earth Syst. Sci., 18, 1351–1372, 2018                                      www.nat-hazards-earth-syst-sci.net/18/1351/2018/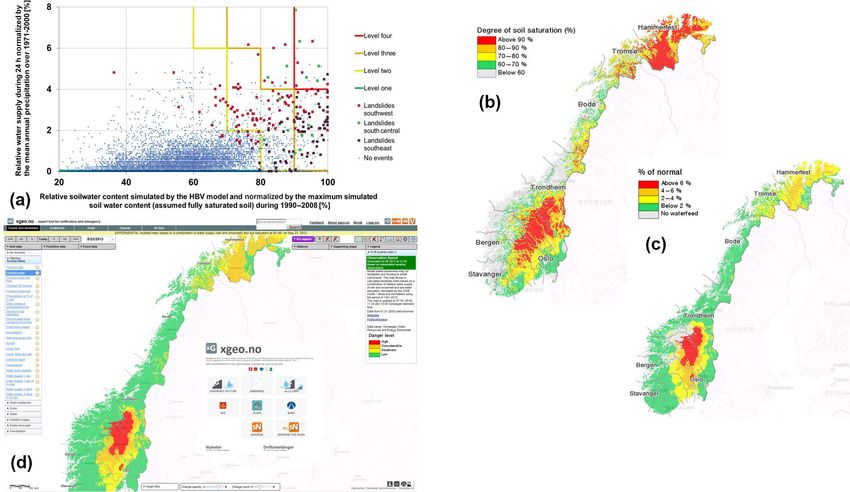
G. Devoli et al.: Comparison of landslide forecasting services in Italy and Norway                                                      1359

Figure 5. Examples of EWSs WebGIS interface. (a) DEFENCE: ellipses show storm cells, lines show storm paths, yellow polygon shows
the catchment affected by debris flow triggering rainfall intensity; (b) SMART: dots represent the rain gauges linked to shallow landslides
triggering thresholds; (c) TRAPS: polygons represent the areas characterized by different probabilities for translational landslide activation
(white = low/null probability; yellow = medium probability; red = high probability); (d) an example of SMART threshold (red dashed line)
representation related to accumulated rainfall (blue area) recorded by rain gauges; (e) an example of TRAPS diagram: blue dots are the
antecedent precipitation values accumulated over previous 60 days, red lines are the monthly triggering threshold value and purple lines are
the monthly predisposing thresholds (thresholds indicating the high probability of early instability; source: ARPA Piemonte).

with a corresponding water balance simulation. From tem-                 torical landslides and water supply (e.g., rain and snowmelt)
perature and precipitation as input variables, the model simu-           and the degree of soil water saturation (Fig. 6a). Both param-
lates forecasted hydro-meteorological variables such as rain-            eters are simulated from HBV model (Fig. 6b and c). The
fall and snowmelt, water supply, degree of soil saturation,              first parameter is the water supplied to the soil from rain and
ground water level compare to normal, soil frost depth, wa-              snowmelt, expressed as percent of yearly normal water sup-
ter feed capacity, etc. In addition to HBV, a second tool is a           ply in the reference period 1981–2010, and is the product of
physically based model, S-Flow developed by NVE, which                   simulated snowmelt and interpolated precipitation. The sec-
simulates water and heat dynamics in a column of layered                 ond parameter is the degree of soil saturation described in
soil covered by vegetation. The model uses also temperature              percent between the present soil water content compared to
and precipitation, but it requires also wind speed, relative air         the maximum soil water content in the same reference period.
humidity and solar radiation as input data.                              The thresholds were derived using tree classification system.
   Unlike other countries, Norway does not use classi-                   Generally, the thresholds indicate increased landslide hazard
cal intensity–duration thresholds. Based on Guzzetti et                  when values of water supply are greater than 6–8 % of the
al. (2008), the threshold used in Norway can be classified as            mean annual precipitation combined with a simulated soil
“other thresholds”, because they are based on analysis of his-           water saturation degree greater than 60 %. Three thresholds

www.nat-hazards-earth-syst-sci.net/18/1351/2018/                                 Nat. Hazards Earth Syst. Sci., 18, 1351–1372, 2018
1360                                       G. Devoli et al.: Comparison of landslide forecasting services in Italy and Norway

Figure 6. Landslide thresholds and WebGIS interface xgeo.no. (a) National landslide thresholds based on simulated degree of soil saturation
and water supply obtained from HBV model; (b) map of simulated degree of soil saturation. The percent describes the relationship between
today’s soil water storage compared to the maximum soil water storage simulated with the HBV model in the reference period 1981–2010;
(c) map of simulated water supply (rain and snowmelt) the last 24 h as percent of yearly normal water supply in the period 1981–2010, and
is the product of simulated snow melt and interpolated precipitation; (d) the web interface xgeo.no with the Hydmet landslide thresholds
map in the background. The map represents the national landslide thresholds presented in (a) and is obtained by combining the maps in (b)
and (c). The maps in (b)–(d) are examples from 22 May 2013 and extracted from http://xgeo.no.

are used to separate conditions similar to warning levels of            4   The Vb cyclones
green, yellow, amber and red (Fig. 6a). Since the thresholds
were derived from tree classification technique, the thresh-
old consists of several linear equations generating thresholds          Floods and landslides are important secondary effects of
with a ladder shape. Thresholds are unique for all landslide            high-impact weather events, like tropical and extra-tropical
processes. They were derived initially for the entire country           cyclones, as they are accompanied by extremely strong winds
from a few storms events in southern Norway, but recently               and heavy precipitation. Central Europe and the northern
thresholds have been defined to include landslide events from           Alpine region are exposed to high-impact events associated
other regions (Boje, 2017). The spatial distribution of the             with the Vb cyclones (Messmer et al., 2015). This type of cy-
thresholds is visualized as raster data (with 1 km2 resolu-             clone was mentioned by Köppen (1881) and later, defined by
tion) at http://xgeo.no (Fig. 6d). In order to consider issu-           Van Bebber (1882, 1891) who proposed a cyclone classifica-
ing a warning the threshold map should display a regional               tion system based on the main storm circulation trajectories
impact over a county or over a group of municipalities. Re-             in Europe (Messmer et al., 2015; Roald, 2008), describing
cently the thresholds have been combined with landslide sus-            one of them as Vb. In later classifications like GWL/SVG
ceptibility maps at catchment levels and better thresholds are          proposed by James (2007), this synoptic weather regime is
available that help to reduce the warning area. Expert knowl-           known as 11 TM “Tief Mitteleuropa = Low (Cut-Off) over
edge is fundamental to the daily landslide hazard assessment,           Central Europe”, while in the GWT classification it is known
and, to decide the final assessment and extension of warning            as “TME Central European low”.
levels. An organization flow chart is presented in Piciullo et             The origin of Vb cyclones is the Bay of Biscay, the
al. (2017).                                                             Balearic Sea or the Ligurian Sea, where moisture uptake oc-
                                                                        curs. The cyclone moves eastward over the southwestern part
                                                                        of France and over the Mediterranean Sea, where it refills

Nat. Hazards Earth Syst. Sci., 18, 1351–1372, 2018                              www.nat-hazards-earth-syst-sci.net/18/1351/2018/
G. Devoli et al.: Comparison of landslide forecasting services in Italy and Norway 1361
with moisture and energy. Then, Vb cyclones move across
northern Italy and the Adriatic Sea before they turn eastward
towards the Black Sea and later northward across eastern Eu-
rope, and finally towards Scandinavia (Fig. 7).
The Vb cyclones are characterized by very warm and hu-
mid air masses from the central Atlantic and Mediterranean,
with cold air masses linked to depressions in the northern
part of the Atlantic forming a quasi-stationary front with ex-
tremely heavy rainfall (Fig. 7). The synoptic configuration
is linked to blocking anticyclones in the North Atlantic and
over Finland or the Kola Peninsula. This weather circulation
occurs typically on July or August, but in recent years it has
been observed in late spring (April, May and June).
Most of studies on Vb cyclones presented case studies of
floods induced by Vb cyclones, focusing on the source of
moisture, while only few studies focused on analyzing the
decrease or increase of number of cyclones. A description
of the basic climatology of this weather type is provided in
Messmer et al. (2015), given insight into the Vb cyclones’
variability and investigating their physical mechanisms. Figure 7. Southern type of weather: Vb trajectory. “H” is high pres-
These cyclones transport large amounts of atmospheric sure and “L” is low pressure. Red lines indicate warm and humid air,
moisture to central Europe and northern side of the Alps, while blue lines represent cold air masses (source: NVE).
thus triggering extreme precipitation events (Messmer et al.,
2015). The potential of transporting extreme precipitation to
central Europe is especially high if these cut-off low sys- ginning of June 2013. In Piedmont major impacts were ob-
tems are positioned in the northern or eastern parts of the served in the first half of this period, while in Norway they
Alps (Awan and Formayer, 2016). There is agreement in the occurred from 15 May to 2 June 2013.
literature on the large-scale dynamics of Vb events, which
indeed seem to determine whether a Vb cyclone delivers 5.1 Antecedent conditions
high precipitation or not (Messmer et al., 2015). Even if
they are rare events, 2.3 per year (Messmer et al., 2015), Winter 2012/2013 was relatively cold (−0.23 ◦ C respect the
the Vb cyclones are highly relevant for Europe because of 1977–2001 average temperature) and dry (−52 % respect
their potential to produce extensive precipitation and subse- 1977–2001 average precipitation) in both countries with tem-
quent floods, particularly during the warm season, and of- perature lower than normal. It was still cold in Piedmont from
ten in Austria, Switzerland, Germany, Poland and the Czech March to May, but wetter than in Norway. In March, rainfall
Republic. The Vb cyclones are well known among hydrolo- in Piedmont was +30 % above normal and heavy precipi-
gists and meteorologists to have caused most of the largest tation occurred at the end of April. Between 27 April and
floods in central Europe, including on the Elbe, Danube, 1 May 2013 several rain gauges in northwestern Piedmont
Rhine catchments and Alpine areas, for example: 1000-year recorded more than 250 mm in 5 days (against 175 mm aver-
flood in 1342 on the Elbe, Danube and Main; the Oder flood age April precipitation).
in July/August 1997; flooding on the Elbe and Danube in In southeastern Norway, the period January–April 2013
August 2002; flooding in Austria and Switzerland in August was colder and drier than normal and characterized by cool
2005. Less mentioned in international literature is the fact air from the north (Roald, 2015). The average temperature
that this weather is responsible for extensive flooding events was 2–3◦ below the normal in this area especially in the inte-
and triggering landslides, including in the southern sector of rior northwestern part close to the mountains. Spring arrived
the Alps and in Norway. Roald (2008) documented many late. The period January–April was characterized by precip-
flood events caused by Vb cyclones in southeastern Norway, itation deficits in many areas. The precipitation was 90 % of
including in July 1789, in 1860 and more recently in June normal over the entire country; however, southeastern Nor-
2011, among others. way received only 25 to 50 % of normal precipitation. The
snow depth was lower than normal and thus ground frost
deeper than normal. In May, the warm air from the south
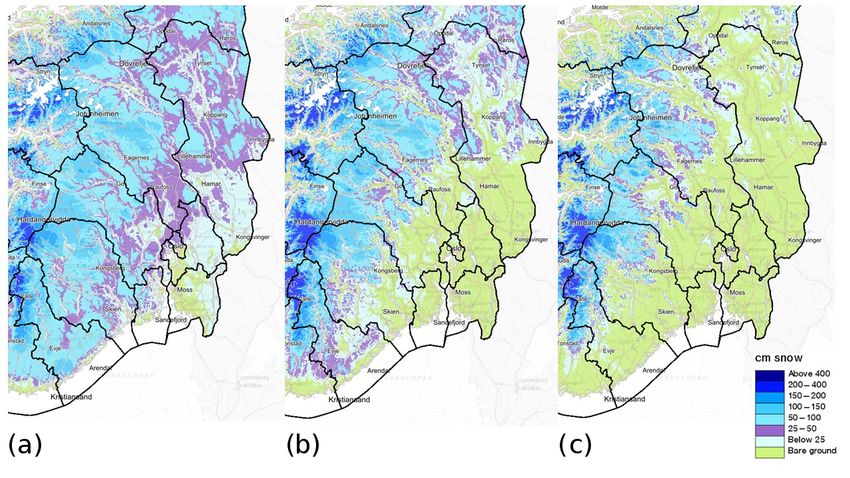
5 Meteorological conditions in late spring 2013 and southeast initiated snowmelt in the mountains. Figure 8
shows the snow distribution in Norway during April–May
The meteorological pattern that affected Europe in late spring 2013. In the middle of May, there was still snow cover above
2013 started at the end of April 2013 and lasted until the be- 700 m a.s.l. and more snow depth than normal in the west-
www.nat-hazards-earth-syst-sci.net/18/1351/2018/ Nat. Hazards Earth Syst. Sci., 18, 1351–1372, 20181362 G. Devoli et al.: Comparison of landslide forecasting services in Italy and Norway
Figure 8. Snow distribution (a) middle of April, (b) end of April and (c) middle of May, Norway (source: http://xgeo.no).
Figure 9. ECMWF mean sea level pressure analysis over Europe on 16 May 2013 at 00:00 UTC (source: ARPA Piemonte).
ern part of the area. In May precipitation was +200–500 % the Mediterranean Sea. In the initial phase, the Vb cyclone
above average, especially in the western parts of the area. was responsible for strong winds (up to 120 km h−1 ) that pro-
duced sandstorms in Malta and southern Italy (particularly in
5.2 Meteorological conditions during the period Sicily and Calabria) on 15 and 16 May 2013 with some im-
analyzed pacts on the population (Meteoweb, 2013). When the system
moved north, it was responsible for producing intense rainfall
The Vb atmospheric pattern influenced weather in Europe, in proximity of the western Alps. The Vb system continued
and in particular in Italy and Norway, for a long period to northern Europe bringing warm air at higher latitudes and
over spring 2013, from the end of April until the begin- rainfall when it reached in southern Norway.
ning of June 2013. In retrospect, it could be observed that
the Vb weather regime was relatively easy to follow across
Nat. Hazards Earth Syst. Sci., 18, 1351–1372, 2018 www.nat-hazards-earth-syst-sci.net/18/1351/2018/G. Devoli et al.: Comparison of landslide forecasting services in Italy and Norway 1363
5.2.1 Piedmont
From 15 to 19 May 2013, an intense cold front affected Pied-
mont, causing abundant precipitation, a general increase of
rivers discharge and vast areas of Piedmont to be affected by
floods and landslides.
On 15 May 2013, a trough over western Europe conveyed
warm and wet flows from south towards Piedmont, causing
widespread precipitation that intensified especially in north-
ern Piedmont and on the border areas with Liguria. Figure 9
shows the mean sea level pressure analysis by the global nu-
merical weather prediction model operated by the European
Centre for Medium-range Weather Forecasts (ECMWF) on
16 May 2013, 00:00 UTC. The main low-pressure system is
centered over the North Sea, while a secondary one is near
North Africa coasts: isobars determine intense southern hu-
mid air flow from Mediterranean Sea towards Scandinavian
Peninsula.
Widespread moderate, but locally strong, precipitation
affected Piedmont at night. In the Po Valley on average
30–40 mm of rainfall with a maximum of 45.6 mm over
24 h were recorded. About 20–25 cm of fresh snow were
recorded in the Alps above 2000 m a.s.l. On 16 May 2013,
the low-pressure area, responsible for severe weather, grad-
ually moved towards Biscay Bay, continuing to convey wet
and unstable air over Piedmont. However, an increase of at-
mospheric pressure in Ligurian Gulf caused an attenuation
of meridional flows and a general attenuation of precipita-
tion. In the late evening, the cold front associated with the
low pressure crossed Piedmont, causing instability and con-
vective rainfall, more intense over the northwestern foothills.
On the afternoon of 17 May, the cold sector that had af-
fected Piedmont over the previous 48 h passed, leading to a
general attenuation in rainfall. However, atmospheric post-
frontal instability caused sporadic thunderstorms, particu-
larly on the western foothills, where the interactions between
southern flows and Alpine foothills caused strong connec-
Figure 10. Accumulated rainfall from 15 to 19 May 2013 (source:
tion with abundant hail: hourly precipitation rates reached
ARPA Piemonte). An example of rainfall distribution during the
up to 40 mm. Discharges of minor hydrological networks in- event, the histogram recorded by Camparient rain gauge (red dot
creased as result of severe thunderstorms. On 18 May 2013, in the accumulated rainfall map), is shown.
the occluded front passed Piedmont from west to east. The
wet airflow from the south remained intense, resulting in
convergence close to the northwestern foothills, with further 5.2.2 Norway
intensification of rainfall. On the morning of 19 May, the
sea level pressure increased, leading to precipitation exhaus- It is well known in Norway that Vb cyclones can produce
tion, except for northern Piedmont where rainfall terminated the largest floods during spring (Roald, 2008). Therefore, ev-
over midday. The rainfall between 18 and 19 May resulted ery year the flood forecasting service at NVE, pays attention
in significant increases in rivers discharge both in northern to these weather conditions in southern Europe. The arrival
and southern basins. Dangerously high levels were reported of the Vb cyclone in May 2013 was forecasted some weeks
across secondary hydrological networks, particularly in the in advance by noting the possible arrival of a warm weather
basins near Turin. Over the entire period, more than 300 mm system from south (as it was indicated in a “situation report”
fell in northwestern areas with peaks of 350 mm in 96 h published on 3 May). The Vb cyclone brought warm winds
(Fig. 10). The return period for 3–6 h rainfall accumulation with high temperatures that caused intense snowmelt over a
were about 20 years. Finally, several catchments recorded large area. The temperature starts to increase around 5 May
more than 600 mm from 1 March 2013 to mid-May. in the mountain area, starting the snowmelt process. A short
www.nat-hazards-earth-syst-sci.net/18/1351/2018/ Nat. Hazards Earth Syst. Sci., 18, 1351–1372, 20181364 G. Devoli et al.: Comparison of landslide forecasting services in Italy and Norway
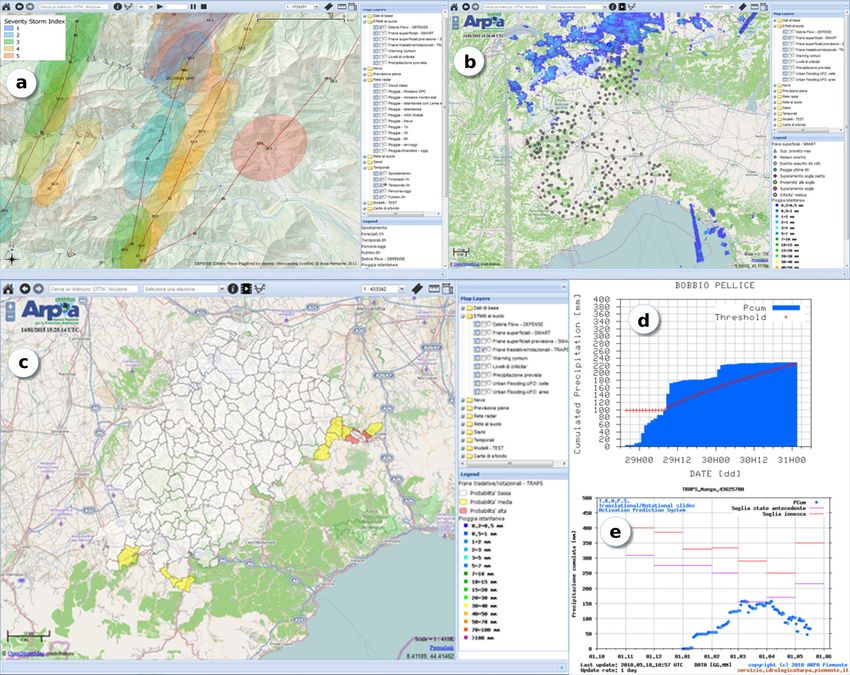
Figure 11. Events of 15–16 and 22 May. (a) Rainfall measurement from 15 and 16 May and landslide events; (b) rainfall measurement from
15 and 16 May and water discharge level; (c) rainfall and temperature distribution in May in the Gudbrandsdalen area (red: rainfall; blue:
new snow; orange line: temperature); (d) rainfall measurement from 22 and 23 May and landslide events; (e) rainfall measurement from
22 and 23 May and water discharge level; (f) water discharge at Etna station during May 2013 (source: http://xgeo.no).
decrease in temperature was observed on 14–15 and 22 May in many of the rivers in the area (Fig. 11e). A flood of 100-
before and during of the two main rainfall episodes. Temper- year return period was observed for the Folla river, while in
atures reached the highest peak on 18 and 19 May, causing Numedalslågen and Skien catchments, a 30-year return pe-
significant snowmelt in the area. Due to the arrival of several riod flood was observed (Roald, 2015). In Drammen river at
warm air fronts, temperatures continued to increase consis- Begna, Etna and Dokka stations, the flood reached the 50-
tently until the end of May. year return period (Fig. 11f). At Gausdal and Gudbrands-
The first rainfall arrived on 15–16 May in the eastern coun- dalen, the rivers’ flooding was estimated to be between a 50-
ties of Telemark and Buskerud (Fig. 11a). At Eggedal station and 100-year return period. The Vb situation persisted from
60 mm of rain was measured in 24 h. In this area, many hy- 15 May to 2 June and also caused intense rainfall and urban
drological stations reach the flood level (Fig. 11b) and in flooding in the capital Oslo on 2 June.
Eggedal the water discharge was the fourth highest since
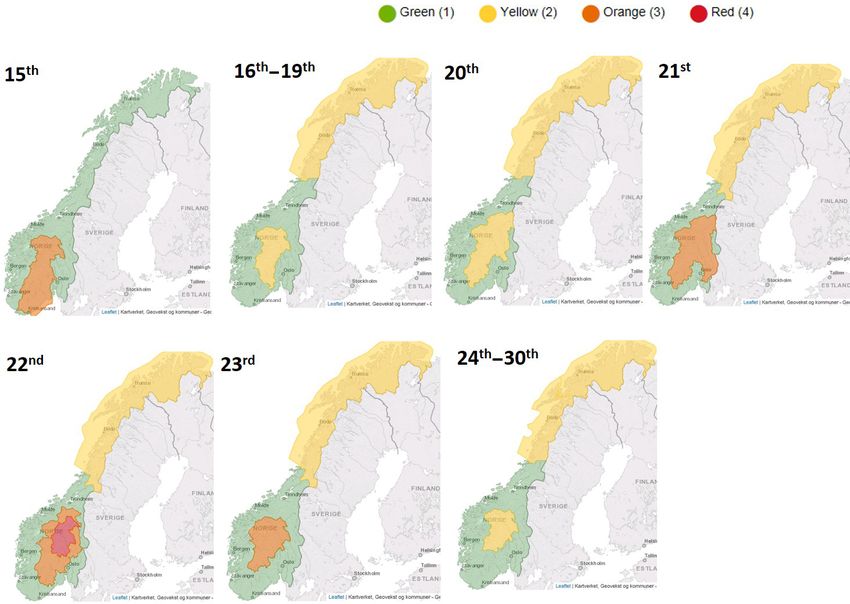
recording started in 1972, resulting in a big flood. 5.3 Warning levels
Precipitation started in the western counties, moving east-
ward. A second and more significant rainfall episode oc- The warning levels indicate landslide hazards and generally
curred on 22 and 23 May affecting mainly the Glomma and which actions should be undertaken to reduce damage. The
Østerdalen catchments in the eastern sector of the region ARPA Piemonte and NVE services use similar levels shown
(Fig. 11d). This initiated a large flood along Glomma River. in the typical traffic lights colors, summarized in Table 2.
In Østerdalen 50–60 mm of rain was measured that day, Even if the numbering of the levels is different, the mean-
while in Gudbrandsdalen values ranged from 50 to 93 mm. ing of the warning is similar. Emergency response authorities
An overview of the rainfall and temperature distribution dur- should be prepared to implement emergency plans, mitiga-
ing May 2013 in the Gudbrandsdalen area is presented in tion measures, evacuations and other contingency responses.
Fig. 11c. The two rainfall episodes, in addition to the incom- Hazard and risk maps are necessary to help local authorities
ing snowmelt, were responsible for the increase of ground- to prioritize the implementation of measures.
water in the region and for producing high water discharge In Norway, warning levels are updated 2 times a day. The
warning messages are sent from 66 h to a few hours ahead.
Nat. Hazards Earth Syst. Sci., 18, 1351–1372, 2018 www.nat-hazards-earth-syst-sci.net/18/1351/2018/You can also read