OVERVIEW: PRECIPITATION CHARACTERISTICS AND SENSITIVITIES TO ENVIRONMENTAL CONDITIONS DURING GOAMAZON2014/5 AND ACRIDICON-CHUVA - ATMOS. CHEM. PHYS
←
→
Page content transcription
If your browser does not render page correctly, please read the page content below
Atmos. Chem. Phys., 18, 6461–6482, 2018
https://doi.org/10.5194/acp-18-6461-2018
© Author(s) 2018. This work is distributed under
the Creative Commons Attribution 4.0 License.

Overview: Precipitation characteristics and sensitivities
to environmental conditions during GoAmazon2014/5
and ACRIDICON-CHUVA
Luiz A. T. Machado1 , Alan J. P. Calheiros1 , Thiago Biscaro1 , Scott Giangrande2 , Maria A. F. Silva Dias3 ,
Micael A. Cecchini3 , Rachel Albrecht3 , Meinrat O. Andreae4,14 , Wagner F. Araujo1 , Paulo Artaxo5 ,
Stephan Borrmann4 , Ramon Braga1 , Casey Burleyson6 , Cristiano W. Eichholz1 , Jiwen Fan6 , Zhe Feng6 ,
Gilberto F. Fisch8 , Michael P. Jensen2 , Scot T. Martin7 , Ulrich Pöschl4 , Christopher Pöhlker4 , Mira L. Pöhlker4 ,
Jean-François Ribaud1 , Daniel Rosenfeld9 , Jaci M. B. Saraiva10 , Courtney Schumacher11 , Ryan Thalman12 ,
David Walter4 , and Manfred Wendisch13
1 National  Institute for Space Research (INPE), Sao José dos Campos, Brazil
2 Brookhaven    National Laboratory, Upton, New York, USA
3 Institute of Astronomy, Geophysics, and Atmospheric Sciences, University of São Paulo, São Paulo, Brazil
4 Max Planck Institute for Chemistry, Mainz, Germany
5 Institute of Physics, University of São Paulo, São Paulo, Brazil
6 Pacific Northwest National Laboratory, Richland, WA, USA
7 Harvard University, Cambridge, Massachusetts, USA
8 Department of Aerospace Science and Technology, São José dos Campos, Brazil
9 Hebrew University of Jerusalem, Jerusalem, Israel
10 Amazon Protection System (SIPAM), Manaus, Brazil
11 Texas A & M University, College Station, Texas, USA
12 Snow College, Richfield, UT, USA
13 Leipzig Institute for Meteorology, Leipzig University, Leipzig, Germany
14 Scripps Institution of Oceanography, University of California, San Diego, CA 92037, USA

Correspondence: Luiz A. T. Machado (luiz.machado@inpe.br)

Received: 24 October 2017 – Discussion started: 1 November 2017
Revised: 10 April 2018 – Accepted: 17 April 2018 – Published: 7 May 2018

Abstract. This study provides an overview of precipitation          The dry season generally exhibited higher rainfall rates than
processes and their sensitivities to environmental conditions       the wet season and included more intense rainfall periods.
in the Central Amazon Basin near Manaus during the GoA-             However, the cumulative rainfall during the wet season was
mazon2014/5 and ACRIDICON-CHUVA experiments. This                   4 times greater than that during the total dry season rainfall,
study takes advantage of the numerous measurement plat-             as shown in the total rainfall accumulation data. The typi-
forms and instrument systems operating during both cam-             cal size and life cycle of Amazon cloud clusters (observed
paigns to sample cloud structure and environmental condi-           by satellite) and rain cells (observed by radar) were exam-
tions during 2014 and 2015; the rainfall variability among          ined, as were differences in these systems between the sea-
seasons, aerosol loading, land surface type, and topography         sons. Moreover, monthly mean thermodynamic and dynamic
has been carefully characterized using these data. Differ-          variables were analysed using radiosondes to elucidate the
ences between the wet and dry seasons were examined from            differences in rainfall characteristics during the wet and dry
a variety of perspectives. The rainfall rates distribution, total   seasons. The sensitivity of rainfall to atmospheric aerosol
amount of rainfall, and raindrop size distribution (the mass-       loading was discussed with regard to mass-weighted mean
weighted mean diameter) were quantified over both seasons.          diameter and rain rate. This topic was evaluated only dur-

Published by Copernicus Publications on behalf of the European Geosciences Union.
6462       L. A. T. Machado et al.: Overview: Precipitation characteristics and sensitivities to environmental conditions

ing the wet season due to the insignificant statistics of rain-     convection is often organized into squall lines (Cohen et al.,
fall events for different aerosol loading ranges and the low        1995) that frequently occur as large systems originating at
frequency of precipitation events during the dry season. The        the northern coast and are triggered by local sea breeze cir-
impacts of aerosols on cloud droplet diameter varied based          culation (Greco et al., 1994). Some of these squall lines prop-
on droplet size. For the wet season, we observed no depen-          agate to Central Amazonas, dissipating during the night and
dence between land surface type and rain rate. However, dur-        reactivating the next day by diurnal heating.
ing the dry season, urban areas exhibited the largest rain-            Climate controls on Amazon Basin rainfall come from
fall rate tail distribution, and deforested regions exhibited the   El Niño–La Niña episodes, which are defined by tropical
lowest mean rainfall rate. Airplane measurements were taken         Pacific Ocean sea surface temperatures (SSTs) and tropical
to characterize and contrast cloud microphysical properties         Atlantic SSTs (Marengo et al., 2013, 2016). Warm tropical
and processes over forested and deforested regions. Verti-          Atlantic SSTs are associated with drought conditions in the
cal motion was not correlated with cloud droplet sizes, but         Amazon region. During El Niño episodes, most of the Ama-
cloud droplet concentration correlated linearly with vertical       zon Basin experiences below-average rainfall, while during
motion. Clouds over forested areas contained larger droplets        La Niña cases, the basin experiences above-average rainfall.
than clouds over pastures at all altitudes. Finally, the connec-    The convective activity in most of the Amazon Basin is part
tions between topography and rain rate were evaluated, with         of the South American monsoon system (SAMS), which is
higher rainfall rates identified at higher elevations during the    associated with distinct wet and dry seasons (Silva Dias and
dry season.                                                         Carvalho, 2016).
                                                                       Horel et al. (1989) used satellite downward longwave ra-
                                                                    diation to characterize seasonal variations in the Amazon
                                                                    and found that the region experiences typical wet and dry
1     Introduction                                                  seasons each year, with two transition periods in between
                                                                    them. Machado et al. (2004) defined the driest month and
1.1    The Amazon Forest climate                                    the duration of the dry season regionally within the Ama-
                                                                    zon Basin. The dry season varies from only 1 month in the
The Amazon Forest spans more than 3000 km in the east–              north-west to 3–4 months in south-eastern Amazonas. For
west direction and approximately 2000 km from north to              the Central Amazonas region, July, August, and September
south. It crosses the Equator but is primarily located in the       are typically the driest months. Convection in Amazonas is
Southern Hemisphere and encompasses both equatorial and             more intense during the dry to wet transition season, dur-
tropical climates. The northern expanse of the Amazon Basin         ing which thunderstorms exhibit more lightning activity (Al-
is influenced by the tropical Atlantic Ocean, while the west-       brecht et al., 2011) and are more sensitive to aerosol loading
ern edge is dominated by the Andes Mountains, which rise            and topography (Gonçalves et al., 2015). The transition from
more than 4000 m a.s.l. (above sea level) in the tropical and       the dry to wet season is influenced by complex interactions
equatorial regions.                                                 between smoke-derived aerosols and deep convective clouds
   Cavalcanti et al. (2009) have provided a detailed picture        (Albrecht et al., 2011). Although the seasonal variability in
of weather and climate in Brazil, particularly in the Amazon.       the average convective available potential energy (CAPE) is
The dominant large-scale features in the Amazon are the lack        small, the tail of the CAPE seasonal distribution (computed
of major temperature gradients and the absence of baroclinic        as the surface parcel) exhibits relatively higher values during
weather systems. However, these features do not mean that           the dry to wet season transition than during the wet season
there is a lack of convective organization. The main synoptic       (Williams et al., 2002). During the dry season, the aerosols
systems that approach the region and alter weather conditions       produced by biomass burning in central South America im-
are (a) the Intertropical Convergence Zone, mostly affecting        pact a larger area, reaching the tropical Pacific, subtropical
the northern half of the Amazon; (b) the easterly waves com-        South America, and the South Atlantic (Andreae et al., 2001;
ing from the tropical Atlantic (Diedhiou et al., 2010); (c) the     Freitas et al., 2005, 2017; Camponogara et al., 2014).
upper tropospheric cyclonic vortices originating on the east-          While the Amazonas region exhibits strong seasonal vari-
ern coast of north-east Brazil and the associated upper-air         ations in atmospheric circulation and related precipitation
Bolivian High (Silva Dias et al., 1983; Kousky and Gan,             patterns, the diurnal cycle is typically the same through-
1981); (d) the South Atlantic Convergence Zone, which af-           out the year. Most of the region has an afternoon peak of
fects the southern half of the Amazon and has a major effect        convective activity; however, selected areas experience quite
on Amazonian convective activity as a whole (Rickenbach et          intense nocturnal systems and more pronounced seasonal-
al., 2002); and (e) the northward propagation of convective         ity (Saraiva et al., 2016). The diurnal convection cycle is
clouds (Siqueira and Machado, 2004) and the remnants of             strongly linked to underlying surface features (Machado et
mid-latitude cold frontal systems that may propagate north-         al., 2004; Silva Dias et al., 2002), including its topogra-
ward, sometimes beyond the Equator, resulting in so-called          phy (Laurent et al., 2002), deforestation (Saad et al., 2010),
“friagem” events (Marengo et al., 1997). Within the basin,          and large rivers (Dos Santos et al., 2014; Silva Dias et al.,

Atmos. Chem. Phys., 18, 6461–6482, 2018                                              www.atmos-chem-phys.net/18/6461/2018/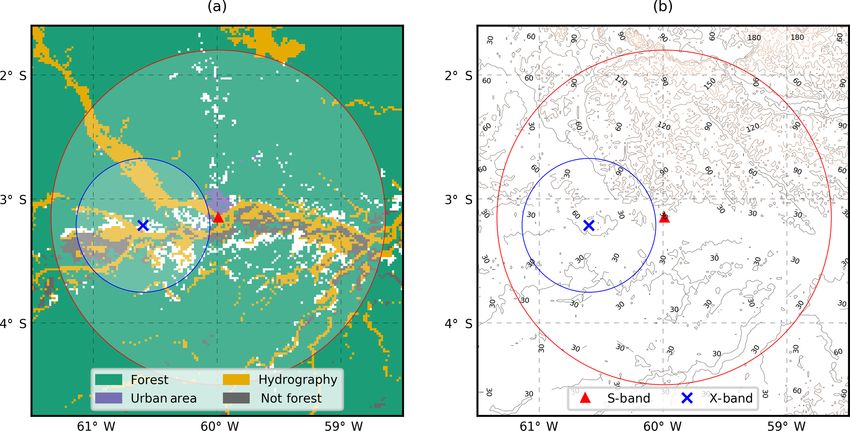
L. A. T. Machado et al.: Overview: Precipitation characteristics and sensitivities to environmental conditions             6463

2004). Additionally, large rivers impact the evolution of rain-   keeps the forest alive, and plays a primary role in controlling
fall through the convergence of river breezes with ambient        global atmospheric circulation and energy distribution.
air flow (Fitzjarrald et al., 2008). Adams et al. (2015) have
shown that one central problem of the climate model related       1.2   Knowledge about cloud process in the Amazon
to the Amazon’s diurnal convection and rainfall variability is          acquired during field campaigns
the transition from shallow to deep convection, which occurs
on a timescale of a few hours.                                    The most recent GoAmazon2014/5 and CHUVA-
   The evolution of the boundary layer in the Amazon re-          ACRIDICON measurement campaigns established a
gion has been studied during intensive field observations con-    comprehensive dataset to elucidate the complex aerosol–
ducted in different subregions in the Amazon Basin, includ-       cloud–precipitation interactions within the Amazon Basin.
ing the Amazon Boundary Layer Experiment (ABLE 2A,                The GoAmazon observations, collected over 2 years,
2B; see Harriss et al., 1988, 1990), the Anglo-Brazilian Ama-     have delivered a wealth of data on aerosol–cloud–
zonian Climate Observation Study (ABRACOS; see Gash               precipitation (ACP) interactions (Martin et al., 2016).
et al., 1996), the Large-Scale Biosphere Atmosphere exper-        During the two intensive operation periods (IOPs) conducted
iment in Amazonia (LBA; see Silva Dias et al., 2002), the         during the wet and dry seasons, additional airplane data
Cloud Processes of the Main Precipitation Systems in Brazil:      were collected by the IARA (Intensive Airborne Research
A Contribution to Cloud-Resolving Modelling and to the            in Amazonas), Martin et al. (2017), and the ACRIDICON
Global Precipitation Measurement (CHUVA; Machado et al.,          campaign (Wendisch et al., 2016). The data collected under
2014) combined with ACRIDICON (Aerosol, Cloud, Precip-            the umbrella of the GoAmazon campaign also include the
itation, and Radiation Interactions and Dynamics of Convec-       CHUVA project (Machado et al., 2014) and several other
tive Cloud Systems; Wendisch et al., 2016), and the Green         initiatives, which have compiled the most complete dataset
Ocean Amazon GoAmazon2014/5 (Martin et al., 2017).                in Amazonas associated with atmospheric chemical and
Fisch et al. (2004) have indicated that the evolution of the      physical interactions. GoAmazon2014/5 data were collected
boundary layer in the Amazon is linked to land cover and soil     in the environs of Manaus city, the capital of Amazonas
moisture, with a deeper mixed layer in the dry season over        State. Manaus is a city of around 2 million people located
deforested areas and a shallower mixed layer over forested        in the middle of Central Amazonas and serves as a natural
areas. During the wet season, there are small differences be-     laboratory from which to explore the urban pollution effects
tween the evolution of the mixed layer over forested and de-      on the Amazonas background environment.
forested regions.                                                    Recent work by Gerken et al. (2015) has shown strong
   During the dry season, the lower atmosphere is polluted by     enhancement of ozone concentrations close to the surface
high aerosol concentrations caused by both biomass burning        during storm downdrafts in the central Amazon and sug-
and prolonged aerosol suspension associated with reduced          gests that storm downdrafts bringing higher ozone concen-
precipitation (Artaxo et al., 2002; Martin et al., 2010). Dur-    trations from middle to higher altitudes play an important
ing the wet season, the atmosphere is mostly clean and con-       role in enhancing ozone concentrations. The same effect was
vective, and the landscape is referred to as the Green Ocean      found by Betts et al. (2002) in the south-west Amazon during
(Roberts et al., 2001; Williams et al., 2002; Andreae et al.,     LBA. Wang et al. (2016) used airplane (G1) data to describe
2004) because the convection there resembles storms over          the mechanism by which aerosol concentrations are main-
blue oceans, where the warm phase in clouds generally pro-        tained in the pristine Amazonian boundary layer. Aerosol
duces rain. Large urban areas, however, introduce perturba-       losses via precipitation scavenging at the surface are replaced
tions into the pristine air (Martin et al., 2016, 2017).          by storm downdraft fluxes that bring high concentrations of
   The complex physico-chemical interactions observed in          nanosized particles from the upper atmosphere during pre-
the Amazon Basin include rainfall formation processes, di-        cipitation events. These nanoparticles combine with the ox-
urnal, seasonal, and inter-annual cycles, the spatial organiza-   idation products of VOCs (volatile organic compounds) to
tion of clouds, the mechanisms controlling cloud condensa-        form CCN at the surface and assist in the formation of clouds.
tion nuclei (CCN), and the interactions between the vegeta-       Measurements by the G1 and by HALO (High Altitude and
tion, atmospheric boundary layer, clouds, and upper tropo-        Long Range Research Aircraft) show a very high concentra-
sphere. These processes are all in perfect sync, resulting in a   tion of nanoparticles in the upper troposphere, with concen-
stable equilibrium climate that produces rainfall equivalent to   trations up to 65 000 particles per cm3 (Andreae et al., 2017).
2.3 m throughout the 6.1 million km2 of the Amazon Basin,            Aerosol particles influence cloud formation. Cecchini et
or the equivalent of an average 27 trillion metric tonnes of      al. (2016) have highlighted the effects of the Manaus aerosol
rainfall each year. However, this amazing, complex mecha-         pollution plume on cloud droplet size distribution during the
nism can be modified by human activities. A recent study          wet season when only a small sensitivity would be expected.
illustrates and quantifies (Fu et al., 2013) how this stable      They describe the significant influence of the Manaus pol-
environment can be disturbed and the point of equilibrium         lution plume in reducing the size and increasing the num-
shifted far from the one that produces abundant fresh water,      ber of cloud droplets as well as the total liquid water con-

www.atmos-chem-phys.net/18/6461/2018/                                              Atmos. Chem. Phys., 18, 6461–6482, 2018
6464      L. A. T. Machado et al.: Overview: Precipitation characteristics and sensitivities to environmental conditions

tent. The ACRIDICON-CHUVA campaign collected in situ              tected associated with wind regimes; in particular, easterlies
data during 14 research flights using the HALO research           and westerlies in the southern Amazon have been associated
aircraft (Wendisch et al., 2016). The high number of flight       with breaks and active phases of the South American mon-
hours inside growing cumulus clouds allowed for a sensi-          soon system (Silva Dias and Carvalho, 2016; Rickenbach
tivity analysis of aerosol concentrations and the thermody-       et al., 2002). In the north-western Amazon, northerlies and
namic effects of such concentrations in the warm phase of         southerlies are associated with more stratiform and convec-
cumulus clouds. Cecchini et al. (2017a) have also demon-          tive systems, respectively (Saraiva et al., 2016).
strated that a 100 % increase in aerosol concentrations led          Other studies discuss the rainfall regime in Amazonas
to an 84 % increase in the concentration of droplets, but the     State. For example, Tanaka et al. (2014) have described the
same relative increase in vertical velocity corresponded only     influence of the river and the city of Manaus in the diurnal cy-
to a 43 % change. Braga et al. (2017) have compared HALO          cle of rainfall using rain gauge data. Dos Santos et al. (2014)
microphysical probe measurements of cloud droplet concen-         used satellite rainfall products to define the features of river
trations with a parameterization based on CCN and updraft         breezes associated with the Negro, Solimões, and Amazon
at the cloud base. Jäkel et al. (2017) have presented a new       rivers. Fitzjarrald et al. (2008) have described the effect of
methodology to retrieve the vertical distribution of the hy-      the Tapajos River on rainfall, and Silva Dias et al. (2004)
drometeor phase using cloud-side reflected solar radiation        have shown how wind structure favours cloud formation on
measurements and have discussed the mixed-phase layer as          the upwind side of the Tapajós River during daytime. Negri
a function of aerosol loading. Giangrande et al. (2016) have      et al. (2000) used passive microwave radiances to construct
presented the statistical behaviour of vertical cloud motions     a 10-year climate related to the Amazonas rainfall patterns.
as a function of season, instability, and convective inhibi-      Saraiva et al. (2016) have described the general statistics re-
tion. Burleyson et al. (2016) have discussed the diurnal cycle    lated to Amazonas rainfall using the meteorological S-band
and spatial variability of deep convection among the differ-      radar operational network and have discussed the diurnal cy-
ent GoAmazon sites. Giangrande et al. (2017) have also pre-       cle as well as the relationship between reflectivity and the
sented an overview of cloud, thermodynamics, and radiation        cloud electrification process.
interactions.                                                        All of these studies have contributed to the establishment
   Preceding GoAmazon2014/5, ABLE-2 and LBA collected             of our basic knowledge about the rainfall statistics and re-
cloud and rainfall data used to understand rainfall vari-         lated processes in Amazonas; they have provided a new per-
ability and its interaction with surface vegetation, topogra-     spective for research in Amazonas and have elucidated sev-
phy, and aerosols in the Amazon. The ABLE-2 project con-          eral aspects of ACP interactions. The studies associated with
sisted of two expeditions: the first in the Amazonian dry         field campaigns covered specific seasons (normally the wet
season (ABLE-2A) during July–August 1985 and the sec-             season) or resulted from sparse rain gauge or indirect mea-
ond in the wet season (ABLE-2B) during April–May 1987             surement data with low spatial and temporal resolutions. In
(Harriss et al., 1988, 1990). Greco et al. (1990) have de-        GoAmazon2014/5, the extensive rainfall dataset collected
scribed the rainfall and kinematics of the central Amazon us-     using the S-, X-, and W-band radars, airplanes, disdrometers
ing GOES (Geostationary Operational Environmental Satel-          and vertical-pointing radar, rain gauges, microwave radiome-
lite) imagery, revealing the importance of tropical squall        ters, ceilometers, and lidar provides a comprehensive view of
lines in the rainfall regime of the Amazon. Some years later,     the main variables and characteristics of precipitation in the
Garstang et al. (1994), Greco et al. (1994), and Cohen et         central Amazon.
al. (1995) provided a detailed description of tropical squall        Giangrande et al. (2017) present an overview of cloud as-
lines in the region. The TRMM-LBA campaign was de-                pects that primarily focuses on the diurnal cycle and its im-
signed to calibrate the TRMM (Tropical Rainfall Measur-           pact on the radiative and thermodynamic effects of clouds.
ing Mission) satellite. The observations were conducted in        This study presents an overview of the rainfall characteristics
southern Amazonas along the arc of deforestation during the       and sensitivities to vegetation, topography, and aerosol par-
wet season. Several studies contributed to our current under-     ticles and evaluates the seasonal variability of these factors.
standing of rainfall variability at different scales. Machado     The main goal is to discuss the sensitivities of the primary
et al. (2002) discussed the complex diurnal cycle interac-        processes controlling rainfall over the central Amazon using
tion at a synoptic scale, while Laurent et al. (2002) examined    a relatively long time series (2014–2015) of data based on
the mesoscale convective system initiation and propagation,       a comprehensive dataset collected during GoAmazon2014/5
and Rickenbach (2004) showed the importance of noctur-            and complemented by aircraft measurements made during
nal clouds in rainfall in south-western Amazonas. Silva Dias      ACRIDICON-CHUVA.
et al. (2002), Petersen and Rutledge (2001), and Cifelli et          Section 2 describes the data and methodology employed in
al. (2002) have all published findings using TRMM-LBA             the study. Section 3 presents the results and discussions of the
data to describe the microphysical properties of the rainfall     seasonal rainfall characteristics and sensitivities to aerosol,
field, cloud processes, and biospheric interactions in this re-   vegetation, and topography, and Sect. 4 summarizes the ma-
gion. In addition, different rainfall features have been de-      jor findings.

Atmos. Chem. Phys., 18, 6461–6482, 2018                                            www.atmos-chem-phys.net/18/6461/2018/
L. A. T. Machado et al.: Overview: Precipitation characteristics and sensitivities to environmental conditions 6465
2 Data and methodology
Several instruments were employed in this study. This sec-
tion describes the instruments and the data processing pro-
cedures. Figures 1 and 2 in the Martin et al. (2016) study
show the GoAmazon site locations and the flight tracks of
the G1 aircraft. Wendisch et al. (2016) show the flight tracks
(Fig. 6) of the HALO aircraft during the ACRIDICON-
CHUVA campaign.
A laser precipitation disdrometer (PARSIVEL; see
Löffler-Mang and Joss, 2000) measures the size and termi-
nal velocity of hydrometeors that pass through the detec-
tion area sampled by a laser beam (54 cm2 ) over a specific
time interval. Two different PARSIVEL disdrometers were
used during the entire campaign: one during the CHUVA
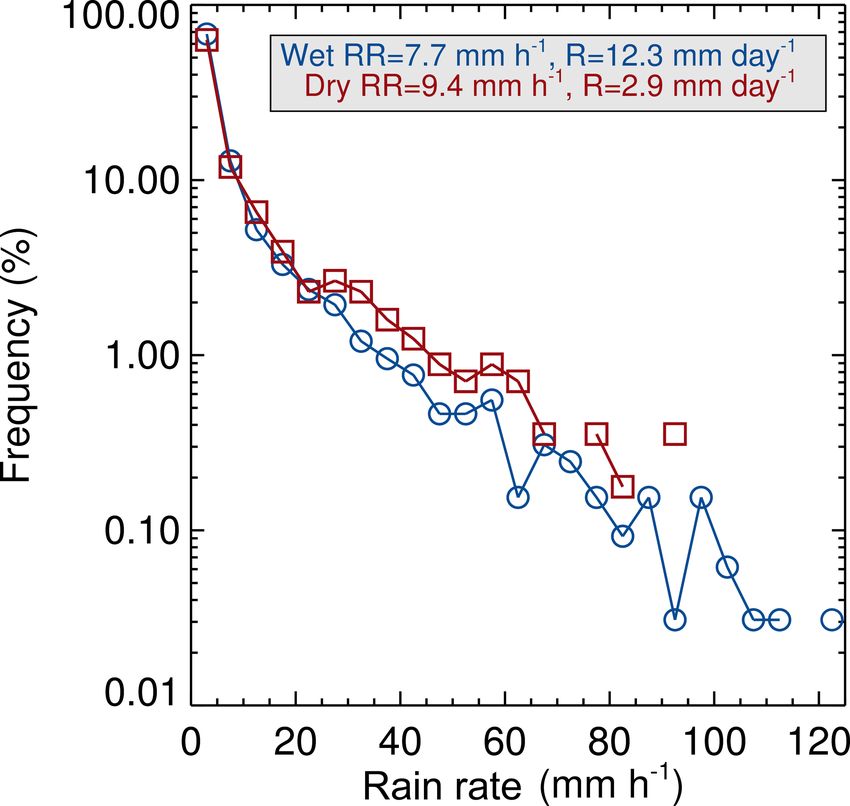
Figure 1. Rainfall rate (RR) histogram for wet and dry seasons
project from January to September 2014 and another, the computed using the T3 disdrometer. Wet and dry seasons occurred
ARM (Atmospheric Radiation Measurement), from Septem- from January to March and August to October, respectively, for the
ber 2014 to October 2015. Raindrops larger than 5 mm were years 2014 and 2015. Rainfall rate (RR) and total rainfall (R) are
eliminated from the dataset to best match the co-located rain given in the legend.
gauge accumulated rainfall, and a complementary filter was
applied as described by Giangrande et al. (2016). The drop
size distribution (DSD) and all respective rainfall rates (RRs, ation correction. The uncorrected raw differential phase shift
in mm h−1 ) and mass-weighted mean diameters (Dm , in mm) had a noisy signal that required filtering and smoothing be-
were obtained in 5 min intervals for periods during which fore its range derivative (KDP) could be calculated. Several
RR ≥ 0.5 mm h−1 , as suggested by Tokay et al. (2013). methods were available for use, such as a moving average,
The Doppler radar S-band dataset consists of retrievals median filters, and linear programming approaches. In this
from the Manaus radar operated by the Amazon Protection study, we used the finite impulse response (FIR) filter based
System (SIPAM). The reflectivity and RR fields were com- on Hubbert and Bringi (1995). Once the filtered PhiDP pro-
puted using the 2.5 km SIPAM Manaus S-band Constant Al- file was obtained, KDP was calculated using a least squares
titude Plan Position Indicator (CAPPI) for each radar volume linear fit. To verify and calibrate the accuracy of the dif-
at 10 min intervals. The corrected radar reflectivity for each ferential reflectivity measurement, a vertical-pointing rotat-
volume was interpolated to a fixed grid on which the rainfall ing scan (also known as “bird-bath” scan) was incorporated
products were generated. Specific procedures were applied into the X-band scan strategy. During light precipitation and
to the dataset to compute RRs from reflectivity, reduce noise, in the absence of strong winds, the vertical and horizontal
and improve data quality. First, RRs were computed using return signals of a vertically oriented beam should be the
a Z–R relationship adjusted to the region using 2014 wet same. Differences between the horizontal and vertical chan-
season impact disdrometer data: Z = 174.8R 1.56 . This is a nels may appear due to poor calibration between the chan-
fixed Z–R relationship for convective and stratiform clouds nels, random effects, beam-filling, or side-lobe clutter con-
and for both the wet and dry seasons. Therefore, the total tamination, among other factors (Gorgucci et al., 1999). Al-
rainfall estimated should be considered a reference by which though standard calibration was performed, careful exami-
to study the differences among the topography and vegeta- nation of the ZDR behaviour before and after the calibration
tion classes and not as an absolute, precise rainfall amount. was necessary. We selected all of the observations with no
The maximum and minimum RRs considered were 160 and radar gates higher than 30 dBZ below 2 km and analysed the
0.5 mm h−1 , respectively. The RR was not computed when overall ZDR values and temporal changes in the mean value.
the radar beam had less than 10 % quality reflectivity val- A persistent, positive ZDR offset (approximately 0.5 dB) was
ues (non-null reflectivity). Finally, a range filter was applied found and applied to the data. After these steps, we applied
to remove pixels closer than 10 km and farther than 135 km an attenuation correction. X-band radars are more prone to
from the radar. signal attenuation due to rain than C- and S-band radars. It is
The Doppler radar X-band dual-polarization dataset was therefore mandatory to correct the signal for attenuation prior
obtained by the mobile Meteor 50DX Selex radar during to any analysis using reflectivity data if such a correction is
the CHUVA project (Schneebeli et al., 2012). The radar possible (Schneebeli et al., 2012). With a dual-polarization
data underwent three main processing steps, including dif- system, one can use the differential phase shift to calculate
ferential phase shift (PhiDP) filtering and specific differential the attenuation due to rain. We applied the ZPHI method
phase (KDP) derivation, differential reflectivity (ZDR) offset (Testud et al., 2000) to the entire dataset for which dual-
correction, and horizontal reflectivity (Zh) and ZDR attenu- polarization moments were available. The corrected Zh and
www.atmos-chem-phys.net/18/6461/2018/ Atmos. Chem. Phys., 18, 6461–6482, 2018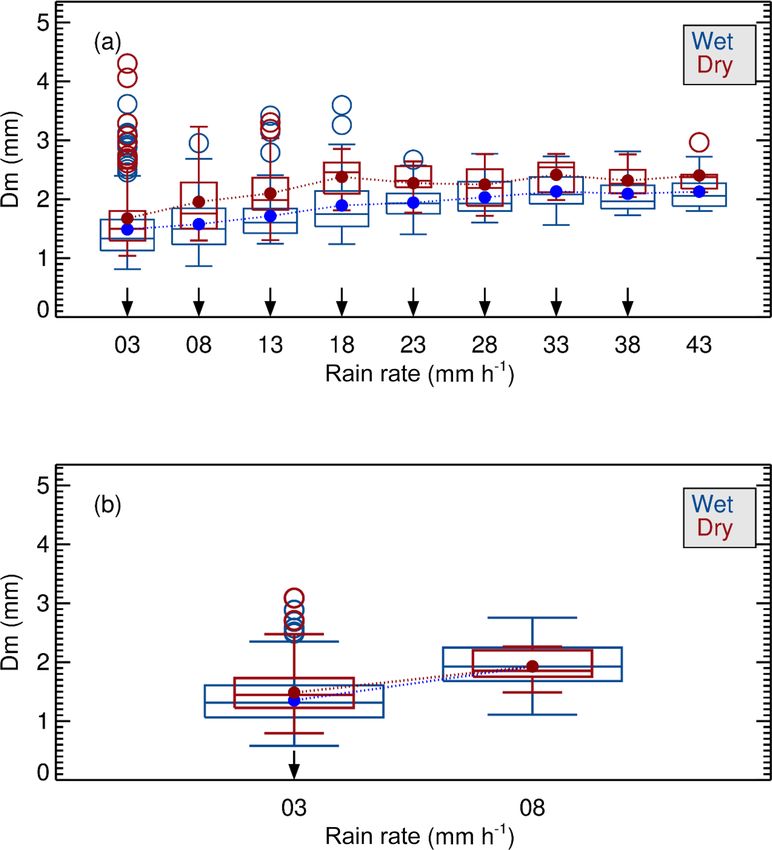
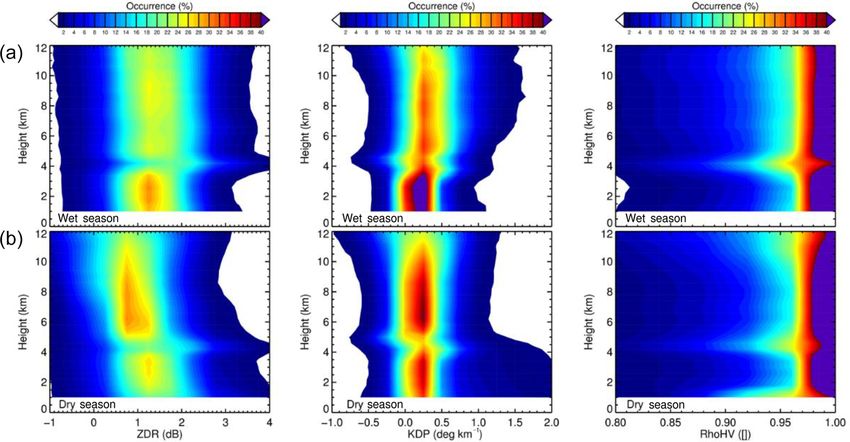
6466       L. A. T. Machado et al.: Overview: Precipitation characteristics and sensitivities to environmental conditions

Figure 2. Box plots illustrating monthly (a) convective available potential energy (CAPE), (b) convective inhibition energy (CINE), (c) pre-
cipitable water vapour (PWV), (d) lifting condensation level (LCL), (e) bulk shear, and (f) mean rainfall rate (RR) and rainfall. Data are
for 2014 and were collected at 00:00, 06:00, 12:00, and 18:00 UTC using the T3 radiosondes. Rainfall was computed using the T3 rain
gauge. Each box represents the 25 to 75 % populations and the line inside the box shows the median value.

ZDR values were then ready to be used as inputs for rainfall            Measurement and Sensor System (BAHAMAS) located at
analyses or hydrometeor classification studies.                         the nose of the aircraft (Wendisch et al., 2016) and calibrated
   The cloud droplet size distributions were derived from the           according to Mallaun et al. (2015). The uncertainty in w is
HALO measurements using a cloud droplet probe (CDP;                     approximately 0.3 m s−1 .
Lance et al., 2010; Molleker et al., 2014; Wendisch and                    Using the disdrometer or the CDP, the mass-weighted
Brenguier, 2013). This instrument measures the droplet size             mean diameter (Dm ) was computed as the ratio between
distribution within the size range of 3 to 50 µm based on               the fourth and third moments (liquid water content) of the
the hydrometeor’s forward-scattering properties. The DSD                DSD (see Bringi et al., 2002, for a detailed description).
is sorted into 15 size bins for each measurement cycle.                 For every 5 min of a continuous rainfall event (defined as
The probe was operated at a 1 Hz frequency. The major                   RR ≥ 0.5 mm h−1 ), the moments were computed using a pa-
sources of uncertainty for the instrument are as follows                rameterization derived by Tokay and Short (1996).
(Weigel et al., 2016): (a) uncertainty in the cross-sectional              A condensation particle counter (CPC, TSI 3010) in
area (0.278 mm2 ± 15 %), (b) the relatively small sample                the aerosol observing system instruments from ARM mea-
volume (cross-sectional area multiplied by aircraft speed),             sured the concentration of individual aerosol particles at
and (c) counting statistics for each size bin. As noted by              10 m a.g.l. at the T3 site (main GoAmazon site at Manaca-
Molleker et al. (2014), the CDP uncertainty is approximately            puru; see Martin et al., 2016, for a detailed description). The
10 %. Braga et al. (2017) performed a comparison between                data were averaged to 5 min intervals covering the period
the CDP and the other HALO cloud probes and concluded                   from January 2014 to March 2015 (Thalman et al., 2017).
that they agree within instrumental uncertainties. The verti-           Background or polluted conditions were defined based on
cal wind component (w) was measured by the Basic HALO                   the specific CPC distribution for each season by the thresh-

Atmos. Chem. Phys., 18, 6461–6482, 2018                                                    www.atmos-chem-phys.net/18/6461/2018/
L. A. T. Machado et al.: Overview: Precipitation characteristics and sensitivities to environmental conditions                6467

old value associated with the 33 and 66 % percentile, respec-       monthly rainfall (2014–2015) was 369 mm for the wet sea-
tively, for the dry and wet seasons. The threshold values and       son (considering a month of 30 days) and 87 mm for the dry
details are presented in the relevant sections below.               season. These numbers show the large difference expected
   The total concentration of individual cloud condensation         between the two seasons. However, the RR (considering only
nuclei particles (NCCN (S)) was measured with a continuous-         when raining) also exhibited seasonal differences. The mean
flow stream-wise thermal gradient CCN counter (model                RR (computed in 5 min intervals) for the wet season was
CCN-200, DMT, Longmont, CO, USA; Rose et al., 2008).                7.7 mm h−1 , while that for the dry season was 9.4 mm h−1 .
The measured aerosol was sampled by the HALO aerosol                Therefore, although approximately 4 times less accumulated
submicrometer inlet (HASI). Particles with a critical super-        rainfall was recorded during the dry season than the wet sea-
saturation (S = 0.52 ± 0.05 %) were activated and formed            son, the average rainfall event during the dry season pro-
water droplets. Water droplets with a diameter ≥ 1 µm were          duced a greater amount of rain. Figure 1 reveals this feature:
detected by an optical particle counter. Details about the mea-     the relative rainfall rate distribution for the wet season shows
surement mode can be found in Andreae et al. (2017). The            a higher relative frequency for RR < 20 mm h−1 than that of
error in supersaturation resulted from the calibration uncer-       the dry season. On the other hand, the dry season shows a
tainty, as described by Pöhlker et al. (2016); it is estimated to   higher relative frequency for RR > 20 mm h−1 . There was
be in the range of 10 %.                                            only one event during the wet season in which a record RR of
   This study considers the wet and dry seasons as the months       approximately 100 mm h−1 was recorded within a few min-
of January to March and August to October, respectively.            utes. The relative intensity of dry season rainfall events is
Some instruments operated only during the two GoAma-                more pronounced than that of events during the wet season.
zon2014/5 IOPs: IOP1 during the wet season and IOP2 dur-            This distinctive feature has important consequences for the
ing the dry season. IOP1 corresponds to February to March           microphysical and macrophysical structures of clouds. The
and IOP2 to 15 September to 15 October 2014. The S-band             main reason for this difference is associated with instabil-
radar data are available for both years (2014 and 2015), while      ity and cloud cover. Figure 2 presents monthly box plots
the X-band operated only in the 2014 IOPs.                          for the thermodynamics variables, with the lower (Q1 ) and
   Thermodynamic parameters such as CAPE, convective in-            upper (Q3 ) bounds representing the 25 and 75 percentiles.
hibition energy (CINE), precipitable water vapour (PWV),            The whiskers are defined by Q1 − 1.5 · IQR (lower) and
lifting condensation level (LCL), and bulk shear were com-          Q1 + 1.5 · IQR (upper); IQR is the interquartile range (Q3 –
puted using the T3 radiosondes at 00:00, 06:00, 12:00, and          Q1 ).
18:00 UTC for 2014. The thermodynamic parameters were                  Figure 2a shows the CAPE distribution for the wet and
computed using temperature and humidity at the surface.             dry seasons in 2014. The dry season has a larger CAPE than
Bulk shear is defined as the difference between the average         the wet season, and the frequency with which the CAPE ex-
surface 6 km wind velocity and the surface 500 m wind ve-           ceeds 2000 J kg−1 is higher during the dry season. The wet
locity.                                                             season has typical monsoonal rainfall with widespread mod-
                                                                    erate rain in contrast to the more isolated and intense rainfall
                                                                    events that occur during the dry season. The Zhuang et al.
3     Results and discussion                                        (2017) study of the shallow to deep convection transition in
                                                                    Amazonas found similar results.
This section first discusses the rainfall characteristics and          This characteristic of rainfall events in which a higher RR
variability by comparing the wet and dry seasons to estab-          occurs during dry season rainfall events is explained by the
lish the primary differences between seasons. Section 3.2           seasonal differences in the thermodynamic parameters. Fig-
discusses the sensitivity analyses relative to aerosols, vege-      ure 2 highlights some of these important differences. The dry
tation, and topography.                                             season has a larger CAPE, higher CINE, less available water
                                                                    vapour, a higher cloud base, and higher shear than the wet
3.1     Rainfall seasonal variability
                                                                    season. The CAPE increases from March to September, and
Seasonal variability was analysed from different perspec-           the largest tail distributions occur at the end of the year when
tives, including general patterns, regional differences, satel-     humidity increases and cloud base decreases. During the dry
lite (clouds) and radar (rainfall) observation characteristics,     season, only regions with strong forcing can produce con-
DSD, rainfall vertical profile, and hydrometeor populations.        vective clouds that use the higher CAPE and shear available
                                                                    to produce organized convection. Gonçalves et al. (2015)
3.1.1    General precipitation and thermodynamic                    show that increased RRs (radar reflectivity values larger than
         patterns                                                   35 dBZ) during the dry season mainly occur over higher el-
                                                                    evations in Amazonas (Sect. 3.2.1). The higher CINE and
Amazonas has a distinct seasonal variability with distinct wet      smaller amount of water vapour reduces the occurrence of
and dry seasons. The length and start date of the wet season        convection, but when convection is able to develop, it has all
depends on the location within the Amazon Basin. The mean           the ingredients to be deeper. Machado et al. (2004) explain

www.atmos-chem-phys.net/18/6461/2018/                                                Atmos. Chem. Phys., 18, 6461–6482, 2018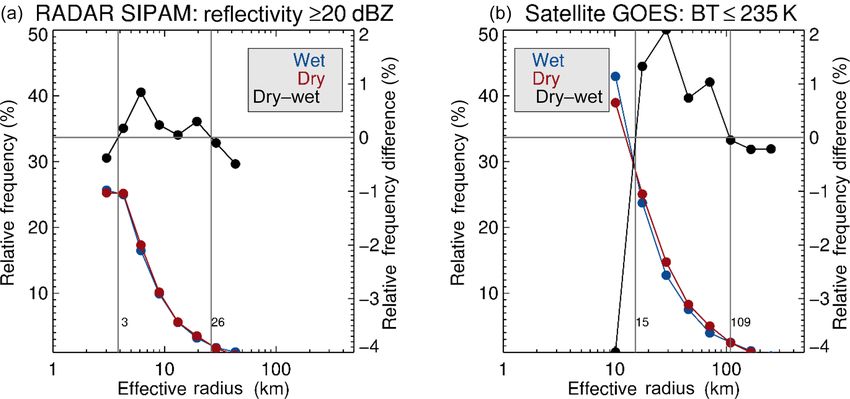
6468       L. A. T. Machado et al.: Overview: Precipitation characteristics and sensitivities to environmental conditions

Figure 3. Rain cell (a, based on the SIPAM S-band radar) and cloud cluster (b, based on GOES-13 IR brightness temperature; BT ) size
distributions between wet and dry seasons and the difference between dry and wet season distributions.

that the more intense convective clouds during the dry to wet       cells and cloud clusters than the dry season. The dry season
season transition may result from less competition of surface       produces more rain cells in the range of a 10 km radius and
moisture convergence to feed cumulonimbus clouds because            cloud clusters of an approximately 40 km radius. The ratio
a smaller number of rain cells exist. Figure 2f presents the        between the cloud cluster and rain cell average radii during
RR statistics for 2014 and the monthly rainfall measured by         the wet season is much greater because of the larger strat-
rain gauge in T3.                                                   iform cloud decks typical of a monsoon cloud regime. The
                                                                    thermodynamics of the dry season environment discussed in
3.1.2   Size distribution of cloud clusters and rain cells          the preceding section favour the organization of more com-
                                                                    pact and active convection with more intense rainfall events
Cloud clusters and rain cell data were derived from GOES-13         but accumulated rainfall amounts that are 4 times smaller.
satellite images and S-band radar using the ForTraCC (Fore-
casting and Tracking Cloud Clusters; see Vila et al., 2008) al-     3.1.3   Mass-weighted mean rainfall diameter for the
gorithm. A cloud cluster is defined by connected ensembles                  dry and wet seasons
of pixels with brightness temperatures (BT ) for the 10.5 µm
channel that are colder than 235 K, as defined by Machado           Variations in cloud processes between the two Amazonian
et al. (1998). A rain cell is defined as a connected ensemble       seasons were evaluated in this study in order to determine
of pixels in the radar 2.5 km CAPPI with reflectivity larger        whether important microphysical differences between rain-
than 20 dBZ. Quite often, rain cells, which are embedded in         drops during the wet and dry seasons exist or whether only
cloud clusters, are observed when clouds start to form rain-        RR and rainfall frequency vary between seasons. These fea-
drops. The average cloud cluster size and lifespan are a 75 km      tures were investigated through the deployment of disdrom-
effective radius (hereafter called radius) and 1.5 h, respec-       eters and a dual-polarimetric radar. This study focuses on
tively, during the wet and dry seasons in the Amazon. The           rainfall and raindrops; however, seasonal differences in cloud
typical rain cell has a 7.5 km radius and a 0.6 h lifespan. On      droplet size distributions may warrant attention as well.
average, cloud clusters are 10 times larger and have lifespans         For instance, the effect of aerosol concentrations on cloud
of approximately 3 times that of their associated rain cells.       droplets in shallow convective clouds, where aerosols gen-
These are average characteristics; cloud clusters come in a         erally reduce the size and increase the concentration of a
wide range of sizes. Cloud clusters can exceed 300 km in ra-        given liquid water content, is well known (Cecchini et al.,
dius and have a lifespan longer than 24 h, while rain cells         2016, among several other studies). However, if a polluted
can grow to up to approximately 60 km in radius and last            cloud transitions from shallow to deep convection, aerosols
for a couple of hours. Figure 3 shows the dry and wet sea-          can invigorate clouds (Rosenfeld, 2008; Koren et al., 2012;
son cloud clusters and rain cell size distributions identified in   Gonçalves et al., 2015). Giangrande et al. (2017) present the
this study, as well as the differences between them. The ba-        G1 airplane cloud particle distribution measurements taken
sic size distribution does not vary substantially between the       during GoAmazon2014/5 and show the predominance of
two seasons because cloud cluster size distribution follows an      larger cloud droplets in warm clouds during the wet season.
exponential distribution, as shown by Machado et al. (1992);        The in situ cloud droplet data were collected for a shallow
however, certain distinctions can be noted if the difference        cloud population. The result is very different when seasonal
is computed. The wet season has more small and large rain           data collected using disdrometers that measure raindrops at

Atmos. Chem. Phys., 18, 6461–6482, 2018                                               www.atmos-chem-phys.net/18/6461/2018/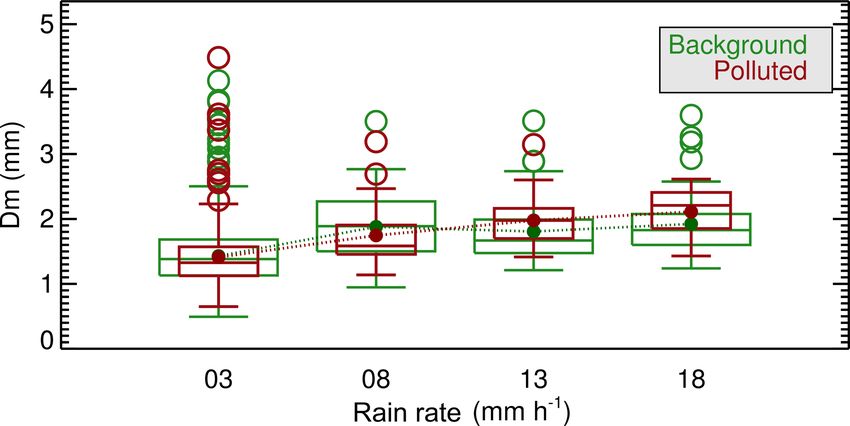
L. A. T. Machado et al.: Overview: Precipitation characteristics and sensitivities to environmental conditions                    6469

least 100 times larger (measured as mass-weighted mean di-
ameter; Dm ) are compared. Given that raindrop diameter de-
pends on RR, which varies between the two seasons, dry and
wet season Dm values were compared as a function of RR in
5 mm h−1 intervals. Different frequencies of convective and
stratiform clouds during the wet and dry seasons also merit
evaluation. As discussed by Giangrande et al. (2017), strati-
form clouds occur more often in the wet season than the dry
season; hence, Dm should be evaluated separately for con-
vective and stratiform clouds. The cloud classification em-
ployed in this study was performed using the radar wind pro-
filer (RWP) and ancillary data as described by Giangrande et
al. (2017) from March 2014 to December 2015. Clouds were
classified based on the predominant cloud type in the warm
cloud layer. Convective clouds include strong and weak con-
vection, while stratiform clouds include those with and with-
out a well-defined bright band.
   Figure 4a and b show the Dm values for the wet and dry
seasons as functions of the RR for convective and strati-
form clouds. The arrows on the x axis mark distributions
for which the averages vary given a statistical significance
of 95 %. For convective clouds, the mass-weighted mean
diameter is larger during the dry season for a given RR.
This result suggests that the different cloud processes gen-      Figure 4. Mass-weighted mean raindrop diameter (Dm ) as a func-
                                                                  tion of the rainfall rate (RR) for wet and dry seasons for (a) convec-
erate larger rainfall drops. The differences in shallow clouds
                                                                  tive and (b) stratiform rain events. The arrows on the x axis indicate
during the dry season may be due to the reduced humid-            variations in the averages based on the Student’s t test (95 % confi-
ity, as shown in Fig. 2c, which can reduce supersaturation        dence). The box represents the 25 to 75 % populations and the line
and increase droplet evaporation via entrainment. However,        inside the box shows the median value; the circles are the outliers.
if a cloud evolves into the deep convective stage, the higher
cloud base, shear, and CAPE induce stronger vertical motion
and mesoscale organization, generating higher quantities of
ice (shown in the next section) and forming larger raindrops      lation coefficient for the consistency of the H and V returned
through the melting of large ice particles such as snow and       power and phase of each pulse for both the wet and dry sea-
graupel. For stratiform clouds (Fig. 4b), the difference be-      sons.
tween the two seasons is much smaller and significant only           Figure 5 shows the reflectivity CFAD for the wet and
for very low RRs.                                                 dry seasons. The typical stratiform and convective patterns
                                                                  for the wet and dry seasons are clearly visible. For the wet
3.1.4   Cloud vertical profiles for the dry and wet seasons       season, the bright band is very clear and has a pronounced
                                                                  peak at approximately 4 km, which corresponds to the layer
The results presented above discuss rainfall at the surface       in which ice melts and reflectivity increases. Moreover, the
level. To better understand the cloud processes associated        levels above the melting layer have less intense reflectivity,
with the dry and wet seasons we must evaluate the hy-             demonstrating the less intense convective process that occurs
drometeor vertical profiles of precipitating clouds. An X-        in the majority of cases during the wet season. For the dry
band dual-polarization radar was installed at the T3 site and     season, the typical convective profile with a higher reflectiv-
operated during the GoAmazon2014/5 IOPs in February–              ity in the lower levels corroborates the higher RRs observed
March and September–October 2014. To account for poten-           during this season. In addition, the mixed and glaciated lay-
tial wet radome attenuation effects and obtain useful dual-       ers exhibit more frequent high reflectivity values, indicating
polarization measurements with sufficient vertical coverage,      the presence of large ice hydrometeors.
the data analysed included only cases without rain over the          Figure 6 shows the CFAD for the dual-polarization pa-
radar and collected within the 10 and 60 km radius range. As      rameters, ZDR, KDP, and co-polar correlation coefficient.
described in the methodology section, the volume scan was         The hydrometeor response to the transmitted signal depends
processed with attenuation correction and a ZDR offset to         on several factors that may alter certain characteristics of
build contoured frequency by altitude diagrams (CFAD) of          the measured signal, such as hydrometeor orientation by the
reflectivity (Z), specific differential phase (KDP), differen-    electrification field (see Mattos et al., 2017, for a detailed
tial reflectivity (ZDR), and the horizontal and vertical corre-   discussion), ice density, and crystal shape. Of course, there

www.atmos-chem-phys.net/18/6461/2018/                                               Atmos. Chem. Phys., 18, 6461–6482, 2018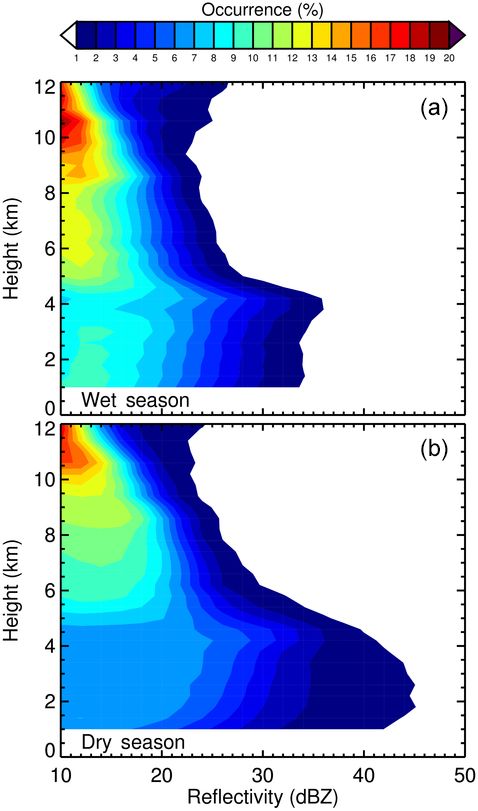
6470        L. A. T. Machado et al.: Overview: Precipitation characteristics and sensitivities to environmental conditions

                                                                         environment to produce ice. The dry season exhibits higher
                                                                         average correlations at approximately 8 km, demonstrating a
                                                                         deeper and unmixed water layer at these heights. This likely
                                                                         indicates that clouds forming during the wet season have a
                                                                         smaller mixed phase than clouds forming during the dry sea-
                                                                         son and under poor air quality conditions.

                                                                         3.2     Rainfall sensitives to aerosols, topography, and
                                                                                 vegetation

                                                                         This section presents rainfall sensitivities to different surface
                                                                         types, topography, and aerosol concentrations. Ancillary data
                                                                         describing vegetation type, topography, and aerosol concen-
                                                                         trations, as well as measurements from the HALO airplane
                                                                         are employed to study the total rainfall, RR, cloud droplet,
                                                                         and raindrop sensitivities to these environmental and geo-
                                                                         graphic characteristics.

                                                                         3.2.1    Rainfall Dm as a function of rainfall rate for
                                                                                  polluted and clean cases

                                                                         The impact of aerosol concentration on cloud microphysical
                                                                         properties needs to be analysed for the different seasons. Par-
                                                                         ticle concentrations measured at the surface using the CPC
                                                                         during the dry and wet seasons vary greatly from one an-
Figure 5. X-band radar reflectivity contoured frequency by altitude      other. For instance, the 33rd and 66th percentiles are 673 and
diagram (CFAD) for the wet (a) and dry (b) seasons. Each CFAD            1377 cm−3 for the wet season and 1954 and 3392 cm−3 for
consists of a PDF of reflectivity (2 dBZ bin intervals) at each height   the dry season, respectively. Nearly 3 times as many aerosols
(400 m bin intervals) multiplied by 100 so that values are displayed     are present during the dry compared to the wet season, which
as a percentage.                                                         can have substantial implications for cloud and rainfall for-
                                                                         mation. However, as shown in Fig. 2, the thermodynamic
                                                                         characteristics also vary greatly, and the differences cannot
are also other possible effects that may impact the data qual-           be explained only by the difference in aerosol concentrations.
ity, such as resonance and partial beam-filling. Although the            To evaluate the impact of aerosols on cloud processes, the
CFADs are not completely different, given that these param-              mass-weighted mean rainfall diameter must be evaluated for
eters have a small range of variation and are subject to the             different particle concentrations during each season. How-
limitations described above, some clear seasonal differences             ever, after analysis, this comparison was only possible during
can be observed. The ZDR that largely reflects ice orienta-              the wet season because rainfall events with particle concen-
tion contains a greater number of near-zero or negative sig-             trations exceeding the 66th percentile in the dry season were
nals during the dry season compared to the wet season. This              rare. During the dry season, the upper one-third of aerosol
is likely associated with crystal orientation by the electrical          concentrations are characterized mostly by drier days. The
field as more lightning occurs (see Williams et al., 2002), and          dry season is characterized by biomass burning and approx-
more vertically oriented ice shapes such as graupel may oc-              imately 6 times more mass-loaded (organic) aerosols than
cur during the dry season than the wet season. The KDP dis-              during the wet season. Shilling et al. (2018) describe the typ-
tribution shows considerably larger values in the warm layer             ical aerosol types and the evolution of organic aerosol par-
during the dry compared to the wet season, indicating that               ticles during the wet and dry season in the Manaus pollu-
the higher RRs and greater number of positive values in the              tion plume. Figure 7 shows the Dm during the wet season
mixed phase are probably associated with intense updrafts,               for background (particle concentrations less than the 33rd
as shown by Giangrande et al. (2016). The correlation coeffi-            percentile) and polluted (particle concentrations greater than
cient highlights an interesting feature. During the dry season,          the 66th percentile) conditions as a function of RR. This cal-
there appears to be a clearer distinction between the mixed              culation requires two different instruments to be co-located.
phase and the glaciation phase above 8 km. The wet season                Therefore, the number of samples from each 5 min continu-
correlation coefficient is more homogenous with height in-               ous rainfall event interval in each RR class was drastically
side the cloud. Cecchini et al. (2017b) and Jäkel et al. (2017)          reduced. Consequently, the differences between the two air
discuss the greater efficiency of clouds forming in a clean              quality categories in each RR bin were significant only at the

Atmos. Chem. Phys., 18, 6461–6482, 2018                                                    www.atmos-chem-phys.net/18/6461/2018/
L. A. T. Machado et al.: Overview: Precipitation characteristics and sensitivities to environmental conditions 6471
Figure 6. ZDR (gives an idea of horizontal–positively and vertical–negatively oriented hydrometeors), KDP (gives an idea of hydrometeor
concentration and hydrometeor orientation), and horizontal–vertical correlation (gives an idea of the homogeneity of the hydrometeor)
contoured frequency by altitude diagram (CFAD) for the wet (a) and dry (b) seasons as derived using the X-band radar. Each CFAD consists
of a PDF of ZDR (0.5 dB bin intervals), KDP (0.5 dB bin intervals), and co-polar correlation (0.05 bin intervals) at each height (400 m bin
intervals) multiplied by 100 so that the values are displayed as a percentage.
the major effect of convective invigoration discussed in the
preceding section. Rosenfeld and Ulbrich (2003) used satel-
lite data to estimate raindrop size distributions for continental
and maritime Amazon clouds (LBA). They found that clouds
over the continent produce greater concentrations of large
drops and smaller concentrations of small drops. They sug-
gested that this behaviour is caused by the effects of aerosols
on precipitation formation processes.
3.2.2 Rainfall sensitivity to surface cover
Figure 7. Mass-weighted mean rainfall diameter as a function of There is a very complex diurnal cycle over the Amazonas
the rainfall rate (RR) during the wet season for clean (CPC smaller basin. Burleyson et al. (2016) used 15 years of satellite data
than the 33rd percentile) and polluted (CPC larger than the 66th per- to show a heterogeneous spatial distribution of convection
centile) air over the T3 site. Each box represents the 25 to 75 % pop- that results from numerous local effects of rivers and veg-
ulations, and the line inside the box shows the median value; circles etation cover. Using radar data, Saraiva et al. (2016) also
represent outliers. found the Amazonas diurnal cycle to vary regionally. In ad-
dition to the natural geographic effect, rainfall modulation
occurs through anthropogenic-induced changes in vegetation
85 % level. Even if the differences between the two average and the presence of large cities. Durieux et al. (2003) have
values for background and polluted cases are not significant, shown that cloud cover varies as a function of the deforesta-
the physical results show clear trends. For low RRs, which tion pattern. Lin et al. (2010), among several other studies,
are more often associated with warm cloud processes, the have discussed the urban heat island effect on the region’s cli-
cases with background aerosol concentrations have a larger mate. To understand how vegetation cover influences precip-
Dm because there are fewer CCN and lower cloud droplet itation characteristics, two approaches were applied: one us-
concentrations, resulting in large raindrops. However, for ing statistical radar data and the other using a special HALO
greater RRs, which are typically associated with deep con- mission specifically aimed at this topic.
vection, the Dm is greater for polluted clouds, demonstrating
www.atmos-chem-phys.net/18/6461/2018/ Atmos. Chem. Phys., 18, 6461–6482, 20186472 L. A. T. Machado et al.: Overview: Precipitation characteristics and sensitivities to environmental conditions
Figure 8. (a) Four vegetation classes as obtained from the digital Terra Class classification: forest, hydrography, non-forest, and urban area.
(b) Topography across a 150 km radius as derived using SIPAM radar. X-band (T3 site) and S-band radar positions are shown in the figure.
Figure 9 shows the RR box plots for each surface type
in the wet and dry seasons. This analysis does not consider
cloud life cycle or the different thermodynamic or dynamic
conditions that may have been present and only considers
those statistics present among the different surface types. The
different behaviours are a consequence of different physical
processes, which will be discussed in this section.
For the wet season, the RR varies little among the different
surface cover classes. However, for the dry season, a greater
amount of rainfall occurred over the urban areas and smaller
Figure 9. Rainfall rate (RR; from S-band radar) box plots for the amounts occurred over non-forested regions. In general, the
wet and dry seasons given different surface cover classes. Each box dry season RR was greater than that in the wet season. The
represents the 25 to 75 % populations, and the line inside the box median and tail of the distribution were larger over urban
represents the median value. areas and smaller over deforested areas. The difference be-
tween the median values of non-forested and urban RRs in
the dry season was approximately 25 %. Although the num-
For the statistical approach, the RR was calculated from ber of radar pixels in each class varied and the urban area
the SIPAM S-band radar data for the dry and wet seasons, represents only 0.5 % of the area, the box plot patterns are
as described in Sect. 2. Surface cover was obtained from different. The smaller differences during the wet season can
the digital Terra Class classification data (Almeida et al., be expected because rainfall during this season has a strong
2016). This database contains 15 vegetation classes, such stratiform cloud component typical of a monsoon rainfall
as forest, hydrology, urban areas, and several deforestation regime, as described above. In this type of regime, large-scale
classes, including clean and dirty pasture, deforested areas, dynamic forcing is very strong, and surface type has little im-
and exposed soil. These classes were regrouped in four cat- pact. However, during the dry season, rainfall events largely
egories for this study: forest (covering 76.9 % of the studied depend on local forcing and surface latent heat flux. Manaus,
region), hydrography (16.3 %), non-forest (6.2 %), and urban as an urban centre, is characterized by a strong heat island ef-
area (0.5 %). These two datasets were combined to evaluate fect (Souza and Alvalá, 2014) that creates a convergence fed
the different RRs for each surface cover type. Terra Class has by moisture from the surrounding forest. The non-forested
a 300 m resolution and was interpolated to the radar grid us- area has less available latent heating than the forest, which
ing the most frequent surface type class. Figure 8 presents the may contribute to lower RRs. These results are associated
spatial distribution of the vegetation classes (Fig. 8a) over the with RR and not total rainfall data. Total rainfall is larger
150 km radius of the S-band radar and the topography of the over the forest and hydrology areas (not shown).
region (Fig. 8b).
Atmos. Chem. Phys., 18, 6461–6482, 2018 www.atmos-chem-phys.net/18/6461/2018/You can also read