Aircraft vertical profiles during summertime regional and Saharan dust scenarios over the north-western Mediterranean basin: aerosol optical and ...
←
→
Page content transcription
If your browser does not render page correctly, please read the page content below
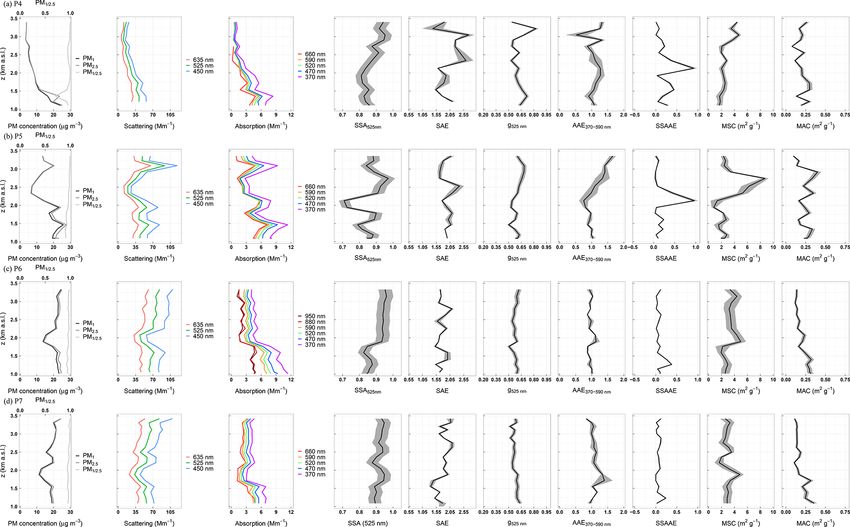
Atmos. Chem. Phys., 21, 431–455, 2021
https://doi.org/10.5194/acp-21-431-2021
© Author(s) 2021. This work is distributed under
the Creative Commons Attribution 4.0 License.

Aircraft vertical profiles during summertime regional and
Saharan dust scenarios over the north-western Mediterranean
basin: aerosol optical and physical properties
Jesús Yus-Díez1,2 , Marina Ealo1,2 , Marco Pandolfi1 , Noemí Perez1 , Gloria Titos1,3,4 , Griša Močnik5,6 , Xavier Querol1 ,
and Andrés Alastuey1
1 Instituteof Environmental Assessment and Water Research (IDAEA-CSIC), C/Jordi Girona 18–26, 08034, Barcelona, Spain
2 Grup de Meteorologia, Departament de Física Aplicada, Universitat de Barcelona,
C/Martí i Franquès 1, 08028, Barcelona, Spain
3 Andalusian Inter-University Institute for Earth System Research, University of Granada, 18006, Granada, Spain
4 Department of Applied Physics, University of Granada, 18071, Granada, Spain
5 Center for Atmospheric Research, University of Nova Gorica, Vipavska 11c, 5270 Ajdovščina, Slovenia
6 Department of Condensed Matter Physics, Jožef Stefan Institute, Jamova 39, 1000 Ljubljana, Slovenia

Correspondence: Jesús Yus-Díez (jesus.yus@idaea.csic.es) and Marco Pandolfi (marco.pandolfi@idaea.csic.es)

Received: 9 August 2020 – Discussion started: 25 August 2020
Revised: 9 November 2020 – Accepted: 22 November 2020 – Published: 14 January 2021

Abstract. Accurate measurements of the horizontal and ver-         compared the aircraft measurements with those performed
tical distribution of atmospheric aerosol particle optical prop-   at two GAW–ACTRIS (Global Atmosphere Watch–Aerosol,
erties are key for a better understanding of their impact on       Clouds and Trace Gases) surface measurement stations lo-
the climate. Here we present the results of a measurement          cated in north-eastern Spain, namely Montseny (MSY; re-
campaign based on instrumented flights over north-eastern          gional background) and Montsec d’Ares (MSA; remote site).
Spain. We measured vertical profiles of size-segregated at-           Airborne in situ measurements and ceilometer ground-
mospheric particulate matter (PM) mass concentrations and          based remote measurements identified aerosol air masses at
multi-wavelength scattering and absorption coefficients in         altitudes up to more than 3.5 km a.s.l. The vertical profiles of
the western Mediterranean basin (WMB). The campaign                the optical properties markedly changed according to the pre-
took place during typical summer conditions, characterized         vailing atmospheric scenarios. During SDE the SAE was low
by the development of a vertical multi-layer structure, un-        along the profiles, reaching values < 1.0 in the dust layers.
der both summer regional pollution episodes (REGs) and Sa-         Correspondingly, SSAAE was negative, and AAE reached
haran dust events (SDEs). REG patterns in the region form          values up to 2.0–2.5, as a consequence of the UV absorption
under high insolation and scarce precipitation in summer,          increased by the presence of the coarse dust particles. During
favouring layering of highly aged fine-PM strata in the lower      REG, the SAE increased to > 2.0, and the asymmetry param-
few km a.s.l. The REG scenario prevailed during the en-            eter g was rather low (0.5–0.6) due to the prevalence of fine
tire measurement campaign. Additionally, African dust out-         PM, which was characterized by an AAE close to 1.0, sug-
breaks and plumes from northern African wildfires influ-           gesting a fossil fuel combustion origin. During REG, some of
enced the study area. The vertical profiles of climate-relevant    the layers featured larger AAE (> 1.5), relatively low SSA
intensive optical parameters such as single-scattering albedo      at 525 nm (< 0.85) and high MSC (> 9 m2 g−1 ) and were
(SSA); the asymmetry parameter (g); scattering, absorption         associated with the influence of PM from wildfires. Over-
and SSA Ångström exponents (SAE, AAE and SSAAE); and               all, the SSA and MSC near the ground ranged around 0.85
PM mass scattering and absorption cross sections (MSC and          and 3 m2 g−1 , respectively, and increased at higher altitudes,
MAC) were derived from the measurements. Moreover, we              reaching values above 0.95 and up to 9 m2 g−1 . The PM,

Published by Copernicus Publications on behalf of the European Geosciences Union.
432      J. Yus-Díez et al.: Aircraft vertical profiles during REG and SDE scenarios over the NW Mediterranean basin

MSC and MAC were on average larger during REG com-                  detailed optical, physical and chemical properties of atmo-
pared to SDE due to the larger scattering and absorption ef-        spheric aerosol particles at the surface (Putaud et al., 2004;
ficiency of fine PM compared with dust. The SSA and MSC             Putaud et al., 2010; Andrews et al., 2011; Asmi et al., 2013;
had quite similar vertical profiles and often both increased        Collaud Coen et al., 2013; Collaud Coen et al., 2020; Cavalli
with height indicating the progressive shift toward PM with         et al., 2016; Zanatta et al., 2016; Pandolfi et al., 2018; Laj
a larger scattering efficiency with altitude.                       et al., 2020).
   This study contributes to our understanding of regional-            Given that the radiative forcing by aerosols is produced in
aerosol vertical distribution and optical properties in the         the whole atmospheric column, the study of the vertical dis-
WMB, and the results will be useful for improving future            tribution of aerosol particles and their properties is of great
climate projections and remote sensing or satellite retrieval       importance (Sheridan et al., 2012; Samset et al., 2013). In
algorithms.                                                         fact, uncertainties regarding their vertical distribution and its
                                                                    relationship with surface emission sources are still a subject
                                                                    of intensive research. For example, Sanroma et al. (2010)
                                                                    suggested that, during cloud-free conditions, high-altitude
1   Introduction                                                    aerosol particles are the major contributor to variations in
                                                                    solar radiation flux reaching the surface, at least at the high-
Atmospheric aerosol particles play an important role in             altitude sites they studied. Moreover, the positive radiative
Earth’s radiative balance directly by scattering and absorb-        forcing associated with strongly absorbing particles, such as
ing solar radiation and indirectly by acting as cloud conden-       black carbon (BC), is amplified when these particles are lo-
sation nuclei (Myhre et al., 2013). Globally, the aerosol parti-    cated above clouds (Zarzycki and Bond, 2010, and references
cles’ direct radiative effect is negative at the top of the atmo-   therein), and the sign and magnitude of semi-direct BC ef-
sphere due to their net cooling on Earth’s atmosphere system        fects depend on the BC location relative to the clouds and
(Myhre et al., 2013). This estimation is, however, affected by      cloud type (Bond et al., 2013), with different clouds dif-
a large uncertainty which reflects the large spatial and tem-       ferently impacting the atmospheric heating rate of different
poral variability of the optical, physical and chemical proper-     aerosol types (Ferrero et al., 2020).
ties of optically active atmospheric aerosol particles (Myhre          Ground-based remote sensing measurements of aerosol
et al., 2013). This variability is largely due to the wide va-      particles’ optical and physical properties are performed by
riety of aerosol sources and sinks, their intermittent nature       a number of projects, such as AERONET (AErosol RObotic
and spatial non-uniformity together with the chemical and           NETwork; https://aeronet.gsfc.nasa.gov, last access: 7 Jan-
physical transformations that aerosol particles undergo in the      uary 2021), which is the international federation of ground-
atmosphere (Myhre et al., 2013). These variables affect the         based sun and sky scanning radiometers and the European
scattering and absorption properties of atmospheric particles       Aerosol Research Lidar Network (EARLINET–ACTRIS,
and consequently their radiative properties. Thus, uncertain-       https://www.earlinet.org, last access: 7 January 2021), pro-
ties remain regarding the effects that aerosol particles exert      viding column-integrated and vertically resolved optical
on climate from local to global scales, and a detailed charac-      properties, respectively. Satellite and sun/sky photometer
terization of their properties in the horizontal and vertical di-   measurements provide information on the aerosol properties
mensions is needed (Andrews et al., 2011; Bond et al., 2013;        of the entire atmospheric column, top-down and bottom-up,
Haywood et al., 1999; Collaud Coen et al., 2013). Accurate          respectively. Polar-orbiting satellite observations provide a
knowledge of their radiative forcing will improve both the          wide spatial coverage yet are limited in time resolution to
climate reanalysis and forecasting models, which are needed         once or twice a day. On the other hand, laser-based active
in the current climate change context (Myhre et al., 2013).         instruments such as lidars (light detection and ranging) and
The in situ surface distribution of atmospheric particles and       ceilometers provide reliable information of the vertically re-
their physical and chemical properties is determined through        solved optical properties of aerosols, such as backscatter-
an array of networks across the US and Europe and to a              ing and extinction. Lidars measure at several wavelengths
lesser extent in Asia and Africa (Laj et al., 2020), such as        (e.g. Raman-elastic lidars; Ansmann et al., 1992), whereas
the Global Atmosphere Watch (GAW, World Meteorologi-                ceilometers are usually limited to one wavelength.
cal Organization); the European Research Infrastructure for            The aforementioned remote sensing methods have thus
the observation of Aerosol, Clouds and Trace Gases (AC-             limitations for directly measuring the vertically resolved dis-
TRIS; http://www.actris.eu, last access: 7 January 2021); the       tribution of specific climate-relevant optical parameters or
Interagency Monitoring of Protected Visual Environments             variables such as SSA, the asymmetry parameter (g) or
(IMPROVE; http://vista.cira.colostate.edu/Improve/, last ac-        absorption coefficients. Although not as frequent, airborne
cess: 7 January 2021); the European Monitoring and Evalua-          measurements can provide the vertical profiles and horizon-
tion Programme (EMEP, http://www.Emep.int, last access:             tal variability of these parameters, as well as of other aerosol-
7 January 2021); and the NOAA Federated Aerosol Net-                related patterns. Instrumented flights are usually performed
work (NFAN; Andrews et al., 2019). These networks provide           for specific campaigns, with a duration ranging from multiple

Atmos. Chem. Phys., 21, 431–455, 2021                                                  https://doi.org/10.5194/acp-21-431-2021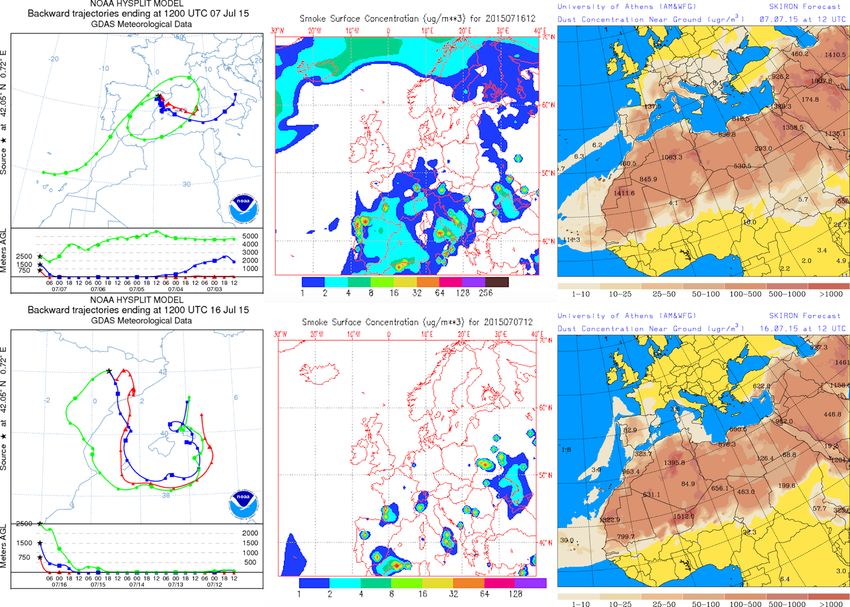
J. Yus-Díez et al.: Aircraft vertical profiles during REG and SDE scenarios over the NW Mediterranean basin                    433

weeks to a few years, allowing for determining aerosol prop-       both primary and secondary aerosol particles, especially in
erties up to heights of a few km a.g.l. in the free troposphere.   summer (Rodríguez et al., 2002; Dayan et al., 2017), from di-
For example, Esteve et al. (2012) performed a campaign over        verse emission sources. Anthropogenic emissions from road
Bondville (Illinois) aiming at comparing AERONET remote            traffic, industry, agriculture and maritime shipping, among
sensing measurements with measurements of aerosol prop-            others, negatively affect the air quality in this region (Querol
erties, such as scattering, absorption and other derived vari-     et al., 2009b; Amato et al., 2009; Pandolfi et al., 2014c).
ables from instrumented flights. In Asia, Clarke et al. (2002)     Moreover, the Mediterranean basin is also highly influenced
measured aerosol particles’ microphysical, optical and chem-       by natural sources, such as mineral dust from African deserts
ical properties over the Indian Ocean. Recently, Singh et al.      and smoke from forest fires (Bergametti et al., 1989; Querol
(2019) measured particle size, number (N), spectral absorp-        et al., 1998; Rodríguez et al., 2001; Lyamani et al., 2006;
tion and meteorology variables in different pollution lay-         Mona et al., 2006; Koçak et al., 2007; Kalivitis et al., 2007;
ers along a Himalayan valley in Nepal by means of instru-          Querol et al., 2009b; Schauer et al., 2016; Ealo et al., 2016;
mented flights. Vertically resolved measurement campaigns          Querol et al., 2019, among others). In addition to this, the
have been performed with tethered balloons, for example in         distribution of the different types of aerosol particles in the
the Po valley (Ferrero et al., 2014); in the Arctic (Ferrero       Mediterranean basin is largely modulated by regional and
et al., 2016); and with unmanned aerial vehicles (UAVs),           large-scale circulation (Millán et al., 1997; Gangoiti et al.,
such as the ones over the eastern Mediterranean by Pikri-          2001; Kallos et al., 2007). The complex orography surround-
das et al. (2019). Aircraft aerosol measurements over Eu-          ing the WMB (western Mediterranean basin) sea and the
rope were performed for example during the EUCAARI-                high insolation, scarce precipitation and low winds during
LONGREX (European Integrated project on Aerosol Cloud              summertime give rise to high rates of accumulation and for-
Climate and Air Quality interactions Long Range Experi-            mation of secondary particles (Rodríguez et al., 2002). The
ment) campaign as shown by Highwood et al. (2012), who             north-east of Spain provides a frame of study that represents
presented the results of a closure study between measured          well the atmospheric summer conditions of the western and
vertical aerosol particles scattering and absorption and Mie       central Mediterranean, characterized by frequent and severe
theory. In North America, Sheridan et al. (2012) performed         pollution episodes with high PM, UFP (ultra-fine particle)
flights between 2 and 3 times per week during 3 consecutive        and O3 formation (Pey et al., 2013; Pandolfi et al., 2014a;
years, measuring more than 400 vertical profiles of aerosol        Querol et al., 2017, among others). Typical atmospheric dy-
particles and trace gas concentrations. The vertical profiles      namics coupled to local orography results in local and re-
of total and accumulation mode N concentration, BC mass            gional vertical recirculation with a consequent accumula-
concentration, lidar measurements and the estimated radia-         tion of pollutants (Millán et al., 1997). Vertical recircula-
tive aerosol effect during EUCAARI-LONGREX were pre-               tion and ageing of pollutants is favoured by weak gradient
sented by Hamburger et al. (2010), Groß et al. (2013) and Es-      atmospheric conditions, scarce precipitation and continuous
teve et al. (2016). In the context of the ChArMEx/ADRIMED          exposure to solar radiation driving photochemical reactions
measurement campaign (the Chemistry-Aerosol Mediter-               (Rodríguez et al., 2002; Pérez et al., 2004). This recirculation
ranean Experiment/Aerosol Direct Radiative Impact on the           is very relevant in midsummer, when the solar radiation in-
regional climate in the MEDiterranean region; e.g. Mallet          creases and the high-pressure periods last longer, so that the
et al., 2016; Denjean et al., 2016) instrumented flights mea-      vertical recirculation reaches further inland and creates reser-
suring physical and chemical properties took place. These          voir strata (loaded with pollutants) at 1–3 km a.s.l. (Gangoiti
measurement campaigns have demonstrated the usefulness             et al., 2001; Pérez et al., 2004). In fact, due to the geogra-
of instrumented flights providing aerosol properties which         phy and climatic summer meteorological patterns, the for-
cannot be measured with conventional remote sensing tech-          mation of strong breezes from the coast through the valleys
niques. These vertically resolved aerosol measurements are         up to the Pyrenees and pre-Pyrenees range is frequent (Ripoll
restricted to the time span of the campaign as well as to the      et al., 2014). Additionally, and especially in spring–summer,
regional area where these take place. However, aircraft mea-       intense Saharan dust outbreaks (Querol et al., 1998, 2009b;
surements might yield very relevant information for detailed       Querol et al., 2019; Rodríguez et al., 2001; Escudero et al.,
radiative forcing studies and might be extremely useful for        2007; Pey et al., 2013) and forest fires (Faustini et al., 2015)
models aiming at simulating these effects over specific re-        influence air quality over the WMB. The above atmospheric
gions. Moreover, the results could be extrapolated to other        processes might coincide in space and time in the WMB
periods when measurements are not available in the same            and result in summer radiative forcing above this area be-
area or to other areas with similar meteorological patterns        ing among the highest in the word (Lelieveld et al., 2002,
and pollutant emissions.                                           and references therein). To the best of our knowledge, only
   Detailed studies of the vertical profiles of climate-relevant   a few in situ aircraft- or balloon-borne measurement cam-
aerosol properties are especially important in climate-            paigns aiming at studying the optical properties of tropo-
sensitive areas, such as the Mediterranean basin. This is one      spheric aerosol particles were performed in the WMB such as
of the regions in the world characterized by high loads of

https://doi.org/10.5194/acp-21-431-2021                                                Atmos. Chem. Phys., 21, 431–455, 2021
434 J. Yus-Díez et al.: Aircraft vertical profiles during REG and SDE scenarios over the NW Mediterranean basin
those performed within the ChArMEx/ADRIMED campaign (MSY; 720 m a.s.l.) and Montsec (MSA; 1570 m a.s.l.) mea-
(Denjean et al., 2016). surement stations, and the location and ID codes (P1–P7) of
To better characterize the complex summer atmospheric the instrumented flights (Table 1).
scenarios of the WMB and to better understand their ef- This area is characterized by warm summers and tem-
fect on the concentrations and optical properties of aerosols, perate winters with irregular and rather scarce precipitation
we present here results from an aircraft measurement cam- rates, especially in summer. The Azores high-pressure sys-
paign performed in the north-western Mediterranean within tem plays an important role in the synoptic meteorology of
the PRISMA project (aerosol optical properties and radia- the Iberian Peninsula (IP). In winter, the Azores anticyclone
tive forcing in the western Mediterranean as a function of is located at lower latitudes, and so the IP is more influenced
chemical composition and sources). The main objective of by low-pressure systems and the associated fronts coming
the PRISMA project was to study the spatial and vertical from the North Atlantic. However, in summer, the anticy-
distribution of the atmospheric aerosol particles with spe- clonic system intensifies and moves toward higher latitudes
cial interest in their physical and optical properties to as- inducing very weak pressure gradient conditions over the
sess the regional radiative forcing caused by the tropospheric IP. These atmospheric stagnant conditions, coupled to local
aerosols in the WMB. To this end two measurement cam- orography and sea breeze circulation, result in local and re-
paigns were performed in the summers of 2014 and 2015, gional atmospheric dynamics that favour the accumulation
combining aircraft measurements with remote and in situ sur- and ageing of pollutants (Millán et al., 1997, 2002; Gangoiti
face measurements performed at the Montseny (MSY) and et al., 2001; Rodríguez et al., 2002; Pérez et al., 2004, among
Montsec (MSA) stations. Herein we focus on the 2015 cam- others). The high surface temperatures give rise to the for-
paign, when vertical summer recirculation episodes, Saharan mation of the Iberian thermal low, which induces the con-
dust outbreaks and plumes from wildfires simultaneously af- vergence of surface winds from the coastal areas injecting
fected air quality over the WMB. The combination of the polluted air masses into the middle troposphere (3.5–5 km
aircraft measurements with the available surface in situ and height). During the daytime the sea breeze layer (up to 800 m
remote measurements allowed for characterizing the sum- high) is channelled into the coastal and pre-coastal valleys up
mer recirculation coupled with Saharan dust outbreaks usu- to 90 km inland, transporting pollutants from the coastal area
ally observed in the WMB in summer well. The results pre- (Gangoiti et al., 2001). On the mountain and valley slopes,
sented here provide a more exhaustive characterization of the up-slope winds inject pollutants at higher levels. Sea breezes
aerosol layers than the one that can be obtained by deploying and up-slope winds over the coastal and pre-coastal moun-
in situ surface and remote sensing techniques applied so far tains transport coastal pollutants inland, while a fraction of
in the region. these pollutants is injected in their return flows aloft (2–
In the following section (Sect. 2) we describe the method- 3 km), forming high-pollution-loaded reservoir strata (Gan-
ology, with a deeper analysis of the study area, measurement goiti et al., 2001). Pollutants are returned to the Mediter-
stations and flight location as well as the main meteorolog- ranean Sea owing to the prevalence of westerly winds above
ical scenarios. In Sect. 3 we will explain the main calcula- the mixing layer. Once in those upper layers, pollutants move
tions of aerosol optical properties. The main results obtained back towards the sea, and compensatory subsidence creates
in this study are shown in Sect. 4 for the different meteoro- stratified reservoir layers of aged pollutants. Then, the next
logical scenarios for both surface and the vertical measure- morning the lowermost layers are drawn inland again by the
ments. Finally, we discuss the obtained results in the conclu- sea breeze (Millán et al., 2002; Gangoiti et al., 2001).
sion (Sect. 5). Saharan dust outbreaks affect the Iberian Peninsula mostly
in spring–summer, increasing the PM levels. The meteo-
rological scenarios causing African dust transport over the
2 Methodology study area are described in Rodríguez et al. (2001) and Es-
cudero et al. (2005). Four main scenarios are differentiated:
2.1 Area of study and meteorology northern African high located at the surface level (NAH-
S), Atlantic depression (AD), northern African depression
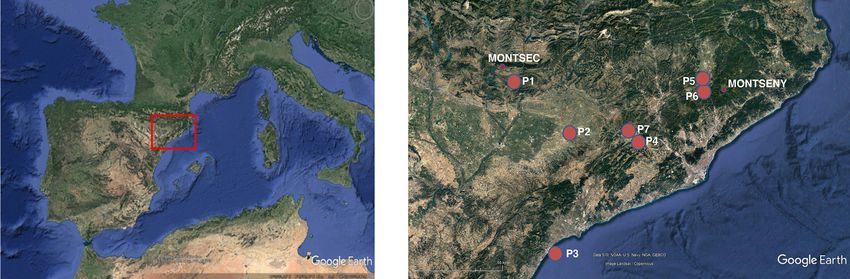
Airborne aerosol measurements were performed in an area of (NAD) and northern African high located at upper levels
around 3500 km2 in the north-western Mediterranean area of (NAH-A). The WMB is mostly affected by the AD and NAD
Catalonia, north-eastern Spain (Fig. 1). The area is close to in spring and fall, by the NAH-A in summer, and by the
the Barcelona metropolitan area, where anthropogenic emis- NAH-S from January to March. Another potential significant
sions, mostly from road traffic, industry, agriculture and mar- source of PM affecting air quality in the WMB is wildfires,
itime shipping (Barcelona is one of the major ports in the which might persist for several days and emit large amounts
Mediterranean) negatively affect the air quality (Querol et al., of primary PM and precursors of secondary aerosols (Faus-
2001; Pey et al., 2013; Pérez et al., 2008; Amato et al., 2009; tini et al., 2015). In addition to the complex atmospheric pat-
Amato et al., 2016; Reche et al., 2011, among others). Fig- terns, the scarce precipitation and the high exposure to so-
ure 1 shows the study area, the location of the Montseny lar radiation drive photochemical reactions resulting in high
Atmos. Chem. Phys., 21, 431–455, 2021 https://doi.org/10.5194/acp-21-431-2021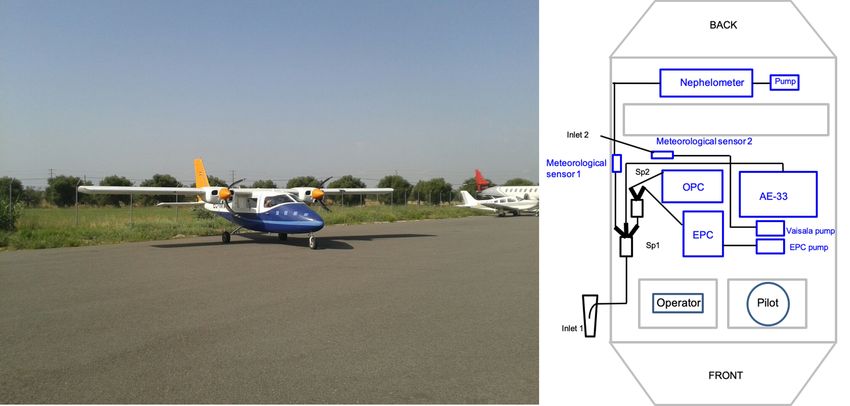
J. Yus-Díez et al.: Aircraft vertical profiles during REG and SDE scenarios over the NW Mediterranean basin 435
Figure 1. Western Mediterranean basin and zoom over the north-east of Spain with the MSA and MSY stations and the number ID of
the instrumented flights (Table 1), with the shaded area indicating the horizontal area where measurements were taken. Satellite view from
© Google Earth.
Table 1. Flight measurement location and date. Vertical profiles were performed up to heights of 3.5 km a.s.l.
Profile Flight direction Date Time (UTC) Coordinates Area
P1 Upwards 7 Jul 2015 08:55–09:16 41.96◦ N, 0.75◦ E MSA
P2 Upwards 7 Jul 2015 15:31–15:53 41.65◦ N, 1.14◦ E Plain
P3 Upwards 8 Jul 2015 08:11–08:31 41.01◦ N, 0.94◦ E Coast
P4 Downwards 14 Jul 2015 09:44–10:00 41.60◦ N, 1.64◦ E Catalan pre-coastal mountain range
P5 Downwards 14 Jul 2015 10:56–11:12 41.85◦ N, 2.20◦ E Catalan pre-coastal mountain range
P6 Downwards 16 Jul 2015 10:07–10:23 41.84◦ N, 2.24◦ E Catalan pre-coastal mountain range
background levels of secondary aerosols and ozone (Ro- diction System; http://www.nrlmry.navy.mil/aerosol, last ac-
dríguez et al., 2002; Pérez et al., 2004; Querol et al., 2016; cess: 7 January 2021; see Fig. 2).
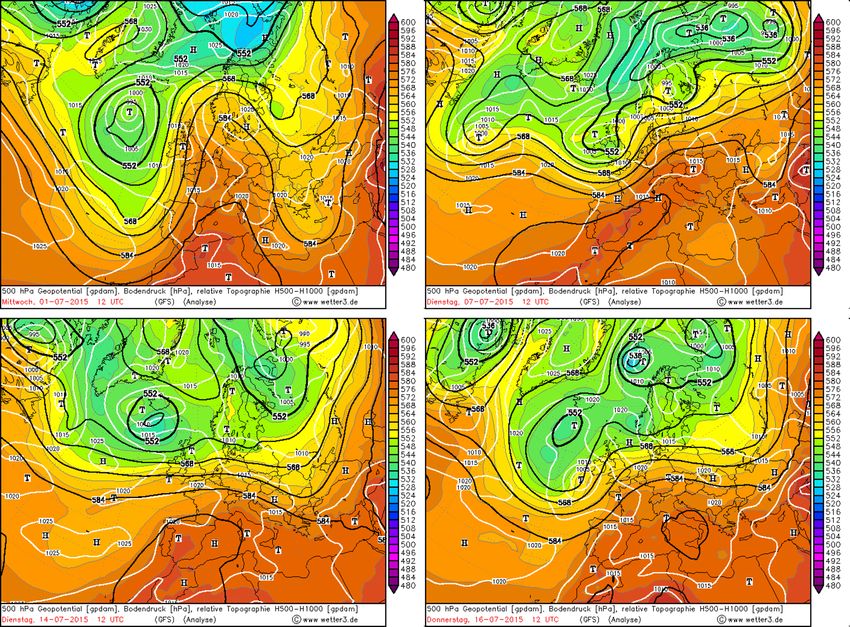
Querol et al., 2017). The geopotential height at 500 hPa and sur-
face pressure from the ERA-INTERIM reanalysis
2.1.1 Detailed synoptic and mesoscale meteorological model (https://www.ecmwf.int/en/forecasts/datasets/
scenarios during flights reanalysis-datasets/era-interim, last access: 7 January 2021)
show for the first day of the measurements a high-pressure
Airborne measurements of tropospheric aerosol particles system covering central Europe (Figs. 3 and S1 in the
physical properties were conducted during 7–8 and 14– Supplement). On 7 July (coincident with the first measure-
16 July 2015 during the typical summer regional pollution ments), the Azores high-pressure system and a northern
episodes and aerosol layering (Gangoiti et al., 2001). HYS- European low governed the synoptic flow. This situation
PLIT (HYbrid Single-Particle Lagrangian Integrated Trajec- persisted until 16 July, with an enhancement of the Iberian
tory model; Draxler and Hess, 1998) back trajectories in and northern African thermal lows (Fig. 3).
Fig. 2 (calculated for 7 and 16 July 2015; see more trajec- Thus, during the campaign, the atmospheric scenario is the
tories for the 8 and 14 July in Fig. S2) and the potential typical one favouring stagnation in the WMB, which leads to
temperature vertical profile (Fig. S3) show that both periods the recirculations of vertical air masses driven by local and
were characterized by atmospheric stagnation (without ma- regional processes (Gangoiti et al., 2001). Furthermore, the
jor synoptic flows venting the WMB). Under these summer north-eastern African high pressure at high atmospheric lev-
atmospheric scenarios sea breezes, and the vertical recircu- els (NAH-A; Escudero et al., 2005) favoured the advection
lation of air masses develop. However, during the first pe- of Saharan dust at high altitudes to the area of study from
riod an African dust outbreak affected the study area (Fig. 2), noon on 4 July to the afternoon of 8 July 2015. We will refer
probably by high-altitude transport from northern Africa and to this first period as the SDE (Saharan dust event) period, in
subsequent impact on surface by convective circulations over reference to the Saharan dust event that persisted during these
the continent. Moreover, plumes from wildfires reached also days. On 14 and 16 July, smoke from wildfires over northern
the study area in the second period as the smoke forecast Africa and the IP affected the study area. During this sec-
from NAAPS indicated (Navy Aerosol Analysis and Pre-
https://doi.org/10.5194/acp-21-431-2021 Atmos. Chem. Phys., 21, 431–455, 2021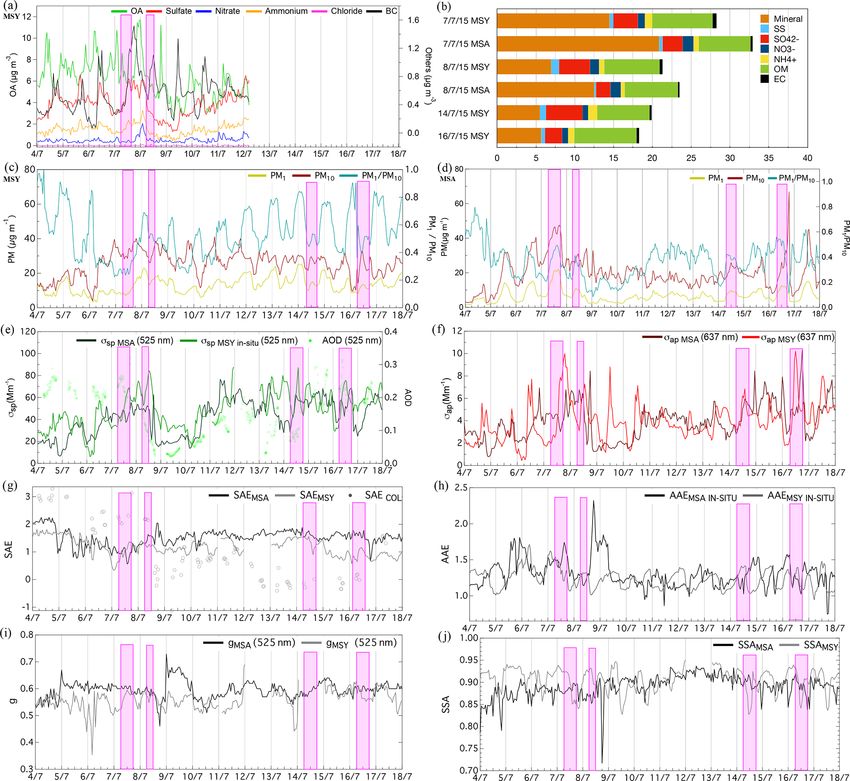
436       J. Yus-Díez et al.: Aircraft vertical profiles during REG and SDE scenarios over the NW Mediterranean basin

Figure 2. Upper panel shows the back trajectories at the MSA station, the dust concentration (µg m−3 ) near the ground as simulated by the
SKIRON forecast simulations (University of Athens) and the smoke surface concentration (µg m−3 ) forecasted by the NAAPS Prediction
System for 12:00 UTC of the 7 July 2015 (flights P1 and P2). The lower panels shows the same information for 12:00 UTC on 16 July 2015
(flights P6 and P7), although it should be noted that there is a smaller scale on the back-trajectory map, with a higher zoom in the study area.
GDAS: Global Data Assimilation System.

ond period there was no mineral dust on 14 July, while on                 the pre-Pyrenees at the Montsec d’Ares mountain range, at
16 July a light dust outbreak took place (Fig. 2). Due to the             140 km to the north-west of Barcelona and 140 km to the
prevalence of summer regional pollution episodes with the                 west-north-west of MSY (Fig. 1). Detailed descriptions of
absence of a dominant strong Saharan dust event, we will re-              the measurement supersites and of the measurements per-
fer to this second measurement period as an REG (regional                 formed can be found for example in Pérez et al. (2008),
pollution episode).                                                       Pey et al. (2009) and Pandolfi et al. (2011); Pandolfi et al.
                                                                          (2014a, 2016) for MSY and Pandolfi et al. (2014b), Ripoll
2.2     Measurements and instrumentation                                  et al. (2014) and Ealo et al. (2016, 2018) for MSA. These
                                                                          supersites are part of the Catalonian Air Quality Monitor-
2.2.1    Ground supersites and measurements                               ing Network and are part of ACTRIS and GAW networks.
                                                                          Aerosol optical properties at the sites were measured follow-
Surface measurements were performed at Montseny (MSY,                     ing standard network protocols (WMO/GAW, 2016).
regional background) and Montsec (MSA, continental back-                     Similar instruments were used for in situ surface char-
ground) monitoring supersites (north-eastern Spain). MSY                  acterization of physical, chemical and optical aerosol parti-
(41◦ 460 4600 N, 02◦ 210 2900 E, 720 m a.s.l.) is located in a            cle properties at both MSY and MSA. Aerosol particle to-
densely forested area, 50 km to the north–north-east of                   tal scattering (σsp ) and hemispheric backscattering (σbsp ) co-
Barcelona and 25 km from the Mediterranean coast. MSA                     efficients were measured every 5 min at three wavelengths
(42◦ 030 0500 N, 00◦ 430 4600 E, 1570 m a.s.l.) is located in a           (450, 525 and 635 nm) with an LED-based integrating neph-
remote high-altitude emplacement in the southern side of

Atmos. Chem. Phys., 21, 431–455, 2021                                                          https://doi.org/10.5194/acp-21-431-2021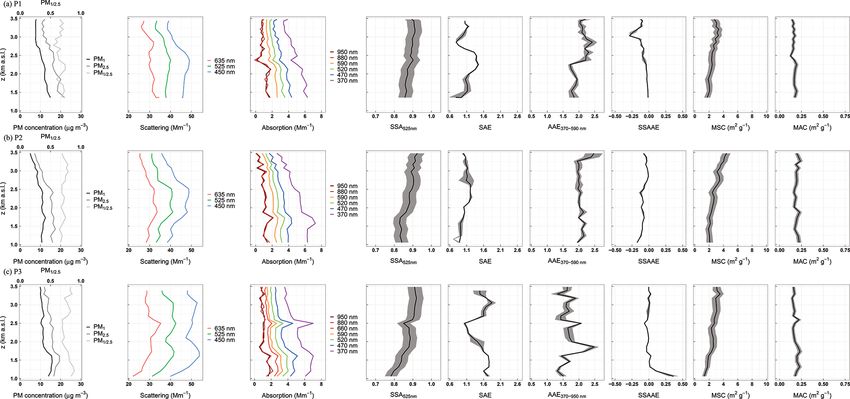
J. Yus-Díez et al.: Aircraft vertical profiles during REG and SDE scenarios over the NW Mediterranean basin                           437

Figure 3. Synoptic meteorology with 500 hPa geopotential and surface pressure at 12:00 UTC for the 1, 7, 14 and 16 July of 2015 as modelled
by the reanalysis model ERA-INTERIM, © http://www.wetter3.de last access: 7 January 2021). GFS: Global Forecast System.

elometer (Aurora 3000, Ecotech Pty, Ltd, Knoxfield, Aus-                data in this work were reported at 637 nm by multiplying the
tralia). Calibration of the two nephelometers was performed             MAAP absorption data by a factor of 1.05 as suggested by
four times per year using CO2 as span gas, while zero ad-               Müller et al. (2011a). At both sites the instruments were con-
justs were performed once per day using internally filtered             nected to a PM10 cut-off inlet. Online surface in situ opti-
particle-free air. The RH (relative humidity) threshold was             cal measurements were reported to ambient temperature (T )
set by using a processor-controlled automatic heater inside             and pressure (P ) using measurements from automatic and
the Aurora 3000 nephelometer to ensure a sampling RH of                 co-located weather stations.
less than 40 % (GAW, 2016). σsp coefficients were corrected                PM mass concentrations were obtained with an optical
for non-ideal illumination of the light source and for trun-            particle counter (OPC) (Grimm 1108.8.80) connected to an
cation of the sensing volumes following the procedure de-               individual inlet. Particle number volume concentrations were
scribed in Müller et al. (2011b). Aerosol light absorption              measured every 5 min in 15 size bins from 0.3 to 20 µm
coefficients (σap ) at seven different wavelengths (370, 470,           and then converted to PM mass concentration by the in-
520, 590, 660, 880 and 950 nm) were obtained every 1 min                strument software. PM mass concentrations were corrected
at both stations by means of aethalometers (Magee Scien-                by comparison with standard gravimetric PM measurements
tific AE33) with filter loading being corrected online by the           (Alastuey et al., 2011). An Aerosol Chemical Speciation
dual-spot manufacturer correction (Drinovec et al., 2015). At           Monitor (ACSM, Aerodyne Research Inc.) was used to mea-
both supersites a multi-angle absorption photometer (MAAP               sure real-time non-refractory submicron aerosol species (or-
– Multi Angle Absorption Photometer, Model 5012, Thermo,                ganic matter, nitrate, sulfate, ammonium and chloride). Mea-
Inc., USA; Petzold and Schönlinner, 2004) was also used                 surements with the ACSM at MSY were available from 4 to
for obtaining the aerosol light absorption coefficient. MAAP            12 July.

https://doi.org/10.5194/acp-21-431-2021                                                      Atmos. Chem. Phys., 21, 431–455, 2021
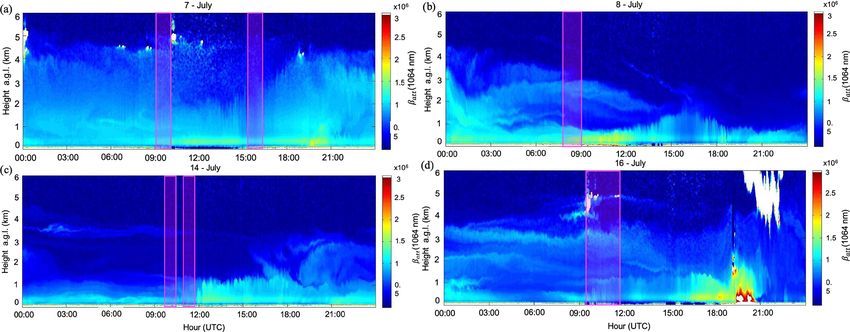
438       J. Yus-Díez et al.: Aircraft vertical profiles during REG and SDE scenarios over the NW Mediterranean basin

Figure 4. Piper PA 34 Seneca aircraft (left panel) and the schematic of the aerosol inlet and sampling instruments inside the aircraft (right
panel). Aerosol sampling lines are shown in black, and sampling instruments are in blue. EPC: environmental particle counter.

   PM10 , PM2.5 and PM1 24 h samples were daily collected                measurements were obtained at MSA by means of a CE-318
on 150 mm quartz microfibre filters (Pallflex 2500 QAT-UP                sun/sky photometer (Cimel Electronique, France) included in
and Whatman QM-H) using high-volume samplers (DIGI-                      AERONET.
TEL DH80 and/or MCV CAV-A/MSb at 30 m3 h−1 ). The
daily concentrations of major and trace elements and soluble
ions (determined following the procedure by Querol et al.,               2.2.2   Airborne measurements
2001), as well as those of organic (OC) and elemental (EC)
carbon (by a thermal–optical carbon analyser, Sunset Labo-               Flights were performed with a Piper PA 34 Seneca aircraft
ratory Inc., following the EU project EUSAAR2 (European                  (Fig. 4) over north-eastern Spain (Fig. 1) from around 0.5
Supersites for Atmospheric Aerosol Research) protocol Cav-               up to 3.5 km a.s.l. Both the upward and downward flights
alli et al., 2010), were measured during the whole campaign.             had approximately the same duration (20–30 min) (Table 1),
The ratio between the fine, PM1 , and coarse, PM10 , mode                and the ascent and descent trajectories were performed in the
is obtained as the fraction between these two concentration              same area when possible. The method used to perform the
measurements, PM1/10 . The chemical analyses allowed for                 vertical profiles consisted of vertical ascensions and descents
the determination of around 50 PM components, accounting                 following helical trajectories (Font et al., 2008), thus allow-
for 75 %–85 % of the PM mass, the unexplained PM mass                    ing for the measurement of the aerosol particles properties
being mostly due to unaccounted moisture and non-analysed                around a more constrained area. The turns during the ver-
heteroatoms.                                                             tical helical motions were made with a radius large enough
   Active remote sensing measurements of attenuated                      (around 900 m) to assume that the particles entered straight
backscatter (βatt ) at 1064 nm were performed at MSA with                into the inlet. The flights were performed at a speed of around
a Jenoptik CHM 15k Nimbus (G. Lufft Mess- und Regel-                     160 km h−1 with a vertical speed of 152 m min−1 , slightly
technik GmbH, Germany) ceilometer. The instrument oper-                  larger for the downwards flights. However, some losses may
ated continuously with a temporal and spatial resolution of              arise due to the perturbation of the flow by the aircraft during
1 min and 15 m, respectively. The maximum height of the                  the sampling, the change in the pitch angle of the aircraft due
signal is 15.36 km a.g.l. Calibration based on the Rayleigh              to the fuel load variation and ascending vs. descending ver-
calibration method was applied (Bucholtz, 1995; Wiegner                  tical motion. For most of the cases, the up and down profiles
et al., 2014). The overlap between the laser pulse and tele-             were similar, showing therefore the representativeness of the
scope field of views of the CHM 15k is greater than 60 %                 measured profiles and a minimum interference of the aircraft
at around 500 m a.g.l. (Martucci et al., 2010; Pandolfi et al.,          emissions and turbulence. Whether to present an upward or
2013). Further details of the ceilometer installed at MSA                a downward vertical profile was decided based on which of
can be found in Titos et al. (2017). Passive remote sensing              the two had better data availability and vertical resolution.

Atmos. Chem. Phys., 21, 431–455, 2021                                                        https://doi.org/10.5194/acp-21-431-2021
J. Yus-Díez et al.: Aircraft vertical profiles during REG and SDE scenarios over the NW Mediterranean basin                    439

   During the flights, an external volume flow controller          and 2.5 m away from the propeller in the back of the wing.
(IONER PFC-6020) was connected to the nephelometer in              In order to determine aerosol sampling efficiency and par-
order to assure a constant sampling flow (5 L min−1 ). Simi-       ticle transport losses we used the Particle Loss Calculator
larly to the in situ surface measurements, the scattering mea-     (PLC) software tool (von der Weiden et al., 2009). The re-
surements were performed at RH < 40 % (GAW, 2016). Dur-            sults (not shown) indicated that the losses at the inlet were
ing the SDE period the vertical profiles of scattering were        minimal for PM2.5 and that the losses inside the sampling
collected using the Kalman filter available in the Aurora 3000     system were large for dust particles larger than around 4–
nephelometers, whereas during the REG period vertical pro-         5 µm. To further confirm the PLC results, we compared the
files of this filter were switched off, and the raw σsp and σBsp   PMx measurements at the MSA station with the PMx aircraft
coefficients were collected. As shown later, the Kalman fil-       measurements performed at the same altitude of MSA during
ter had the effect of smoothing the measured scattering and        the closest flight to MSA at a distance of 10 km. This flight
hemispheric backscattering coefficients.                           (P1; 7 July 2015; Fig. 1) was performed during a Saharan
   Aerosol light absorption coefficient measurements at            dust outbreak; thus the presence of dust particles in the at-
seven different wavelengths (370 to 950 nm) were performed         mosphere was significant. Table S1 in the Supplement shows
with the AE33 aethalometer (Magee Scientific AE33, model           that differences were low, around 6 % for PM1 and 12 %
AE33 AVIO). The AE33 AVIO is a modified prototype,                 for PM2.5 with the aircraft underestimating the measure-
based on the AE33 aethalometer which was re-designed for           ments at MSA. However, the PM10 aircraft measurements
aircraft measurements. The measurement and operational             were around 47 % lower compared to the PM10 measure-
principle is identical to the commercial AE33 (Drinovec            ments performed at MSA, thus confirming the PLC results.
et al., 2015), but the AE33 AVIO model deploys a more pow-         Therefore, the inlet losses for particles other than dust were
erful internal pump to ensure a constant flow (4 L min−1 )         minimal. In fact, Table S1 shows that for scattering and ab-
with changing pressure. Aethalometer measurements were             sorption measurements (which were performed in the PM10
performed at a 1 s resolution.                                     fraction at MSA) the differences were < 9 % and < 16 %, re-
   Particulate matter (PM) mass concentration was obtained         spectively, because of the high scattering efficiency of fine
using an aerosol optical particle counter (OPC) (GRIMM             particles compared to coarse particles (e.g. Malm and Hand,
Spectrometer, model 1129-Sky-OPC). Particle number con-            2007) and because the absorbing fraction is mostly contained
centration was measured in 31 size bins at 6 s and at a flow       in the fine aerosol particle mode.
rate of 1.2 L min−1 , for particles with a size diameter from
0.25 to 32 µm. The software instrument provides PM mass
concentration, which is calculated assuming a constant par-        3    Determination of the intensive aerosol optical
ticle density. Total particle number concentration was mea-             properties
sured at 1 s by means of a water-base condensation particle
                                                                   The optical aerosol particle characterization was performed
counter (TSI EPC, model 3788) at a flow rate of 0.6 L min−1 .
                                                                   measuring the extensive optical properties (σap , σsp and
The instrument provides size range down to 5 nm and mea-
                                                                   σBsp ) and calculating the intensive optical properties for
sured concentration range up to 2.5 × 10⁵ N cm−3 .
                                                                   both in situ surface and aircraft-borne measurements. The
   Temperature (T ) and relative humidity (RH) inlet sample
                                                                   intensive optical properties (reported below) are mass-
air was measured at 15 s with a Rotronic HL-RC-B wire-
                                                                   independent properties which were determined starting from
less logger. This is a passive sensor, so no flow regulator
                                                                   the multi-wavelength measurements of extensive properties.
was needed to pass the air through the sensor. A Vaisala
                                                                   The intensive properties strongly depend on the physico-
DRYCAP® dew-point transmitter, model DMT143 was used
                                                                   chemical aerosol properties. Hereafter there is a brief de-
to measure dew point and water volume concentration of out-
                                                                   scription of the calculated intensive optical properties and the
door ambient air at 10 s via inlet 2. Ambient air was drawn
                                                                   equations used to derive them:
out at 10 s and at a flow rate of 2 L min−1 . An external pump
with a flow regulator was connected to the Vaisala sensor              a. The scattering Ångström exponent (SAE) depends on
in order to maintain a constant flow. Pressure (P ) data were             the physical properties of aerosols and mostly on the
obtained by means of a Kestrel 4000 anemometer. All the                   particle size. SAE values lower than 1 are associated
aerosol data were converted to T and P sample air condi-                  with the presence of coarse particles, whereas SAE val-
tions.                                                                    ues > 1.5 indicate the presence of fine particles (Sein-
   The inlet (Fig. 4), manufactured by Aerosol d.o.o. (https:             feld and Pandis, 1998; Schuster et al., 2006). The SAE
//mageesci.com, last access: 7 January 2021), was designed                was calculated as linear fit in a log–log space using the
to be close to isokinetic at a flight speed of 160 km h−1 ,               scattering measurements at the three wavelengths.
thus minimizing the inlet losses. The inlet flow was set to
10 L min−1 . It was mounted around 5 cm from the fuse-
lage just where the cockpit changes its shape. It was placed
around 1.5 m away in front of the leading edge of the wing

https://doi.org/10.5194/acp-21-431-2021                                                 Atmos. Chem. Phys., 21, 431–455, 2021
440 J. Yus-Díez et al.: Aircraft vertical profiles during REG and SDE scenarios over the NW Mediterranean basin
b. The asymmetry parameter (g) represents the probabil- 4 Results
ity of radiation being scattered in a given direction. The
range of values is [−1, 1] for backward (180◦ ) to for- 4.1 MSA and MSY in situ measurements
ward (0◦ ) scattering, respectively. A value of around
0.7 is employed in the climate models (Ogren et al., The time evolution of PM1 , PM10 concentrations, PM1/10 ra-
2006). The g was calculated from the backscatter frac- tios, BC, PM components (as measured by ACSM at MSY),
tions (BFs) using the semi-empirical formula provided σap , σsp , SAE, AAE, g and SSA measured at MSY and MSA
by Andrews et al. (2006). during the first 3 weeks of July 2015 is presented in Fig. 5 to-
2−
gether with the concentrations of major species (NO− 3 , SO4 ,
+
NH4 , EC, OM (organic matter; with an OM/OC ratio of
c. The absorption Ångström exponent (AAE) depends 2.1), mineral matter (MM; calculated as the sum of typi-
mostly on the chemical composition of sample parti- cal mineral oxides) and sea salt (SS; Na + Cl)) from offline
cles. For pure BC, typical AAE values range from 0.9 analysis of 24 h filters collected at MSY and MSA during
to 1.1 (Kirchstetter et al., 2004; Petzold et al., 2013). the days of the instrumented flights. Table 2 shows the mean
When brown carbon (BrC) or mineral dust are sampled values of surface PM1 , PM10 , PM1/10 , σsp 525 nm , σap 637 nm ,
together with BC, the AAE increases because both BrC SAE, AAE, SSA and g measured at the MSY and MSA sta-
and dust can efficiently absorb radiation in the ultravi- tions on 7, 8 and 14–16 July compared to the mean values
olet and blue region of the spectrum compared to the typically measured during SDE and REG pollution episodes
near-infrared (IR) (Kirchstetter et al., 2004; Chen and as reported by Pandolfi et al. (2014b) and Ealo et al. (2016).
Bond, 2010). The AAE was calculated as a linear esti- As shown in Fig. 5 an accumulation of pollutants took
mation in the log–log space using the multi-wavelength place from 4 to 8 July, as evidenced by the gradual increase of
absorption measurements from AE33. For the vertical concentrations of SO2− 4 , BC, OA (organic aerosol), PM, to-
profiles reported here, the AAE was calculated using the tal scattering and absorption coefficients. This accumulation
AE33 wavelengths for which the absorption measure- was favoured by the regional stagnation and vertical recircu-
ments were positive along the profile. For most profiles, lation of the air masses. Moreover, a Saharan dust outbreak
except for P3, which had all seven wavelengths avail- caused a progressive increase of PM10 at both stations, as
able, the AAE was calculated from 370 to 590 nm. well as a simultaneous PM1/10 ratio decrease (Fig. 5c and d).
The dust event had a larger impact at MSA, where the PM10
levels increased sharply and were higher compared to MSY.
d. The single-scattering albedo (SSA) reported here was
As reported in Table 2 and in Fig. 5, starting from 6 July, the
calculated as the ratio between the scattering and the ex-
PM10 concentrations were higher compared to average PM10
tinction coefficients at 525 nm. SSA indicates the poten-
usually measured during Saharan dust outbreaks at both sta-
tial of aerosols for cooling or warming the atmosphere.
tions. Then, the levels of pollutants, as well as the total scat-
tering and absorption coefficients, decreased on 9 July due to
e. The single-scattering albedo Ångström exponent the venting of the basin by an Atlantic north-western (ANW)
(SSAAE) was calculated by fitting the SSA retrieved at advection (not shown) that cleansed the northern area of the
the same Aethalometer wavelengths used to calculate IP (Gangoiti et al., 2006). This decrease was again sharper at
the AAE. For this, the SSA was obtained by extrapolat- MSA than at MSY due to the location of MSA at the top of
ing the total scattering to the AE33 wavelengths using a high mountain (Figs. 5c, d and S5). After this event, a new
the calculated SAE. SSAAE is a good indicator for the regional pollution episode occurred which favoured again the
presence of coarse particles (e.g. dust) when values accumulation of pollutants until the end of the campaign.
are < 0 (Collaud Coen et al., 2004; Ealo et al., 2016). Furthermore, according to NAAPS modelling outputs, rel-
atively high levels of smoke loads occurred in the air masses
affecting the study area on 14–16 July 2015 (Fig. 2).
f. The mass scattering cross section (MSC) is the ratio be- The intensive optical properties, i.e. SAE (Fig. 5g), AAE
tween the scattering and the PM concentration. It repre- (Fig. 5h), g (525 nm; Fig. 5i) and SSA (525 nm; Fig. 5j),
sents the scattering efficiency of the collected particles showed values consistent with the accumulation process and
per unit of mass. with the occurrence of the coarse Saharan dust particles,
as well as the effects of the wildfires occurring in the IP.
The SAE progressively decreased at both stations from val-
g. The mass absorption cross section (MAC) is the ratio ues > 1.5–2.0 (indicating the predominance of fine particles)
between the light absorption and the PM concentration. on 4 July to values < 1.0 (indicating the predominance of
It represents the absorption efficiency of the collected coarse particles) on 8 July 2015. The variability of g was
particles per unit of mass. less pronounced compared to the variability of the SAE, es-
pecially at MSA, likely because of the lower sensitivity of
Atmos. Chem. Phys., 21, 431–455, 2021 https://doi.org/10.5194/acp-21-431-2021J. Yus-Díez et al.: Aircraft vertical profiles during REG and SDE scenarios over the NW Mediterranean basin 441 Figure 5. Ground-based physical and chemical measurements at the MSA and MSY stations: (a) the evolution of submicron chemical composition as measured by the ACSM and the AE33; (b) the offline chemical analysis of 24 h quartz filters from both the MSA and MSY stations for the instrumented flights days; and (c, d) the temporal evolution of PM1 , PM10 and the PM1/10 ratio at MSY and MSA, respectively. The evolution during the measurement campaign of the scattering coefficient by the integrating nephelometer and the aerosol optical depth (AOD) by the ceilometer and sun/sky photometer and absorption by the MAAP are shown in (e) and (f); the evolution of the intensive optical properties such as the scattering Ångström exponent (SAE), from both the integrating nephelometer and columnar ceilometer and sun/sky-derived scattering (COL in the figure), the absorption Ångström exponent (AAE), the asymmetry parameter (g), and the single- scattering albedo (SSA at 525 nm) are shown in (g–j), respectively. The shadowed sections highlight the vertical-profile measurement periods with the aircraft. the g parameter to coarse PM compared to SAE (Pandolfi 2010). Interestingly, the AAE measured in the whole column et al., 2018). The AAE was considerably > 1.0 at both sites, with the sun photometer over MSA showed even larger val- reaching values > 1.5. The high AAE was due to enhanced ues, up to 2.5, until the evening of 8 July. The cleansing effect UV absorption, which typically is observed when brown car- of the ANW on 9 July caused a reduction of the PM loads bon (BrC) and/or mineral dust particles are present in the at- and consequently of the measured scattering and absorption mosphere (Kirchstetter et al., 2004; Fialho et al., 2005; San- coefficients at both sites. During this ANW flow the SAE in- dradewi et al., 2008; Alastuey et al., 2011; Chen and Bond, creased again to values of 1.5–2.0, whereas both the surface https://doi.org/10.5194/acp-21-431-2021 Atmos. Chem. Phys., 21, 431–455, 2021
442      J. Yus-Díez et al.: Aircraft vertical profiles during REG and SDE scenarios over the NW Mediterranean basin

Table 2. Mean values of in situ surface PM1 , PM10 , PM1/10 , σsp 525 nm , σap 637 nm , SAE, AAE, SSA and g measured at the MSY and MSA
stations during the SDE period of 7–8 July and the REG period of 14 and 16 July compared to the mean values typically measured (denoted
by “avg”) during SDE and REG episodes as reported by Pandolfi et al. (2014a) and Ealo et al. (2016).

                                              MSA                                                        MSY
                          SDE7−8         SDEavg   REG7−8             REGavg          SDE7−8         SDEavg   REG7−8            REGavg
 PM1 (µg m−3 )            9.7 ± 5.6     8.4 ± 4.7      7.1 ± 3.0     7.9 ± 3.9      14.1 ± 4.6    12.3 ± 5.4    14.0 ± 4.6    11.8 ± 5.7
 PM10 (µg m−3 )          30.8 ± 8.3   21.0 ± 17.0    19.8 ± 8.5     12.6 ± 7.0      33.2 ± 3.3   25.4 ± 17.0    23.8 ± 5.7    15.6 ± 8.0
 PM1/10 (%)            29.5 ± 10.1     39.6 ± 1.1   37.8 ± 10.8     46.2 ± 2.1    42.3 ± 13.6              –   60.0 ± 16.1             –
 σsp 525 nm (Mm−1 )    42.5 ± 11.2    53.6 ± 30.4   51.9 ± 10.9    47.0 ± 21.9    54.4 ± 14.9    60.2 ± 29.8   56.4 ± 12.8   50.6 ± 24.6
 σap 637 nm (Mm−1 )    4.53 ± 1.66    2.84 ± 0.03   5.03 ± 1.60    2.50 ± 0.03    4.89 ± 2.19    4.04 ± 2.27   4.42 ± 1.59   4.26 ± 2.35
 SAE                   1.25 ± 0.31    1.33 ± 0.61   1.56 ± 0.19    1.81 ± 0.30    1.05 ± 0.28    1.50 ± 0.53   1.03 ± 0.29   1.92 ± 0.31
 AAE                   1.46 ± 0.25    1.41 ± 0.25   1.29 ± 0.15    1.27 ± 0.24    1.26 ± 0.17    1.27 ± 0.24   1.23 ± 0.12   1.24 ± 0.19
 SSA                   0.88 ± 0.03    0.93 ± 0.06   0.89 ± 0.02    0.92 ± 0.05    0.90 ± 0.03    0.91 ± 0.03   0.90 ± 0.03   0.88 ± 0.04
 g                     0.58 ± 0.03    0.60 ± 0.05   0.60 ± 0.02    0.57 ± 0.05    0.55 ± 0.02    0.60 ± 0.04   0.62 ± 0.08   0.58 ± 0.25

and column-integrated AAE decreased due to the removal of              lar to that of BC, both reaching a maximum on the evening of
dust by the ANW cleansing effect. As already mentioned, af-            7 July, with two subsequent minor peaks at midnight and on
ter the ANW advection, another regional pollution episode              the evening of 8 July (Fig. 5). The peak just after midnight, at
developed until the end of the campaign.                               00:00 UTC on 8 July, was also reflected in the OA, NO−   3 and
   In the following sections, we present a detailed descrip-           NH+  4  concentrations. At  MSA,   ACSM   measurements    were
tion and interpretation of the evolution of pollutants and             not available; however the measured absorption showed a
aerosol optical parameters measured at MSY and MSA dur-                progressive increase on 8 July with a relative maximum be-
ing the SDE and REG period. The mean values of the consid-             ing reached in the afternoon (Fig. 5d), when AAE at MSA
ered pollutants and optical parameters during airborne mea-            reached values > 2.0 (Fig. 5). This sharp increase in BC was
surements are reported in Table 2, together with the mean              attributed to local biomass burning emissions (Fig. 2). Dur-
values typically registered during SDE outbreaks and REG               ing this first measurement period, the mean scattering and
episodes.                                                              absorption coefficients at both sites (Table 2) were above
                                                                       the averaged values registered at the MSA and MSY stations
4.1.1   Saharan dust event period, SDE                                 during dust and summer regional pollution events (Pandolfi
                                                                       et al., 2014b). Figure 5e also shows the high AOD from the
The attenuated backscatter from the ceilometer at MSA al-              MSA sun/sky photometer during the SDE period.
lowed for identifying the occurrence of aerosol layers up                 Table 2 shows that during this period the intensive param-
to 5 km a.g.l. (i.e. 5.8 km a.s.l.) in this period (Fig. 6). The       eters SAE, AAE, SSA and g reached values similar to the
air masses featured significant dust concentrations which              typical coarse-PM-influenced ones recorded during dust out-
were probably further accumulated in the region by the                 breaks at both stations (Pandolfi et al., 2014b). As already
regional vertical recirculation of air masses. Correspond-             pointed above, on the afternoon of 8 July a change due to
ingly, the PM10 mass concentrations measured at MSY and                local biomass burning emissions was observed in the optical
MSA were higher compared to the PM10 concentrations usu-               aerosol properties at MSA compared to MSY. As a conse-
ally measured in dust outbreaks (Table 2). Mineral matter              quence, the SAE and AAE at MSA increased to values > 1.5
concentrations during these days (Fig. 5b) reached 21 and              and 2.0, respectively.
15 µg m−3 at MSA and MSY, respectively. The OA occurred
in very similar concentrations at both sites (∼ 7 µg m−3 ).            4.1.2     Regional pollution episode, REG
Daily concentrations of SO2−    4    and EC from filters were
higher in the regional background (MSY) compared to the                An REG episode developed during the second aircraft mea-
continental one (MSA) due to the larger impact of regional             surement period leading to the accumulation of atmospheric
sources such as industries and road traffic and the emis-              aerosols in the area. A wildfire outbreak from northern Africa
sions from maritime shipping from the Mediterranean Sea                also took place (Fig. 2), as well as a light dust outbreak dur-
and the port of Barcelona. As expected, NO−     3 concentrations       ing 16 July (Figs. 2 and 5). The REG episode resulted in the
were rather low at both sites due to the thermal instability           development of aerosol layers at high altitude, as also ob-
of nitrate in summer (Harrison and Pio, 1983; Querol et al.,           served with the ceilometer at MSA (Fig. 6c and d). PM10
2001, 2004, 2009a).                                                    concentrations were rather constant and quite similar at both
   Figure 5a shows that the evolution of the SO2−  4 concentra-        MSA and MSY but on average lower than during the SDE
tion at the MSY station, as recorded by the ACSM, was simi-            period. Only on 16 July, PM10 concentrations at MSA, due

Atmos. Chem. Phys., 21, 431–455, 2021                                                       https://doi.org/10.5194/acp-21-431-2021
J. Yus-Díez et al.: Aircraft vertical profiles during REG and SDE scenarios over the NW Mediterranean basin 443 Figure 6. Time evolution of βatt vertical profiles as retrieved by the ceilometer deployed at the MSA station during the July 2015 measurement campaign for (a) 7, (b) 8, (c) 14 and (d) 16 July. The shadowed boxes highlight the measurements during the flights periods. to the impact of the dust outbreak at the altitude of the MSA to the MSY regional background could also explain the ob- station, were closer to an SDE scenario rather than an REG served difference. This could be due to a combination of fac- scenario (Table 2). This pattern was also reflected in the tors including a higher exposure of the MSA station to the high PM1/10 ratio measured from 10 July with the excep- fine PM from the wildfires, the lower impact of local and re- tion of the afternoon of 16 July at MSA when the PM1/10 ra- gional sources at MSA, and the larger segregation of particles tio was lower. The lower impact of the dust outbreak during during transport toward MSA due to its remote location. Dur- these days compared to the first period was confirmed by the ing REG, AAE decreased compared to the first period (espe- markedly lower MM from PM speciation analysis (Fig. 5b). cially at MSA), yet this was still > 1.0, indicating a mixing Despite the higher MM at MSA, those of the remaining PM10 of regional aerosols with BrC and mineral dust. AAE of the components and BC were similar at both sites. whole column (sun/sky photometer data) was also close or The scattering (Fig. 5e) and absorption coefficients slightly > 1.0. Finally, the SSA varied only slightly between (Fig. 5f) at both sites were above the average values (Ta- REG and SDE at both sites. ble 2) presented by Pandolfi et al. (2014a) and Ealo et al. (2016) for REG episodes, due to the strong accumulation of 4.2 In situ vertical profiles pollutants which took place from 10 July onward for this par- ticular REG episode. AOD (Fig. 5e) during REG was rather Here we focus on the vertical profiles obtained by means low when compared to the SDE period due to the absence of airborne measurements during the two distinct SDE and of dust, with the exception of 16 July, when AOD increased REG scenarios. Vertical profiles of optical extensive and in- simultaneously with the light dust outbreak and probably the tensive properties, as well as PM concentrations for upward influence of wildfire pollution plumes. and downward flights, are reported in Table 1. Our objective The asymmetry parameter g showed similar values to is to analyse the vertical-profile variation of these properties those observed during the SDE period at both sites and did and their diurnal and spatial evolution and how these proper- not change much during the dust event on 16 July because, as ties varied across layers in the troposphere. When possible, already observed, g is less sensitive to variations of coarse- direct comparison with the surface data measured at the MSA mode aerosols. Consequently, the relatively lower SAE on station was made. this day (especially visible at MSY) suggested variations in As reported above, the comparison of airborne measure- the larger end of the accumulation mode particles and above ments at 1.5 km a.s.l. with in situ surface measurements at rather than in the lower end of the mode. The lower SAE at MSA for P1 reached a good agreement (Table S1), with a MSY compared to MSA during REG (and especially during relative difference < 10 % for PM1 and PM2.5 concentrations 16 July) was then probably due to a relative reduction of PM1 and the extensive and intensive optical properties. The large at MSY compared to the previous days, whereas PM10 kept underestimation of PM2.5−10 , missing −47 % in the airborne similar values (Fig. 5) yet lower compared to the SDE period measurements, is the reason for excluding the PM10 fraction despite the light SDE event registered on 16 July (Table 2). from the vertical profiles. Consequently, we calculated the Moreover, the higher relevance of fine PM at MSA compared MSC and the MAC for PM2.5 . https://doi.org/10.5194/acp-21-431-2021 Atmos. Chem. Phys., 21, 431–455, 2021
You can also read