Aerosol responses to precipitation along North American air trajectories arriving at Bermuda
←
→
Page content transcription
If your browser does not render page correctly, please read the page content below
Atmos. Chem. Phys., 21, 16121–16141, 2021
https://doi.org/10.5194/acp-21-16121-2021
© Author(s) 2021. This work is distributed under
the Creative Commons Attribution 4.0 License.

Aerosol responses to precipitation along North American air
trajectories arriving at Bermuda
Hossein Dadashazar1 , Majid Alipanah2 , Miguel Ricardo A. Hilario3 , Ewan Crosbie4,5 , Simon Kirschler6,7 ,
Hongyu Liu8 , Richard H. Moore4 , Andrew J. Peters9 , Amy Jo Scarino4,5 , Michael Shook4 , K. Lee Thornhill4 ,
Christiane Voigt6,7 , Hailong Wang10 , Edward Winstead4,5 , Bo Zhang8 , Luke Ziemba4 , and Armin Sorooshian1,3
1 Department    of Chemical and Environmental Engineering, University of Arizona, Tucson, AZ, USA
2 Department    of Systems and Industrial Engineering, University of Arizona, Tucson, AZ, USA
3 Department of Hydrology and Atmospheric Sciences, University of Arizona, Tucson, AZ, USA
4 NASA Langley Research Center, Hampton, VA, USA
5 Science Systems and Applications, Inc., Hampton, VA, USA
6 Institute for Atmospheric Physics, DLR, German Aerospace Center, Oberpfaffenhofen, Germany
7 Institute for Atmospheric Physics, University of Mainz, Mainz, Germany
8 National Institute of Aerospace, Hampton, VA, USA
9 Bermuda Institute of Ocean Sciences, 17 Biological Station, St. George’s, GE01, Bermuda
10 Atmospheric Sciences and Global Change Division, Pacific Northwest National Laboratory, Richland, WA, USA

Correspondence: Hossein Dadashazar (hosseind@arizona.edu)

Received: 6 June 2021 – Discussion started: 22 June 2021
Revised: 24 September 2021 – Accepted: 30 September 2021 – Published: 2 November 2021

Abstract. North American pollution outflow is ubiquitous          was comparable between high- and low-APT conditions ow-
over the western North Atlantic Ocean, especially in winter,      ing to enhanced local wind and sea salt emissions in high-
making this location a suitable natural laboratory for investi-   APT conditions. The greater sensitivity of the fine-mode vol-
gating the impact of precipitation on aerosol particles along     ume concentrations (versus coarse mode) to wet scaveng-
air mass trajectories. We take advantage of observational data    ing is evident from AErosol RObotic NETwork (AERONET)
collected at Bermuda to seasonally assess the sensitivity of      volume size distribution data. A combination of GEOS-
aerosol mass concentrations and volume size distributions         Chem model simulations of the 210 Pb submicron aerosol
to accumulated precipitation along trajectories (APT). The        tracer and its gaseous precursor 222 Rn reveals that (i) surface
mass concentration of particulate matter with aerodynamic         aerosol particles at Bermuda are most impacted by wet scav-
diameter less than 2.5 µm normalized by the enhancement           enging in winter and spring (due to large-scale precipitation)
of carbon monoxide above background (PM2.5 /1CO) at               with a maximum in March, whereas convective scavenging
Bermuda was used to estimate the degree of aerosol loss dur-      plays a substantial role in summer; and (ii) North American
ing transport to Bermuda. Results for December–February           222 Rn tracer emissions contribute most to surface 210 Pb con-

(DJF) show that most trajectories come from North America         centrations at Bermuda in winter (∼ 75 %–80 %), indicating
and have the highest APTs, resulting in a significant reduc-      that air masses arriving at Bermuda experience large-scale
tion (by 53 %) in PM2.5 /1CO under high-APT conditions            precipitation scavenging while traveling from North Amer-
(> 13.5 mm) relative to low-APT conditions (< 0.9 mm).            ica. A case study flight from the ACTIVATE field campaign
Moreover, PM2.5 /1CO was most sensitive to increases in           on 22 February 2020 reveals a significant reduction in aerosol
APT up to 5 mm (−0.044 µg m−3 ppbv−1 mm−1 ) and less              number and volume concentrations during air mass transport
sensitive to increases in APT over 5 mm. While anthro-            off the US East Coast associated with increased cloud frac-
pogenic PM2.5 constituents (e.g., black carbon, sulfate, or-      tion and precipitation. These results highlight the sensitivity
ganic carbon) decrease with high APT, sea salt, in contrast,      of remote marine boundary layer aerosol characteristics to

Published by Copernicus Publications on behalf of the European Geosciences Union.

16122                                                               H. Dadashazar et al.: Aerosol responses to precipitation

precipitation along trajectories, especially when the air mass      studies have investigated how composition at Bermuda varies
source is continental outflow from polluted regions like the        based on air mass trajectories (Miller and Harris, 1985; Cut-
US East Coast.                                                      ter, 1993; Huang et al., 1996), the subject of how precipi-
                                                                    tation along those trajectories impacts the resultant aerosol
                                                                    at Bermuda has not been adequately addressed but is moti-
                                                                    vated by past works (Moody and Galloway, 1988; Todd et
1   Introduction                                                    al., 2003).
                                                                       In their recent aerosol climatology study for Bermuda,
Aerosol properties are difficult to characterize in remote ma-      Aldhaif et al. (2021) found the peculiar result that fine par-
rine regions owing to the scarcity of monitoring stations com-      ticulate pollution in the winter months (December–February)
pared to over land. Island observatories are critical resources     was reduced even though there was an enhanced number den-
to investigate long-range transport of aerosol particles and        sity of air mass back trajectories traced back to North Amer-
their associated properties (e.g., Silva et al., 2020). The west-   ica. They hypothesized that enhanced seasonal cloud frac-
ern North Atlantic Ocean (WNAO) includes the island of              tions and precipitation in winter (Painemal et al., 2021) con-
Bermuda, which has a rich history of monitoring data for            tribute to the removal of aerosol particles during transport via
both surface and columnar aerosol characteristics, thus af-         wet scavenging, which we aim to study more deeply here us-
fording the opportunity to study how aerosol properties are         ing a variety of datasets. Results of this study have broad rel-
impacted by different sources and processes along the trans-        evance to all remote marine regions impacted by transported
port of air masses to the site. Consequently, Bermuda has           continental pollution, in addition to advancing knowledge of
been the subject of decades of intense atmospheric science          how precipitation can impact surface aerosol characteristics.
research (Sorooshian et al., 2020), as it is a receptor site for
both North African dust (Chen and Duce, 1983) and anthro-
pogenic outflow from both North America (Arimoto et al.,            2     Datasets and methods
1992; Galloway et al., 1989; Moody et al., 2014; Corral et
al., 2021) and Europe (Anderson et al., 1996; Cutter, 1993).        Datasets used in this work are summarized in Table 1 and
North American outflow reaching Bermuda has been linked             briefly described below.
to appreciable levels of anthropogenic species (e.g., sulfate,
lead, elemental carbon, ozone) (Wolff et al., 1986), more           2.1    Bermuda surface measurements
acidic rainfall compared to other air mass sources (Jickells
et al., 1982), and a significant reduction of sulfate levels in     Aerosol and gas measurements were conducted at Fort
both aerosol and wet deposition samples in response to re-          Prospect in Bermuda (32.30◦ N, 64.77◦ W, 63 m a.s.l.).
duced SO2 emissions in recent decades (Keene et al., 2014).         Hourly PM2.5 data were collected with a Thermo Scien-
   There have been extensive studies reporting on some as-          tific TEOM 1400a ambient particulate monitor with 8500C
pect of air mass history, normally by calculating air parcel        FDMS (Federal Equivalent Method EQPM-0609-181 for
trajectories using transport and dispersion models, prior to        PM2.5 ). Concentrations were determined by employing con-
arrival at Bermuda (Sorooshian et al., 2020, and references         ditioned filter sample collection and direct mass mea-
therein), including predominant circulation patterns impact-        surements using an inertial micro-balance (TEOM 1400a).
ing Bermuda at different times of the year (e.g., Miller and        Hourly precision was ±1.5 µg m−3 . Hourly data were aver-
Harris, 1985; Veron et al., 1992). What remains uncertain           aged over 6 h intervals to match the time frequency of the
is how precipitation along those trajectories impacts surface       trajectory data discussed subsequently. The conversion of
aerosol characteristics at Bermuda. Wet scavenging rates are        hourly data to 6 h data also helps to mask, to some extent,
very difficult to constrain over open-ocean areas such as the       the unwanted effects of local sources and processes that oc-
WNAO (Kadko and Prospero, 2011) not only because of the             cur on a small timescale.
complexity of physical mechanisms in play but also scarce               PM10 concentrations were determined based on US En-
necessary field measurements. Overall, more work is war-            vironmental Protection Agency (EPA) method IO-2 (EPA,
ranted to better constrain wet scavenging of aerosol particles      1999) using a Tisch model TE6070 hi-volume air sampler,
along trajectories as such studies are sparse not only for the      equipped with 800 × 1000 (20.3 cm × 25.4 cm) TissuQuartz
WNAO but also for other regions (Tunved et al., 2013; Hi-           2500 QAT-UP quartz-fiber filters. The PM10 sampler was op-
lario et al., 2021). Arimoto et al. (1999) used aerosol radionu-    erated at a flow rate of 2.1 m3 min−1 , yielding a total volume
clide data in relation to airflow pattern information to con-       of 3000 m3 over a 24 h sampling period. The sampler flow
clude that pollutant transport to Bermuda is common from            rate was calibrated every 3 months. Sampling was synchro-
the northwest and that precipitation scavenging can be influ-       nized with the 1-in-6 d national ambient air quality schedule
ential; their analysis of rain effects on nuclide activities were   used by the EPA. Prior to deployment, the filters were equi-
based on rain data collected at Bermuda without knowledge           librated for 24 h in an environmental control chamber main-
of precipitation transport history prior to arrival. While many     taining constant conditions of relative humidity (35 ± 2 %)

Atmos. Chem. Phys., 21, 16121–16141, 2021                                           https://doi.org/10.5194/acp-21-16121-2021
H. Dadashazar et al.: Aerosol responses to precipitation 16123
and temperature (21 ± 2 ◦ C). The filters were then weighed
Table 1. Summary of datasets used in this work. Data are between 1 January 2015 and 31 December 2019, with the exception of ACTIVATE aircraft data based on a single flight day
with a precision of ±0.1 mg using a Mettler Toledo AB104
balance, which was modified for weighing unfolded 800 × 1000
(20.3 cm × 25.4 cm) filters, and then transferred to clean re-
sealable plastic bags for transportation to the field site. After
Time resolution
sampling, the exposed filters were returned immediately to
the laboratory where they were re-equilibrated in the envi-
Hourly
Hourly
Hourly
Hourly
Hourly
Hourly
Hourly
Hourly
Hourly
Hourly
ronmental control chamber for 24 h before being reweighed
on 22 February 2020. Section 2 provides more details about the datasets used in this study, including specific instruments from the ACTIVATE airborne dataset.
1–45 s
Daily
to determine the particle loading from which particle concen-
trations were calculated. PM10 determinations have an accu-
racy of within ±2.5 %, which is equivalent to ±0.2 µg m−3
Spatial resolution
–
–
–
–
–
–
(long.) × 0.5◦ (lat.)
(long.) × 0.5◦ (lat.)
(long.) × 0.5◦ (lat.)
(long.) × 0.5◦ (lat.)
–
1◦ × 1◦
based on the average of PM2.5 between 2015 and 2019 (i.e.,
6.7 µg m−3 ).
Various gases were monitored with hourly time resolution
using a model T200U trace-level NO/NO2 /NOx analyzer
(Teledyne API), which is a US EPA compliance analyzer
0.625◦
0.625◦
0.625◦
0.625◦
relying on a proven chemiluminescence principle. The gas
analyzer was routinely calibrated using NIST-certified cali-
brant NO2 in ultrahigh-purity nitrogen (Airgas, Inc., Radnor
Township, PA, USA). Acceptable criteria applied for single-
Airborne: ACTIVATE
Fort Prospect station
Fort Prospect station
Fort Prospect station
Fort Prospect station
Fort Prospect station
point quality control (QC) allow for ±15.1 % or < ±1.5 ppb
difference, whichever is greater (40 CFR Part 58 App A
Sect. 3.1.1). Similar to PM2.5 , these hourly gas data were
Data source
AERONET
MERRA-2
MERRA-2
MERRA-2
MERRA-2
averaged to 6 h resolution.
GDAS
There were a few periods when data were missing, with the
longest one being between 11 January and 8 April 2016 for
the gases and also between 16 October 2017 and 20 January
APT (rain)
2018 for PM2.5 . There was no major discontinuity in PM10
Acronym
WindSF
PBLH
sampling. Table S1 in the Supplement reports the number
PM2.5
PM10
VSD
NO2
NOx
NO
CO
of data points available for various seasons from the surface
–
–
measurements at Fort Prospect in Bermuda.
Particulate matter mass concentration (aerodynamic diameter less than 2.5 µm)
Columnar aerosol data were obtained from a NASA
Particulate matter mass concentration (aerodynamic diameter less than 10 µm)
AErosol RObotic NETwork (AERONET) (Holben et al.,
1998) surface station at Tudor Hill (32.264◦ N, 64.879◦ W).
Level 2 daily data have been quality-assured and cloud-
screened based on the version 3 algorithm (Giles et al.,
2019). We focus on the volume size distribution (VSD) prod-
uct that has 22 logarithmically equidistant discrete radii rang-
ing from 0.05 to 15 µm. A radius of 0.6 µm typically discrimi-
nates between fine and coarse modes when using AERONET
data (Dubovik et al., 2002; Schuster et al., 2006).
Aerosol speciated surface mass concentrations
Carbon monoxide surface concentration
3 Reanalysis data
Nitrogen monoxide concentration
Planetary boundary layer height
Modern-Era Retrospective analysis for Research and
Nitrogen dioxide concentration
Nitrogen oxide concentration
Applications-Version 2 (MERRA-2) (Gelaro et al., 2017)
Aerosol–cloud properties
products were used as a data source for speciated aerosol and
Volume size distribution
gas parameters including surface mass concentration of sea
Surface wind speed
salt (collection tavg1_2d_aer_Nx) and surface concentration
of carbon monoxide (CO; collection tavg1_2d_chm_Nx).
Precipitation
Surface wind speed and planetary boundary layer height
Parameter
(PBLH) (collection tavg1_2d_flx_Nx) data were also ob-
tained from MERRA-2. Hourly and 3-hourly data were
downloaded and averaged for a 0.5◦ latitude by 0.625◦ lon-
https://doi.org/10.5194/acp-21-16121-2021 Atmos. Chem. Phys., 21, 16121–16141, 2021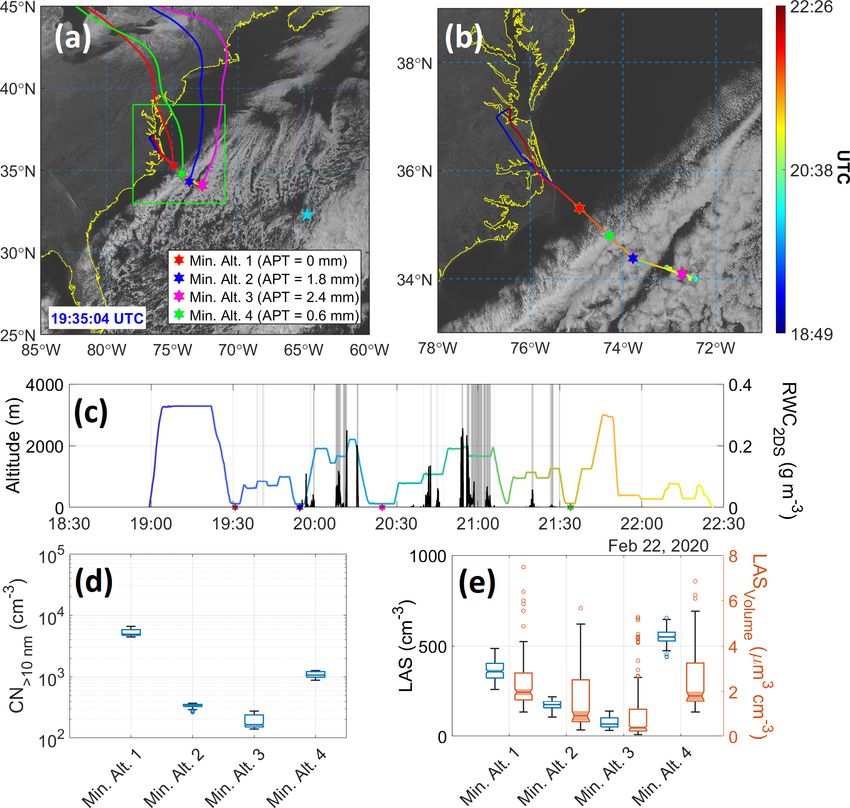
16124 H. Dadashazar et al.: Aerosol responses to precipitation
gitude grid (i.e., 32–32.5◦ N and 64.375–65◦ W) surround- demonstrated that there is some level of disagreement be-
ing Bermuda and subsequently averaged over 6 h intervals tween precipitation datasets.
to match the time frequency of trajectory analysis results. It
should be noted that MERRA-2 data were temporally and 3.1.1 Concentration-weighted trajectory analysis and
spatially coincident with the ending point of trajectories over seasonal rain maps
Bermuda. The Global Data Assimilation System (GDAS) 1◦
archive data were used for trajectory calculations explained Concentration-weighted trajectories (CWTs) were calculated
in the subsequent section. Precipitation data were also ob- based on the 10 d back trajectories from HYSPLIT in con-
tained along the trajectories based on GDAS 1◦ data. junction with Bermuda surface PM2.5 data described in
Sect. 2.1. The CWT method has been implemented widely
3.1 Air mass trajectory analysis to identify long-range pollutant transport pathways impact-
ing a receptor site (Hsu et al., 2003; Wang et al., 2009; Hi-
To track air mass pathways arriving at Bermuda (32.30◦ N, lario et al., 2020). Seasonal maps of average precipitation ex-
64.77◦ W), we obtained 10 d (240 h) back trajectories from perienced by trajectories were also estimated based on 10 d
the Hybrid Single-Particle Lagrangian Integrated Trajectory back trajectories from HYSPLIT. The aforementioned anal-
model (HYSPLIT) (Stein et al., 2015; Rolph et al., 2017). yses were performed for 0.5◦ × 0.5◦ grids covering the area
We used an ending altitude of 100 m (a.g.l.) to be within encompassed by 10–80◦ N and 5–170◦ W. A weight function
the surface layer and close to the measurement site. As dis- (Wij in Eq. 1) following the method of Dimitriou et al. (2015)
cussed later, sensitivity analysis with higher ending altitudes was applied in the CWT analysis and precipitation maps to
(500 m and 1 km; Figs. S1–S2 in the Supplement) reveals re- increase statistical stability. In Eq. (1), navg is the average
sults similar to using 100 m. Four trajectories were initial- number of trajectory endpoints per individual grid cell over
ized (i.e., 6 h interval) each day between 1 January 2015 at the study region excluding cells with zero trajectory points,
00:00:00 UTC and 31 December 2019 at 18:00:00 UTC, re- and nij is the number of trajectory endpoints that lie in the
sulting in a total of 7304 individual trajectories. Trajectories grid cell (i, j ).
were calculated using the GDAS 1◦ archive data and with
1 nij > 3 navg
the “model vertical velocity” method, which means verti-
0.7 1.5 navg < nij < 3 navg
cal motions were handled directly using meteorological data Wij = (1)
0.4 navg < nij < 1.5 navg
files. Moreover, accumulated precipitation along trajectories
0.2 nij < navg
(APT) was calculated by integrating surface precipitation
data from GDAS throughout the transport to the receptor site. 10 d back trajectories were implemented for generating CWT
As GDAS precipitation data correspond to the surface level, and rain maps to illustrate potential distant sources impact-
it should be noted that APT values presented in this study are ing Bermuda. But for more quantitative analyses presented
associated with the potential maximum level of precipitation in the subsequent sections focused on transport most rele-
experienced by the air parcel through its transport journey. vant to the WNAO region, 4 d back trajectories were used by
Results presented in Figs. 1–3 are based on 10 d back trajec- simply truncating 10 d trajectories. The use of 4 d trajecto-
tories, whereas analyses presented in the remaining sections ries reduces the uncertainties associated with trajectory cal-
of the paper are based on 4 d (96 h) back trajectories. culations in comparison to using 10 d trajectories and also
Trajectory analyses contain errors that originate from fac- enables us to focus on sources closer to the receptor site.
tors including, but not limited to, the choice of input me-
teorological data, resolution of input data, and the vertical 3.1.2 Trajectory clustering
transport method used in trajectory calculations (Stohl et al.,
1995; Cabello et al., 2008; Engström and Magnusson, 2009). Hierarchical agglomerative clustering was used to identify
Although the choice of meteorological data is the most im- characteristic trajectories reaching Bermuda at 100 m (a.g.l.).
portant contributor to the uncertainties associated with tra- Hierarchical clustering was based on the “complete link-
jectories calculations (Gebhart et al., 2005), no particular age” method (Govender and Sivakumar, 2020). 4 d HYS-
dataset has been found to be superior in terms of yielding the PLIT back trajectories were used to perform clustering analy-
lowest error. While in this study we used GDAS data, which sis. Distances between trajectories were calculated using the
have been widely used as an input dataset for trajectory cal- Haversine formula, which calculates the distance between
culations even in regions with complicated topography (e.g., two points on Earth assuming they are on a great circle (Sin-
Tunved et al., 2013; Su et al., 2015), the aforementioned in- nott, 1984). The distance between any two trajectories was
herent errors should not be overlooked when interpreting the calculated as the sum of distances between trajectory end-
results presented in this work. Another factor that can con- points. Subsequently, clustering was conducted based on the
tribute to the uncertainties for the results presented in this symmetric distance matrix, which includes the distances be-
work is the use of GDAS as the source of precipitation data, tween all pairs of trajectories. Clustering was performed for
as previous works (Sun et al., 2018; Nogueira, 2020) have varying numbers of clusters ranging between 2 and 32. The
Atmos. Chem. Phys., 21, 16121–16141, 2021 https://doi.org/10.5194/acp-21-16121-2021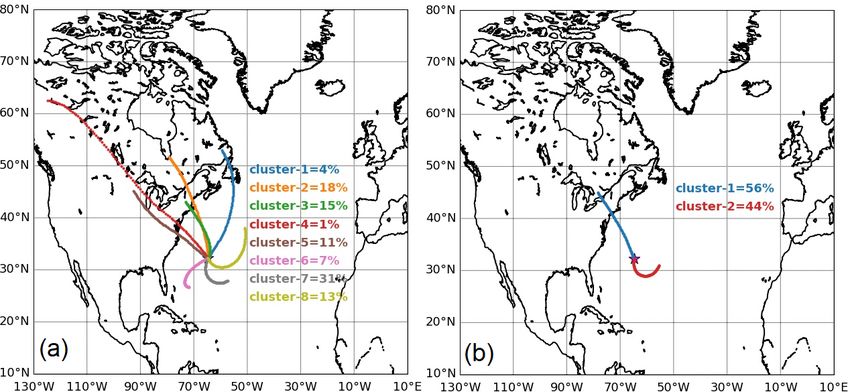
H. Dadashazar et al.: Aerosol responses to precipitation 16125
L-method (Kassomenos et al., 2010) was implemented to scavenging in affecting seasonal surface aerosol concentra-
identify the optimum number of clusters. In this method, tions at Bermuda.
root mean square deviation (RMSD) was calculated for each GEOS-Chem (http://www.geos-chem.org, last access: 27
clustering run and then plotted versus the number of clusters October 2021) is a global 3-D chemical transport model
to determine the optimum solution. RMSDs were estimated driven by meteorological fields from the Goddard Earth
based on the distances between trajectories and associated Observing System (GEOS) of the NASA Global Modeling
mean cluster trajectories. and Assimilation Office (Bey et al., 2001; Eastham et al.,
2014). It has been widely used to study trace gases and
3.2 Airborne measurements aerosols in the atmosphere. Here we use the model ver-
sion 11-01 (http://wiki.seas.harvard.edu/geos-chem/index.
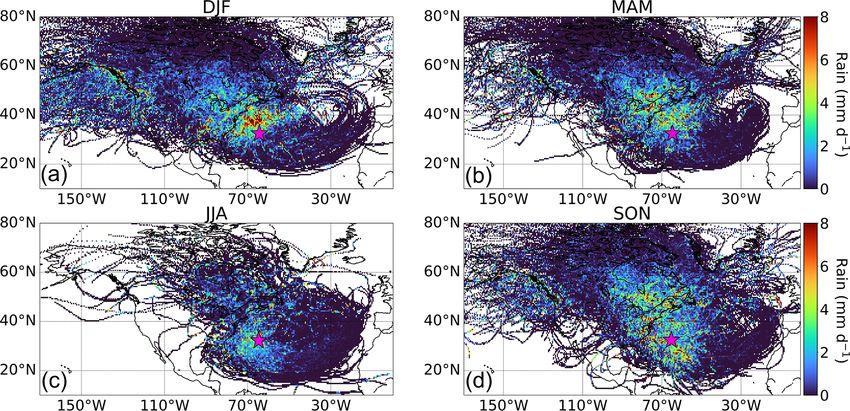
Airborne data from the Aerosol Cloud meteorology Inter- php/GEOS-Chem_v11-01, last access: 27 October 2021)
actions oVer the western ATlantic Experiment (ACTIVATE) driven by the MERRA-2 reanalysis (at 2.5◦ longitude by
are used from Research Flight 6 (RF6) on 22 February 2020. 2◦ latitude resolution) to simulate 222 Rn and 210 Pb. The
ACTIVATE involves two NASA Langley aircraft (HU-25 model simulates the emission, transport (advection, convec-
Falcon and UC-12 King Air) flying in coordination at differ- tion, boundary layer mixing), deposition, and decay of the ra-
ent altitudes to simultaneously characterize the same vertical dionuclide tracers (Liu et al., 2001; Brattich et al., 2017; Yu
column with a focus on aerosol–cloud–meteorology interac- et al., 2018; Zhang et al., 2021). As a function of latitude, lon-
tions (Sorooshian et al., 2019). RF6 was a rare case of the gitude, and month, 222 Rn emission uses a customized emis-
HU-25 Falcon flying alone, but this aircraft conveniently in- sion scenario that was built upon previous estimates and eval-
cluded measurements relevant to this study. The ACTIVATE uated against global 222 Rn surface observations and verti-
strategy involves the HU-25 Falcon flying in the boundary cal profile measurements (Zhang et al., 2021). GEOS-Chem
layer to characterize gas, aerosol, cloud, and meteorologi- uses the TPCORE advection algorithm of Lin and Rood
cal parameters along the following level legs: min. alt. in- (1996), calculates convective transport using archived con-
dicates the lowest altitude flown (∼ 150 m), BCB is below vective mass fluxes (Wu et al., 2007), and uses the nonlo-
cloud base, ACB is above cloud base, BCT is below cloud cal boundary layer mixing scheme implemented by Lin and
top, and ACT is above cloud top. McElroy (2010). The wet deposition scheme follows that of
Data from the following instruments were used: condensa- Liu et al. (2001) and includes rainout (in-cloud scavenging)
tion particle counter (CPC; TSI model 3772) for number con- due to large-scale (stratiform and anvil) precipitation, scav-
centration of particles with diameter > 10 nm; scanning mo- enging in convective updrafts, and washout (below-cloud
bility particle sizer (SMPS; TSI model 3081) for aerosol size scavenging) by precipitation (Wang et al., 2011). A modi-
distribution data between 3.2 and 89.1 nm; laser aerosol spec- fication to the large-scale precipitation scavenging scheme is
trometer (LAS; TSI model 3340) for aerosol size distribution included to use spatiotemporally varying cloud water con-
data between diameters of 0.09 and 5 µm; two-dimensional tents from MERRA-2 instead of a fixed constant value in the
optical array imaging probe (2DS; SPEC Inc.) (Lawson et al., original model (Luo et al., 2019). Dry deposition is based on
2006) for rain water content (RWC) quantified by integrat- the resistance-in-series scheme of Wesely (1989).
ing raindrop size distributions between diameters of 39.9 and
1464.9 µm; and fast cloud droplet probe (FCDP; SPEC Inc.)
(Knop et al., 2021) for cloud liquid water content (LWC) cal- 4 Results and discussion
culated by integrating drop size distributions between diam-
eters of 3 and 50 µm. With the exception of SMPS data (45 s 4.1 Seasonal profiles
resolution), all airborne data were at 1 s resolution.
4.1.1 Back trajectories
3.3 Radionuclide tracers in the GEOS-Chem model
Our results in Fig. 1 show that the summer months (June–
Lead-210 (210 Pb, half-life 22.3 years) is the decay daugh- August, JJA) are distinct due to the Bermuda High, promot-
ter of radon-222 (222 Rn, half-life 3.8 d) emitted mainly from ing easterly winds at latitudes south of Bermuda that turn
land surfaces. After production, it indiscriminately attaches north and become southwesterly (approximately parallel to
to ambient submicron particles, which move with the air until the US East Coast) towards Bermuda. The Bermuda high-
being scavenged by precipitation or deposited to the surface. pressure system and its associated anticyclonic circulation
Because of its relatively well-known source and wet deposi- in the boundary layer have been reported to be strongest in
tion as its principal sink, 210 Pb has long been used to test wet April–September (Merrill, 1994; Moody et al., 1995). This
deposition processes in global models (e.g., Liu et al., 2001). high-pressure system breaks down in other months in fa-
It is also a useful tracer to describe continental air influence vor of strengthened extratropical subpolar low pressure, thus
over oceans. In this study, we use 210 Pb as simulated by the yielding more air influence from the northwest and west
GEOS-Chem model to investigate the role of precipitation (Arimoto et al., 1995; Davis et al., 1997), which is clearly
https://doi.org/10.5194/acp-21-16121-2021 Atmos. Chem. Phys., 21, 16121–16141, 2021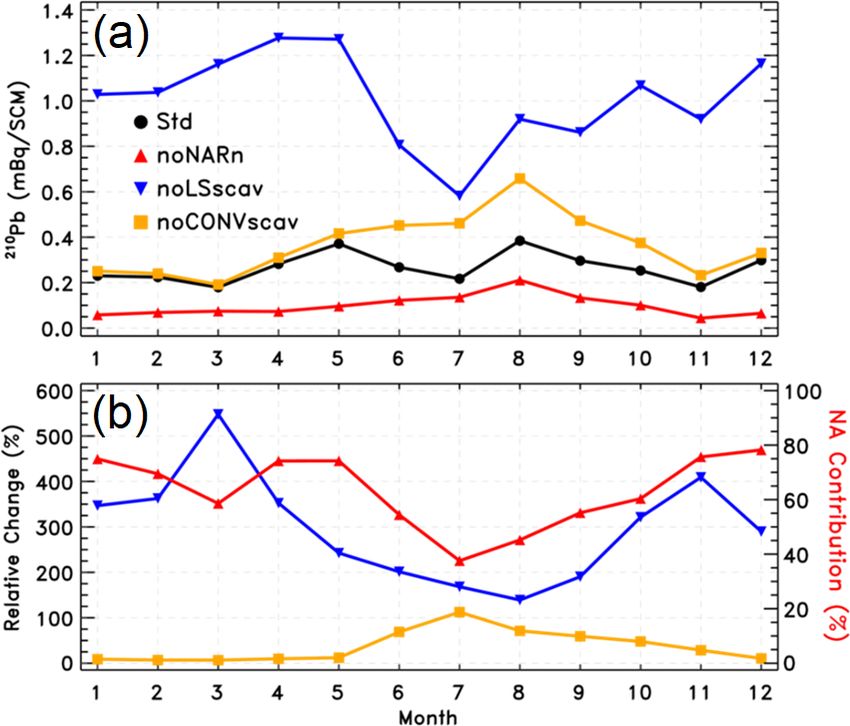
16126                                                            H. Dadashazar et al.: Aerosol responses to precipitation

evident in the other three seasonal panels in Fig. 1 and         sea salt and non-sea-salt species (e.g., Galloway et al., 1988).
most pronounced in the winter months (December–February,         The island had a population of approximately 64 000 as of
DJF). In their analysis of air mass history leading to rain      2016 (Government of Bermuda, 2019). Local influence from
events over Bermuda, Altieri et al. (2013) observed more in-     anthropogenic sources has been reported to be insignificant
fluence from air originating over water in warmer months         in contrast to transported pollution (Galloway et al., 1988;
(April–September) and faster-moving air masses originating       Keene et al., 2014). We assess how significant local anthro-
over the continental US, primarily in the colder months of       pogenic sources are based on day-of-week aerosol concentra-
October–March. Moody and Galloway (1988) also showed             tions and whether significantly higher levels exist on working
that cool months (October–March) were marked by more             days compared to weekend days as shown in other regions
transport from the US East Coast. It can be deduced from         with strong anthropogenic influence (Hilario et al., 2020, and
Fig. 1 that based on the farther-reaching source areas of the    references therein). Our analysis found negligible difference
back trajectories in colder months, especially DJF, air moves    between working days (Monday–Friday) and weekend days
faster in the boreal winter. Finally, we note that Figs. S1–S2   (Saturday–Sunday) for both PM2.5 and NOx when analysis
show the same results as Fig. 1 but with ending altitudes of     was done based on annual (Fig. S3b, d) or seasonal data
500 m and 1 km over Bermuda; the sensitivity tests indicate      (Figs. S4–S5). Therefore, it is less likely that local anthro-
the same general results, and thus we continue the discussion    pogenic emissions dominate the island’s PM2.5 and NOx ,
using results based on 100 m.                                    providing support for transported sources being more influ-
                                                                 ential; as will be shown, normalizing PM2.5 by CO helps con-
4.1.2   Surface aerosol and NOx                                  trol for local anthropogenic influence.
                                                                    We also examined seasonal and day-of-week statistics for
Recent work has shown a seasonal cycle over Bermuda for          PM10 to assess the relative importance of coarse aerosol
column-integrated aerosol properties, with aerosol optical       types including mainly sea salt and dust (Fig. S3e–f). Re-
depth (AOD) being highest in March–May (MAM) and JJA             sults reveal the highest median PM10 values (µg m−3 ) in DJF
and lowest in September–November (SON) and DJF (Ald-             (19.24), followed by MAM (18.51), JJA (17.98), and SON
haif et al., 2021). It was further shown that sea salt con-      (15.88). As will be shown later and already documented
tributed more to AOD in the colder months (SON, DJF),            (Aldhaif et al., 2021), surface wind speeds around Bermuda
whereas sulfate, organic carbon, black carbon, and dust were     are highest in DJF, contributing to higher sea salt emissions.
more dominant in MAM and JJA. In their examination of            Expectedly there was no observable PM10 weekly cycle as
aerosol type seasonality at Bermuda, Huang et al. (1999)         dust and sea salt are naturally emitted. Both PM2.5 and PM10
observed that marine and crustal elements peaked in win-         exhibited their highest seasonal standard deviations in JJA
ter and summer, respectively, and that pollution-derived par-    owing most likely to the episodic nature of some pollution
ticles dominated in spring with a smaller peak in fall. We       events such as dust and biomass burning (e.g., Aldhaif et al.,
use data from Fort Prospect station to gain a revised perspec-   2021).
tive about seasonality and the weekly cycle of surface layer
aerosol and additionally NOx (box notch plots in Fig. S3a–f).    4.1.3    Precipitation along trajectories
   Median seasonal concentrations of PM2.5 (µg m−3 ) were
as follows at Bermuda, being largely consistent with the         Figure 3 shows seasonal profiles of average precipitation rate
AOD seasonal cycle: DJF = 5.50, MAM = 6.36, JJA = 6.11,          obtained from GDAS (Table 1) in 0.5◦ × 0.5◦ grids based on
SON = 5.33 (Fig. S3). NOx exhibited a similar seasonal pat-      10 d back trajectories arriving at Bermuda (100 m a.g.l.). The
tern (ppbv): DJF = 17.76, MAM = 21.62, JJA = 18.68,              spatiotemporal pattern of precipitation over the WNAO is of
SON = 13.95 (Fig. S3). It is difficult to ascertain sources      the most interest in terms of potential impacts on wet scav-
and impacts of precipitation on PM2.5 based on these values.     enging of aerosol during the transport of North American
As a next step we present the seasonal CWT maps show-            pollution to Bermuda. In that regard, DJF shows the most
ing the predominant pathways accounting for the majority         pronounced levels of precipitation to the north and north-
of PM2.5 at Bermuda (Fig. 2). Expectedly, PM2.5 in JJA is        west of Bermuda over the WNAO, coincident with strong
largely accounted for by trajectories following the general      and frequent convection linked to frontogenesis (Painemal et
anticyclonic circulation already shown in Fig. 1c associated     al., 2021). This is consistent with how Painemal et al. (2021)
with the Bermuda High. These air masses are enriched with        showed that precipitation exhibits maximum levels over the
African dust as has been documented in many past studies         Gulf Stream path owing to relatively high sea surface tem-
(e.g., Arimoto, 2001; Huang et al., 1999; Muhs et al., 2012).    perature and strong surface turbulent fluxes.
In contrast, the other seasons (especially DJF and MAM)
showed greater relative influence from North American out-       4.2     Trajectory clustering
flow versus other source regions.
   While we focus on long-range transport of PM2.5 to            Prior to examining how precipitation directly impacts PM2.5
Bermuda, local sources cannot be ignored, including both         at Bermuda, we identify characteristic trajectory pathways

Atmos. Chem. Phys., 21, 16121–16141, 2021                                         https://doi.org/10.5194/acp-21-16121-2021
H. Dadashazar et al.: Aerosol responses to precipitation 16127
Figure 1. Seasonal maps (a–d) showing the probability density of trajectories calculated based on 10 d HYSPLIT backward trajectories
reaching Bermuda (32.30◦ N, 64.77◦ W), denoted by the pink star, at 100 m (a.g.l.). This analysis is based on trajectories between 1 Jan-
uary 2015 and 31 December 2019. Analogous results for ending altitudes of 500 m and 1 km are shown in Figs. S1 and S2, respectively.
Figure 2. Seasonal (a–d) concentration-weighted trajectory maps (CWTs) for PM2.5 measured at Fort Prospect in Bermuda, denoted by the
pink star. This analysis is based on trajectories between 1 January 2015 and 31 December 2019.
using the hierarchical agglomerative clustering method de- For the sake of simplicity of the remainder of the discus-
scribed in Sect. 2.3.2. We reiterate that this analysis is based sion, we reduced the number of characteristic trajectories to
on 4 d of back trajectories, rather than 10 d from Figs. 1–3, two (Fig. 4b) by conducting a new clustering analysis to have
to focus more on transport closer to Bermuda. The optimum one from North America and the other from the southeast.
solution based on the L-method (see Sect. 2.3.2) resulted in Using only two clusters increases the number of data points
eight trajectory clusters (Fig. 4a), with five (numbered 1–5) in the North American cluster for more robust calculations
coming from North America and the remaining three (num- of rain–aerosol relationships. Our choice to put together all
bered 6–8) more characteristic of the anticyclonic circulation North American air mass clusters in one group is aligned
already described for JJA. The five former clusters account with a similar clustering choice by Chen and Duce (1983; see
for 49 % of the total trajectories, with the latter three respon- their Fig. 3) wherein trajectories were grouped together from
sible for the remaining 51 %. The majority of trajectories Florida to the Canadian maritime provinces. Also, Mead et
from North America come offshore north of North Carolina al. (2013) divided trajectory data ending at Bermuda into
(i.e., coastal areas north of ∼ 35◦ N). “Saharan” and “non-Saharan” seasons that generally coin-
cide with our division of data into two clusters. Cluster 1
https://doi.org/10.5194/acp-21-16121-2021 Atmos. Chem. Phys., 21, 16121–16141, 202116128 H. Dadashazar et al.: Aerosol responses to precipitation Figure 3. Seasonal maps (a–d) of average precipitation occurring in 0.5◦ × 0.5◦ grids based on 10 d backward trajectories reaching Bermuda (32.30◦ N, 64.77◦ W; pink star) at 100 m (a.g.l.). This analysis is based on trajectories between 1 January 2015 and 31 December 2019. Figure 4. Cluster mean trajectories based on the (a) optimum solution having eight clusters and (b) a simplified solution with two clusters to enhance statistics for North American trajectories. Clustering was performed on 4 d HYSPLIT backward trajectories between 1 January 2015 and 31 December 2019. from North America accounts for 56 % of trajectories and of ppbv) as follows (Cluster 1/Cluster 2): DJF = 89.7/76.3; Cluster 2 from the southeast is linked to 44 % of trajectories. MAM = 88.5/75.0; JJA = 68.9/58.7; SON = 81.6/65.6. It is clear from the two clusters that the North American air Therefore, the combination of pollution outflow from North masses generally move faster as the characteristic 4 d back America and higher APT values makes Cluster 1 more rele- trajectories originate farther away from Bermuda than those vant in terms of identifying potential wet scavenging effects of Cluster 2. on transported aerosol over the WNAO. The remainder of the Regardless of season, Cluster 1 was associated with higher study thus focuses on Cluster 1. APT values, with the seasonal median values (millimeters) as follows (Cluster1/Cluster 2): DJF = 6.1/2.3; MAM = 4.3 North America trajectory results 5.2/1.8; JJA = 6.7/2.8; SON = 7.0/5.1. Figure 5 shows a box notch plot comparing APT between clusters for each We next examine the relationship between APT and aerosol season, demonstrating statistically significant differences in transport to Bermuda based on Cluster 1 results (Table 2). median values between clusters for a given season at 95 % We compare data for “low” and “high” APT values based on confidence. Furthermore, Cluster 1 exhibited higher CO lev- thresholds for the 25th percentile (< 0.9 mm) and 75th per- els at Bermuda for each season, with median values (units centile (> 13.5 mm), respectively, based on cumulative data Atmos. Chem. Phys., 21, 16121–16141, 2021 https://doi.org/10.5194/acp-21-16121-2021
H. Dadashazar et al.: Aerosol responses to precipitation                                                                         16129

                                                                        marker of anthropogenic pollution stemming from North
                                                                        America (Corral et al., 2021), (ii) being relatively insensitive
                                                                        to wet scavenging processes, and (iii) having a long lifetime
                                                                        in the atmosphere (∼ 1 month; Weinstock, 1969) compared
                                                                        to aerosol particles. Consequently, we normalize PM2.5 by
                                                                        1CO to quantify transport efficiency and to reveal the poten-
                                                                        tial effects of wet scavenging as has been done in past studies
                                                                        for other regions (Park et al., 2005; Garrett et al., 2010; Hi-
                                                                        lario et al., 2021; Matsui et al., 2011; Moteki et al., 2012;
                                                                        Oshima et al., 2012). We first determine the 5th percentile
                                                                        value of surface CO at Bermuda for each season for Cluster
                                                                        1 trajectories and assume those are the seasonal background
                                                                        values as also done by Matsui et al. (2011). We then calculate
                                                                        1CO as the difference between each 6-hourly CO data point
                                                                        at Bermuda and the background value for a given season. We
                                                                        only use data when 1CO > 3.2 ppbv to ensure a sufficiently
                                                                        high signal-to-noise ratio (Garrett et al., 2010).
                                                                           With the normalization technique, PM2.5 /1CO exhibits
                                                                        lower values in the high-APT category for each season com-
                                                                        pared to low-APT conditions (Fig. 6), with differences be-
Figure 5. Box notch plot for each season comparing accumulated          tween medians being statistically significant in DJF and
precipitation along trajectories (APT) for Clusters 1 (blue) and 2      MAM based on p value < 0.05 with a Wilcoxon rank-
(orange) from Fig. 4b. APT values were estimated from 4 d HYS-          sum test (Table 2). The DJF season exhibits the greatest
PLIT back trajectories reaching Bermuda (32.30◦ N, 64.77◦ W) at         reduction of this ratio (by 53 %) in high-APT conditions
100 m a.g.l. The middle, bottom, and top lines in each box represent    (0.29 µg m−3 ppbv−1 versus 0.62 µg m−3 ppbv−1 based on
the median, 25th percentile, and 75th percentile, respectively. Mark-   median values; Table 2). Therefore, these results suggest that
ers show extreme values identified based on 1.5× IQR (interquartile     it is plausible that wet scavenging has a marked impact on
range) distance from the top of each box. Whiskers represent max-       surface PM2.5 at a remote ocean site in the WNAO. This
imum and minimum values excluding extreme points. Boxes with            also helps support the speculation proposed by Aldhaif et
notches and shaded regions that do not overlap have different medi-
                                                                        al. (2021) that wet scavenging can reconcile why, in partic-
ans at the 95 % confidence level.
                                                                        ular for DJF, the high density of trajectories coming from
                                                                        North America correlates with a reduction in fine particulate
                                                                        pollution arriving at Bermuda compared to other seasons. It
from all seasons and years. As wet scavenging is expected               is noteworthy that the highest median value of PM2.5 /1CO
to reduce PM2.5 during its transport from North America                 was for the low-APT category of DJF, providing support for
to Bermuda, we anticipate lower PM2.5 values at high APT.               how that season has both a greater influence of aerosol trans-
However, the results indicate this is only the case for MAM             port from North America (when the precipitation scavenging
and JJA, with similar median values in SON and a higher                 potential is reduced during low-APT periods) and the great-
median value in DJF for high-APT conditions. Interestingly,             est sensitivity to the effects of precipitation over the WNAO
NO, NO2 , NOx , and CO were all significantly higher in                 owing to the widest range in this ratio’s value between high-
DJF for high-APT conditions too. This raises the issue that             and low-APT categories.
absolute PM2.5 concentrations should be normalized to ac-                  Figure 7 additionally shows the seasonal sensitivity of
count for the differences in concentration that existed closer          PM2.5 /1CO to APT based on four bins of APT (bin ranges
to North America prior to potential wet scavenging over the             shown in Table S3) chosen in such a way to provide simi-
WNAO.                                                                   lar numbers of data points per bin for each particular sea-
   To study the effects of wet removal processes on aerosol             son. We note that the general trends are preserved using sim-
particles during long-range transport to a receptor site, many          ilar bin ranges in each of the seasons. DJF and MAM show
studies have used aerosol concentrations normalized by the              the greatest reductions from the first to last bin as expected
concentration of an inert gaseous species co-emitted with               based on Table 2, but these were also the only two seasons
particles at distance sources. Such normalization is criti-             showing reductions between each successive bin. In con-
cal and superior to the use of only aerosol concentration               trast, SON and JJA exhibited more variable behavior, with
as the latter can be influenced by local sources that can               PM2.5 /1CO actually increasing between a pair of bins in
mask aerosol response to removal processes during long-                 each season. A number of reasons can potentially explain the
range transport. CO exhibits three important traits qualifying          less pronounced reduction in PM2.5 /1CO for SON and JJA:
it as a species to normalize PM2.5 by: (i) being a reliable             (i) lower values to begin with in the lowest APT bins (and

https://doi.org/10.5194/acp-21-16121-2021                                             Atmos. Chem. Phys., 21, 16121–16141, 2021
16130 H. Dadashazar et al.: Aerosol responses to precipitation
Table 2. Seasonal medians of aerosol, gas, and meteorological variables for Cluster 1 divided into high- and low-APT categories. Differences
in median values that are statistically significant (p value < 0.05) based on a Wilcoxon rank-sum test are highlighted with italic font. Per-
centage differences∗ between high- and low-APT median values are provided in parentheses. NO, NO2 , NOx , and PM2.5 are based on Fort
Prospect measurements, whereas all other parameters are from MERRA-2 with the exception of the two APT rows (derived from HYSPLIT
and GDAS) and the last eight rows corresponding to AERONET volume size distribution data. We combined all seasons for AERONET data
to have sufficient statistics for comparisons (high APT 16 points, low APT 19 points). AERONET parameters include volume concentration
(V ), effective radii (Reff ), volume median radii (R), and geometric standard deviation (σ ) with subscripts f and c for fine and coarse modes,
respectively. The number of data points for each table entry is summarized in Table S2.
High-rain (APT > 13.5 mm) / low-rain (APT < 0.9 mm) (% difference∗ )
Parameter DJF MAM JJA SON
NO (ppbv) 6.0/3.5 (71 %) 7.3/7.8 (–6 %) 8.3/13.1 (–37 %) 3.8/4.2 (–10 %)
NO2 (ppbv) 13.9/12.8 (9 %) 13.4/12.0 (12 %) 8.6/6.6 (30 %) 9.4/9.2 (2 %)
NOx (ppbv) 19.6/17.5 (12 %) 21.2/21.8 (–3 %) 17.4/23.3 (–25 %) 14.1/14.2 (–1 %)
CO (ppbv) 97.8/84.7 (15 %) 92.4/88.6 (4 %) 70.8/65.9 (7 %) 83.7/81.4 (3 %)
PM2.5 (µg m−3 ) 6.1/5.5 (11 %) 6.7/7.3 (–8 %) 5.9/7.8 (–24 %) 5.5/5.1 (8 %)
PM2.5 /1CO (µg m−3 ppbv−1 ) 0.29/0.62 (–53 %) 0.35/0.51 (–31 %) 0.32/0.37 (–14 %) 0.27/0.33 (–18 %)
Sea salt (µg m−3 ) 47.2/28.4 (66 %) 44.1/25.4 (74 %) 27.0/26.0 (4 %) 50.6/36.0 (41 %)
Sea saltPM2.5 (µg m−3 ) 6.2/4.0 (55 %) 6.2/4.1 (51 %) 4.9/4.9 (0 %) 6.8/5.0 (36 %)
Dust (µg m−3 ) 0.80/0.91 (–12 %) 2.32/3.03 (–23 %) 4.47/3.02 (48 %) 1.16/1.04 (12 %)
DustPM2.5 (µg m−3 ) 0.31/0.34 (–9 %) 0.79/1.00 (–21 %) 1.58/1.18 (34 %) 0.44/0.36 (22 %)
Sea salt/1CO (µg m−3 ppbv−1 ) 2.10/2.74 (–23 %) 2.54/1.70 (49 %) 1.50/1.58 (–5 %) 2.44/1.66 (47 %)
Sulfate/1CO (µg m−3 ppbv−1 ) 0.029/0.055 (–47 %) 0.041/0.052 (–21 %) 0.039/0.046 (–15 %) 0.024/0.027 (–11 %)
Dust/1CO (µg m−3 ppbv−1 ) 0.038/0.082 (–54 %) 0.129/0.186 (–31 %) 0.235/0.152 (55 %) 0.052/0.047 (11 %)
BC/1CO (µg m−3 ppbv−1 ) 0.0031/0.0056 (–45 %) 0.0042/0.0057 (–26 %) 0.0041/0.0049 (–16 %) 0.0032/0.0033 (–3 %)
OC/1CO (µg m−3 ppbv−1 ) 0.0093/0.0238 (–61 %) 0.0164/0.0276 (–41 %) 0.0225/0.0287 (–22 %) 0.0127/0.0153 (–17 %)
Sea saltPM2.5 /1CO (µg m−3 ppbv−1 ) 0.263/0.403 (–35 %) 0.352/0.262 (34 %) 0.284/0.298 (–5 %) 0.331/0.255 (30 %)
DustPM2.5 /1CO (µg m−3 ppbv−1 ) 0.015/0.033 (–55 %) 0.042/0.062 (–32 %) 0.087/0.053 (64 %) 0.018/0.017 (6 %)
WindSF (m s−1 ) 8.5/7.1 (20 %) 8.4/5.9 (42 %) 4.4/4.7 (–6 %) 7.7/6.6 (17 %)
APT6 h (mm) 0.1/0.0 (NaN) 0.0/0.0 (NaN) 0.0/0.0 (NaN) 0.0/0.0 (NaN)
APT (mm) 24.7/0.0 (NaN) 22.6/0.2 (11 200 %) 24.1/0.0 (NaN) 25.0/0.2 (12 400 %)
All
Vf /1CO × 104 (µm3 µm−2 ppbv−1 ) 3.42/7.55 (–55 %)
Reff-f (µm) 0.158/0.147 (7 %)
Rf (µm) 0.176/0.171 (3 %)
σf 0.471/0.470 (0 %)
Vc /1CO × 104 (µm3 µm−2 ppbv−1 ) 2.04/2.12 (–4 %)
Reff-c (µm) 1.956/2.085 (–6 %)
Rc (µm) 2.503/2.562 (–2 %)
σc 0.684/0.647 (6 %)
∗ % difference = Xhigh-rain −Xlow-rain × 100
Xlow-rain
thus lower potential for scavenging to occur), (ii) potential pairs of bins in DJF. Tunved et al. (2013) also reported a simi-
humidity effects associated with air masses at higher APT lar exponential trend between particle mass and accumulated
values promoting secondary aerosol formation (Huang et al., precipitation, with an initial rapid decrease in particle mass
2014; Quan et al., 2015; Ding et al., 2021), and (iii) more followed by a decreased removal rate of aerosol due to pre-
influence from natural emissions in the form of dust (es- cipitation.
pecially JJA) and sea salt (especially SON) (Aldhaif et al., We next address some additional details motivated by val-
2021). Another noteworthy result is that the season with the ues shown in Table 2. We examine three aerosol constituents
clearest scavenging signature (DJF) shows the most sensitiv- linked to anthropogenic outflow from North America, includ-
ity (i.e., steepest downward slope) between the first two APT ing sulfate, black carbon (BC), and organic carbon (OC),
bins (0.9 mm versus 4.3 mm) as there was a 26 % reduction from MERRA-2 reanalysis. We recognize that sulfate and
in PM2.5 /1CO (0.584 to 0.435 µg m−3 ppbv−1 ), resulting in OC have non-anthropogenic precursor vapors such as ocean-
a slope (units of µg m−3 ppbv−1 mm−1 ) of −0.044 in con- emitted dimethyl sulfide and biogenic volatile organic com-
trast to slopes of −0.007 and −0.006 for the two subsequent pounds, respectively. Being the most abundant of the three,
Atmos. Chem. Phys., 21, 16121–16141, 2021 https://doi.org/10.5194/acp-21-16121-2021H. Dadashazar et al.: Aerosol responses to precipitation 16131
Figure 7. Seasonal sensitivity of PM2.5 /1CO to APT for Cluster
1 trajectories, divided based on four APT bins that have a similar
number of data points per season. Markers denote median values,
and error bars represent the 95 % confidence interval for medians
based on a bootstrapping method (n = 100 000). Number of points
per marker: DJF = 192–194; MAM = 247–251; JJA = 107–110;
SON = 183–191.
Figure 6. Box notch plot for each season comparing the cluding the larger spatial scale covered by MERRA-2 com-
PM2.5 /1CO ratio for Cluster 1 trajectories for high-APT (blue) and pared to the point measurements at Fort Prospect. Previ-
low-APT (orange) conditions. APT thresholds are based on 25th ous analysis of precipitation scavenging ratios over Bermuda
(< 0.9 mm) and 75th (> 13.5 mm) percentiles of APT for all trajec- showed that larger aerosol types (e.g., sea salt) are removed
tories reaching Bermuda between 1 January 2015 and 31 December
more efficiently than smaller aerosol types (e.g., sulfate, ni-
2019. The number of samples in each group is placed on whiskers.
trate) (Galloway et al., 1993). Total sea salt and sea salt in
the PM2.5 fraction exhibited higher median concentrations
for the high-APT category (p value < 0.05) for all seasons
sulfate exhibits the same characteristics as PM2.5 when nor- except JJA, which had more comparable values. This can be
malized by 1CO, with the sharpest reduction at high-APT explained by how days experiencing high APT exhibited sig-
conditions in DJF, followed by MAM, and then finally by nificantly higher surface wind speeds around Bermuda for all
JJA and SON albeit with p values > 0.05 for the latter two seasons except JJA, for which wind speeds in general were
seasons compared to low-APT conditions. BC / 1CO ra- depressed. Therefore, the reduction of the PM2.5 /1CO ratio
tios show the same relative characteristics between APT cat- in high-APT conditions may actually be an underestimate of
egories as sulfate / 1CO for each season and mostly the wet scavenging of North American pollution outflow since
same for OC / 1CO except that the reduction in the median local sea salt is higher on windier days marked by high APT.
value in high-APT conditions for SON was significant (p To put this last assertion on firmer ground, we examined
value < 0.05). Regardless of season, but most pronounced local rain values as they could be influential in terms of scav-
in DJF, was the consistent result that OC/1CO exhibited enging the locally generated sea salt. The median values of
the highest relative reduction at high-APT conditions (versus local rain on high-APT days for each season based on APT
low-APT conditions) compared to BC and sulfate. Further for the most recent 6 h of trajectories arriving at Bermuda
work with more expansive observational data is needed to (APT6 h ) were 0.0–0.1 mm, while median values of APT6 h
better understand how different species respond to wet scav- on low-APT days were 0 mm in each season. The only signif-
enging. icant difference in median APT6 h values was in DJF when it
Normalization by 1CO was important for assessing trans- was 0.1 mm on high-APT days in contrast to 0.0 mm on low-
port efficiency of anthropogenic pollution, but we also con- APT days. Therefore, for DJF the slightly enhanced APT6 h
sidered dust and sea salt without 1CO normalization as they can possibly offset the greater sea salt emissions in terms of
are predominantly emitted by natural sources. Although out- impacting PM2.5 levels over Bermuda. Results for the other
side the scope of this study, we caution that MERRA-2 con- major natural aerosol type (dust) reveal much lower overall
centrations of sea salt in the PM2.5 fraction may exceed those concentrations compared to sea salt for both bulk sizes and
of total PM2.5 as measured at Fort Prospect (Table 2) owing the PM2.5 fraction. There was no consistent trend across the
to the inherent differences in the two respective datasets in- four seasons in terms of dust levels being higher for either the
https://doi.org/10.5194/acp-21-16121-2021 Atmos. Chem. Phys., 21, 16121–16141, 202116132 H. Dadashazar et al.: Aerosol responses to precipitation
low- or high-APT category, which is not unexpected as dust
is not a major aerosol type expected from North American
outflow (Yu et al., 2020; Corral et al., 2021).
4.3.1 Volume size distributions
We next examine AERONET volume size distribution (VSD)
relationships with APT. We normalize the volume concen-
tration data by corresponding 1CO in the same way as was
done for PM2.5 , with the same condition of using data only
when 1CO > 3.2 ppbv. A few cautionary details are first
noted about these data in comparison to APT: (i) there are
limited VSD data in the AERONET dataset, which is why
Figure 8. Volume size distributions (VSDs) normalized by 1CO for
we use all seasons of data together for Fig. 8 and Table 2; high-APT (> 13 mm; blue, n = 16) and low-APT (< 0.9 mm; red, n
(ii) AERONET data are representative of ambient conditions, = 19) groups for Cluster 1 trajectories. Thick curves correspond to
and changes in relative humidity can influence VSD profiles; medians, and shaded areas extend to the 25th and 75th percentiles.
and (iii) AERONET data are column-based and not necessar- VSDs are based on AERONET data between 1 January 2015 and
ily representative of only the surface layer where the trajecto- 31 December 2019.
ries end in our analysis of HYSPLIT data. Related to the last
point, past work noted that column optical properties over
Bermuda can be weakly correlated with such measurements scavenging effects and more to do with different times of the
at the surface (Aryal et al., 2014) due largely to aerosol layers year when the relative abundance of different coarse particle
aloft (Ennis and Sievering, 1990). At the same time, studies type changes.
have shown that there can be enhanced number and volume The AERONET results support the idea that scavenging
concentrations in the marine boundary layer versus the free on high-APT days efficiently removes fine particulate matter
troposphere over Bermuda (Horvath et al., 1990; Kim et al., but that there can still be appreciable levels of locally gener-
1990). ated sea salt due to higher local surface winds on high-APT
The median VSDs for both APT categories exhibit a bi- days. Related to the columnar nature of AERONET data, it
modal profile with a more dominant coarse mode, consis- is important to note that others have reported large-scale sub-
tent with what is already known for Bermuda based on sidence of pollution from the middle and upper troposphere,
AERONET data (Aldhaif et al., 2021). The unique aspect especially in spring, based on enhanced ozone mixing ratios
of this work is that in high-APT conditions, there is a re- at the surface of Bermuda (Oltmans and Levy, 1992; Cooper
duction in median volume concentration in the smaller mode et al., 1998; Milne et al., 2000; Li et al., 2002). Moreover,
between radii of 0.05 and ∼ 1 µm, with a slight enhancement this phenomenon is synoptically favorable with the transport
on the leading shoulder of the larger mode between radii of of North American polluted air behind cold fronts, especially
1.71 and 2.94 µm (Fig. 8). The greatest relative reductions in spring (Moody et al., 1995), and often linked to the lifting
in the fine mode, which is more indicative of transported of polluted air out of the boundary layer by convection over
continental pollution, occurred between midpoint radii of the continental US (Prados et al., 1999). It is unclear based
0.15 and 0.33 µm with relative reductions in those four bins on the current dataset how effective these events were in im-
(i.e., midpoint radii 0.15, 0.19, 0.26, and 0.33 µm) ranging pacting either the surface layer or columnar-based aerosol
from 38 % to 52 %. The coarse mode peaked at larger radii measurements at Bermuda.
(3.86 µm) in low-APT conditions relative to high-APT con-
ditions (2.94 µm). 4.4 GEOS-Chem model results
Table 2 reports VSD parameter values for the APT cat-
egories separated by fine and coarse modes. Although only We conduct four GEOS-Chem simulations of the 210 Pb sub-
significantly different based on 90 % confidence (p value micron aerosol tracer including (a) one standard simulation,
= 0.09), the fine-mode volume concentration normalized by (b) the same as the standard simulation but with the 222 Rn
1CO in the high-APT category was less than half (45 %) tracer emissions from the North American continent (25–
the value in the low-APT category. There were insignificant 60◦ N, 130–70◦ W) removed, (c) the same as the standard
differences between effective radii and volume median radii, simulation but without 210 Pb scavenging due to large-scale
in addition to the geometric standard deviation for the fine precipitation, and (d) the same as the standard simulation but
mode between APT categories. For the coarse mode, only the without 210 Pb scavenging by convective precipitation. The
geometric standard deviation exhibited a significant differ- difference between (a) and (b) quantifies the North American
ence by being higher in the high-APT category (0.684 versus contribution to atmospheric 210 Pb concentrations. The differ-
0.647), although we presume that has less to do with actual ence between (a) and (c) reflects the role of large-scale pre-
Atmos. Chem. Phys., 21, 16121–16141, 2021 https://doi.org/10.5194/acp-21-16121-2021You can also read