The Childhood Trust: London Child Poverty Report 2021
←
→
Page content transcription
If your browser does not render page correctly, please read the page content below
The Childhood Trust:
The Childhood Trust:
London
London         Child
       Child Poverty     Poverty
                     Report 2020 Report 2021
Written by Connor Trumpold, Eric Frasco and Eloise O’Carroll
Written
Edited byby  Connor
          Riley McNairTrumpold,   Eric
                       and Victoria    Frasco and Eloise O’Carroll
                                    Jones

Edited by Riley McNair and Victoria Jones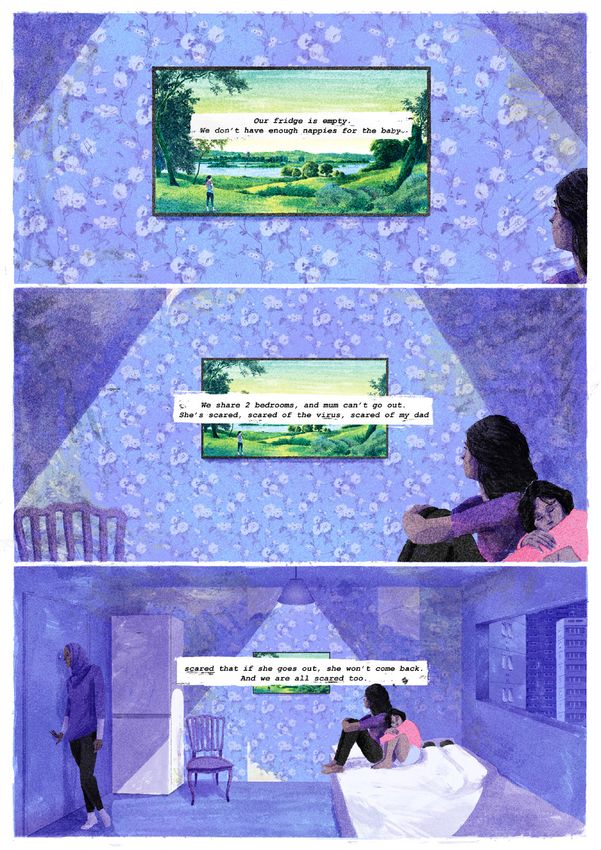
The Childhood Trust
     The Childhood Trust is London’s child poverty charity,                                   Our growing community of corporate supporters,
     funding the delivery of youth projects and services that                                 philanthropists, and donors combined with our strong
     support thousands of disadvantaged children and young                                    relationships with established children’s charities make
     people in London every year.                                                             us well-equipped to direct resources to London’s most
                                                                                              economically disadvantaged and isolated communities.
     We fund the delivery of grassroots projects, run volunteer
     community support programmes, and produce original                                       Without our financial support, 75% of the projects we fund
     research and advocacy to improve the life chances of                                     would not be able to operate. Without these projects, life
     disadvantaged children in the capital and build capacity in                              for many thousands of children trapped in poverty would be
     London’s child support sector.                                                           dramatically worse.

     Our Theory of Change: (How we work to ensure
     better outcomes for disadvantaged children)

                Strategies                                            Outcomes                                          Ultimate Goals
                Meeting children’s needs                               – Matched funded delivery of                      Children are ready for life
                by building sector capacity                              effective projects
                                                                                                                         – Reduced / eliminated adverse
                – Matched fundraising campaigns                        – Widescale engagement with                         experiences & toxic stress
                                                                         disadvantaged children
                – Partnership delivery programmes                                                                        – Increased health & wellbeing
                                                                       – Improve children’s living
                – Volunteering programmes                                conditions                                      – Greater resilience
                                                                       – Increased sector effectiveness                  – Positive family & peer relationships
                Changing the landscape
                                                                       – Increased public awareness                      – Maximum benefit from education
                via advocacy and raising                                 & engagement                                    – Inspired, hopeful and work ready
                awareness
                                                                       – Children have a voice
                – Campaign
                                                                       – Informed public debate                          Breaking the cycle of poverty
                – Events
                – Research

                                                                                    Moderators
                   Relationships with charities and donors                        Alignment with partners                                  Media access
     External

                Limitations of charities capacity to participate           Ability to make appropriate connections                     Public engagement
                            Project’s effectiveness                               Socio-economic policies                            Reputation & Awareness
     Internal

                   Resources available
                                                      Ability to monitor         Selection & effectiveness      Functional relationships        Governance & Board
                (funds, staff, volunteers,
                                                       & report impact               of programmes                   with partners
                   & pro bono support

2   The Childhood Trust: London Child Poverty Report 2021
Contents
The Childhood Trust                                       2
Executive Summary                                         4
Introduction                                              8
Drivers of Child Poverty                                  10
 Employment and Income                                    10
 Austerity and Social Welfare                             20
Impact of child poverty                                   23
 Education                                                23
 Health                                                   25
COVID-19’s Impact on Child Poverty                        30
Policy Recommendations                                    46
Conclusion                                                48

                                     The Childhood Trust: London Child Poverty Report 2021   3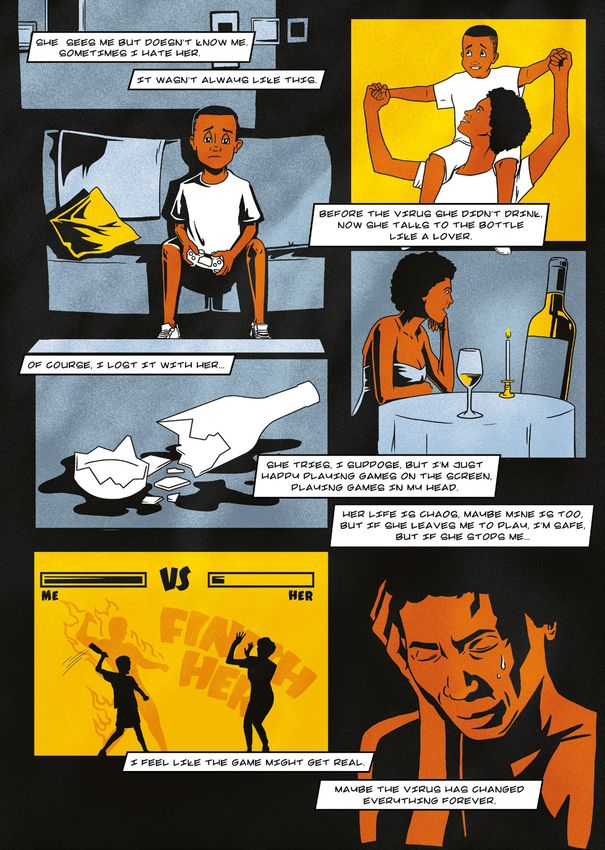
Executive Summary
     London has the highest child poverty rate in England.1                                            The “decade of austerity” ushered in by the coalition
     While other cities in Europe have seen their rates of                                             government beginning in 2010 has been one of the greatest
     childhood poverty decline, London’s has been increasing                                           factors in terms of increasing child poverty. Cuts have been
     for the past five years.2 As one of the most expensive                                            made to benefits, local authorities, family support services
     cities in the world, low levels of household income are                                           and countless other social programmes; nearly half of
     compounded by extremely high housing, transportation                                              London councils’ youth services have been slashed. Despite
     and childcare costs. Additionally, cuts to benefits and                                           this, demand for such services is ever present and food
     tax credits as part of a larger restructuring of the British                                      bank usage in London has increased over 17-fold between
     welfare state have contributed to higher levels of poverty.                                       2011/2012 and 2019/2020.5 The policy has suppressed
     As early childhood development has a profound influence                                           household incomes and hit the poor the hardest. In the
     on later life outcomes, the situation is in dire need of                                          capital, one in six parents have children in food insecurity.6
     attention. However, while household income is arguably                                            Food insecurity is when one is unable to access reliable,
     the most pertinent factor in discussions of child poverty,                                        sufficient, affordable nutritious food. Additionally, the capital
     poverty manifests itself in many different ways. This report                                      currently has one of the highest proportion of students on
     will interrogate both the drivers and the impacts of child                                        free school meals.7
     poverty in London.
                                                                                                       Housing, specifically access to safe and affordable housing,
     Household income and spending have stagnated over the                                             can be both a driver and an impact of poverty. In London,
     past five years, contributing to increased poverty rates. For                                     housing is especially expensive, with families in poverty
     the poorest Britons, real incomes were higher fifteen years                                       spending over half their net income on housing costs.8
     ago than they are now, largely due to the Great Recession                                         The current situation is exacerbated by the UK’s ongoing
     and increased rates of inflation following the Brexit                                             housing crisis, as households in poverty can spend a
     referendum. While unemployment levels have decreased
                       3
                                                                                                       significant portion of their income on housing. Right to
     in recent years, rates of in-work poverty have increased and                                      Buy, but-to-let and the loss of millions of social homes has
     the number of people working in zero-hour contracts has                                           been the primary cause of the ongoing crisis. One inevitable
     hit the highest level on record. Poverty rates are highest
                                                   4
                                                                                                       outcome of such a crisis is an increase in both children
     for families in which a parent works in the retail, hospitality                                   growing up in temporary accommodation and rough
     or leisure sectors. An inevitable side effect has been an                                         sleeping, which has doubled since 2010.9
     increase in inequality. Despite being one of the world’s
     wealthiest cities, London’s wealth is not spread equally.

     1    Child Poverty Action Group (n.d.) Child Poverty In London Facts and Figures. Available at: https://cpag.org.uk/child-poverty/child-poverty-facts-and-figures
     2	Department for Work and Pensions (2020) Households Below Average Income: 1994/95 To 2018/19.
        Available at: https://www.gov.uk/government/statistics/households-below-average-income-199495-to-201819
     3	Corlett, A. (2020) New data shows households were struggling even before coronavirus. Resolution Foundation.
        Available at: https://www.resolutionfoundation.org/comment/new-data-shows-households-were-struggling-even-before-coronavirus/
     4	Goodier, M. (2020) Zero-Hours Contracts Reach Record Level As 730,000 Jobs Are Lost. Newstatesman.com.
        Available at: https://www.newstatesman.com/politics/economy/2020/08/zero-hours-contracts-reach-record-level-730000-jobs-are-lost
     5	Statista (2020) Number of people receiving three days’ worth of emergency food from Trussell Trust foodbanks in London (UK) from 2011/12 to 2019/20.
        Available at: https://www.statista.com/statistics/382731/london-foodbank-users/
     6    Barker (2020) 400,000 London children ‘are food insecure’. Fresh Produce Journal. Available at: www.fruitnet.com/fpj/article/180602/400000-london-children-are-food-insecure
     7    Department for Education (2019). Pupils Eligible for Free School Meals, Borough. Available at: https://data.london.gov.uk/dataset/pupils-eligible-free-school-meals-borough
     8    Trust for London and WPI Economics (2020) London’s Poverty Profile: 2020. Available at: https://www.trustforlondon.org.uk/publications/lpp2020/
     9    BBC News (2020) Number of children homeless in temporary housing ‘highest on record’. Available at: https://www.bbc.com/news/uk-scotland-51280788

4   The Childhood Trust: London Child Poverty Report 2021
Children who live in deprived areas of the country continue                                    Unfortunately, the ongoing COVID-19 pandemic is likely to
to have lower levels of educational attainment. The                                            exacerbate the drivers of poverty and worsen the material
situation has been worsened by cuts to education, childcare                                    living conditions of London’s poor residents. School
and youth services that were targeted towards low income                                       shutdowns have already widened the attainment gap
families. The COVID-19 pandemic is likely to aggravate                                         between poorer and wealthier children by at least 46%13
these disparities.                                                                             and possibly by up to 75%14. In parallel, unemployment is
                                                                                               expected to rise significantly, cramped housing poses an
Poverty has a significant impact on health outcomes for                                        increased risk of infection and there is a heightened risk
children in London. While life expectancy has notably                                          of hunger among poor children due to a loss of parental
stagnated in England since 2010, it has declined in some                                       earnings.
of the most deprived areas. A lack of access to green
                                        10

spaces is correlated with lower health outcomes, and
many of London’s children are exposed to dangerous
levels of air pollution. London’s poorest children suffer
from both food insecurity and higher obesity rates, likely
due to the higher costs of healthier food relative to
unhealthy food.11 Additionally, the mental health of children
experiencing poverty is worse, primarily because of poor
accommodation, parental absence and/or mental health
and substance abuse issues at home.12

10	Institute of Health Equity (2020) Health Equity in England: The Marmot Review 10 Years On. Available at:
    https://www.health.org.uk/sites/default/files/2020-03/Health%20Equity%20in%20England_The%20Marmot%20Review%2010%20Years%20On_executive%20summary_web.pdf
11   Barker (2020) 400,000 London children ‘are food insecure’. Fresh Produce Journal. Available at: www.fruitnet.com/fpj/article/180602/400000-london-children-are-food-insecure
12	The Children’s Society (2016) Poor Mental Health: the links between child poverty and mental health problems.
    Available at: https://www.childrenssociety.org.uk/sites/default/files/poor_mental_health_report.pdf
13	Sharpe et al., (2020) The challenges facing schools and pupils in September 2020. National Foundation for Education Research. Available at: https://www.nfer.ac.uk/media/4119/
    schools_responses_to_covid_19_the_challenges_facing_schools_and_pupils_in_september_2020.pdf
14	Education Endowment Foundation (2020) Impact of school closures on the attainment gap: Rapid Evidence Assessment.
    Available at: https://educationendowmentfoundation.org.uk/public/files/EEF_(2020)_-_Impact_of_School_Closures_on_the_Attainment_Gap.pdf

                                                                                                                                    The Childhood Trust: London Child Poverty Report 2021 5
For the future of London’s children, we must work to ensure the following:

     1.         weeping welfare state reforms, so benefits reflect need. This includes lifting
               S
               the two-child limit on tax credit and universal credit, as well as removing the
               £20,000 a year benefit cap (£23,000 in London). As it is, the benefit cap does not
               address the needs of larger families or those living in areas of high rent.

        Free childcare must be implemented. Childcare and housing are two of the most
     2.
        significant costs for working families with small children, with costs of the former
        having increased by 42% since 2008, twice the rate of inflation.15

     3.         mployment practices need to change, so as to reduce numbers of
               E
               “working poor”. This includes pushing employment protection laws on
               zero-hour contracts, part-time jobs and internships. It also includes raising
               the minimum wage.

        The UK government needs to reimplement child poverty targets that were
     4.
        removed in 2016 and amend the definition of child poverty.

        More should be done to tackle food insecurity and childhood obesity.
     5.
        For example, more children should have access to free school meals for longer
        periods of time (i.e. also during holidays).

        The UK should do more to invest in its infrastructure. Social housing, subsidised
     6.
        transport and access to information via free or subsidised broadband are crucially
        needed. The £35 million cuts in council youth services in London (relative to
        2011-12) need to be reversed.16 The government’s decision to end free Transport
        for London travel for under 18s should also be undone.

     15   Child Poverty Action Group (n.d.) Solutions to poverty. Available at: https://cpag.org.uk/child-poverty/solutions-poverty
     16   Centre for Labour and Social Studies (n.d.) The facts and the fixes: austerity. Available at: http://classonline.org.uk/docs/austerity-final-for-web.pdf

6   The Childhood Trust: London Child Poverty Report 2021
Children playing at Cardinal Hume Centre,
one of The Childhood Trust’s funded projects

                                               The Childhood Trust: London Child Poverty Report 2021   7
Introduction
     London has the highest rate of child poverty in England.                                         The most accurate definition of child poverty, according
     The latest data for child poverty shows that between the                                         to The Childhood Trust, is sociologist Peter Townsend’s:
     years 2016-17 and 2018-19, 39% of children in London                                             “Individuals, families and groups in the population can be
     or 800,000 of those aged under 18, lived in poverty after                                        said to be in poverty when they lack the resources to obtain
     housing costs were taken into account (this figure reflects                                      the type of diet, participate in the activities and have the
     the number of children living in households with less                                            living conditions and the amenities which are customary, or
     than 60% of median household income). There are as           17
                                                                                                      at least widely encouraged or approved in the societies to
     many poor children in London as there are in South West                                          which they belong.”24
     England, Northern Ireland, Wales and Scotland combined.                                 18

     Additionally, recent analysis has shown that the top 11 local                                    It is worth noting that not everyone is equally affected by
     authorities with the highest child poverty rates in the UK                                       child poverty. Indeed, the poverty rate for Bangladeshi
     are in London, with Tower Hamlets topping the list with                                          children in London is 60% compared with 26% for white
     55.4% of children below 60% median income, after housing                                         children (2016-17 figures, three year rolling average).25
     costs in 2018/19 living in poverty.19 These figures predate                                      Child poverty for ethnic minorities is far worse than for
     the COVID-19 crisis, which will increase child poverty rates.                                    British whites, which has resounding policy implications.
     In England, the Institute for Fiscal Studies expects relative
     child poverty to increase “under present policies”20 despite                                     Whilst child poverty has decreased in the European Union
     government targets (which have since been removed) to                                            (EU) between 2017 and 20192627, it has risen in all London
     end child poverty by 2020.21                                                                     boroughs in the past five years.28 This is because the
                                                                                                      capital is one of the most expensive places in the country
     Relative poverty is defined as the percentage of children                                        in terms of housing, childcare and living costs. Low pay is
     living in households below 60% median income every                                               an additional factor as nearly three quarters of children in
     year. Absolute poverty is when a household’s income is
            22
                                                                                                      poverty live in working households.29 Furthermore, cuts in
     less than 60% of the median in 2011.23 These definitions                                         the UK welfare system amounting to £39bn since 2010 –
     exclude housing costs, meaning that they do not account                                          also known as the “decade of austerity”- have compounded
     for the disposable income that families spend on rent or                                         the impact of poverty, by reducing families’ incomes further.
     mortgage. Poverty rates that include housing costs more                                          This is in addition to the effects of the 2008-09 recession
     accurately capture how much families live on due to the                                          and the economic consequences of the Brexit referendum.
     fact that housing costs are essential.                                                           Finally, the ongoing COVID-19 crisis is exacerbating child
                                                                                                      poverty. As schools and youth centres shut for months,
                                                                                                      differences in livelihoods between poorer children and

     17	Department for Work and Pensions (2020) Households Below Average Income: 1994/95 To 2018/19.
         Available at: https://www.gov.uk/government/statistics/households-below-average-income-199495-to-201819
     18   Ibid.
     19	Hirsch, D. and Stone, J. (2020) Local indicators of child poverty after housing costs, 2018/19. Loughborough University.
         Available at: http://www.endchildpoverty.org.uk/child-poverty-in-your-area-201415-201819/
     20	Institute of Health Equity (2020) Health Equity in England: The Marmot Review 10 Years On. Available at:
         https://www.health.org.uk/sites/default/files/2020-03/Health%20Equity%20in%20England_The%20Marmot%20Review%2010%20Years%20On_executive%20summary_web.pdf
     21	Department for Work and Pensions, the Department of Education and HM Treasury (2020) The Child Poverty Unit.
         Available at: https://www.gov.uk/government/groups/the-child-poverty-unit
     22	Hirsch, D., (2020) Local child poverty indicators 2018/9 – distribution and trends. Loughborough University. Available at: http://www.endchildpoverty.org.uk/wp-content/
         uploads/2020/05/Local-child-poverty-indicators-2020-summary-004.docx
     23   Child Poverty Action Group (n.d.) Measuring Poverty. Available at: https://cpag.org.uk/child-poverty/measuring-poverty
     24   Townsend, P., (1983) Poverty In The United Kingdom. Harmondsworth: Penguin.
     25	Khan, O., (2020) The Colour of Money. How racial inequalities obstruct a fair and resilient economy. Runnymede Trust. Available at: https://www.runnymedetrust.org/uploads/
         publications/pdfs/2020%20reports/The%20Colour%20of%20Money%20Report.pdf
     26   Eurostat (2017) EU children at risk of poverty or exclusion. Available at: https://ec.europa.eu/eurostat/web/products-eurostat-news/-/EDN-20171120-1
     27   Daly, M., (2019) Fighting Child Poverty. European Parliament. Available at: https://www.europarl.europa.eu/RegData/etudes/BRIE/2019/638429/IPOL_BRI(2019)638429_EN.pdf
     28	Department for Work and Pensions (2020) Households Below Average Income: 1994/95 To 2018/19.
         Available at: https://www.gov.uk/government/statistics/households-below-average-income-199495-to-201819
     29   Ibid.

8   The Childhood Trust: London Child Poverty Report 2021
those more well off have heightened, leaving thousands                                         The aim of this report is to detail the complex causes and
even more vulnerable than they were before the pandemic.                                       consequences of child poverty in London. It also presents
                                                                                               testimonial case studies from partner organisations that the
Child poverty manifests itself in many ways, not just through                                  Childhood Trust supports and, importantly, analyses the
a lack of income. Early childhood matters for later life                                       impacts of COVID-19 on vulnerable children. Finally, the
outcomes. The 2020 Marmot Review states that “positive                                         report sets forth recommendations to tackle the causes
experiences early in life are closely associated with better                                   of child poverty in London and improve disadvantaged
performances at school, better social and emotional                                            children’s lives.
development, improved work outcomes, higher income and
better lifelong health including longer life expectancy”.30
Poverty in children increases the risk of unemployment and
low pay in adulthood as well as lower savings, according
to the Joseph Rowntree Foundation. It may even harm a
child’s brain development in its early days.31

30	Institute of Health Equity (2020) Health Equity in England: The Marmot Review 10 Years On. Available at: https://www.health.org.uk/sites/default/files/2020-03/Health%20Equity%20
    in%20England_The%20Marmot%20Review%2010%20Years%20On_executive%20summary_web.pdf
31   Joseph Rowntree Foundation (2020) What is poverty? Available at: https://www.jrf.org.uk/our-work/what-is-poverty

                                                                                                                                    The Childhood Trust: London Child Poverty Report 2021 9
Drivers of Child Poverty
     Employment and Income
     Income is viewed as one of the most relevant indicators for                                            Further statistics reveal a bleak picture. 56% of London’s
     measuring living standards and changes in poverty levels.                                              children cannot afford to go on holiday for at least one
     From the 2000s onwards, progress was initially made in                                                 week a year, and 18% cannot afford weekly after-school
     reducing poverty levels among those considered most at                                                 organised activities.34
     risk, namely pensioners and children.32 However, in recent
     years, due to the Great Recession and economic fallout                                                 Another way to measure the current living standards of
     from the Brexit referendum, this trend has been reversed,                                              households is by analysing household spending data.
     with poverty levels increasing. The consequences of the                                                Similar to poverty reduction levels, household spending has
     ongoing COVID-19 pandemic are likely to accelerate                                                     stagnated over the past five years.35 The average weekly
     this reversal.                                                                                         household spending in 2018/19 was £586, which is only up
                                                                                                            £4 from two years ago. These figures, combined with other
     Additionally, overall poverty levels – measured by income                                              revealing data on overall poverty levels, reveal a situation
     – have remained relatively unchanged over the past two                                                 primarily resulting from a stagnation of income growth in
     decades. Within the UK, there are both regional variations                                             the UK.
     in poverty levels and various structural factors, such as
     whether a family member has a disability, that make a                                                  Across the whole of the country, median household
     household more likely to experience poverty. This section                                              income was £26,800 per annum in 2018/19, the same since
     will explore these recent trends in employment, income                                                 2015.36 However, the lack of growth has not been evenly
     and inequality, and will interrogate the disparities in poverty                                        distributed. For those under the age of 60, there has been
     levels between different classes, and social and ethnic                                                a growth rate of only 0.2% over the course of the decade
     groups.                                                                                                following the Great Recession.37 For those over 60, it’s
                                                                                                            only slightly higher, at 0.9%. But among the poorest fifth
     Income deprivation is higher in London than in any other                                               of households in the country, income has fallen 3% in real
     region or constituent country of the UK. As of this year,                                              terms since 2017. This fall followed negative growth the
     an estimated 22% of the population of England lives in                                                 previous year. Altogether, for the poorest in the country,
     poverty. But in London, that figure is 28% – around 2.5                                                real incomes were higher in 2004/05 than in 2018/19.38
     million people. Compared to five years ago, this is a slight
                            33
                                                                                                            As put by Adam Corlett for the Resolution Foundation,
     increase of around one per cent. By far the biggest disparity                                          “that is an awful position from which to be entering a
     between London and the other parts of the UK is the cost                                               new recession.”
     of living, which is between 15% and 58% higher, depending
     on the comparative region in question.

     32   Joseph Rowntree Foundation (2020) UK Poverty 2019/20. Available at: https://www.jrf.org.uk/report/uk-poverty-2019-20
     33   Trust for London and WPI Economics (2020) London’s Poverty Profile: 2020. Available at: https://www.trustforlondon.org.uk/publications/lpp2020/
     34   Ibid.
     35	Rahman, F. (2020) Family spending before the coronavirus crisis helps us to understand its potential impact. Resolution Foundation.
         Available at: https://www.resolutionfoundation.org/comment/family-spending-before-the-coronavirus-crisis-helps-us-to-understand-its-potential-impact/
     36	Trades Union Congress, (2019) Getting It Right This Time: Lessons From A Decade Of Failed Austerity.
         Available at: https://www.tuc.org.uk/sites/default/files/2019-10/Lessons_from_a_decade_of_failed_austerity.pdf
     37	Bourquin, P., Joyce, R., and Norris Keiller, A. (2020) Living standards, poverty and inequality in the UK: 2020. Institute for Fiscal Studies.
         Available at: https://www.ifs.org.uk/uploads/R170-Living-standards-poverty-and-inequality-in-the-UK-2019-2020%20.pdf
     38	Corlett, A. (2020) New data shows households were struggling even before coronavirus. Resolution Foundation.
         Available at: https://www.resolutionfoundation.org/comment/new-data-shows-households-were-struggling-even-before-coronavirus/

10   The Childhood Trust: London Child Poverty Report 2021
Pre-Covid 19: Childhood Trust partner organisations
The support services these organisations provide are vital
to the health and well-being of disadvantaged children in
London. For example, Sand’s End Associated Projects in Action
(SEAPIA), based in Fulham, provides low-cost childcare for
children aged 4-13. A young girl benefitted from the Adventure
Playground where she made new friends and enjoyed the
offsite trips during her holidays. “I loved the trips, I loved the
art, I loved the food, I loved it all” is what the girl told the
organisation. Her single mother, who she lives with, would not
be able to keep her job during the holidays had it not been
for SEAPIA.
The Childhood Trust: London Child Poverty Report 2021 11The primary culprit has been inflation brought on in Despite this increase, workers in zero-hour contracts have
part due to the depreciation of the pound following the seen a decline in the average number of hours worked. For
Brexit vote. In other words, increases in both overall
39
some, this is due to the cost of transportation and a lack of
employment levels and increases in nominal earnings over availability of childcare services, which restricts the number
the past three years were offset by the rise in inflation. of hours one can work. However, for many, this is not a
However, one concerning phenomenon has been a rise choice – 18% of workers in the bottom fifth of hourly wage
in in-work poverty, as increases in employment post- rates report that they would like to work more hours, but
recession were matched by corresponding rates of in-work they are not available.43 That’s 10% higher than workers in all
poverty. other wage rate percentiles.
Historically, work has been considered a route out of While a lack of hours is a contributing factor, experts agree
poverty. This is no longer the case. In 1997/98, the that the largest driver of in-work poverty has been a decline
percentage of workers who were in poverty was 9.9%. Last in in-work benefits and tax credits that have coincided
year, despite a declining unemployment rate, that figure with a rise in the cost of living. There has been a 7% fall in
was up to 12.7%. Overall, a majority (56%) of people in non-pensioner benefits and tax credits that has reduced
poverty are actually in-work. Further, seven in ten children average income by 3% overall.44 In addition to policy
in poverty live in a household where at least one parent changes such as the benefits freeze, introduced in the 2016
works. However, in-work poverty varies greatly by a variety Welfare Reform and Work Act, the aforementioned nominal
of factors. Workers with disabilities, BAME workers, workers increases in employment income have made some families
in families with children and single-adult families are at a ineligible for means-tested benefits, meaning household
higher risk of experiencing in-work poverty. It also varies by budgets are even more tightly squeezed. As the wealth
sector. 40
held by the poorest declines, the result is an increase in
inequality in London and the rest of the country.
Relative poverty among workers in retail, hospitality and
leisure is at 19%, more than double the national average.41 It The Gini coefficient, which measures income distribution
is 10% for workers in other sectors. These service industry and inequality, reveals a slight uptick in inequality since the
sectors comprise a large portion of the ‘gig economy’. The previous year.45 When placed in the context of decades-
number of workers in zero-hour contracts, common in the long trends, national inequality levels have been relatively
gig economy, has risen to a total of 896,000.42 flat since the 1990s after a dramatic spike beginning in
1980. Nonetheless, the difference in income between
the rich and the poor is stark. In 2018/19, the 90:10 ratio,
which represents how many times larger income at the
90th percentile (i.e. top 10% of the population) is compared
to the 10th percentile (bottom 90%), was at 4.1.46 While
incomes have stagnated over the past five years for
everyone else, the top 10% have seen their income grow 6%
in real terms.
39 Bourquin, P., Joyce, R., and Norris Keiller, A. (2020) Living standards, poverty and inequality in the UK: 2020. Institute for Fiscal Studies.
Available at: https://www.ifs.org.uk/uploads/R170-Living-standards-poverty-and-inequality-in-the-UK-2019-2020%20.pdf
40 Joseph Rowntree Foundation (2020) UK Poverty 2019/20. Available at: https://www.jrf.org.uk/report/uk-poverty-2019-20
41 Bourquin, P., Joyce, R., and Norris Keiller, A. (2020) Living standards, poverty and inequality in the UK: 2020. Institute for Fiscal Studies.
Available at: https://www.ifs.org.uk/uploads/R170-Living-standards-poverty-and-inequality-in-the-UK-2019-2020%20.pdf
42 Trades Union Congress, (2019) Getting It Right This Time: Lessons From A Decade Of Failed Austerity.
Available at: https://www.tuc.org.uk/sites/default/files/2019-10/Lessons_from_a_decade_of_failed_austerity.pdf
43 Joseph Rowntree Foundation (2020) UK Poverty 2019/20. Available at: https://www.jrf.org.uk/report/uk-poverty-2019-20
44 Bourquin, P., Joyce, R., and Norris Keiller, A. (2020) Living standards, poverty and inequality in the UK: 2020. Institute for Fiscal Studies.
Available at: https://www.ifs.org.uk/uploads/R170-Living-standards-poverty-and-inequality-in-the-UK-2019-2020%20.pdf
45 Corlett, A. (2020) New data shows households were struggling even before coronavirus. Resolution Foundation.
Available at: https://www.resolutionfoundation.org/comment/new-data-shows-households-were-struggling-even-before-coronavirus/
46 Bourquin, P., Joyce, R., and Norris Keiller, A. (2020) Living standards, poverty and inequality in the UK: 2020. Institute for Fiscal Studies.
Available at: https://www.ifs.org.uk/uploads/R170-Living-standards-poverty-and-inequality-in-the-UK-2019-2020%20.pdf
12 The Childhood Trust: London Child Poverty Report 2021Despite accounting for around a quarter of the UK’s total Additionally, although mass joblessness has so far
economic output, the wealth generated in the capital is not been largely prevented, future losses are predicted to
distributed equally. The richest 10% of London’s residents be concentrated in the lowest paying sectors.49 The
take home around 31.7% of the net income, while the share pandemic has disproportionately affected London’s
held by the poorest is only 1.8%.47 BAME and disabled populations, who already suffer from
disproportionate levels of poverty.
The COVID-19 pandemic is likely to not only increase
inequality, but also the material deprivation of the poorest
in London and the rest of the country. The sectors already
with the highest rates of in-work poverty are the same
sectors that have been shut-down and whose workers are
incapable of working remotely. While some may see their
income maintained or (by some measures) see a slight
increase due to temporary benefit increases, the long-term
consequences in the form of career disruption are likely to
be damaging.48
47 Trust for London and WPI Economics (2020) London’s Poverty Profile: 2020. Available at: https://www.trustforlondon.org.uk/publications/lpp2020/
48 Bourquin, P., Joyce, R., and Norris Keiller, A. (2020) Living standards, poverty and inequality in the UK: 2020. Institute for Fiscal Studies.
Available at: https://www.ifs.org.uk/uploads/R170-Living-standards-poverty-and-inequality-in-the-UK-2019-2020%20.pdf
49 Rahman, F. (2020) Family spending before the coronavirus crisis helps us to understand its potential impact. Resolution Foundation.
Available at: https://www.resolutionfoundation.org/comment/family-spending-before-the-coronavirus-crisis-helps-us-to-understand-its-potential-impact/
The Childhood Trust: London Child Poverty Report 2021 13Intersectionality Housing affordability and availability
The term “intersectionality” was first coined in 1989 by There is a fundamental link between housing and poverty:
black feminist scholar Kimberlé Crenshaw to explain how the level of poverty a person finds themselves in affects
an individual’s multiple social and political identities, such as their housing circumstances, and (albeit to a lesser extent) a
gender, race, or class, can together lead to discrimination person’s housing circumstances can also affect their level
or privilege. Whilst originally used in a feminist perspective, of income and the extent of their poverty. Thus, housing
intersectionality as a framework is now applied in many plays a critical role in either mitigating or exacerbating
fields, including in studies relating to poverty. poverty levels.
For example, child poverty rates are significantly higher for This is apparent when one examines the difference between
BAME groups, who face “extensive and persistent economic poverty levels Before Housing Costs (BHC) and After
inequality”. Amongst the most affected, over half of
50
Housing Costs (AHC). For example, 11% of children BHC
Pakistani children live in poverty in the UK.51 However, it is were found to be in ‘persistent low income’ from 2013-
important to note that the acronym BAME is problematic in 17.53 AHC, the number of children roughly doubles to 20%.
itself in that it does not differentiate the lived experiences of Further, children who live in single-parent households are
individuals within those groups. Inequalities vary by ethnic found to have the highest rates of persistent poverty, with a
group and are worse for Black, Bangladeshi and Pakistani total of 35% affected.54
groups than they are for Chinese and Indians. 52
50 Khan, O., (2020). The Colour of Money. How racial inequalities obstruct a fair and resilient economy. Runnymede Trust.
Available at: https://www.runnymedetrust.org/uploads/publications/pdfs/2020%20reports/The%20Colour%20of%20Money%20Report.pdf
51 Ibid.
52 Ibid.
53 Department for Work and Pensions (2019) Income Dynamics: Income movements and the persistence of low incomes. Available at: https://assets.publishing.service.gov.uk/
government/uploads/system/uploads/attachment_data/file/789100/income-dynamics-income-movements-and-persistence-of-low-incomes-2016-17.pdf
54 Ibid.
14 The Childhood Trust: London Child Poverty Report 2021Children playing at a project funded by The
Childhood Trust.
The Childhood Trust: London Child Poverty Report 2021 15This situation is exacerbated by the current housing market. This is particularly relevant because an increasing number
The UK is in the midst of a housing crisis, with an estimated of those in poverty are private renters. In 2007/08, for
8.4 million people in England living in unaffordable, insecure Londoners in poverty, 43% socially rented, 24% privately
or unsuitable housing. In the country, housing prices 55
rented and 33% were owner-occupiers. By 2017/18, 37%
increased 178% from 2000 to 2018, from an average of socially rented, 39% privately rented and 24% were owner-
£102,000 to £283,000. During the same period, nominal 56
occupiers.61 As a result, an increasing number of families
average weekly earnings have only increased by 67%. have been pushed into unsafe and unaffordable housing
However, this increase has not been shared equally. Costs arrangements, as roughly half a million London homes do
for mortgage payers and homeowners have remained flat, not meet the Government’s Decent Homes Standard for
but housing costs have increased significantly for private quality housing.
and social renters.
London’s high housing and living costs, if left unchecked,
The affordability of housing has one of the most direct will have a particularly negative impact on future
impacts on material deprivation affecting families. generations. The crisis is already preventing young people
Housing costs vary significantly by region, but are the from leaving home. Many are currently living in ‘concealed
most expensive in London, the Southeast and East of households’, which is when one or more young adult
England.57 On average, households in London spend 18% children live with parents or relatives. More than a third
of their income on housing. For households in poverty, 58
those aged 20 to 34 live with parents or a legal guardian, up
that increases to 56%. Among housing cost increases in 59
from one fourth 20 years ago.62
London, the sharpest rise has been in private renting, with a
29% increase since 2008.60
Proportion of London households by type
of tenure over time (1961-2018)
Census data (1961-2011)
100
90
Proportion of households (%)
80
70
60
50
40
30
20
10
0
1961 1971 1981 1991 2001 2012 2013 2014 2015 2016 2017 2018
Private rented Social rented Owner occupied
55 BBC News (2019) Housing crisis affects estimated 8.4 million in England – research. Available at: https://www.bbc.com/news/uk-49787913
56 Centre for Labour and Social Studies (2019) The facts & the fixes: Housing. Available at: http://classonline.org.uk/docs/housing-2.pdf
57 Joseph Rowntree Foundation (2020) UK Poverty 2019/20. Available at: https://www.jrf.org.uk/report/uk-poverty-2019-20
58 Trust for London and WPI Economics (2020) London’s Poverty Profile: 2020. Available at: https://www.trustforlondon.org.uk/publications/lpp2020/
59 Ibid.
60 Ibid.
61 Ibid.
62 Joseph Rowntree Foundation (2020) UK Poverty 2019/20. Available at: https://www.jrf.org.uk/report/uk-poverty-2019-20
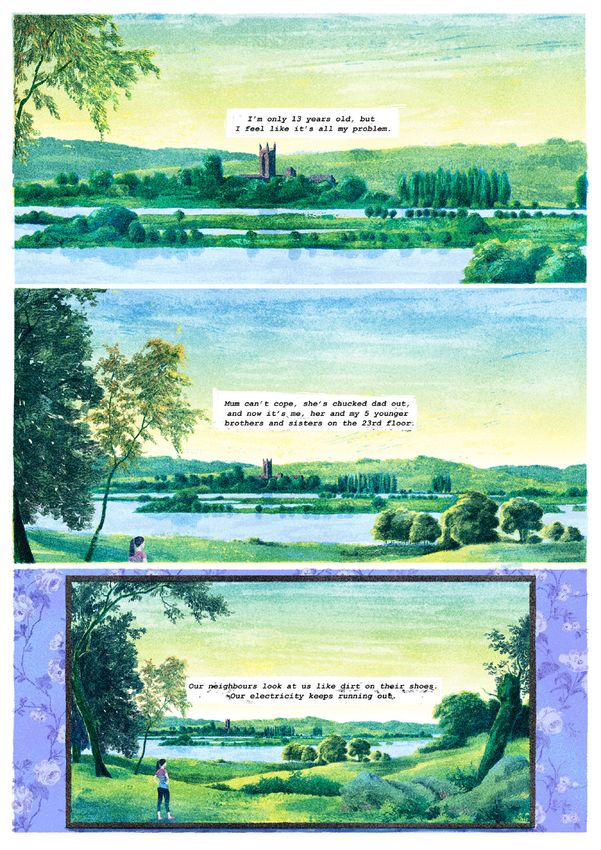
16 The Childhood Trust: London Child Poverty Report 2021Pre-Covid-19
The coronavirus pandemic caused The flat above was used for prostitution”,
many of the Childhood Trust’s partner keeping the daughter up at night. “One
organisations to close their doors during day, she was almost raped in the alleyway.
the lockdown. After she was attacked, she had night
terrors. I knew we had to leave again. I
Solidarity Sports is an organisation in
told the council, but they said I had to
West London that gathers children
wait 12 years”. However, with the help
around sports, the arts, mentorship and
of Solidarity Sports who contacted the
adventure and is viewed as a lifeline for
housing association, the council and
their beneficiaries. One woman, who
the local MP, the family has since been
fled from her native country and abusive
relocated to a safe and clean flat. The
husband with her five year-old daughter,
mother thanked the charity saying “I don’t
received much needed help after being
know what I would do in my life without
placed in unsuitable temporary housing
you. You are angels. I am so happy with
by the council. The mother describes the
my new flat. My nightmare is over”.
housing as “filthy, with syringes, vermin
and piles of litter. The flat was covered in
mould and a pipe was leaking.
Photo by Katie Wilson featured in The Childhood Trust’s Bedrooms of London exhibition, which made visible the living conditions of
some of the 700,000 children in poverty in London.
The Childhood Trust: London Child Poverty Report 2021 17According to the New Economics Foundation (NEF), this An increase of families in temporary accommodation and
housing crisis has largely been brought on by bad housing rough sleeping is an inevitable result of the state’s failure to
policy. During the post-war period, a stable housing
63
provide adequate and affordable housing for low-income
system was achieved by providing the working class with households. The NEF estimates that new homeless families
social housing, while the needs of the middle class were outnumber new social homes at a rate of 8 to 1. Across the
met through homeownership. This system was largely country, the rate of rough sleeping has doubled since 2010.
abandoned in the 1980s, for the Right to Buy system,
which encouraged social renters to purchase their homes, London currently has the highest concentration of
thus increasing individual homeownership and leading homeless children, with roughly 88,000 homeless
to an overall reduction in available social housing stock. and in temporary accommodation as of early 2019.67
Ultimately, an overreliance on the private market and the This astonishing figure is equivalent to one in every 24
loss of millions of social homes has led to the current crisis. children. Because these children are not rough sleeping,
the challenges they face are less visible and thus often
Social housing is viewed as a way to provide lower underestimated by many people. However, there are
income individuals and families with affordable housing currently no regulations around the quality of housing
and security, thus offering a way to address the housing or the length of stay within temporary accommodation,
crisis. By offering affordable rents, renters are able to save and many children lived in cramped and inadequate living
significantly more spare income. Additionally, affordable
64
spaces.68
rents are more likely to offer security and less frequent
moves, meaning renters are able to build relationships with In the wake of this crisis, government response has centred
the neighbours and communities and invest in their homes. on promoting ‘affordable’ housing, an umbrella term
Nonetheless, there has been a sharp fall in the percentage that includes social housing, but is increasingly delivered
of the population living in social housing. In 1981, 32% of through the so-called ‘planning system’. This is where
the British population lived in social housing, whereas in new developers are required to build a certain number of
2018, only 17% did.65 ‘affordable’ homes as a condition of planning permission.
Not only does this often fail to meet demand, especially
This can largely be attributed to the dramatic decline in with developers frequently using legal loopholes to dodge
social housing stock. In 1979, local councils owned 5.2 requirements, but the definition of ‘affordable’ can be
million social properties, but by the 1990s, that number had up to 80% of market rents.69 While social housing is still
fallen to under 1.6 million. In 2018-19, only 6,287 new
66
being built, local councils are often dependent on central
socially rented homes were built. This is far short of the government funding, which has been significantly scaled
current demand. As of 2019, there are over a million families down in favour of the aforementioned ‘planning’ approach.
on waiting lists for social housing, and it is estimated that Thus, the share of actual social housing within the
the real current social housing need is roughly 3.1 million. affordable umbrella definition has fallen steeply, from 75% in
the early 1990s to 11% last year.
63 Beswick, J., McCann, D. and Wheatley, H. (2019) Building The Social Homes We Need: Solving The Land And Capacity Challenges. New Economics Foundation.
Available at: https://neweconomics.org/2019/11/building-the-social-homes-we-need
64 Mattinson, D., Knox, A., Downes, N., Nichols, C., Van der Steeg, S., Wilson, D., Langdale, E. and Robinson, A. (2019) Social Housing In England After Grenfell. BritainThinks.
Available at: https://england.shelter.org.uk/__data/assets/pdf_file/0011/1642655/Britain_Thinks_final_report.pdf
65 Centre for Labour and Social Studies (2019) The facts & the fixes: Housing. Available at: http://classonline.org.uk/docs/housing-2.pdf
66 Beswick, J., McCann, D. and Wheatley, H. (2019) Building The Social Homes We Need: Solving The Land And Capacity Challenges. New Economics Foundation.
Available at: https://neweconomics.org/2019/11/building-the-social-homes-we-need
67 Butler, P. (2019) At least 135,000 children in Britain to be homeless at Christmas. The Guardian.
Available at: https://www.theguardian.com/society/2019/dec/03/at-least-135000-children-in-britain-will-be-homeless-at-christmas?CMP=share_btn_link
68 Rosenthal, D.M., Ucci, M., Heys, M., Hayward, A., and Lakhanpaul, M. (2020) Impacts of COVID-19 on vulnerable children in temporary accommodation in the UK. The Lancet Public
Health, 5 (5).
69 Beswick, J., McCa Beswick, J., McCann, D. and Wheatley, H. (2019) Building The Social Homes We Need: Solving The Land And Capacity Challenges. New Economics Foundation.
Available at: https://neweconomics.org/2019/11/building-the-social-homes-we-need
18 The Childhood Trust: London Child Poverty Report 2021Child playing at Jamie’s Farm, one of
The Childhood Trust’s funded projects
The Childhood Trust: London Child Poverty Report 2021 19Austerity and Social Welfare
The ten years (2010-2020) since the start of the Since 2011-12, nearly half of London council youth services
Conservative and Liberal Democrat coalition government have been defunded.74 As a consequence, more than 100
have been marked by cuts in social services and is often centres and projects have closed down and the additional
called the “decade of austerity”. A 2019 analysis from the £1 million planned cuts for the 2019-20 financial year
New Economics Foundation (NEF) found that “deliberate would “devastate services for young people in London”.75
policy from government over the past nine years has Not all boroughs are affected equally – whilst Kensington
had the standalone effect of suppressing incomes and and Chelsea face the most cuts for 2019/20 (losing over
expenditures in the economy by under £1,500 per £1m), a handful of councils such as Newham are increasing
person and more than £3,600 per household”, hitting the their youth budgets.76 Youth centres are important and
poorest the hardest.70 In 2018, the United Nations’ Special can help keep children stay away from violence. Evidence
Rapporteur on Poverty and Human Rights, Philip Alston, suggests that young people are most likely to be stabbed
wrote a scathing report on the UK’s austerity policies, two hours after school, when youth clubs would be at their
stating that UK austerity measures were in breach of four busiest. 77 Yet, youth clubs are closing at an alarming rate
UN human rights agreements.71 and the number of teenagers stabbed to death in the capital
has reached its highest level since 2008.78
Austerity measures relevant to child poverty include cuts in
funding to local authorities and changes in social service In parallel, food banks have sprouted all over the country.
provisions and benefits. As child poverty is on the rise, cuts In 2018, food bank use almost quadrupled, compared
in funding for family support services have also increased with 2012 and the ongoing coronavirus pandemic and
in England.72 Between 2010/11 and 2017/18, children and economic recession that may follow will only worsen these
youth services funding for local authorities decreased by figures.79 London’s funding gap is expected to be one of
nearly a third. Up to 1,000 Sure Start Children’s Centres the worst despite the acknowledgement that the funding
have closed and hundreds of libraries have shut. 73
has been “insufficient to address need” for a decade.80
These centres were created to improve outcomes for This was before the coronavirus pandemic, which wiped
disadvantaged families by offering parental health, early local authorities’ financial reserves, causing them to near
childcare and family support. bankruptcy.81
70 Stirling, A., (2019) Austerity is subduing the UK economy by £3,600 per household this year. New Economics Foundation.
Available at: https://neweconomics.org/2019/02/austerity-is-subduing-uk-economy-by-more-than-3-600-per-household-this-year
71 Alston, P., (2018) Statement on Visit to the United Kingdom, by Professor Philip Alston, United Nations Special Rapporteur on extreme poverty and human rights. Office of the United
Nations High Commissioner for Human Rights. Available at: https://www.ohchr.org/Documents/Issues/Poverty/EOM_GB_16Nov2018.pdf
72 Institute of Health Equity (2020) Health Equity in England: The Marmot Review 10 Years On. Available at: https://www.health.org.uk/sites/default/files/2020-03/Health%20Equity%20
in%20England_The%20Marmot%20Review%2010%20Years%20On_executive%20summary_web.pdf
73 The Sutton Trust (2018) Stop Start? Survival, decline or closure? Children’s centres in England.
Available at: https://www.suttontrust.com/wp-content/uploads/2018/04/StopStart-FINAL.pdf
74 Berry, S., (2019) London’s lost youth services: 2019. Available at: https://www.london.gov.uk/sites/default/files/sian_berry_am_london_youth_services_2019.pdf
75 Ibid.
76 Ibid.
77 Campbell, D., (2018) Knife crime: stagger school leaving times, say London doctors. The Guardian.
Available at: https://www.theguardian.com/uk-news/2018/nov/06/knife-stagger-school-leaving-times-say-london-doctors.
78 Mackintosh, T., and Lee, S., (2019) London knife crime: Number of teenagers stabbed to death hits 11-year high. BBC.
Available at: https://www.bbc.co.uk/news/uk-england-london-50507433
79 The Trussell Trust (2018) End of Year Stats. Available at: https://www.trusselltrust.org/news-and-blog/latest-stats/end-yearstats/
80 Arnold, S., (2019) Updating the Local Authority funding gap. New Economics Foundation. Available at: https://neweconomics.org/2019/10/updating-the-local-authority-funding-gap
81 BBC News (2020) Coronavirus: UK councils fear bankruptcy amid Covid-19 costs. Available at: https://www.bbc.co.uk/news/uk-53069772
20 The Childhood Trust: London Child Poverty Report 2021Second, the reform of the benefits system – which saw The far-reaching austerity measures introduced by the
six key benefits under the old benefits system simplified coalition government as a result of the global recession still
into one payment under the new system of Universal have repercussions today. Analysis by the NEF shows that
Credit – was a large component of the government’s as of 2019, Gross Domestic Product (GDP) per capita (the
welfare reforms. Yet, many households are worse off under monetary value of all finished goods and services produced
Universal Credit, experiencing worse finances, mental within a country in a given time period per inhabitant) was
health and career prospects. 82,83
For example, many struggle still lower than 2008 levels.86 In other words, average living
to make ends meet during the five-week delay in receiving standards in the UK have yet to recover from pre-recession
their first payment and may take out an advance payment levels. The impact of coronavirus in the long-term will be
to help them make ends meet during this time, beginning even more detrimental.
their benefit claim in debt. Additionally, accessing benefits is
done entirely online, yet the most vulnerable are often less Finally, the impact of austerity in the UK has a
digitally literate, as 1.9 million households in the UK do not disproportionate effect on the poor, women, racial and
have access to Internet due to non-affordability and 16% 84
ethnic minorities, single parents, children and the disabled.87
of the population is unable to fill out an online application Often households in poverty meet all those criteria.
form. Libraries, increasingly closing down, have also
85
become crucial to the many who need assistance in filling
out Universal Credit applications, including those who
do not speak English. Local charities often step in to help
claimants apply.
82 The Joseph Rowntree Foundation (2019) Where Next for Universal Credit and Tackling Poverty?. https://www.jrf.org.uk/report/where-next-universal-credit-and-tackling-poverty
83 Cheetham et al. (2018) “It’s hitting people that can least afford it the hardest”. The impact of the roll out of Universal Credit in two North East England localities: a qualitative study.
Gateshead Council. Available at: https://www.gateshead.gov.uk/media/10665/The-impact-of-the-roll-out-of-Universal-Credit-intwo-North-East-England-localities-a-qualitative-study-
November2018/pdf/Universal_Credit_Report_2018pdf.pdf?m=636778831081630000
84 DevicesDotNow (2020) Interim Impact Report #2: 24 March – 26 June. Available at: https://www.goodthingsfoundation.org/sites/default/files/interim_impact_report_2_
devicesdotnow_29_june_2020_0.pdf
85 Lloyds Bank (2018) UK Consumer Digital Index 2018. Available at: https://www.lloydsbank.com/banking-withus/whats-happening/consumer-digital-index.asp
86 Stirling, A., (2019) GDP per head today is still £128 below 2008 levels. New Economics Foundation. Available at: https://neweconomics.org/2019/09/when-adjusted-for-the-lived-
experience-of-inflation-gdp-per-head-today-is-still-128-below-2008-levels
87 Alston, P., (2018) Statement on Visit to the United Kingdom, by Professor Philip Alston, United Nations
Special Rapporteur on extreme poverty and human rights. Office of the United Nations High Commissioner for Human Rights. Available at:
https://www.ohchr.org/Documents/Issues/Poverty/EOM_GB_16Nov2018.pdf
The Childhood Trust: London Child Poverty Report 2021 21Child playing at Cardinal Hume Centre,
one of The Childhood Trust’s funded projects
22 The Childhood Trust: London Child Poverty Report 2021Impact of child poverty
Education
Attainment and Exclusion: There are also inequalities in education exclusion. In 2012,
Socioeconomic inequalities persist in education, with the Department of Education found that those eligible for
young people in more deprived areas continuing to have school meals were four times more likely to be punished
significantly lower levels of attainment during secondary with a permanent exclusion than those who were not.92
school.88 According to the Mayor of London’s Office, by the This not only results in more deprived children losing out
age of 16, the most disadvantaged are on average one year on education, but also results in stunted socio-emotional
behind their peers. Additionally, London hosts a very high development, poor health outcomes, lower rate of
proportion of England’s disadvantaged students, with over employment, and a higher chance to become a victim or
a sixth of pupils qualifying for free school meals (FSM). 89
perpetrator of crime.93 Furthermore, 42% of prisoners have
These students do markedly worse than their peers who a history of permanent exclusion from school, and 1/5
do not receive FSM. Among the groups with the highest
90
children in custody struggle with learning difficulties.94
poverty rates are minority ethnic groups. Black and Gypsy/
Roma populations are particularly behind in terms of
educational attainment. Students with Special Educational
Needs and Disabilities (SEND) also do worse across
educational markers, alongside a general underfunding and
lack of support for SEND education.91
88 Institute of Health Equity (2020) Health Equity in England: The Marmot Review 10 Years On. Available at:
https://www.health.org.uk/sites/default/files/2020-03/Health%20Equity%20in%20England_The%20Marmot%20Review%2010%20Years%20On_executive%20summary_web.pdf
89 Department for Education (2019). Pupils Eligible for Free School Meals, Borough. Available at: https://data.london.gov.uk/dataset/pupils-eligible-free-school-meals-borough
90 Education Policy Institute (2017) Closing the gap? Trends in Educational Attainment and Disadvantage.
Available at: https://epi.org.uk/wp-content/uploads/2017/08/Closing-the-Gap_EPI-.pdf
91 Ibid.
92 Institute for Fiscal Studies (2019) 2019 annual report on education spending in England. Available at: https://www.ifs.org.uk/publications/14369
93 Ibid.
94 Capita-One (2016) Exploring the link between poor educational outcomes and youth crime.
Available at: https://www.capita-one.co.uk/resources/blog/exploring-link-between-poor-educational-outcomes-and-youth-crime
The Childhood Trust: London Child Poverty Report 2021 23Spending and Austerity: Childcare and youth services are essential for young
Exacerbating these issues, the Institute for Fiscal Studies children and their parents. However, in recent years, there
(IFS) report has shown that there were cuts of 8% per pupil has been a shift from targeted support of low-income
in secondary education in England between 2009/2010 families, with local spending on early years services slipping
to now, as shown below . This includes a 57% cut from 95 from 45% in 2007-08, to only 27% of spending in 2019-
local authorities. This is partly due to class size, which saw a 20. Spending shifted from early childhood development
17% increase. programmes such as Sure Start to safeguarding and
crisis intervention.
Spending per pupil or student per year at different stages of education:
actual and plans (2019-20 prices)
£10,000
Mean expenditure per pupil or student
£8,000
2019-20 prices
£6,000
£4,000
£2,000
£0
0
2
4
6
8
0
2
4
6
8
0
2
4
6
8
0
-9
-0
-1
-9
-9
-0
-0
-1
-1
-9
-0
-1
-9
-0
-1
-2
11
13
15
17
09
91
93
95
01
97
19
89
03
05
07
99
20
20
20
20
19
20
20
20
19
19
19
20
20
19
20
19
Higher education resources Secondary school Early years
Further education Primary school
95 Ibid.
24 The Childhood Trust: London Child Poverty Report 2021You can also read