FOLLOW THE MONEY Equitably financing child survival - Save the Children's Resource Centre
←
→
Page content transcription
If your browser does not render page correctly, please read the page content below
FOLLOW THE MONEY Equitably financing child survival
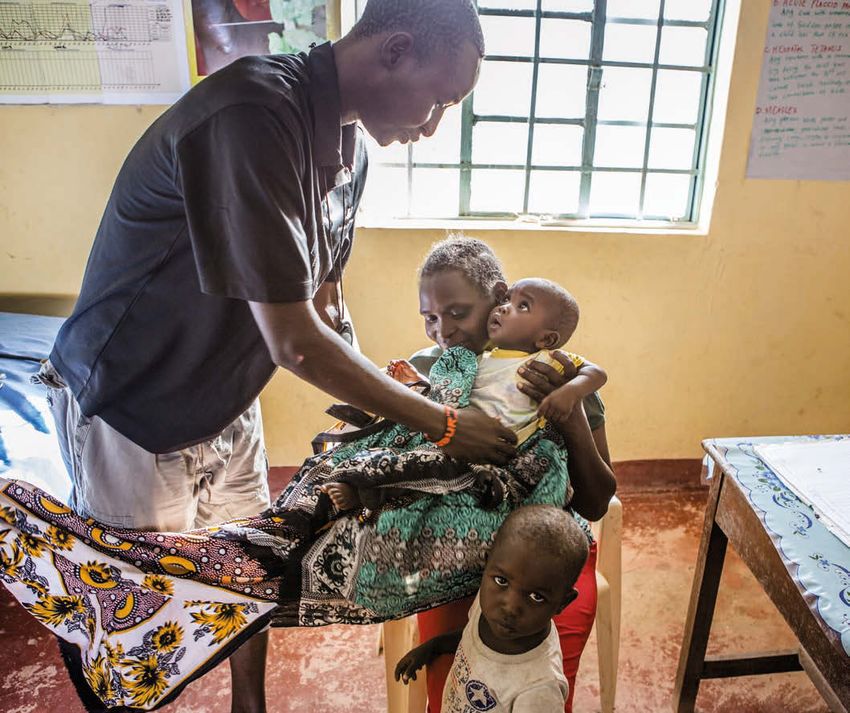
Save the Children fights for children every single day.
We stand side by side with children in the toughest places to be a child.
We do whatever it takes to make sure they survive, get protection
when they’re in danger, and have the chance to learn.
Because every child should be able to make their mark on the world
and build a better future for us all.

Acknowledgements
This report was written by Claire Leigh, Mareen Buschmann, Oliver Fiala,
Amanda Lenhardt and Beck Smith.
We are grateful for invaluable inputs from colleagues across Save the Children including
Kevin Watkins, Simon Wright, Ibrahim Alubala, Katherine Richards, Gabrielle Szabo,
Christopher Twiss, Hugh Bagnall-Oakeley, Lenio Capsaskis, Kirsten Mathieson, Andrew
Wainer, Jenny Russell, Laila Khondkar, Abdulla Al Mamun, Ashiq Iqbal, Alexis Le Nestour,
Alison Stiby Harris and Patricia Norimarna.
We are also grateful for assistance and contributions from Ravi Wickremasinghe,
Sue Macpherson, Paula Greenwood and Steph Bailey.

Published by
Save the Children
1 St John’s Lane
London EC1M 4AR
UK
+44 (0)20 7012 6400
savethechildren.org.uk

First published 2019

© The Save the Children Fund 2019

The Save the Children Fund is a charity registered in England and Wales (213890) and
Scotland (SC039570). Registered Company No. 178159

This publication is copyright, but may be reproduced by any method without fee or prior
permission for teaching purposes, but not for resale. For copying in any other circumstances,
prior written permission must be obtained from the publisher, and a fee may be payable.

Cover photo: At a health clinic in the Democratic Republic of Congo, Joy is diagnosed with
pneumonia and given antibiotics. (Photo: Charlie Forgham-Bailey/Save the Children)

Typeset by Grasshopper Design Company
Printed by Rapidity Ltd
Contents

Executive summary and recommendations                                                iv

1 Introduction                                                                        1
  Child survival is about equity                                                      1
  Enhanced equity is key to human capital development                                 2
  A fair share means more resources reach those with the greatest need                2

2 Child survival is about equity                                                      3
  Equity is key to children’s survival                                                3
  Relative gaps in child mortality rates are not shrinking                            3
  Inequalities increase the risk of a child dying before their fifth birthday         4

3 Equity and public finance                                                           7
  The three equity decisions governments need to make                                 8
  Equity decision 1: How much public resource to dedicate to health and nutrition?    8
  Equity decision 2: Which sectors and types of services to prioritise?              10
  Equity decision 3: Which beneficiaries to prioritise?                              10

4 Approaches to equity in practice: Kenya and Indonesia                              13
  Case study 1: Kenya                                                                14
  Child survival projections and convergence analysis                                15
  Equity analysis of budget allocations                                              18

  Case study 2: Indonesia                                                            24
  Finance for development in Indonesia                                               24
  National development priorities related to children                                25
  Child survival projections and convergence analysis                                26
  Equity analysis of budget allocations                                              27

5 Conclusion                                                                         30

Endnotes                                                                             31
Executive summary
     and recommendations

     In 2015 governments from around the world                 The world has registered extraordinary progress
     gathered at the UN to adopt the Sustainable               since 2000, with the child death rate falling from
     Development Goals (SDGs). The Goals span                  77 deaths per 1,000 live births in 2000 to 39 deaths
     17 commitments which, if acted upon, would                per 1,000 in 2017.1 Yet, without putting equity at the
     eradicate poverty in all its forms by 2030, reduce        heart of efforts, more than 4 million children will still
     inequality, and address the world’s most pressing         die in the year 2030. Almost all these deaths will be
     ecological challenges. Specific commitments               the result of preventable, poverty-related causes.
     include ending preventable child deaths and               Children in the poorest 20% are currently twice as
     eradicating malnutrition.                                 likely to die before their fifth birthday as children
                                                               in the wealthiest 20%. Simple arithmetic dictates
     At the heart of the SDGs is the pledge to ‘Leave
                                                               that death rates for these children need to fall more
     No One Behind’. Governments committed to ‘reach
                                                               rapidly to achieve the 2030 target, which has been
     the furthest behind first’ as part of a drive to ensure
                                                               set at 25 deaths for every 1,000 live births.
     the targets are met for all segments of society.
                                                               We include in this report two preliminary case
     The importance of the Leave No One Behind
                                                               studies, one from Kenya and the other from
     pledge has been under-appreciated, not least by
                                                               Indonesia. In both cases we look at the alignment
     the governments who signed it. Many of the SDGs
                                                               of current public health financing with the SDG
     will be unattainable unless those furthest from
                                                               commitment to Leave No One Behind.
     achieving the goals move furthest and fastest. This is
     a matter of simple arithmetic. Because those social       For Kenya our research found regional public
     groups most distant from the goals have to travel         health expenditure does not correlate to child health
     further to achieve the 2030 targets, they have to         deprivation. Both under-five mortality and stunting
     travel faster. Implicit in the Leave No One Behind        levels are particularly high in poorer communities.3
     pledge is a commitment to achieving some degree           In general, counties with higher mortality rates
     of convergence between the better-performing and          and/or stunting levels are the counties with lower
     worse-performing groups through a reduction in            than average per capita health spending. For
     social disparities.                                       instance, in Migori, a county with child deprivation
                                                               rates double the average, per capita health spending
     While convergence is easily measurable, decision
                                                               is less than $25 and well below the average.
     makers have not yet made the tracking of
                                                               Similarly, while World Bank data suggests that the
     convergence a key element in SDG reporting. That
                                                               poorest 40% of people in Kenya secure a share
     matters because turning the spotlight on those being
                                                               of the benefits of health spending commensurate
     left behind and reporting on their progress can help
                                                               with their population share, they also account
     guide public policy design, strengthen accountability,
                                                               for 58% of child mortality and 57% of stunting –
     and put equity at the centre of efforts to implement
                                                               raising fundamental questions for equity and
     and achieve the SDGs.
                                                               SDG prospects.
     This report focuses on equitable financing of
                                                               Indonesia is on track to meet the SDG target
     child survival. We show that, in the absence of a
                                                               for child mortality based on Save the Children’s
     concerted drive to reduce social disparities, the
                                                               projections; but it will not reach the furthest behind
     2030 target to end preventable deaths of newborns
                                                               first (and by doing so accelerate reaching the
     and children under five years of age will be missed.

iv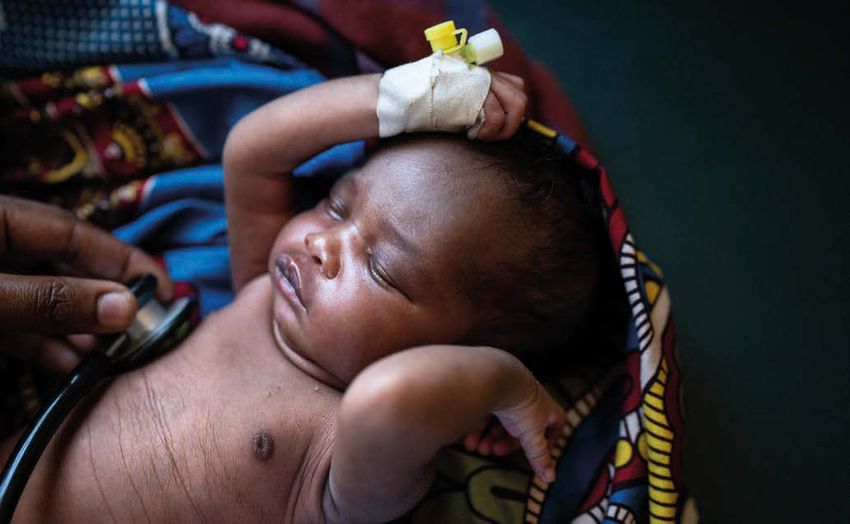
overall goal). Our analysis found large inequalities     2. Governments should do far more to

                                                                                                                   EXECUTIVE SUMMARY AND RECOMMENDATIONS
in public expenditures on health per capita across       understand, track and report on inequalities
provinces – ranging from US$7 per capita in 2012         in health outcomes, budgets and services,
in North Sulawesi to $131 in North Sumatra, with         including:
a population-weighted average of $26 per capita.2        • accelerate child mortality reduction targets for
On average more public health resources are                 the poorest 20–40% so that these groups are on
spent in the provinces with higher mortality rates.         a trajectory for achieving the SDG target
However, this does not seem to be a deliberate           • financing provisions aimed at translating equity
decision, as the analysis also found counter-               goals into service delivery provisions
examples where, for instance, Central Sulawesi and       • establishing transparent reporting systems so
North Maluku allocated similar amounts to health            that citizens can assess government performance
services as Jakarta or Bangka Belitung, respectively,       on equity
despite having child mortality rates more than           • publishing disaggregated data and detailed
2.5 times higher.                                           budget data, where available, to improve
                                                            transparency and public scrutiny
Without accelerated action and a focus on equity
                                                         • providing opportunities for meaningful child
we will not achieve child survival targets.
                                                            participation in the budgetary process so that
Governments and development partners have to
                                                            the priorities of children from deprived and
take action to address the disadvantages facing the
                                                            marginalised groups can be integrated.
most deprived and marginalised children. The profile
of deprivation varies across countries, with wealth,     3. Public finance is key for child survival.
gender, ethnicity and location recurrent themes.         Essential health and nutrition services should
Public finance has a critical role to play not just in   be free at the point of use, funded primarily
financing the services needed to reduce child            through domestic taxation, supplemented
mortality, but in narrowing social disparities in        by overseas development assistance.
what is perhaps the single most inequitable, unfair      Country governments must:
and unjustified of all social disparities – inequality   • ensure delivery of universal health coverage,
in prospects for survival.                                  with good-quality primary healthcare,
                                                            including nutrition services, for all deprived and
                                                            marginalised populations first
RECOMMENDATIONS                                          • eliminate out-of-pocket payments so that health
                                                            services are free at the point of use by shifting to
To achieve child survival targets, governments,             public financing
donors and multilateral agencies need to put the         • identify and prioritise progressive tax reforms
SDG pledge to Leave No One Behind at the heart              and strengthen tax capacity to equitably increase
of financing decisions. Based on our case studies           domestic revenue in order to achieve a minimum
and wider considerations, Save the Children is              of 5% of GDP as government spending on health
calling for the following action:                        • develop costed health and nutrition plans that
1. Governments should enshrine equity-based                 include clear steps for increasing equitable
allocation criteria in their budget processes               financing for child survival.
to align resources with need and reduce                  4. The IMF, World Bank, UN agencies and
disparities in child health and nutrition,               donors should act on the SDG pledge to
including:                                               Leave No One Behind through practical
• higher levels of per capita spending for those         measures, including:
   children and those districts furthest from the        • focusing bilateral and multilateral aid on the
   SDG targets                                              countries and groups that are furthest away
• spending aimed at narrowing disparities based             from reaching SDG goals
   on wealth, gender, ethnicity and other markers        • including in all World Bank Public Expenditure
   for disadvantage                                         Reviews an assessment of equity in public finance,
• targeting resources based on geography and/or             with an emphasis on requirements for those
   household characteristics.                               furthest from reaching the 2030 targets

                                                                                                                                   v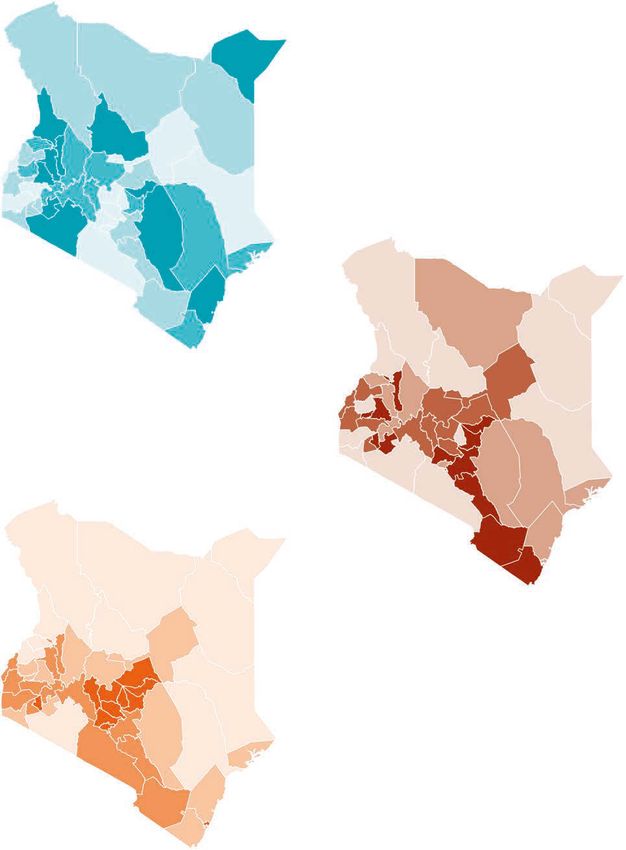
• disaggregating the World Bank’s Human National Reviews to include specific guidance
FOLLOW THE MONEY
Capital Index data to report equity in on how countries should report on progress for
outcomes reporting furthest behind groups, with a focus on children
• including an assessment of the fiscal conditions • honouring commitments made by donors under
for reducing social disparities in IMF Article IV the Addis Tax Initiative and working together
consultation and reports to curb illicit financial flows, with a focus on
• supporting governments in their efforts to improving transparency through public registries
regularly share detailed, harmonised and of beneficial company ownership and public
current budget data sets, with a view to country-by-country reporting for large companies
improving the availability, granularity and • renewing and extending their commitments
overall quality of the data in the World Bank’s to support increased and equitable domestic
Open Budgets Portal (BOOST). resource mobilisation and strengthen tax
• supporting national data capacity-building capacity in partner countries when the current
efforts to enable evidence-based decisions Addis Tax Initiative period expires in 2020
on who is being left behind that can inform • exploring eligibility criteria for external health
spending decisions and drive progress in and nutrition financing assistance that is linked
gender-responsive budgeting to maintaining and increasing domestic financing
• updating the UN Secretary General’s voluntary for health and nutrition to prevent displacement
common reporting guidelines for Voluntary of domestic resources.
PHOTO: JONATHAN HYAMS/SAVE THE CHILDREN
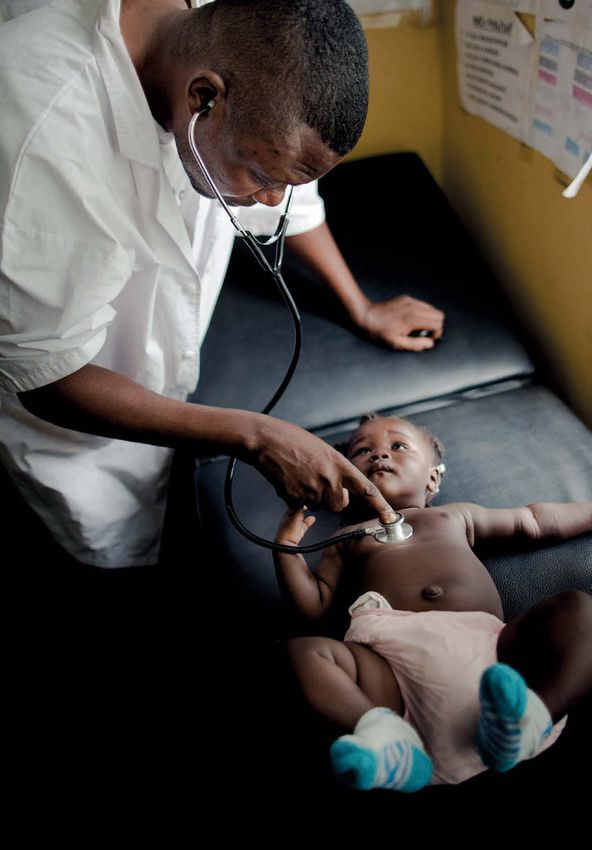
Robert, nine months, is diagnosed with pneumonia at a clinic Save the Children supports in Turkana county, Kenya.
vi
1 Introduction

In 2015, world leaders came together and, with the Sustainable Development Goals (SDGs),
agreed a common road map to global prosperity, peace and sustainability. Ranging from
eradicating poverty in all its forms, to ending preventable child deaths, achieving universal
education, reducing inequalities, including gender inequalities, and combating dangerous
climate change, the SDGs are undeniably ambitious. Yet they are also achievable. For the
world’s most deprived and marginalised children, and for the world they will both inherit
and create, the 2030 goals could be nothing short of transformative.

At the heart of the SDGs is the pledge to ‘Leave          be thought of as an equity gap. Death rates for
No One Behind’ – a commitment to put those                children in the world’s poorest 20% of households
furthest behind first and ensure that targets are         are typically two to three times the level for
met for all segments of society. That commitment is       the wealthiest 20% – and are 40% above the
rooted in the idea of fairness, universal human rights    global average.
and moral purpose. It therefore matters as an end
                                                          It follows from this backdrop that, to achieve
in itself. But leaving no one behind is also a means
                                                          the SDGs, progress at the bottom end of the
to the end of achieving the 2030 goals. Failure to
                                                          distribution for child survival has to be more rapid.
narrow the gap between those children who are
                                                          There is simple arithmetic behind this proposition.
furthest behind and the rest of society is acting as
                                                          Children furthest from the SDG target have to
a brake on overall progress and now threatens to
                                                          travel further and faster to achieve the same goal
derail the whole SDG agenda.
                                                          as children closer to the target. Put differently,
This report looks at an SDG goal that should be           achieving the SDG on child survival requires
at the centre of every government’s agenda – child        overall progress, but with convergence so that
survival. SDG 3.2 states that we will “by 2030, end       social disparities narrow and the poorest children
preventable deaths of newborns and children under         catch up. Beyond the arithmetic are deeper moral
5 years of age”.1 The specific threshold that has         issues: the idea that a child should have less chance
been set for this target is 25 deaths/1,000 live births   of survival because they are born into a poor
(the rate for low-income developing countries was         household is inconsistent with the basic precepts
69 deaths/1,000 live births in 2017 2 ). However, ‘no     of universal human rights.
preventable deaths’ should be interpreted to mean
                                                          Every child death is a tragedy, but the wider social
exactly that, and the threshold should be viewed as
                                                          and economic costs of child mortality are also huge.
a bare minimum.
                                                          Investments in ‘human capital’ – broadly defined as
                                                          the potential of individuals – are the most important
                                                          long-term investments any country can make for its
CHILD SURVIVAL IS ABOUT EQUITY
                                                          people’s future prosperity and quality of life. 5 The
Progress in child survival has been one of the            foundations for human capital are laid in childhood:
great human development success stories of the            in the health, nutrition and schooling that children
21st century with child mortality levels dropping         take into adult life. Child mortality is a sensitive
from 12.6 million in 1990 to 5.4 million in 2017.3        barometer of the health problems that blight the
While these advances are to be celebrated, there          development of so many children, including the
is no room for complacency. On current trends             cognitive development that will determine their
more than 4 million children will die under the age       prospects for learning. The World Bank’s new
of five in the year 2030.4 Much of the shortfall can      Human Capital Index, launched in 2018, shows that

                                                                                                                  1
56% of children born today across the world will           arrangements are critical to accelerated progress
FOLLOW THE MONEY

                   lose more than half their potential lifetime earnings      towards the SDGs.7 Delivering access to a basic
                   because governments are not currently making               package of essential health services costs an
                   effective investments in their children to ensure a        estimated $86 per capita.8 Meanwhile, the World
                   healthy, educated and resilient population ready for       Bank has estimated that a minimum additional
                   the workplace of the future.6                              US$7 billion is required globally every year for
                                                                              nutrition-specific interventions alone up to 2025.
                                                                              Most of these resources should be generated
                   ENHANCED EQUITY IS KEY TO                                  through domestic revenue raising, with governments
                   HUMAN CAPITAL DEVELOPMENT                                  spending 5–6% of gross domestic product (GDP)
                                                                              on health. Most countries fall far short of this goal,
                   Enhanced equity is one of the most powerful motors         with domestic government expenditures on health
                   for driving human capital development. To state            on average at 2.8% and 1.2% of GDP in middle- and
                   the arithmetically obvious, closing the gap between        low-income countries, respectively.9 Expenditures
                   the poorest 20% and the richest 20% in the World           as a share of GDP have even fallen since 2005
                   Bank’s Human Capital Index (without lowering               in low-income countries and have been stagnant
                   the level of the richest quintile) would increase the      since 2010.
                   average score of every country. Viewed through the
                   prism of the SDGs and the human capital approach,
                   enhanced equity is a critical condition for progress.      A FAIR SHARE MEANS MORE
                   Yet SDG monitoring systems have conspicuously              RESOURCES REACH THOSE
                   failed to document and report on social disparities
                                                                              WITH THE GREATEST NEED
                   and the pace of convergence. The same has been
                   true for initial World Bank reporting on human             How resources are allocated within the health
                   capital, though efforts are under way to address           resource envelope also matters. The most
                   this gap.                                                  basic definition of equity is that people facing
                   The reporting deficit matters on two counts.               disadvantages associated with extreme deprivation
                   First, as the old adage goes, ‘what gets measured          will have a greater claim on resources. That
                   gets done’. Tracking what is happening to social           principle applies with special force to children. If a
                   disparities on child survival and the indicators that      child faces elevated risks of mortality as a result
                   affect survival prospects is critical for accountability   of the poverty of their parents or their nutritional
                   to citizens. Transparently reporting on inequalities       status, even a minimalist approach to equity would
                   can help turn the public policy spotlight on               require that they have a greater claim on support
                   inequalities in child survival. Second, and relatedly,     than a child facing minimal risks as a result of
                   reporting on social disparities is needed to inform        parental wealth. Yet all too often public finance
                   policies on public finance. Inequalities in child          is skewed towards wealthier groups or regions,
                   survival are the product of many factors, not all          with allocations of resources favouring those areas
                   of which are amenable to solutions through public          where stunting and child mortality rates are lowest,
                   financing. However, public finance can play a              rather than where the needs are greatest. And all
                   crucial role in mitigating the disadvantages faced         too often resources are spent on services that do
                   by marginalised children by providing them with            not reach the most marginalised communities –
                   access to decent-quality health provision.                 for example, on urban teaching hospitals rather
                                                                              than community health workers and primary
                   Health systems that are properly financed through          healthcare services.
                   progressive taxation and deliver services through
                   efficient, accountable and equitable institutional

   2
2 Child survival is about equity
EQUITY IS KEY TO survival prospects, children born into the poorest
CHILDREN’S SURVIVAL sections of society face a 37% increase in risk
of mortality.2
Preventable child mortality is a window onto
wider social disparities which, if not urgently
addressed, could prevent the world from reaching RELATIVE GAPS IN CHILD MORTALITY
the SDG targets. RATES ARE NOT SHRINKING
As Figure 1 shows, the poorest 20% of children Tracking disparities in child survival is difficult
account for a disproportionate share of child deaths. because of data gaps and poor reporting. To
Globally, children from the poorest households are address this, Save the Children has created a
nearly twice as likely to die before the age of five as database called GRID – a child inequality tracker –
children in the wealthiest households.1 To put these which uses survey data to monitor not just average
figures differently, compared with a distribution in national progress towards the SDGs, but progress
which circumstances of birth have no influence on by different social groups. This enables us to track
FIGURE 1: THE POOREST 20% OF CHILDREN ACCOUNT FOR A DISPROPORTIONATE SHARE
OF CHILD DEATHS
150
120
Under-five mortality
90
60
30
0
a
a
of n da
E t n ia
ha an
am tan
d ’ la
Le on
ho
go
e
of r ia
in
ra g e r
i
d
es
h
bl Ug a
Ta en
ia
P tan
e
am re
al
on
qu
ha
es
si
di
y
en
op
go
in
C voi
m
o
on
ot
M
en
d
ne
e
a
In
ad
i
s
s
bi
Le
er
C
a
u
pp
N
bl N ig
B
M ak i
ni
nz
hi
n
Ye
s
K
C
S
I
do
A
gl
il i
In
an
e
Ph
fg
oz
er
ôt
ic
ic
B
A
Si
C
pu
pu
Re
Re
c
ti
ra
oc
em
National average Poorest 20% Richest 20%
D
Data: DHS/MICS, accessed via GRID.
3disparities linked to wealth, gender, ethnicity and As highlighted in Figure 2, the richest 20% group
FOLLOW THE MONEY
other markers of disadvantage. The broad picture is on track to achieve the SDG target of 25 deaths
to emerge is that absolute disparities between child per 1,000 live births and – on average – the world
mortality rates for the poorest 20% in the world is within touching distance of a trajectory that
and the global average have decreased between will see the SDG 3.2 goal achieved. However, the
2000 and 2018, with the gap in mortality narrowing poorest 20% group is far off-track. For example,
from 30 to 14 deaths/1,000 live births (a reduction of while countries like India and the Philippines are
more than 50%). The gap between child death rates on-track to achieve the SDG target on average,
among the poorest and richest 20% of households the poorest 20% is likely missing the target and the
has also narrowed.3 ratio of poorest-to-richest child deaths is very
high. 5 Furthermore, relative inequalities in child
However, while the poorest children are
death rates between the richest and poorest even
undoubtedly doing better overall, the gap between
increased slightly while death rates decreased
the poorest children and the global average has
on average, an effect which is mostly driven by
remained proportionally the same. In other words,
lower‑middle-income countries.6
while absolute inequality has decreased, relative
inequality has been static. The ratio of child death
rates between the poorest 20% and the global
INEQUALITIES INCREASE THE RISK
average fell by less than 2% between 2000 and
2016.4 In the latter year, children born into the OF A CHILD DYING BEFORE THEIR
poorest households were twice as likely to die as FIFTH BIRTHDAY
those born into the richest households, just as they
were in 2000. On one critical measure of equity, The disparities captured in our GRID data reflect
our data therefore suggests that governments wider inequalities in access to health services and
have yet to act on the commitment to achieve good nutrition in children under five. Children born
accelerated convergence by reducing disparities. into the poorest households face elevated risks as a
result of interlocking disadvantages that range from
FIGURE 2: RELATIVE INEQUALITY IN UNDER-FIVE MORTALITY HAS BEEN STATIC SINCE 2000
FOR THE POOREST 20% OF CHILDREN, DESPITE IMPROVEMENTS IN ABSOLUTE LEVELS
OF INEQUALITY 7
125
Under-five mortality rate (per 1,000 live births)
100
75
50 Poorest 20% globally
25 Global average
0
2000 2010 2020 2030
Data: Save the Children calculations based on UN Inter-agency Group for Child Mortality Estimation, DHS/MICS, and other sources.
Dotted lines indicate projections.
42 CHILD SURVIVAL IS ABOUT EQUITY
FIGURE 3: ELEVATED RISKS FOR CHILDREN BORN INTO THE POOREST HOUSEHOLDS
100
89%
Health access by wealth group (%)
80
72%
65%
60 55%
47%
42%
40
20
Poorest 20%
Richest 20%
0
Skilled birth attendance Health seeking for ARI Basic vaccination
Data: DHS/MICS. Subset of countries (42 countries for skilled birth attendance, 67 countries for health seeking behaviour for children with ARI,
and 81 countries for vaccination) with data 2012 and newer.
the access of mothers to skilled birth attendants disproportionately higher mortality rates for girls
and postnatal care, to more restricted access to in some countries.14 Historically in South Asia,
immunisation and healthcare (see Figure 3). Nearly 43% more girls have died from pneumonia than
half of all deaths in children under five are linked to boys, despite boys being physiologically more
undernutrition, which contributes to the deaths of vulnerable to the disease.15
2.5 million children every year. These mostly occur
The challenges faced by deprived and marginalised
in low- and middle-income countries. Background
children are powerfully illustrated by child mortality
risks such as poverty and maternal education also
gaps – the most extreme result of inequality. Among
play a key role.
this group of children, those who survive to the age
Gender inequalities also have an important impact of five are often permanently disadvantaged by
on children’s health outcomes. Gender discrimination poor nutrition and ill-health, denied the opportunity
and unequal access to healthcare have led to to thrive and develop as they should. The impact in
PNEUMONIA, A DISEASE OF POVERTY
Pneumonia, a disease from which two children are less likely to receive these immunisations
under-five die every minute, illustrates the impact than their wealthier peers. For example, in
of inequality on children’s health outcomes.8 Nigeria DTP3 immunisation rates for the
Poor or malnourished children are much more wealthiest 20% of households is ten times
likely to catch pneumonia and less likely to higher than for the poorest 20% of households
survive an episode.9 Children from poor and (79.6% and 7.4% respectively).11
marginalised households are also much less
Slow progress in ending malnutrition has also
likely to see a health worker when they have
held back progress on pneumonia. Malnutrition
symptoms.10 Figure 3 illustrates the significant
is associated with nearly half of all pneumonia
wealth gap in parents taking children with acute
deaths,12 yet Save the Children forecasts that
respiratory infection, or suspected pneumonia
119 million children will still be stunted by 2030,
(labelled ‘health-seeking for ARI’) to clinics.
with children in the poorest households at
Immunisation offers a powerful source of 58% higher risk.13
pneumonia prevention. Yet the poorest children
5adulthood – not only on their personal outcomes, status. Using this methodology to rank countries by
FOLLOW THE MONEY
but also their economic productivity – can be their children’s productive potential, the Bank has
devastating. The World Bank’s Human Capital calculated that between 10% and 30% of per capita
Project measures what ‘human capital’ a child born GDP differences are attributable to cross-country
today could expect to have by the age of 18, based differences in human capital.16
on his or her health, years of schooling and nutrition
PHOTO: JONATHAN HYAMS/SAVE THE CHILDREN
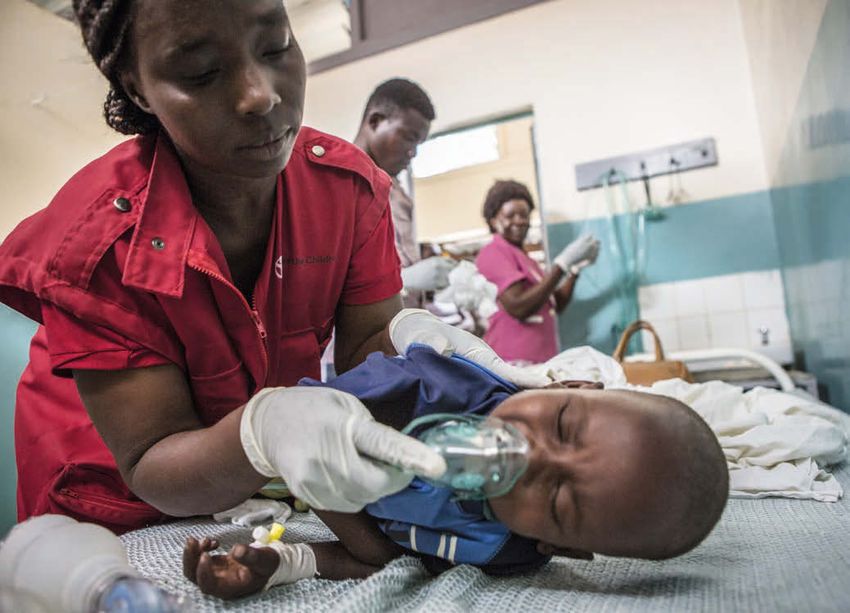
Jackson, age three, suffering from
severe pneumonia, is given oxygen
at a hospital in Turkana, Kenya.
THE DEADLY THREAT OF CHILDHOOD PNEUMONIA: JACKSON’S STORY
Maximilla and her three children live in a rural Maximilla couldn’t afford the bus fare to hospital
area of Lodwar County in Kenya. Desperately so made the long journey on foot over several
poor, Maximilla struggles to feed her family. days. When she got there, she couldn’t afford to
When her youngest child, three-year-old buy a patient’s card for treatment. “This delayed
Jackson, fell ill, she feared for his life. She has getting admission and Jackson’s condition
already seen two children die under the age became worse,” says Maximilla.
of five.
Once admitted, Jackson was diagnosed with
“Jackson was tirelessly crying, refusing to eat, pneumonia – he had not been immunised against
had a fever and was shivering,” said Maximilla. the disease. The delay in getting treatment for
“He had heavy breathing and was vomiting pneumonia meant his condition was very serious.
when he drank water… I could see his chest He was also malnourished. He was given oxygen,
moving up and down.” antibiotics and nutrition supplements, and was
kept in hospital for three weeks. Thankfully,
Jackson made a full recovery.
63 Equity and public finance
There is a powerful unstated principle in the SDG pledge to ensure that those furthest
from the 2030 targets move fastest and furthest. That principle is equity; the belief that
unfair, unjust and remediable social disparities should be reduced. Disparities in child
survival represent a stark example of inequity. Whatever wider views one might hold
on, say, the appropriate limit to inequality in the distribution of income, there is no
moral or ethical basis for the argument that a child born to a poor parent should have
a diminished chance of survival.
Converting the principle of equity into practice alike. Governments need to align real budget
raises critical questions for public finance. Equitable allocations and delivery with their SDG
finance requires taking the higher costs of persistent commitments. This is an intensely political exercise
inequalities into account and providing more since it requires balancing the legitimate claims
resources to counteract them, on top of expanding of the most disadvantaged against the claims of
the general resources available for health and politically powerful groups. The policy choices
nutrition. The Nobel Prize-winning economist facing governments are also not straightforward.
Amartya Sen has illustrated this point by reference Even a government with a strong commitment to
to disability. In an important essay, he pointed equity has to weight factors such as the depth of
out that for a person with disability to achieve disadvantage with headcount considerations. Is it
the same level of opportunity as a non‑disabled better to reach greater numbers of disadvantaged
peer, they may need to secure greater investment.1 children or to concentrate resources on the most
By extension, providing two children with vastly disadvantaged? And is it more efficient to target the
different prospects of survival as a result of their most disadvantaged through special programmes
different social and economic circumstances or to deliver universal services? There are no simple
with equal amounts of public finance would not answers to these questions – but in addressing
represent an equitable approach. Children living them every government needs to weigh equity in
with malnutrition, limited access to care and the balance.
poverty‑related disease risks will need more access
Multilateral actors must also do far more to
to resources than more advantaged peers to secure
turn the spotlight on inequalities. The World
an equivalent chance of survival. Narrowing gaps
Bank’s initial Human Capital Index methodology,
implies that the most disadvantaged should have a
for example, looks at national averages without
greater claim on resources, and that they should
reference to national disparities – an omission
secure a greater benefit from these resources.
that future iterations will need to address if the
The commitment to Leave No One Behind thus Human Capital approach is to provide a tool for
requires a radical rethink in financing approach advancing equity.2
from governments and multilateral stakeholders
7THE THREE EQUITY DECISIONS middle‑income countries between 2000 and 2016,8
FOLLOW THE MONEY
GOVERNMENTS NEED TO MAKE most developing countries spend far below global
spending targets on health.
Finance and budgeting decisions have a direct This matters because a country’s ability to finance
impact on child survival outcomes. That is because universal health coverage and prioritise the people
they have a bearing on background risks – such who are furthest behind depends on sufficient public
as poverty; on ending malnutrition, which is vital resources. For instance, with health spending making
for both treatment and prevention of dangerous up just 9% of its national budget (ie, six percentage
childhood disease; and on access to basic points below Abuja targets), Malawi struggles to
services, including critical health services such as implement its National Health Insurance Scheme,
immunisation, diagnosis and treatment. designed to ensure universal health coverage for the
Every stage of the budgeting process matters from poorest people.9 Meanwhile in China, budget deficits
an equity perspective, there are three key ‘equity at province level, together with income inequality,
decisions’ that governments must make, all of have been found to perpetuate health inequalities
which have been shown to have an impact on between rural and urban areas.10
child survival: The proportion of a country’s health services
• First, how much public resource to dedicate that are financed through tax, aid and private
to health and nutrition overall contributions also has an impact on equity. If the
• Second, which types of services to prioritise tax share of health finance is low, private out-of-
• Third, which beneficiaries to prioritise, pocket expenditure has to make up the gap (see
and whether those in greatest need and facing Figure 4). This exacerbates inequalities in access
the most severe vulnerabilities are getting a for a simple reason: the poorest are the least
fair share. likely to be in a position to afford care. Out-of-
pocket spending is the most regressive form of
financing health coverage and has devastating
EQUITY DECISION 1: HOW MUCH
effects for the poorest and most marginalised
PUBLIC RESOURCE TO DEDICATE groups. In Bangladesh, for example, private out-
TO HEALTH AND NUTRITION? of-pocket payments make up a substantial portion
of health financing (67% in 2015)11 and, despite
Governments need to significantly increase the some equity measures having been taken, the
overall budget envelope for health and nutrition latest available health indicators show persistent
services in order to fund decent quality services, inequalities in regard to gender, rural–urban divide,
while reducing the financial burden on poor and poverty.12, 13 According to the World Health
households. Resource gaps to finance child survival, Organization (WHO), out-of-pocket spending
including mitigating against some of the high-risk pushes around 100 million people worldwide into
factors such as malnutrition, are vast.3 Starting from extreme poverty each year. 14
current financing levels, low-income countries would
need to more than double, and lower-middle-income Recent WHO figures also serve as a wake-up call,
countries would need to triple their expenditure to since they suggest that low-income countries may
provide universal health coverage.4 Nutrition too be using increased aid to cut domestic financing for
has been consistently under-financed. Calculations health. Figure 5 shows that low-income countries
from Save the Children suggest that, at a minimum, have been heavily reliant on aid to expand financing
an additional $23.25 billion is required per year to for health services. In contrast, in middle-income
meet SDG2 by 2030. 5 countries tax for health is increasing and aid has
declined; on average, aid makes up less than 1% of
The Abuja Declaration in 2001 called on African global health spending.15
governments to allocate at least 15% of their
national budgets to the health sector.6 But the Kenya provides a good example of successful
median value of spending as a share of national transition. The country’s resource composition
budgets that low-income countries allocate to the for health has changed over time – between 2000
health sector actually dropped from 7% to 5% and 2013 aid grew steadily from 4% to 6% of
between 2005 and 2015.7 While spending on gross national income (GNI). Since Kenya became
health grew by around 6% on average in low- and a lower-middle-income country in 2015,16 aid
83 EQUITY AND PUBLIC FINANCE
FIGURE 4: WHERE THE TAX SHARE OF HEALTH FINANCE IS LOW, OUT-OF-POCKET
EXPENDITURE HAS TO MAKE UP THE GAP
90
Guinea
Afghanistan
Out-of-pocket as % of total health spending
Myanmar
80 Sierra Leone
Côte d’Ivoire
Yemen
Chad
70 Azerbaijan Georgia
Sudan
Bangladesh
Albania
60 Paraguay
Armenia Guatemala
Mauritius
50 Pakistan
Cyprus Ecuador
Sri Lanka Bulgaria
Kenya
40 Indonesia
Malaysia
Libya Russia Switzerland
30 Bolivia Costa Rica
Madagascar Zambia Portugal
Romania Hungary Spain
20 Saudi Arabia Colombia Italy
Papua New Guinea Sweden Lesotho
Uruguay Slovenia Japan AustriaGermany Denmark
Oman Malawi East Timor USA
10 New Zealand
United Kingdom
Namibia Botswana France Cuba
Netherlands
0
0 1 2 3 4 5 6 7 8 9 10
Government spending as % of GDP
Source: Xu K, Soucat A & Kutzin J et al. Public Spending on Health: A closer look at global trends. Geneva: World Health Organization; 2018
(WHO/HIS/HGF/HFWorkingPaper/18.3), p. 19
decreased from 6% in 2013 to 3.2% in 2017. Since In the long term, countries should look to mobilise
then the country has broadened its tax base to the domestic revenues needed to underpin health
mobilise 18% of GNI through domestic revenue,17 systems. In many countries that means broadening
and has recently made use of international and deepening the tax base and reducing
bond markets.18 opportunities for tax evasion. According to Overseas
FIGURE 5: LOW-INCOME COUNTRIES HAVE BEEN HEAVILY RELIANT ON AID TO EXPAND
FINANCING FOR HEALTH SERVICES 19
Low Lower-middle Upper-middle High
2000
2001
2002
2003
2004
2005
2006
2007
2008 7 8 46 6 207 6 1,798 1
2009
2010
2011
2012
2013
2014
2015
2016 9 10 58 7 267 3 2,257 2
0 5 10 15 20 0 20 40 60 0 50 100 150 200 250 0 500 1,000 1,500 2,000
US$
Per capita public spending on health Per capita spending on health from external sources
Source: Xu K, Soucat A & Kutzin J et al. Public Spending on Health: A closer look at global trends. Geneva: World Health Organization; 2018
(WHO/HIS/HGF/HFWorkingPaper/18.3)
9Development Institute estimates, low‑income dedicated to primary-level healthcare – a crucial
FOLLOW THE MONEY
countries have the potential to increase their tax sector for reducing child mortality. Yet budgets
revenues from 17% to 19% of GDP; and middle- are often skewed away from community-based
income countries from 25% to 30%.20 Progressive interventions supported by primary health clinics
domestic resource mobilisation, done well, can also and towards tertiary healthcare.23
help to tackle inequalities rather than reinforce
Low- and middle-income countries as a group
them.21 When a country is increasing its tax income,
currently allocate less than 40% of their public
this needs to be done through progressive taxation,
expenditure on health to primary healthcare,
such as income tax. Regressive forms of taxation,
although levels vary significantly between
such as value-added tax, require all parts of society
countries.24 This has a negative impact on child
to pay the same share of tax irrespective of their
survival, as the out-of-pocket spending needed to
wealth. The poorest households therefore risk
finance life-saving healthcare can push patients
becoming poorer when buying essential goods and
into poverty or prevent access to life-saving
food as a result of regressive taxes.
treatment altogether.
EQUITY DECISION 2: WHICH EQUITY DECISION 3: WHICH
SECTORS AND TYPES OF SERVICES BENEFICIARIES TO PRIORITISE?
TO PRIORITISE?
If the commitment to equity made through the
Decision-makers also need to consider which SDGs in 2015 is to be honoured, decision-makers
sectors and types of services are prioritised in order need to ensure that those in greatest need and
to reach those who are furthest behind. Evidence facing the most severe vulnerabilities are getting
has shown that the most deprived and marginalised a fair share of resources. Allocating a fair share
children benefit more from primary healthcare of health and nutrition budgets to the children
services than generic hospital spending.22 According most in need must mean prioritising those children
to the WHO, 57% of health expenditure should be most at risk of dying before the age of five.
In a hospital in Kenya, Julliet
provides kangaroo mother care
to her baby, born premature.
PHOTO: SIEGFRIED MONDOLA/SAVE THE CHILDREN
10Allocation of international resources needs to Research suggests that well-designed resource
3 EQUITY AND PUBLIC FINANCE
focus on those furthest behind. Donors and allocation formulas can successfully increase
multilateral agencies could themselves do far equity in health outcomes across regions.27 Several
more to prioritise those children who are furthest southern African countries have integrated equity
behind in the design of aid programmes and in the measures into their budget allocation, and this has
allocation of aid to countries with the greatest led to progress towards more equitable health
levels of need, including low-income countries and outcomes.28 For instance, Mozambique’s resource
conflict-affected and fragile states. The Overseas allocation formula has over time led to increased
Development Institute finds that currently a person equity in health.29
living in extreme poverty in a middle-income
In addition to fair regional budget allocations,
country receives on average ten times the amount
redistribution and equity measures – such as fee
of aid that goes to someone living in extreme
waivers and universal health insurance – can ensure
poverty in a low-income country.25
resources reach those in greatest need. In Ethiopia,
At the national level, budget formulas need to for instance, fee waivers have led to progress in
integrate equity considerations. The formulas enabling the poorest groups to access health and
governments use to allocate their budgets to nutrition services free of charge.30
different regions hold a lot of potential for tackling
Systematically prioritising the furthest-behind
inequalities in child survival. Again, there is scope
groups in financing decisions also means seeking
for a more rigorous focus on need. Setting up a
their inputs into the budgeting process and
well-thought‑through allocation formula is a crucial
addressing the specific barriers facing these groups.
first step in ensuring the poorest people get a fair
Children’s participation in the budget-making
share of resources. Without regional resource
process and increased attention to tackling gender
allocation formulas, health resources tend to be
inequalities through gender-responsive budgeting
concentrated in wealthier regions, to the detriment
can help generate more equitable outcomes in
of poorer parts of the population.26
health expenditures.
GENDER-RESPONSIVE BUDGETING
Children’s survival is critically linked to women’s • integrating gender analysis and costings
and girls’ health. Financing child survival into national and subnational budgets
therefore requires investment in mothers’ health • reviewing spending decisions to test the
and nutrition, to reduce adolescent deaths gendered impact of the budget.
through pregnancy complications and ensure
In Nepal, gender-responsive budgeting has led to
all children get the best start in life.
a shift from ‘arbitrary assignment of percentages’
‘Gender-responsive budgeting’ can contribute to national budget allocations informed by
to more equitable resource allocation – both analysis of the different needs of men, women,
towards the most marginalised groups across boys and girls.32 In Sri Lanka, gender-responsive
a country, and within the health and nutrition budgeting has led to a greater understanding of
sectors. Its aim is to ensure that the way finances the intersecting impact of gender and of reduced
are raised, allocated and spent improves gender access to services in rural areas. Responding to
equality and women’s and girls’ empowerment.31 these findings, in 2016 the government issued a
Gender‑responsive budgeting helps in requirement that 25% of all rural development
implementing a vertical equity approach by: budgets be allocated to efforts to improve
• identifying gendered needs of the population outcomes for women and girls.33
• costing services and activities required to
meet those additional needs
11FOLLOW THE MONEY
CHILD PARTICIPATION IN BUDGETING, BANGLADESH
Systematically prioritising the furthest-behind representatives from the poorest income groups,
groups also means seeking their inputs to then shared their demands with the Ministry of
understand what their needs are and reflecting Finance and the media. As a result, the budget
these in budgetary decisions. In Bangladesh the for 2018–19 reflected several of the demands
national budget-making process has historically raised by children (shown in Table 1), albeit not
been highly centralised and non-participatory. in full.
However, in recent years different professional
The Ministry of Finance acknowledged the
groups and civil society have been consulted by
children’s right to participate in the process and
the Ministry of Finance.
decided to make the pre-budget consultation
Since 2017, following Save the Children with children a regular practice.
Bangladesh’s advocacy, the Ministry of
Children’s participation in the budget-making
Finance created an opportunity for children to
process has had positive results. However, it
participate in a pre-budget consultation. The
needs to go further, by increasing the impact of
National Children’s Task Force, with the support
children’s participation in the budget formulation
of Save the Children, conducted a survey among
phase and by involving children in tracking
4,800 children from all 64 districts in Bangladesh.
public expenditure on protecting and realising
A group of child representatives, which included
child rights.
TABLE 1: REFLECTION OF CHILDREN’S PRIORITIES IN BANGLADESH’S BUDGET 2018/19
Children’s demand Sufficient response from the budget?
More schools, particularly in Char and Haor areas Yes
Libraries, laboratories, multimedia class rooms, better
Not enough
trained teachers
Strengthened community clinics with child specialists No
Disability-friendly health and education infrastructure Partial yes
Strengthened child protection system Partial yes
Education and nutrition support through wider mid-day
Yes
meal programme
Safe recreational spaces, children’s parks in every district,
No
emphasising girls’ play opportunities
124 Approaches to equity in practice:
Kenya and Indonesia
The following two case studies provide in-depth insights into inequalities in child survival
and equitable health financing in Kenya and Indonesia. Both countries have made
significant progress in reducing child mortality over the last 20 years and, based on our
calculations, that progress seems to have been inclusive for many disadvantaged groups.1
However, large differences between regions remain, and inequalities based on household
wealth or location are persistent. Furthermore, four years into the SDG agenda,
disaggregated data for many groups is still missing – there are large evidence gaps on,
for example, children with disabilities and child migrants.
The research undertaken for the case studies evidence-based decisions. The lack of high-quality
highlighted the lack of transparent, current and disaggregated data to identify the furthest-behind
accessible budget data. Most countries do not groups 3 and the limited availability of timely and
publish any publicly accessible and harmonised transparent regional spending data on health are
budget documentation, and even in countries such major obstacles to devising more nuanced and
as Kenya or Indonesia – which took significant equitable spending formulas. Domestic political
steps to share budgets, for instance, via the World considerations can also reduce the incentives to
Bank Open Budgets Portal 2 – budget data is often allocate resources in a way that reaches those
out of date or does not allow for disaggregation groups who are furthest behind first, especially in
on a subnational level. In many countries, health places where spending allocations are used as a
financing is largely devolved directly to province way of avoiding conflict, where patronage systems
or county governments, with some responsibilities are in place or where spending is used as an
remaining at the national level, eg, for hospital electoral tool.
management. In research analysis tracking central
In order to make evidence-based decisions on
government spending at the subnational level can be
equitable budgeting, a huge investment is required
challenging. Similarly, nutrition spending is especially
in the production of disaggregated data at the
hard to isolate as it often cuts across multiple areas
subnational level – both on the demand side (where
of expenditure.
the greatest need is) and on the supply side (how
Putting those children who are furthest behind first resources are spent and who they benefit). The
is no easy task. Limited knowledge and data on following case studies offer some illustrations on
the most deprived and marginalised children or how this could be done.
on the budgeting process makes it hard to take
13FOLLOW THE MONEY
Case study 1: Kenya
Kenya is classified as a lower-middle-income broadly progressive, with the richest 10% of people
country, with a GDP per capita of just under contributing 80% of direct taxation, while less than
$1,600 in 2017.4 Government revenues (both tax 1% of direct tax revenues come from the poorest
and non‑tax) represent 18% of GNI. 5 Official 40% of the population.11 Indirect taxes – particularly
development assistance (ODA) increased steadily VAT – are essentially neutral as the burden
between 2000 and 2013 from 4% to 6% of GNI but of VAT has been found to be proportional with
has since decreased to 3.2% in 2017.6 The shift away income levels.12
from ODA led Kenya to explore other sources of
Kenya’s latest spending figures show the
finance such as international bond markets.7
government is allocating 1.7% and 5.2% of GDP to
According to the IMF, Kenya’s debt is equivalent health and education, respectively.13 Taking into
to 55% of GDP. 8 In order to increase fiscal space account social protection,14 the country spends
without borrowing and increasing debt, the Kenyan $64 per capita on social services. Recent estimates
government has recognised the important role indicate that $245 per capita would be needed to
of taxation and has already created a stronger eliminate extreme poverty, suggesting a financing
tax base.9 This is reflected in the relatively small gap of $181 per person.15 This gap could be reduced
gap between its current revenues at 18% of GNI to $117 per capita if 50% of current expenditure
and the revenue capacity, estimated to be 19% of was allocated to social services.
GNI.10 The income tax system is regarded as
Just seven days old,
Nakwan is treated for
pneumonia at a clinic in
Turkana county, Kenya. PHOTO: FREDRIK LERNERYD/SAVE THE CHILDREN
14CHILD SURVIVAL PROJECTIONS
4 APPROACHES TO EQUITY IN PRACTICE: KENYA AND INDONESIA
FIGURE 7: KENYA HAS WIDE REGIONAL
AND CONVERGENCE ANALYSIS DIFFERENCES IN UNDER-FIVE MORTALITY
UNDER-FIVE MORTALITY
Under-five mortality rates have more than halved
in Kenya since 2000, down to 46 per 1,000 live
births in 2017. 16 Progress has accelerated since 2003,
when the decision was taken to remove user fees
and increase spending on primary-level facilities.17
However, almost 70,000 children die before their
fifth birthday every year. 18 Our estimations indicate
that the country is off track to achieve the SDG
target for child mortality of 25/1,000 live births by
2030 (Figure 6).19 Kenya would need to decrease
under-five mortality by 3.8% per year for the next
11 years to meet the target.
Progress in reducing child mortality over the last
two decades has been inclusive with respect to Child mortality
household income and rural–urban location. There (per 1,000 live births)
have been bigger reductions in child mortality 67–119 36–46
among the poorest households and those living in 46–67 22–36
rural areas than the national average. But despite
this promising convergence among wealth groups Data: DHS 2014
and rural and urban residents, a significant shift in
child mortality rates for all groups will be needed
prevalence are Homa Bay, Migori, and Vihiga,
for the country to meet SDG 3.2.
with under-five mortality rates of 119, 98 and
Child mortality rates vary widely by region, as 91 per 1,000 live births respectively. All three
Figure 7 shows. The three counties with the highest counties are located in the south west, close to
FIGURE 6: KENYA HAS ACHIEVED INCLUSIVE PROGRESS IN REDUCING CHILD MORTALITY
BUT IS OFF TRACK TO REACH THE SDG TARGET
Trends and projections for under-five mortality in Kenya, by wealth group and location
150
Under-five mortality rate (per 1,000 live births)
100
National
average
Poorest 20%
50
Second
quintile
Richest 20%
SDG Target
Rural
0 Urban
2000 2010 2020 2030
Data: Save the Children calculations based on inter-agency child mortality estimates and DHS, accessed via GRID.
Group-specific mortality rates are aligned with national trends and might differ from published rates in DHS report.
Projected values after last survey in 2014. Please see GRID methodology: campaigns.savethechildren.net/grid
15FOLLOW THE MONEY
FIGURE 8: REGIONAL INEQUALITIES IN CHILD DEATH RATES ARE DECREASING
Trends and projections for under-five mortality in Kenya, by region
200
Under-five mortality rate (per 1,000 live births)
150
100
National
average
Nyanza
50 North Eastern
Western
SDG Target Nairobi
0 Others
2000 2010 2020 2030
Data: Save the Children calculations based on inter-agency child mortality estimates and DHS, accessed via GRID.
Group-specific mortality rates are aligned with national trends and might differ from published rates in DHS report.
Projected values after last survey in 2014. Please see GRID methodology: campaigns.savethechildren.net/grid
Lake Victoria. Other counties with proportionally Figure 9 shows the regional prevalence rate for
high mortality rates are located in the north west stunting and the proportion of children who
and south east of the country. have received basic vaccinations and of mothers
who had assistance from a skilled provider while
Nevertheless, as with income and place of residence,
giving birth. A regional comparison across health-
regional inequalities in child mortality have been
related indicators shows that they are not always
decreasing; regions with the highest rates of child
as strongly correlated as we might expect. For
deaths have seen significant drops in recent years
instance, the five regions with the highest under-five
(see Figure 8).20 While child mortality rates are
mortality rates are not the five regions with the
still above average in Nyanza, North Eastern
highest prevalence rates of stunting. This may reflect
and Western regions, gaps between the various
the lower incidence of malaria, the biggest killer of
regions are closing over time. However, based on
children, in regions with higher levels of stunting.
our calculations, most regions will not meet the
The following analysis of disease burden and health
SDG 3.2 target.
spending takes into account both child mortality
and malnutrition as proxies for child survival.
OTHER RELEVANT CHILD-RELATED
HEALTH INDICATORS
One child in four in Kenya is stunted, with rates of
almost 30% in rural areas and more than one‑third
of children in the poorest households.21 71% of
children have received all eight basic vaccinations
and 62% of new mothers had assistance during
delivery from a skilled provider.22
16You can also read