ADVANCING PRIMARY CARE DELIVERY - PRACTICAL, PROVEN, AND SCALABLE APPROACHES - UNITEDHEALTH CENTER FOR HEALTH REFORM & MODERNIZATION
←
→
Page content transcription
If your browser does not render page correctly, please read the page content below

UnitedHealth Center for
Health Reform & Modernization

            Advancing
            Primary Care
            Delivery
            Practical, Proven, and
            Scalable Approaches

            September 2014

Table of Contents

Executive summary.  .  .  .  .  .  .  .  .  .  .  .  .  .  .  .  .  .  .  .  .  .  .  .  .  .  .  .  .  .  .  .  .  .  .  .  .  .  .  .  .  .  .  .  .  .  .  .  .  .  .  .  .  .  .  .  .  .  .  .  .  .  .  .  .  .  .  .  .  .  .  .  .  .  .  .  .  .  .  .  .  .  .  .  .  .  .  .  .  .  .  . 2

A snapshot of the U.S. primary care system. .  .  .  .  .  .  .  .  .  .  .  .  .  .  .  .  .  .  .  .  .  .  .  .  .  .  .  .  .  .  .  .  .  .  .  .  .  .  .  .  .  .  .  .  .  .  .  .  .  .  .  .  .  .  .  .  .  .  .  .  .  .  .  .  .  . 5
     Defining primary care.  .  .  .  .  .  .  .  .  .  .  .  .  .  .  .  .  .  .  .  .  .  .  .  .  .  .  .  .  .  .  .  .  .  .  .  .  .  .  .  .  .  .  .  .  .  .  .  .  .  .  .  .  .  .  .  .  .  .  .  .  .  .  .  .  .  .  .  .  .  .  .  .  .  .  .  .  .  .  .  .  .  .  .  .  .  .  .  .  . 5
     Shifting demand. .  .  .  .  .  .  .  .  .  .  .  .  .  .  .  .  .  .  .  .  .  .  .  .  .  .  .  .  .  .  .  .  .  .  .  .  .  .  .  .  .  .  .  .  .  .  .  .  .  .  .  .  .  .  .  .  .  .  .  .  .  .  .  .  .  .  .  .  .  .  .  .  .  .  .  .  .  .  .  .  .  .  .  .  .  .  .  .  .  .  .  .  .  . 6

Assessing value and capacity.  .  .  .  .  .  .  .  .  .  .  .  .  .  .  .  .  .  .  .  .  .  .  .  .  .  .  .  .  .  .  .  .  .  .  .  .  .  .  .  .  .  .  .  .  .  .  .  .  .  .  .  .  .  .  .  .  .  .  .  .  .  .  .  .  .  .  .  .  .  .  .  .  .  .  .  .  .  .  .  .  . 8
     The value of primary care .  .  .  .  .  .  .  .  .  .  .  .  .  .  .  .  .  .  .  .  .  .  .  .  .  .  .  .  .  .  .  .  .  .  .  .  .  .  .  .  .  .  .  .  .  .  .  .  .  .  .  .  .  .  .  .  .  .  .  .  .  .  .  .  .  .  .  .  .  .  .  .  .  .  .  .  .  .  .  .  .  .  .  .  .  . 8
     Provider supply.  .  .  .  .  .  .  .  .  .  .  .  .  .  .  .  .  .  .  .  .  .  .  .  .  .  .  .  .  .  .  .  .  .  .  .  .  .  .  .  .  .  .  .  .  .  .  .  .  .  .  .  .  .  .  .  .  .  .  .  .  .  .  .  .  .  .  .  .  .  .  .  .  .  .  .  .  .  .  .  .  .  .  .  .  .  .  .  .  .  .  .  .  . 10
     Distribution of resources .  .  .  .  .  .  .  .  .  .  .  .  .  .  .  .  .  .  .  .  .  .  .  .  .  .  .  .  .  .  .  .  .  .  .  .  .  .  .  .  .  .  .  .  .  .  .  .  .  .  .  .  .  .  .  .  .  .  .  .  .  .  .  .  .  .  .  .  .  .  .  .  .  .  .  .  .  .  .  .  .  .  .  .  .  . 11

Building blocks for bolstering capacity.  .  .  .  .  .  .  .  .  .  .  .  .  .  .  .  .  .  .  .  .  .  .  .  .  .  .  .  .  .  .  .  .  .  .  .  .  .  .  .  .  .  .  .  .  .  .  .  .  .  .  .  .  .  .  .  .  .  .  .  .  .  .  .  .  .  .  .  .  . 15
     Leveraging a diverse workforce.  .  .  .  .  .  .  .  .  .  .  .  .  .  .  .  .  .  .  .  .  .  .  .  .  .  .  .  .  .  .  .  .  .  .  .  .  .  .  .  .  .  .  .  .  .  .  .  .  .  .  .  .  .  .  .  .  .  .  .  .  .  .  .  .  .  .  .  .  .  .  .  .  .  .  .  .  .  . 15
     Assembling multi-disciplinary care teams.  .  .  .  .  .  .  .  .  .  .  .  .  .  .  .  .  .  .  .  .  .  .  .  .  .  .  .  .  .  .  .  .  .  .  .  .  .  .  .  .  .  .  .  .  .  .  .  .  .  .  .  .  .  .  .  .  .  .  .  .  .  .  .  .  .  .  .  .  . 16
     Utilizing health information technology .  .  .  .  .  .  .  .  .  .  .  .  .  .  .  .  .  .  .  .  .  .  .  .  .  .  .  .  .  .  .  .  .  .  .  .  .  .  .  .  .  .  .  .  .  .  .  .  .  .  .  .  .  .  .  .  .  .  .  .  .  .  .  .  .  .  .  .  .  .  . 17

Advanced service delivery and payment models.  .  .  .  .  .  .  .  .  .  .  .  .  .  .  .  .  .  .  .  .  .  .  .  .  .  .  .  .  .  .  .  .  .  .  .  .  .  .  .  .  .  .  .  .  .  .  .  .  .  .  .  .  .  .  .  .  .  .  . 18
     Medical homes.  .  .  .  .  .  .  .  .  .  .  .  .  .  .  .  .  .  .  .  .  .  .  .  .  .  .  .  .  .  .  .  .  .  .  .  .  .  .  .  .  .  .  .  .  .  .  .  .  .  .  .  .  .  .  .  .  .  .  .  .  .  .  .  .  .  .  .  .  .  .  .  .  .  .  .  .  .  .  .  .  .  .  .  .  .  .  .  .  .  .  .  .  . 18
     Accountable care organizations. .  .  .  .  .  .  .  .  .  .  .  .  .  .  .  .  .  .  .  .  .  .  .  .  .  .  .  .  .  .  .  .  .  .  .  .  .  .  .  .  .  .  .  .  .  .  .  .  .  .  .  .  .  .  .  .  .  .  .  .  .  .  .  .  .  .  .  .  .  .  .  .  .  .  .  .  .  . 21
     Paying for value .  .  .  .  .  .  .  .  .  .  .  .  .  .  .  .  .  .  .  .  .  .  .  .  .  .  .  .  .  .  .  .  .  .  .  .  .  .  .  .  .  .  .  .  .  .  .  .  .  .  .  .  .  .  .  .  .  .  .  .  .  .  .  .  .  .  .  .  .  .  .  .  .  .  .  .  .  .  .  .  .  .  .  .  .  .  .  .  .  .  .  .  . 24

Approaches to expand access and target capacity.  .  .  .  .  .  .  .  .  .  .  .  .  .  .  .  .  .  .  .  .  .  .  .  .  .  .  .  .  .  .  .  .  .  .  .  .  .  .  .  .  .  .  .  .  .  .  .  .  .  .  .  .  .  .  .  .  . 25
     Leveraging the retail health infrastructure .  .  .  .  .  .  .  .  .  .  .  .  .  .  .  .  .  .  .  .  .  .  .  .  .  .  .  .  .  .  .  .  .  .  .  .  .  .  .  .  .  .  .  .  .  .  .  .  .  .  .  .  .  .  .  .  .  .  .  .  .  .  .  .  .  .  .  .  . 25
     Reaching patients where they live .  .  .  .  .  .  .  .  .  .  .  .  .  .  .  .  .  .  .  .  .  .  .  .  .  .  .  .  .  .  .  .  .  .  .  .  .  .  .  .  .  .  .  .  .  .  .  .  .  .  .  .  .  .  .  .  .  .  .  .  .  .  .  .  .  .  .  .  .  .  .  .  .  .  .  . 26
     Utilizing group visits .  .  .  .  .  .  .  .  .  .  .  .  .  .  .  .  .  .  .  .  .  .  .  .  .  .  .  .  .  .  .  .  .  .  .  .  .  .  .  .  .  .  .  .  .  .  .  .  .  .  .  .  .  .  .  .  .  .  .  .  .  .  .  .  .  .  .  .  .  .  .  .  .  .  .  .  .  .  .  .  .  .  .  .  .  .  .  .  . 28
     Engaging complex patients.  .  .  .  .  .  .  .  .  .  .  .  .  .  .  .  .  .  .  .  .  .  .  .  .  .  .  .  .  .  .  .  .  .  .  .  .  .  .  .  .  .  .  .  .  .  .  .  .  .  .  .  .  .  .  .  .  .  .  .  .  .  .  .  .  .  .  .  .  .  .  .  .  .  .  .  .  .  .  .  .  .  . 28

Appendix: Data sources and methods. .  .  .  .  .  .  .  .  .  .  .  .  .  .  .  .  .  .  .  .  .  .  .  .  .  .  .  .  .  .  .  .  .  .  .  .  .  .  .  .  .  .  .  .  .  .  .  .  .  .  .  .  .  .  .  .  .  .  .  .  .  .  .  .  .  .  .  .  .  . 30

References.  .  .  .  .  .  .  .  .  .  .  .  .  .  .  .  .  .  .  .  .  .  .  .  .  .  .  .  .  .  .  .  .  .  .  .  .  .  .  .  .  .  .  .  .  .  .  .  .  .  .  .  .  .  .  .  .  .  .  .  .  .  .  .  .  .  .  .  .  .  .  .  .  .  .  .  .  .  .  .  .  .  .  .  .  .  .  .  .  .  .  .  .  .  .  .  .  .  . 32

                                                                                                                                                        1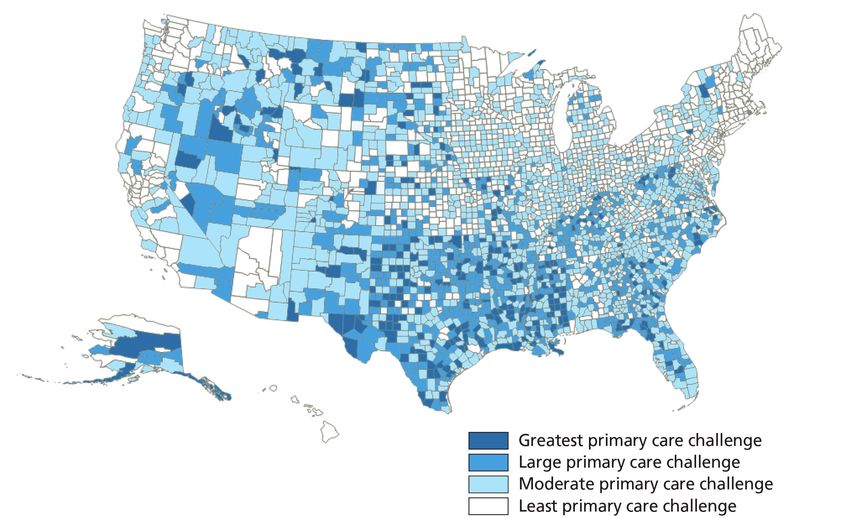
Executive Summary

A snapshot of the U.S. primary                                  Approximately 50 million Americans live in areas
care system                                                     with an under-supply of primary care physicians.6
                                                                Most of these areas are rural. Notably, the percentages
Primary care represents an estimated 6 percent
                                                                of nurse practitioners (15 percent) and physician
to 8 percent of national health care spending —
                                                                assistants (17 percent) who practice in rural areas are
approximately $200 to $250 billion annually.1
                                                                greater than the percentage of physicians (10 percent)
Primary care visits account for 55 percent of                   who practice in rural areas.7
the 1 billion physician office visits each year in the
                                                                An analysis by the UnitedHealth Center for Health
United States.2 The Affordable Care Act could
                                                                Reform & Modernization and Optum Labs shows
generate an additional 25 million primary care
                                                                that socioeconomic factors help explain geographic
visits annually through:3
                                                                variation in primary care physician supply.
  •	Increases in insurance coverage;
                                                                  • Primary care physicians are concentrated in
  •	Requirements for coverage of certain essential                  areas with higher median household incomes.
    health benefits; and                                            In the 10 percent of local health care markets with
  •	Elimination of copayments for preventive services.              the lowest concentration of primary care physicians,
                                                                    the median household income was $46,000. In the
Assessing value and capacity                                        10 percent with the highest concentration, it was
Primary care is central to effectively treating patients.           $66,000.
A higher supply of primary care physicians is related             • Primary care physicians are concentrated
to lower rates of mortality and more effective delivery             where residents — and potential patients
of preventive care.4 High rates of avoidable visits to              — are more likely to have insurance coverage.
emergency departments and avoidable hospitalizations                In the 10 percent of local markets with the lowest
are a sign that many patients could be treated more                 concentration of primary care physicians per capita,
appropriately and cost effectively in a primary care                the uninsured rate for the non-elderly was
setting. An estimated 70 percent of emergency                       17 percent; in those with the highest, it was
department visits by commercially insured patients                  11 percent.
in the United States are for non-emergencies.5                    • There is a higher concentration of non-
An analysis by the UnitedHealth Center for Health                   physician primary care providers — nurse
Reform & Modernization and Optum Labs                               practitioners (NPs) and physician assistants
underscores that primary care physicians                            (PAs) — in areas with lower median household
contribute to high-quality, cost-effective care. In                 incomes and higher rates of uninsured
local health care markets with a greater supply of                  residents. In the 10 percent of local markets with
primary care physicians, there are lower rates of                   the lowest concentration of primary care physicians,
avoidable hospital admissions and emergency                         the concentration of NPs and PAs was highest,
department visits, as well as less use of costly high-              and there were approximately equal numbers of
technology diagnostic imaging when traditional imaging              physician and non-physician providers.
is often just as effective.

                                                            2
The supply of primary care physicians is concentrated             Advanced service delivery and
away from rural areas, away from lower-income                     payment models
communities, and away from the uninsured. Therefore,
                                                                  Private and public payers continue to work with
increasing physician supply may not be enough to
                                                                  providers to implement patient-centered medical homes
effectively address unmet demand for primary care
                                                                  (PCMHs) and accountable care organizations (ACOs).
services in all areas of the country, in part because lower
                                                                  These approaches show great promise; however, their
reimbursement rates and salaries in primary care practice
                                                                  success has not been uniform. Medical home and
may help steer some medical graduates with substantial
                                                                  accountable care models can advance the Triple Aim
student debt toward higher-paying specialties. Increased
                                                                  goals of improving quality and the patient experience
roles for NPs and PAs would add to the system’s overall
                                                                  of care, improving population health, and reducing the
primary care capacity, and could help target capacity to
                                                                  cost of care — provided they are well designed and
areas where there are fewer primary care physicians.
                                                                  implemented. One key to success is a financial model
Building blocks for bolstering capacity                           that moves past fee-for-service reimbursement by
                                                                  rewarding value over volume.
Building blocks for enhancing capacity and improving
primary care service delivery include:                              •	Evidence from UnitedHealthcare’s medical home
                                                                      programs in four states shows average third-year net
  • Leveraging a diverse workforce. Advancing
                                                                      savings of 6.2 percent of medical costs, resulting in a
    effective roles for NPs and PAs depends on greater
                                                                      return on investment of 6 to 1.
    use of evidence-based guidelines, rigorous quality
                                                                    • WESTMED’s commercial ACO improved care on nine
    measurement frameworks, and quality improvement
                                                                      of 10 health quality metrics, while achieving an
    initiatives for non-physician providers. A significant
                                                                      8 percent reduction in emergency department
    barrier to achieving more dramatic and rapid
                                                                      utilization, a 5 percent decrease in hospital inpatient
    progress is payment policy. Medicare and Medicaid
                                                                      costs, and a 1.3 percent reduction in costs per
    generally reimburse less for services delivered by
                                                                      member in one year.
    NPs and PAs than for the same services when
    performed by physicians.                                        •	Monarch HealthCare was the top performing of
                                                                      32 Medicare Pioneer ACOs on three measures
  • Assembling multi-disciplinary care teams.
                                                                      of quality and the second ranked Pioneer ACO in
    A primary care physician with a panel of 2,000
                                                                      achieved cost savings. It reduced Medicare spending
    patients would need to spend an estimated
                                                                      by 5.4 percent in 2012 from the 2011 baseline for
    17.4 hours per day to provide recommended
                                                                      attributed beneficiaries, compared to a
    preventive, chronic, and acute care — and
                                                                      1.1 percent increase for a reference cohort.
    many primary care physicians have larger panels.8
    Assembling multi-disciplinary care teams can                  These successful models all embraced payment reforms
    leverage additional capacity to help practices                that move beyond fee-for-service reimbursement. Under
    see more patients.                                            fee-for-service, physicians are paid for the volume and
  • Utilizing health information technology (HIT).                complexity of care delivered. This approach incents the
    HIT, including electronic health records (EHRs) and           delivery of a greater quantity and higher intensity of
    interoperable data exchange, allows primary care              services; it does not encourage better quality care.11 As
    practices to organize and disseminate information             much as half of wasteful health care spending results
    across the delivery system in real time — improving           from failures of care delivery and care coordination, as
    care coordination, increasing quality, and lowering           well as overtreatment — all of which could be improved
    costs.9 Broader implementation of HIT can increase            by moving away from the fee-for-service reimbursement
    systemwide capacity to meet increased demand,                 model.12
    improving access to primary care.10

                                                              3
Models that delink payment from units of primary                    • Utilizing group visits. Group visits represent an
care, and instead prioritize value, include:                          evolving approach for improving access to primary
                                                                      care. Under this model, patients have both private
  • Performance-based bonuses as modifications
                                                                      examinations and group education sessions. One
    to traditional fee-for-service payments;
                                                                      advantage of group models is that they are an
  •	Risk-adjusted monthly payments for primary                        efficient use of provider time compared to individual
    care services;                                                    care.15 Shared medical visits can decrease emergency
  •	Gain-sharing through shared savings, without                      department and specialty visits, reduce hospital
    risk; and                                                         admissions, increase patient satisfaction, and
  •	Risk-adjusted capitation payments to group                        improve patient outcomes.16
    practices and integrated delivery systems.                      • Engaging complex patients. Making the most
                                                                      effective use of primary care services and better
Approaches to expand access and                                       leveraging capacity to reduce overall spending
target capacity                                                       requires a greater focus on complex and costly
In addition to changing service delivery and payment                  patients. In a single year, 5 percent of the population
models within primary care practices, there are a range               accounts for 50 percent of health care costs; and
of proven and scalable approaches to expand and better                more than one in three (38 percent) of these
target primary care capacity:                                         “super-utilizers” remains in the most costly 5 percent
                                                                      of people the following year.17 Targeting complex
  • Leveraging the retail health infrastructure.
                                                                      patients requires analytic models that map patient
    Clinics in large retail outlets hold the potential for
                                                                      clinical characteristics to utilization levels and
    large-scale innovation in primary care. Between
                                                                      payment models that support resource-intensive
    2007 and 2012, the volume of retail clinic visits grew
                                                                      targeting and care management efforts.
    more than six-fold, from 1.5 million to 10 million
    annually.13 Close to half of retail clinic visits take        Conclusion
    place when physician offices are closed.14 Evidence
                                                                  There is no single set of clinical, organizational, and
    indicates that the quality and cost of services
                                                                  financial models that successfully expands primary
    provided by retail clinics offer significant value,
                                                                  care capacity and improves service delivery. The
    expanding access to primary and preventive care and
                                                                  approaches examined in this report offer multiple
    reducing unnecessary utilization of costly services,
                                                                  complementary pathways that can be tailored to
    such as hospital admissions.
                                                                  local market conditions and policy environments.
  • Reaching patients where they live. Delivering                 When implemented successfully, their common
    primary care and preventive services to individuals           threads include focusing on the patient; the
    in their homes is an effective approach to improving          quality of service delivery, rather than who is
    access and care delivery. A key advantage of                  delivering care and in what setting; and paying for
    conducting clinical visits in the home is the review of       value. These approaches challenge longstanding
    environmental and social conditions, which provides           assumptions about the scale, pace, and intensity of
    valuable information and context to inform an                 change that are both possible and necessary.
    individual’s treatment plan. Optum’s HouseCalls,
    a care management program that provides                       Championing, deploying, and implementing these
    annual in-home clinical visits, employs more than             approaches — effectively and at scale — ultimately
    1,200 licensed physicians and nurse practitioners. In         will require sustained efforts from policymakers,
    2013, HouseCalls conducted approximately 670,000              regulators, health plans, providers, and consumers.
    visits in 37 states.

                                                              4
A snapshot of the U.S.
 primary care system

Defining primary care                                             disorders. When primary care works well, it initiates and
                                                                  prioritizes care coordination and management; ensures
Primary care is the foundation of the U.S. health care
                                                                  that interventions continue across delivery settings;
system. It encompasses individuals’ first contact with
                                                                  improves quality, outcomes, and patient experiences; and
providers for any and all health symptoms or concerns,
                                                                  contains costs by helping patients use services efficiently.
as well as a broad range of
ongoing care. Primary care
includes the treatment of
common conditions, illnesses,
and accidents, including colds
and the flu, sore throats, burns
and rashes, ear and intestinal
infections, and sprains and
strains. Preventive services,
including health screenings,
comprehensive physical exams,
and vaccinations, are part of
the broad universe of primary
care — as is the ongoing
treatment and management
of individuals with chronic
disease and behavioral health
conditions. Individuals need
primary care services across
their life spans, through various
states of wellness and disease.                                   Traditional physician office visits remain the most
                                                                  common way patients receive primary care; however,
Primary care providers, the frontline of care, serve
                                                                  over time, these visits are increasingly taking place at
patients with a wide range of health needs. In some
                                                                  larger physician group practices, rather than at a small
cases they provide routine preventive or follow-up care;
                                                                  group practice or solo practitioner’s office. Individuals
at other times they serve as a gateway for patients
                                                                  also receive primary care services in a range of settings
needing specialist services or hospital care. The efficacy
                                                                  outside of the physician office, including:
of primary care impacts health expenditures systemwide,
as effective preventive care and care coordination can              • Approximately 1,250 Federally Qualified Health
minimize downstream utilization of more expensive                     Centers (FQHCs) that provide services at 8,000
services delivered by specialists or in hospitals.                    individual clinic sites.18
                                                                    • Approximately 3,800 rural health clinics (RHCs);
In recent years, the functions and responsibilities of many
                                                                      among these, approximately half are freestanding
primary care providers and practices have expanded to
                                                                      practices and half operate within larger hospitals
address the growing burden of disease prevalence,
                                                                      or health care systems.19
chronic conditions, mental illness, and substance use

                                                              5
•	More than 2,000 school-based health clinics (SBHCs),                  of insurance coverage; and local market conditions,
    and an estimated 1,000 free clinics that primarily                    including the supply of primary care physicians and
    serve the uninsured.20                                                specialists. For example, diabetes, a chronic condition
  •	Retail clinics, which are expected to number more                     requiring close patient management and provider
    than 3,200 by 2015, compared to approximately                         coordination, involves use of both primary care providers
    1,300 in 2012.21                                                      and specialists. Overall, primary care physicians manage
                                                                          approximately half of diabetes-related outpatient visits;
  • Approximately 9,000 urgent care centers,
                                                                          the share is higher for some conditions (85 percent
    providing services that do not rise to the level of
                                                                          of outpatient visits for chronic obstructive pulmonary
    emergency trauma.22
                                                                          disease) and lower for others (37 percent of visits for
  • Hospital emergency departments, which remain the                      atrial fibrillation).26
    default primary care provider for many uninsured
    individuals and Medicaid beneficiaries.                               Shifting demand
Primary care represents an estimated 6 percent                            Several forces are leading to higher demand for primary
to 8 percent of national health care spending —                           care, including growth of the elderly population. The
approximately $200 to $250 billion annually.23 Primary                    number of Medicare beneficiaries is projected to increase
care visits account for 55 percent of the 1 billion                       by one-third in the next decade, from 54 million in 2014
physician office visits each year in the United States.24                 to 72 million by 2024.27 Medicare beneficiaries have
Primary care office visits decreased slightly, by                         access to certain preventive services without cost-sharing,
0.7 percent, between 2012 and 2013; by contrast,                          including an annual wellness visit and personalized
specialist office visits increased by 4.9 percent                         prevention plans.
(see Exhibit 1).25
                                                                          The Affordable Care Act (ACA) ultimately is expected to
The use of primary care providers to manage patients                      provide insurance coverage to approximately 30 million
varies among conditions, depending on a range of                          additional individuals through state health insurance
factors, including co-occurrence of other health                          marketplaces and Medicaid.28 Requirements for coverage
conditions; patient characteristics, including type                       of certain essential health benefits — including maternity

Exhibit 1;	Change in office visits by provider type, 2012 to 2013

                                 Primary care
                                physician visits           Specialist visits

                   5%

                   4%                                           4.9%

                   3%

                   2%

                   1%

                   0%
                                    -0.7%
                  -1%

Source: IMS Institute for Health Informatics, “Medicine Use and Shifting Costs of Healthcare:
A Review of the Use of Medicines in the U.S. in 2013,” April 2014.

                                                                      6
Consumers are looking for more
                                                             convenient ways to access care,
                                                             including extended office hours and
                                                             electronic communications.

and newborn care, preventive services, and chronic               have a greater need for ongoing treatment, monitoring,
disease management — and the elimination of                      and care coordination. Rising demand for mental
copayments for preventive services will contribute to            health services also drives greater reliance on primary
increased use of primary care services. These factors            care providers, who provide approximately half of all
could translate to an additional 25 million primary care         mental health treatments, mostly screening and
visits annually.29                                               treatment for depression.32

                                                                 Consumers are increasingly looking for more convenient
Changes from the ACA could result in                             ways to access care, including in the evenings or on
                                                                 weekends when physician offices are often closed.
an additional 25 million primary care
                                                                 At the same time, there is increased consumer interest in
visits annually.
                                                                 communicating with providers and accessing their health
                                                                 information electronically. Consumers are open to new
The nature of demand for primary care is also                    avenues for basic clinical encounters that differ from the
changing, reflecting a more complex and higher-need              traditional office visit model.
population. Today, nearly 80 percent of Medicare
beneficiaries have at least one chronic condition and
two-thirds of beneficiaries have two or more chronic
conditions.30 Rates of chronic disease are increasing,
not only for seniors, but also among adults under
age 65 and children.31 Individuals with chronic conditions

                                                             7
Assessing value and capacity
The value of primary care department visits by commercially insured patients
in the United States are for non-emergencies.36
Primary care is central to effectively treating patients.
A higher supply of primary care physicians is related
to better population health, including lower rates of Among the commercially insured,
mortality and more effective delivery of preventive 70 percent of emergency department
care.33 An increase of one primary care physician per
visits are for non-emergencies.
10,000 people is associated with fewer hospital inpatient
admissions (5.5 percent), outpatient visits (5 percent),
emergency department visits (11 percent), and total An analysis by the UnitedHealth Center for Health
surgeries (7 percent).34 There is an association between Reform & Modernization and Optum Labs underscores
higher numbers of primary care physicians and more that primary care physicians contribute to high-quality,
favorable Medicare patient outcomes — specifically cost-effective care. In areas with a greater supply of
lower death rates and fewer hospital visits.35 primary care physicians, there was lower utilization of
costly and avoidable hospital services. Among Health
Geographic variation in health care utilization, costs,
Referral Regions (HRR), geographic units with similar
and outcomes is a strong indicator of differences in
hospital referral patterns, those with a greater number of
access and quality. High rates of avoidable visits to
primary care physicians per 100,000 people had lower
emergency departments and avoidable hospitalizations
rates of avoidable hospital admissions and emergency
are a sign that many patients could be treated more
department visits (correlation coefficients are -0.36
appropriately and cost effectively in a primary care
and -0.40, respectively; see Exhibits 2 and 3, and see
setting. An estimated 70 percent of emergency
Appendix for methodology).
Exhibit 2; Avoidable hospital admissions and primary care physician supply
14
Avoidable hospital admissions per 1,000
12
10
HRR
8
6 Correlation
coefficient = -0.36
4
2
0
25 45 65 85 105 125
Primary care physicians per 100,000
Source: UnitedHealth Center for Health Reform & Modernization and Optum Labs analysis, 2014.
Note: See Appendix for methodology.
8Exhibit 3; Avoidable hospital emergency department visits and primary care physician supply
90
Avoidable hospital emergency department
80
70
60
visits per 1,000
HRR
50
40 Correlation
30 coefficient = -0.40
20
10
0
25 45 65 85 105 125
Primary care physicians per 100,000
Source: UnitedHealth Center for Health Reform & Modernization and Optum Labs analysis, 2014.
Note: See Appendix for methodology.
In HRRs where there was a greater primary care physician Where there are more primary care physicians per capita,
supply, there was less use of high-technology diagnostic there are lower rates of avoidable hospital admissions
imaging (correlation coefficient = -0.45; see Exhibit 4). and emergency department visits, and there is less use of
It appears that communities with a strong primary care high-technology diagnostic imaging. Deficits in primary
infrastructure rely more on traditional and less costly care contribute to conditions going undiagnosed, health
imaging techniques, which often provide enough care needs going unmet, and costly utilization of
precision for a physician to achieve an accurate diagnosis. preventable or unnecessary services.
Exhibit 4; Use of high-technology diagnostic imaging and primary care physician supply
350
300
diagnostic imaging per 1,000
Use of high-technology
250 HRR
200 Correlation
coefficient = -0.45
150
100
25 45 65 85 105 125
Primary care physicians per 100,000
Source: UnitedHealth Center for Health Reform & Modernization and Optum Labs analysis, 2014.
Note: See Appendix for methodology.
9Provider supply nation’s graduate medical programs produced 4,500
primary care physicians and 24,000 specialists in 2014
Understanding primary care capacity and how it
(see Exhibit 5).39
is deployed is essential. Many definitions of capacity
start with estimates of the supply of primary care Primary care physicians annually earn approximately half
physicians. These estimates vary widely, depending on the compensation of orthopedists, cardiologists, and
the defined scope of primary care, whether the count radiologists.40 In the Medicare program, physician
is limited to actively practicing physicians or includes fee-for-service reimbursement is based on the complexity
all licensed physicians, and whether those in part-time and intensity of the service provided, reducing incentives
practice are adjusted downward to shares of full-time for physicians to offer primary care services under the
equivalents (FTEs). program.41 Lower reimbursement rates and salaries in
primary care practice may help steer some medical
The Association of American Medical Colleges (AAMC)
graduates with substantial student debt toward higher-
estimates there were 275,000 active primary care
paying specialties.
physicians in the United States in 2011 — specializing
in internal medicine, family medicine, general practice, Several organizations have expressed concerns about the
and pediatrics — including those working 20 hours primary care system’s ability to meet the growing
per week or more.37 A definition of primary care that demand, with capacity typically estimated through
includes geriatricians, obstetricians, and gynecologists projections of the future supply of primary care
would result in a higher estimate; an adjustment physicians. HRSA has estimated a primary care physician
converting all active physicians to FTEs would result shortage of 20,000 FTEs in 2020; AAMC has estimated a
in a lower estimate. The Health Resources and Services shortage of 45,000 primary care physicians in 2020.42
Administration (HRSA), using a definition of primary
Estimates of future supply shortages rely on projections
care that includes geriatricians, excludes primary care
of how new graduates might add to the current
hospitalists, and converts physicians working part-time
workforce in future years, and how retirements based
to FTE equivalents, estimates there were 205,000
on the age of current providers might decrease it.
primary care physicians in the United States in 2010.38
Estimates also account for greater demand in the future,
Approximately a third of practicing physicians in the attributable to the ACA’s coverage expansion, the
United States are primary care physicians — although growing number of seniors, and the increase in
the share varies depending on the parameters of the disease prevalence, including obesity. But complex and
estimate. The ratio of primary care physicians to interrelated factors make such projections challenging.
specialists will likely decline in the near term as the
Exhibit 5; New medical graduates by field of residency, 2014
Primary
care
4,500
16%
Specialties
24,000
84%
Source: National Resident Matching Program, “Results and Data, 2014 Main Residency Match,” April 2014.
10In some ways, these projections may understate the oversight. Eighteen states allow them to
challenge. Planned initiatives to promote primary care in independently prescribe medications.46
medical schools are not necessarily implemented in a Some states allow for less direct physician
timely fashion.43 Estimates of retirement rates generally supervision in nursing homes and community or
rely on models based on past behavior. They do not public health clinics.47
account for potential early retirements among physicians • Physician assistants (PAs) occupy roles designed
in solo or small practices or for new cohorts of as an extension of physicians’ capacity, rather than
graduating physicians who may decide to work fewer intended for independent practice. Approximately
hours for significant components of their careers, 90,000 individuals have been certified nationally
including when they have young children. as PAs.48 In 2010, there were 6,000 graduating
PA students and 6,600 first-year PA students.49
The share of PAs practicing in primary care was
Projecting the adequacy of the future
31 percent in 2010, down from 51 percent in 1996.50
primary care physician workforce depends The reasons for this decline include higher pay in
on a range of assumptions about supply, specialty fields and increased use of PAs by hospitals
including rates of retirements and new in recent years.51 PAs are allowed to practice and
medical graduates, as well as demand, prescribe medication under the supervision of a
physician. In some settings, PAs maintain their own
including rates of insurance coverage and
panel of patients.
disease prevalence.
The health care system of the future may have
approximately the same number of primary care
However, projections of primary care physician shortages physicians as are practicing now. An alternative to
also understate overall primary care capacity, by framing primary care capacity in terms of physician
discounting the future supply of all primary care ratios or access to specific providers is to focus on
providers including non-physicians. Nurse practitioners consumers’ ability to access high-quality primary care
and physician assistants are substantial components services, in a timely fashion, at low costs.
of the existing and future primary care workforce. The
work they perform varies across states and is largely Distribution of resources
determined by state scope-of-practice laws.
While the nation’s overall primary care capacity can be
• Nurse practitioners (NPs) are advanced practice debated, there is clearly a mismatch between the supply
registered nurses (APRNs) credentialed with at least of primary care physicians and those in need of primary
a master’s degree and certified by professional care services. Approximately 50 million Americans live in
or specialty nursing organizations. In 2013, there areas with an under-supply of primary care physicians,
were 192,000 NPs in the United States, and almost defined as an area with a ratio of one primary care
85 percent practiced primary care.44 The number of physician per 3,500 people or more.52 Most of these
NP graduates each year has doubled from 6,000 in areas are rural, where the ratio of practicing primary care
2003 to more than 12,000 in 2011; going forward, physicians to residents is less than half that in the rest
that figure is projected to increase by 9 percent of the nation.53 Overall, 59 million individuals live in
annually, with the Doctor of Nursing Practice (DNP) rural areas, representing about 19 percent of the
becoming the prevailing degree for NPs.45 Most population.54 Notably, the percentage of NPs (15 percent)
graduating NPs go on to practice primary care. and PAs (17 percent) who practice in rural areas is greater
Approximately half of all states allow NPs to than the percentage of primary care physicians
diagnose and treat patients without physician (10 percent) practicing in rural areas (see Exhibit 6).55
11Exhibit 6; Shares of providers practicing in rural areas, where 59 million individuals live
20%
17%
15%
15%
10%
10%
5%
0%
Nurse Physician Primary care
practitioners assistants physicians
Source: See Appendix.
Exhibit 7; Primary care challenge by county, 2014
Source: UnitedHealth Center for Health Reform & Modernization analysis, 2013.
Note: Analysis assumes all states ultimately adopt the Affordable Care Act’s Medicaid expansion. See Appendix for methodology.
12An analysis of the counties expected to face the greatest Primary care physicians also are concentrated where
challenges in ensuring primary care capacity in the residents — and potential patients — are more likely to
coming years indicates that some areas of the country have insurance coverage. In the 10 percent of HRRs with
face greater challenges than others, including parts of the fewest primary care physicians, the uninsured rate
the West and the South (see Exhibit 7). for the non-elderly was 17 percent; in those with the
highest concentration, it was 11 percent (see Exhibit 9).
An analysis by the UnitedHealth Center for Health
Reform & Modernization and Optum Labs shows that There is a higher concentration of non-physician
socioeconomic factors help explain geographic variation primary care providers where the supply of primary
in primary care physician supply. Primary care physicians care physicians is lower. Thus, NPs and PAs are
are more concentrated in higher-income areas. In the concentrated in areas with lower median household
10 percent of HRRs with the lowest concentration of incomes and higher rates of uninsured residents.
primary care physicians (42 per 100,000 people), the
median household income was $46,000. In the
10 percent with the highest concentration (96 per
100,000 people), it was $66,000 (see Exhibit 8).
Exhibit 8; Median household income and Exhibit 9; Uninsured rate for nonelderly and
primary care physician supply primary care physician supply
Primary care physicians Median household Primary care physicians Uninsured under 65
per 100,000 income per 100,000
100 18% 100
$67,000
17%
90 90
$62,000 16%
Providers per 100,000
Providers per 100,000
80 80
Percent Uninsured
15%
Income Level
$57,000
70 14% 70
$52,000 13%
60 60
12%
$47,000 50 50
11%
$42,000 40 10% 40
1 2 3 4 5 6 7 8 9 10 1 2 3 4 5 6 7 8 9 10
Decile Decile
Source: UnitedHealth Center for Health Reform & Modernization Source: UnitedHealth Center for Health Reform & Modernization
and Optum Labs analysis, 2014. and Optum Labs analysis, 2014.
Note: See Appendix for methodology. Note: See Appendix for methodology.
13In the 10 percent of HRRs with the lowest concentration Because the supply of primary care physicians is
of primary care physicians, the concentration of NPs and concentrated away from rural areas, in higher-income
PAs was highest (43 per 100,000 people), and there communities, and away from the uninsured, simply
were approximately equal numbers of physician and increasing physician supply may not be enough to
non-physician providers (see Exhibit 10). By contrast, in effectively address unmet demand for primary care
the 10 percent of HRRs with the most primary care services in all areas of the country. The same patterns
physicians per capita, the concentration of NPs and PAs hold for specialist physicians, indicating that capacity and
was lowest (17 per 100,000 people) and there were access are challenges not only for primary care delivery.
nearly six physicians for every NP or PA.
These findings corroborate conclusions by Dartmouth
University researchers that training more physicians may,
in fact, increase regional inequities, since four out of five
Exhibit 10; Supply of primary care new physicians will likely practice in high-supply regions
physicians and non-physician rather than underserved areas.56 Increased roles for NPs
primary care providers and PAs would add to the system’s overall primary care
capacity, and could help target capacity to areas where
Primary care physicians Non-physician primary
per 100,000 care providers per 100,000 there are fewer primary care physicians.
100
90
80
70
Providers per 100,000
60
50
40
30
20
10
0
1 2 3 4 5 6 7 8 9 10
Decile
Source: UnitedHealth Center for Health Reform & Modernization
and Optum Labs analysis, 2014.
Note: See Appendix for methodology.
14Building blocks for bolstering capacity
Leveraging a diverse workforce States have been active recently in reforming scope-of-
practice laws, with almost all states having considered
Current initiatives aimed at training more primary care
doing so since 2011.60 Non-physician clinicians are
physicians alone might not meet growing primary
voluntarily increasing their credentialing, including
care demands, especially in low-income and rural areas.
through the use of clinical doctoral programs and
One solution to increasing primary care capacity and
extended years of education.61 In addition, HRSA has
improving access to services may include leveraging other
launched an initiative to increase the number of PAs
clinicians, including NPs and PAs, as integrated parts of
practicing in primary care settings by recruiting and
the health care delivery system.
training recently discharged military medical personnel
Some primary care physician practices have undertaken who lack civilian PA certification.62
an approach that enables NPs and PAs to “practice at
the top of their licenses.” This approach allows physician
practices to grow their panel size and see more patients,
Use of non-physicians can increase the
with patients benefitting from shorter wait times. These capacity of primary care practices, allowing
integrated multi-level practices have distributed care physicians to care for nearly twice as many
delivery responsibilities to match the varied complexities patients and focus on more complex tasks.
of patient needs with the skill sets of physicians, NPs,
and PAs.
Allowing non-physicians to take on increased
responsibility could result in a capacity windfall for
Studies have shown that specific primary care practices, including a near-doubling of
primary care services provided by nurse patient panel size per physician and a pathway for
practitioners were comparable to those physicians to focus on more complex tasks.63 Changes in
the use of non-physician providers are already underway
provided by physicians.
at the practice level in all states. This is a reflection of
NPs’ and PAs’ existing credentials and their capacity to
There is evidence supporting greater roles for NPs in help address demand for primary care services.
delivering primary care services. A broad range of
Advancing effective roles for NPs and PAs depends on
research studies, including three randomized controlled
greater use of evidence-based guidelines, rigorous quality
trials, have found that specific primary care services
measurement frameworks, and quality improvement
provided by NPs were comparable to those provided by
initiatives for non-physician providers. A significant
physicians.57 In some instances, NPs have had better
barrier to achieving more dramatic and rapid progress
results on measures of patient follow-up, consultation
is payment policy. Medicare and Medicaid generally
time, and the provision of screening, assessment, and
reimburse less for services delivered by NPs and PAs than
counseling.58 Finally, there is evidence that NPs in states
for the same services when performed by physicians.64
with tighter restrictions on scopes of practice provide
a comparable standard of care as in states where they
have more clinical responsibilities and autonomy.59
15Assembling multi-disciplinary care teams A critical function of team-based care is care
coordination. The typical primary care physician in a
As both panel size and rates of chronic conditions
single year coordinates with an average of 229 other
increase, it may become difficult for primary care
physicians in 117 different practices for their Medicare
physicians to spend large quantities of time with all of
patients.70 Various members of the care team need to
their patients, or even see each patient at every visit.65
be able to share information about patients and
A primary care physician with a panel of 2,000 patients
coordinate their component of the treatment plan with
would need to spend an estimated 17.4 hours per
colleagues. High-performing practices have achieved
day providing recommended preventive, chronic, and
both practice efficiencies and improved patient care
acute care — and many primary care physicians have
through greater staff capacity, including deploying
larger panels.66
medical assistants to issue pre-visit questionnaires,
Assembling multi-disciplinary care teams can leverage manage patients’ health records, prepare post-exam
additional capacity to help practices deliver services to summaries, and reinforce care plans with patients.71 In
their patients. Practices can rethink how non-physicians addition, health coaches can work with patients to focus
work most effectively with physicians and with each on behavioral change.
other in well-integrated and high-functioning teams. In a
transformed primary care practice, the physician’s scarce
time can be deployed in a more deliberate and targeted
The typical primary care physician must
fashion. Moving toward team-based care and sharing coordinate with 229 other physicians in
clinical responsibilities with non-physicians is one of 117 different practices for their Medicare
several practice changes linked to improving primary patients each year. Sharing information
care physicians’ satisfaction with their work.67
among team members helps primary care
practices coordinate care.
Multi-disciplinary care teams allow physicians
to use their time and skills more deliberately, Standardizing care processes and protocols can drive
while practices provide high-quality primary significant improvements in care delivery and can
care to more patients. Physicians practicing help practices shift toward non-visit-based population
in multi-disciplinary teams have greater health management.72 With work delegated to medical
assistants and health coaches, NPs can perform more
satisfaction with their work.
direct patient care, including more chronic disease
management.73 Such approaches can be self-sustaining,
Integrating behavioral health and pharmacy services into allowing for a greater number of patient visits and, thus,
primary care practices is a further step in developing the increased practice revenue to cover the costs of
team-based approach.68 When a redesigned care setting additional team members.74
includes co-location or integration of behavioral health
Almost half of primary care physicians worked in
providers, practices can more uniformly screen for and
practices of one or two physicians in 2010.75 Many
treat mental health conditions and substance use
primary care physicians are leaving solo and small-group
disorders. Pharmacists, who have expertise in medication
practices in favor of larger primary care or multi-group
management and in counseling patients on adherence,
practices, including hospital-owned practices. Group
side effects, and other issues, can play an increased role
practices — whether single-specialty or multi-specialty
when embedded within a primary care practice.69
— offer some advantages for improving practice
efficiency and building team-based care. These include
pooled capital; shared overhead costs, particularly related
to information systems; and increased care coordination
capacity.
16Utilizing health information technology The federal government has invested substantially in
providing financial incentives to physician practices to
Health information technology (HIT), including electronic
adopt EHRs and to leverage their capabilities through
health records (EHRs) and interoperable data exchange,
a staged functionality approach known as meaningful
allows primary care practices to organize and disseminate
use. But barriers to impactful use remain significant.
information across the delivery system in real time —
Data is fragmented and cannot be shared easily across
improving care coordination, increasing quality, and
incompatible health information systems; therefore,
lowering costs.76 Broader implementation of HIT, along
today’s EHRs are not sufficiently interoperable. Additional
with greater use of teams that include non-physicians,
barriers to adoption and impactful use include ongoing
can expand systemwide capacity to meet increased
system administration and maintenance costs; technical
demand while improving access to primary care.77
issues related to training, support, customization,
Adoption of EHRs alone is insufficient to achieve and reliability; a decrease in productivity stemming
dramatic improvements in primary care delivery, but from initial adoption; and concerns regarding privacy
it is an essential building block for broad and ambitious and security.80
efforts to leverage HIT. Adoption rates for EHRs among
Physicians ultimately approve of EHRs in concept.
primary care physicians are approximately 70 percent,
However, investments in the deployment and impactful
double the rate of five years ago, with younger physicians
use of HIT require significant time commitments and
and those who practice in a group setting even more
upfront costs that will pose difficulty for some primary
likely to have adopted an EHR.78 But rates of adoption
care practices. This gap — between the level of change
are higher than rates of satisfaction and impactful use.
needed and the capacity for change management — is a
Approximately two-thirds of primary care physicians
fundamental challenge for primary care, and for the
practicing internal medicine (65 percent) and family
health care delivery system more broadly.
medicine (63 percent) reported that investing in EHRs
had led to revenue losses for their practices.79
EHR
Today’s electronic health records are not sufficiently interoperable,
preventing data sharing among health care systems.
Health Report
17Advanced service delivery
and payment models
Medical homes
Private and public payers continue to work with providers
to implement patient-centered medical homes (PCMHs),
sometimes simply called medical homes.81 Operated
primarily by physician group practices, typically staffed by
multi-disciplinary care teams, and enabled by HIT,
medical homes bring to bear several core building blocks
for bolstering primary care capacity. Financial support,
from public or private payers, is designed to address
primary care needs by enabling more coordination of
care and better patient management. Some states are
using health homes, a Medicaid option under the ACA,
to build on the medical home model, for example by
integrating behavioral health providers to treat severe
mental illness and substance use disorders, and by
coordinating support services accessible through other
means-tested programs.
Medical home models have shown promise for years,
and some have achieved successful results. Group Health
Cooperative in Washington state has operated medical
homes in 25 clinics through an approach employing
multi-disciplinary primary care teams, care management
for patients with chronic conditions, electronic health total or ambulatory care-sensitive hospital admissions or
records, and patient outreach and education.82 Group emergency department visits, or in overall health care
Health also used capitated payments to encourage care costs, between pilot and comparison practices.85 Of the
coordination activities and to make providers accountable study’s 11 quality measures related to diabetes, asthma,
for the health care utilization and health outcomes of and preventive care, patients in the medical home pilot
their patients.83 Over a two-year period, Group Health fared statistically better on one measure.86 A second
generated a $1.50 return on each dollar invested in the independent study, focused on a largely overlapping
PCMH and achieved a $10 per member per month sample of medical home practices, also found no
(PMPM) reduction in total costs, in part due to a significant reductions in costs for the overall population,
16 percent reduction in hospital admissions and a but identified reductions in downstream utilization and
29 percent reduction in emergency department visits total spending for the highest-risk patients.87
(see Exhibit 11).84
Evidence indicates the size as well as the HIT and analytic
Success, however, has not been uniform. A recent capabilities of physician practices are factors in achieving
evaluation of one of the nation’s largest multi-payer results through medical homes. In general, smaller
medical home pilots, the Pennsylvania Chronic Care practices appear to have greater difficulty than larger
Initiative, found no statistically significant differences in ones in improving patients’ health outcomes and
18lowering costs.88 Larger practices, and those with more UnitedHealthcare’s medical home model integrates a
management capacity and greater use of EHRs, have range of capabilities. These include support for practice
shown more success.89 Often medical homes lack the transformation, an engaged physician leadership, the
timely feedback and data necessary to effectively integration of care management in practice workflow
manage patients’ downstream utilization of care. through a dedicated care manager, the exchange of data
and analytics between the medical home and the payer
Another key factor appears to be how medical homes
that is real-time and bi-directional, upfront investments
are reimbursed. Some programs that link bonus
in HIT, and patient engagement in the care process over
payments to achieving recognition as an accredited
the long term. Even when all of these criteria are met,
PCMH, as well as other measures of structure or
success also depends on a financial model that rewards
processes, do not provide incentives to contain overall
value (see Box 1).
patient costs, such as through gain-sharing or partial
capitation payment models.90 Without such clear
incentives, it is more challenging to define success
around health outcomes, appropriate utilization, and
overall costs.
Exhibit 11; Group Health Cooperative PCMH change in cost and utilization, 2007 to 2009
-29% Emergency Costs
department Hospital per member
visits admissions per month
0
-5 -$10
-10
-16%
-15
-20
-29%
-25
-30
Source: Robert Reid, Katie Coleman, Eric A. Johnson, Paul A. Fishman, Clarissa Hsu, Michael P. Soman, Claire E. Trescott, Michael Erikson,
and Eric B. Larson, “The group health medical home at year two: cost savings, higher patient satisfaction, and less burnout for providers,”
Health Affairs, 2010, 29(5): 835-843.
19Box 1; Results from UnitedHealthcare’s patient-centered medical home programs
UnitedHealthcare currently operates 13 medical home programs in 10 states for the commercially insured
population (see Exhibit 12). These programs include more than 2,000 participating physicians and 300,000
members. An actuarial evaluation of four programs in Arizona, Colorado, Ohio, and Rhode Island, based on
three full years of operation between 2009 and 2012 for 40,000 members, found average gross savings
of 7.4 percent of medical costs in the third year compared to a control group. Every dollar invested in
care coordination activities produced $6 in savings in the third year (a return on investment of approximately
6 to 1). The costs of the interventions were 1.2 percent of medical costs and they offset 16 percent of the gross
savings. Including the cost of the intervention, the programs saved approximately 6.2 percent of
medical costs on average.
Achieving returns takes time as there are substantial upfront costs when setting up the medical home program,
including making infrastructure investments. Demonstrated infrastructure and capacity are prerequisites for
practices to participate, rather than program goals. These models also focus on process measures of quality,
measures of health outcomes, and reductions in downstream utilization and costs, depending on the maturity
of the model. Internal actuarial analyses showed reductions in inappropriate emergency department utilization
and lower readmission rates.
Additional analysis examined the results for a cohort of individuals who were in the medical home practice on
day one of the study period and remained in the medical home for the full period of analysis. The purpose of
this analysis was to test whether longer member engagement leads to greater reductions in cost and
utilization. In the four states noted above, there were larger annual reductions in cost growth for this cohort
than for the full population. The return on investment was 7 to 1, suggesting higher returns from approaches
that focus resources on a population over time to drive improvements in their health.
Independent third-party evaluations completed for four medical home programs in three states (Rhode Island,
Colorado, and Ohio) showed improvement on quality measures for preventive and chronic care, access, care
coordination, use of health information technology, and patient satisfaction. In particular, chronic care quality
measures improved, reflecting practice investments in that area. Success was notable for diabetes
management. However, not all measures met program targets, particularly those related to some cancer
screenings, suggesting opportunities for improvement.
Exhibit 12; States with UnitedHealthcare medical home programs
WA
ME
MT ND
VT
OR
MN NH
ID WI NY MA
SD
RI
WY MI
CT
PA
IA NJ
NE
NV OH
IL IN DE
UT
CO WV MD
MO VA
CA KS KY
AK
NC
TN
AZ OK
NM AR SC
MS AL GA
TX
LA
FL
HI
Source: UnitedHealthcare.
20Accountable care organizations Evidence about the efficacy of the ACO model has been
mixed to date. In the first year of Medicare’s Pioneer
Another emerging service delivery model is the
ACO program, only eight of 32 organizations had
accountable care organization (ACO), in which the
significantly lower growth in total Medicare spending per
primary care group practice is often a critical component
beneficiary than their local market comparison groups.91
of an integrated system of care delivery. Federal
By the second year, several ACOs had left the program.
government initiatives to advance ACOs include the
Medicare Shared Savings Program, which allows UnitedHealth Group participates in ACOs as a payer and
participating providers to share financial gains from as an analytic partner to help providers assess patients’
reduced utilization and costs, and the Medicare Pioneer needs and redesign care delivery. See Box 2 and Box 3
ACO Program, in which a small number of leading for two of those experiences. As in the medical home
integrated delivery systems have opportunities for a model, success depends on an integrated approach to
larger financial upside through shared savings but also creating measureable value that includes a central role
face downside risk. In addition, health plans are for payment reform.
partnering with providers, including primary care
practices, to implement ACO models in commercial
markets and in state Medicaid programs.
21Box 2; Results from WESTMED’s accountable care organization
WESTMED Practice Partners (WESTMED) is a multi-specialty
group practice in New York, with 250 physicians and 1,000
employees. WESTMED operates a physician-led ACO for fully
insured commercial members of UnitedHealthcare plans.
Launched in 2012, WESTMED’s ACO emphasizes primary
care through a medical home program, uses state-of-the-art
systems and EHRs, and has weekend and evening hours. Its
physicians rely on Optum’s analytic tools to access health
information about their patients, to view evidence-based
guidelines to support decisions at the point of care, to
identify best practices for disease management, and to
measure their own performance areas over time. These
analytic tools also provide WESTMED physicians, for
the first time, a view of what services their members
receive outside of the practice to enhance their
management capacity across the care continuum.
Payment is linked to cost and quality through bonus
arrangements; performance metrics included those that
measure quality, health outcomes, patient satisfaction, and
reduction of medical costs through appropriate service use.
In its first year of operation, for 13,000 covered lives, the ACO improved on nine of 10 health quality
metrics, increased patient satisfaction, and reduced health care costs. There were significant
improvements in patients taking their prescription medications properly; people with diabetes had more
routine screenings and kept better control of blood sugar levels. Between 2011 and 2012, there was an
8 percent reduction in emergency department utilization, a 5 percent decrease in hospital inpatient
cost, and a 1.3 percent reduction in risk-adjusted costs per member (see Exhibit 13).
Exhibit 13; WESTMED ACO change in utilization and costs, 2011 to 2012
Emergency Risk-adjusted
department Hospital costs per
visits inpatient costs member
0%
-1.3%
-1%
-2%
-3%
-4% -5%
-5%
-6%
-8%
-7%
-8%
-9%
Source: UnitedHealthcare and Optum.
22You can also read