NEVADA LICENSED CHILDCARE CENTER SURVEY 2021 - Department of Health and Human Services Division of Public and Behavioral Health - Aging and ...
←
→
Page content transcription
If your browser does not render page correctly, please read the page content below

NEVADA LICENSED CHILDCARE CENTER
             SURVEY
               2021

  Department of Health and Human Services
  Division of Public and Behavioral Health

                  Steve Sisolak
                    Governor

               Richard Whitley, MS
                  Director, DHHS

                  Lisa Sherych
                Administer, DHHS

              Ihsan Azzam, PhD, MD
               Chief Medical Officer
NEVADA LICENSED CHILDCARE CENTER
                   SURVEY
                     2021
Nevada Oral Health Program
Antonina Capurro DMD, MPH, MBA
State Dental Health Officer

Jessica L Woods, MPH, RDH, CDHC
Interim State Public Health Dental Hygienist

Loretta Moses, BSBM
Executive Administrative Assistant

Acknowledgements
This project was a result of collaborative effort, support, and funding from the Division of Public
and Behavioral Health, the Department of Education Office of Early Learning and Development,
the Association of State and Territorial Dental Directors, A.T. Still University, and the
University of Nevada, Las Vegas School of Dental Medicine. The contents of this report are
solely the responsibility of the author and do not necessarily represent the official views of the
supporting organizations. IRB review and approval provided through the University of Nevada,
Las Vegas School of Dental Medicine. The IRB protocol title was: [1641798-1] Oral Health
Surveillance and Dental Education for Licensed Child Care Centers in Rural Nevada. The project
received “excluded-not human subjects research” status through the UNLV Biomedical IRB
review process.

Program Direction
Antonina Capurro DMD, MPH, MBA
State Dental Health Officer
Division of Public and Behavioral Health, Oral Health Program

Jessica L Woods, MPH, RDH, CDHC
Interim State Public Health Dental Hygienist
Division of Public and Behavioral Health, Oral Health Program

Kathy Phipps, DrPh
Data and Oral Health Surveillance Subject Matter Expert
Association of State and Territorial Directors

Christina Demopoulos, DMD, MPH
Associate Professor of Biomedical Sciences
University of Nevada, Las Vegas, School of Dental Medicine

                                                                                                 2
Data Analyst and Report Writer
Kathy Phipps, DrPh
Data and Oral Health Surveillance Subject Matter Expert
Association of State and Territorial Directors

Jessica L Woods, MPH, RDH, CDHC
Interim State Public Health Dental Hygienist
Division of Public and Behavioral Health, Oral Health Program

Report Editor
Antonina Capurro DMD, MPH, MBA
State Dental Health Officer
Division of Public and Behavioral Health, Oral Health Program

Primary Dental Screener
Jessica L Woods, MPH, RDH, CDHC
Interim State Public Health Dental Hygienist
Division of Public and Behavioral Health, Oral Health Program

Alternate Dental Screener
Antonina Capurro DMD, MPH, MBA
State Dental Health Officer
Division of Public and Behavioral Health, Oral Health Program

Dental Education
Antonina Capurro DMD, MPH, MBA
State Dental Health Officer
Division of Public and Behavioral Health, Oral Health Program

Screening Coordinator and Data Entry
Loretta Moses, BSBM
Executive Administrative Assistant
Division of Public and Behavioral Health, Oral Health Program

Office of Early Learning and Development
Patti Oya
Director
Nevada Department of education, Office of Early Learning and Development

                                                                           3
Licensed Childcare Center Directors and Coordinators
Annalisa Acosta                Audrey Fitch                    Janeece Noel
Tami Bennett                   Teresa Gatenbein                Michelle Pearce
Marie Benson                   Cristina Giammalva              Averi Pereira-Luis
Valerie Boyer                  Suneita Haupt                   Denise Stout
Loraine Bridges                Jennifer Hendrix                Cindy Supko
Sarah Carone                   Kimberly Jones                  Brandy Templeton
Julie Carrington               Nyranda Kaster                  Lisa Tibbals
Shawn Cavaness                 Synthia Kenison                 Brandy Timmsen
Lorie Cirves                   Natasha King                    Sarah Tran
Christina Davis                Evelyn Knight                   Wendy VanWorth
Brandie Dixon                  Melissa Konkel                  Barbara Verdugo
Cheri Duncan                   Robbin McCullough               Ivy Ward
Elizabeth Dyches               Malah McFadden                  Joella Whitesides
Laura Edmonds                  Lualhati Mercado
Christian Elder                Jennifer Montes

Special Thank You
David P. Cappelli, DMD, MPH, PhD
Associate Dean for Community Engagement
University of Nevada, Las Vegas, School of Dental Medicine

Gregory Loeben, PhD
Associate Professor, MPH Practicum Coordinator
A.T. Still University, College of Graduate Studies

Julia Peek, MHA
Deputy Administrator, Community Services
Nevada Division of Public and Behavioral Health

Colgate Bright Smiles, Bright Futures
Alliance Kamdem, RDH, RDHAP, BSDH
Nina Trujillo, MBA
Camilo Cedeno, BSBM

This report is available on the Oral Health Program website:
http://dpbh.nv.gov/Programs/OH/OH-Home/

Report released July 2021

                                                                                    4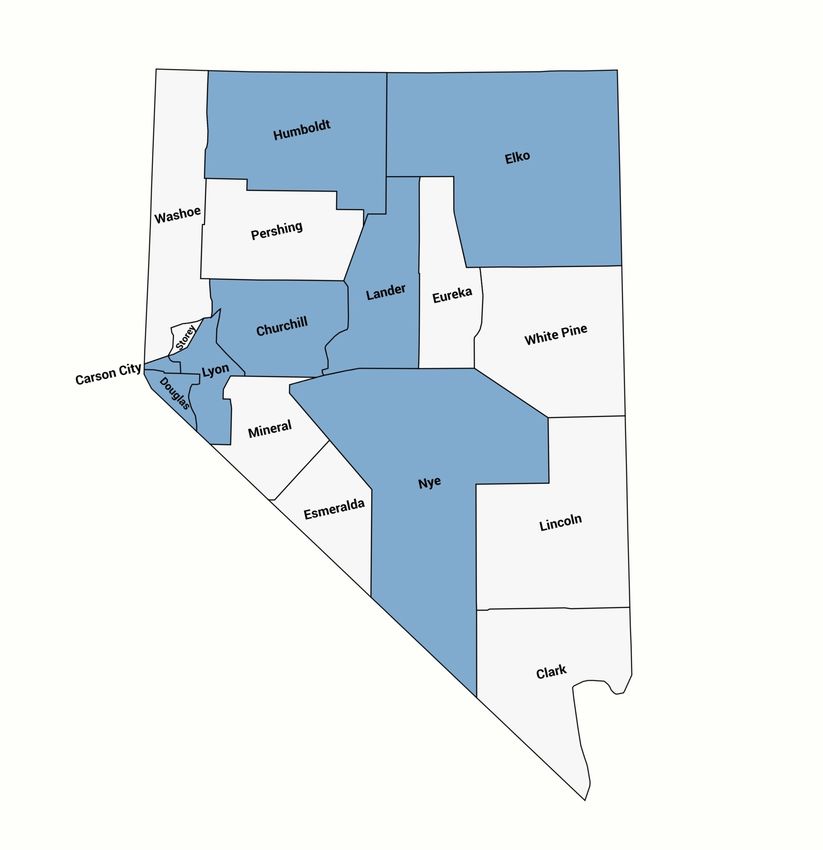
Table of Contents
  Acknowledgements __________________________________________________________ 2
  Background ________________________________________________________________ 8
  Introduction ________________________________________________________________ 8
  Key Findings – 2021 ________________________________________________________ 11
  Methodology ______________________________________________________________ 12
  Summary of Basic Screening Survey Protocol Changes Across Surveys from 2003-2021 __ 15
  Response Rates and Demographics _____________________________________________ 16
  Healthy People 2020 ________________________________________________________ 19
  Comparison of 2017 Head Start and 2021 Licensed Childcare Center Screening Results ___ 20
  Consent Form and Parent Questionnaire Results __________________________________ 22
  Special Considerations - COVID-19 ____________________________________________ 26
  2021 Summary - Caries Experience ____________________________________________ 27
  2021 Summary - Untreated Decay _____________________________________________ 31
  2021 Summary – White Spots _________________________________________________ 35
  2021 Summary - Treatment Urgency ___________________________________________ 36
  Silver State Smiles in the Childcare Centers Webinar ______________________________ 39
  Satisfaction Survey of Participating Licensed Childcare Centers ______________________ 42
  Conclusion ________________________________________________________________ 43
  Appendices _______________________________________________________________ 45

      Introduction Letter to Head Start Administrator________________________________46
      Oral Health Webinar Flyer ________________________________________________48
      Consent Form Instruction Letter____________________________________________49
      Letter to Parents ________________________________________________________51
      Brochure on Fluoride Varnish _____________________________________________52
      Consent Form and Questionnaire___________________________________________53
      Survey Screening Form __________________________________________________55
      Take-Home Findings Letter to Parents ______________________________________56
      Nevada Dental Provider Directory _________________________________________57
      Classroom Circle Brushing Guide__________________________________________60
      Dental First Aid Action Plan______________________________________________61

                                                                                         5
Tables and Figures

      Figure 1. License Childcare Centers Oral Health Survey Locations 2020-2021______10
      Table 1. Consent Form Return Rate ________________________________________16
      Figure 2. Gender Distribution of Children in Rural Nevada Licensed Childcare Centers
      Screened in 2020-2021 __________________________________________________17
      Figure 3. Age Distribution of Children in Rural Nevada Licensed Childcare Centers
      Screened in 2020-2021___________________________________________________17
      Figure 4. Race/Ethnicity Distribution of Children in Nevada Licensed Childcare Centers
      Screened in 2020-2021___________________________________________________18
      Figure 5. Children Aged 3-5 Years in Rural NV with Decay Experience and Untreated
      Decay Compared to Health People 2020 Target_______________________________19
      Figure 6. Comparison of 2017 Rural NV Head Start and 2021 Rural NV Licensed
      Childcare Screening Results – Caries Experience and Untreated Decay____________20
      Figure 7. Comparison of 2017 Rural NV Head Start and 2021 Rural NV Licensed
      Childcare Screening Results – Treatment Urgency_____________________________21
      Figure 8. Time Since Child’s Last Visit to a Dental Provider ____________________23
      Figure 9. Reason for Child’s Last Visit to a Dental Provider ____________________23
      Figure 10. Reason Child Could Not Get Needed Dental Care____________________24
      Figure 11. Type of Child’s Dental Insurance_________________________________24
      Figure 12. Average Daily Sugary Snacks or Drinks for Child____________________25
      Figure 13. Comfortable Going to the Dentist Post-COVID-19 ___________________26
      Figure 14. Caries Experience of Rural Nevada Licensed Childcare Centers –
      by Age _______________________________________________________________27
      Figure 15. Caries Experience of Rural Nevada Licensed Childcare Center Children –
      by Race/Ethnicity ______________________________________________________28
      Figure 16. Caries Experience of Rural Nevada Licensed Childcare Center Children –
      by Dental Insurance____________________________________________________28
      Figure 17. Caries Experience of Rural Nevada Licensed Childcare Center Children –
      by Last Dental Visit Within 12 Months _____________________________________29
      Figure 18. Caries Experience of Rural Nevada Licensed Childcare Center Children –
      by Sugary Snack Frequency______________________________________________29
      Figure 19. Caries Experience of Rural Nevada Licensed Childcare Center Children –
      by Number of Teeth Involved_____________________________________________30
      Figure 20. Untreated Decay of Rural Nevada Licensed Childcare Centers –
      by Age ______________________________________________________________31
      Figure 21. Untreated Decay of Rural Nevada Licensed Childcare Centers –
      by Race/Ethnicity______________________________________________________32
      Figure 22. Untreated Decay of Rural Nevada Licensed Childcare Center Children –
      by Dental Insurance____________________________________________________32
      Figure 23. Untreated Decay of Rural Nevada Licensed Childcare Center Children –
      by Last Dental Visit Within 12 Months _____________________________________33
      Figure 24. Untreated Decay of Rural Nevada Licensed Childcare Center Children –
       by Sugary Snack Frequency _____________________________________________33
      Figure 25. Untreated Decay of Rural Nevada Licensed Childcare Center Children –
      by Number of Teeth Involved_____________________________________________34

                                                                                           6
Figure 26. White Spots of Rural Nevada Licensed Childcare Centers –
by Age _____________________________________________________________35
Figure 27. White Spots of Rural Nevada Licensed Childcare Center Children –
by Dental Insurance___________________________________________________35
Figure 28. Treatment Urgency Distribution of Children in Rural Nevada Licensed
Childcare Centers – By Age_____________________________________________36
Figure 29. Treatment Urgency Distribution of Children in Rural Nevada Licensed
Childcare Centers – By Race/Ethnicity ____________________________________37
Figure 30. Treatment Urgency Distribution of Rural Licensed Childcare Children –
By Dental Insurance___________________________________________________37
Figure 31. Treatment Urgency Distribution of Rural Nevada Licensed Childcare
Center Children – By Last Dental Visit Within 12 Months _____________________38
Figure 32. Treatment Urgency Distribution of Rural Nevada Licensed Childcare
Center Children – By Frequency of Sugary Snacks ___________________________38
Table 2. Webinar Pre- and Post-Survey Results______________________________40

                                                                                   7
Background

The Nevada Division of Public and Behavioral Health, Oral Health Program through a grant from
the Nevada Department of Education, designed an oral health surveillance project. The purpose
of this study was to evaluate the oral health status of children (ages 3-5 years of age) receiving
care from licensed childcare centers in rural Nevada. A similar project was completed by the
Nevada Oral Health Program in 2017-2018 when the oral health status of children in rural Head
Start programs was assessed. Aggregate results of this study will be compared to the reports from
the 2017-2018 Head Start oral health assessment. Oral health promotion, early detection, and
classroom education were novel elements that were included in this project that have not been
included in previous state basic screening survey designs. Nevada Registry approved oral health
webinars were offered to educators and to equip teachers with oral health information that could
be shared with the children in their care. Classroom toothbrushing stations were also established
within each center.

Introduction

In 2003, a dental screening was conducted by what was then the Nevada State Health Division
Oral Health Program to review oral health data on children enrolled in Nevada Head Start
programs. The protocol used for the screening was the Association of State and Territorial Dental
Directors (ASTDD) Basic Screening Survey (BSS). All 44 Head Start sites were screened and a
report was issued on the results.1

In 2007, the Nevada Oral Health Program completed a second dental screening, and all 44 Head
Start sites were again screened using the BSS protocol. A report from that survey summarized the
findings of the 2007 screening, compared the findings with Federal Healthy People 2010
objectives, and provided high-level comparison between the 2003 and 2007 screening results.2

In 2017, the Nevada Division of Public and Behavioral Health (DPBH), Oral Health Program
partnered with the Department of Education’s Office of Early Learning and Development (DOE),
Head Start State Collaboration Office to conduct another dental screening to collect oral health
data on Nevada rural Head Start children. The BSS protocol was again used to assess for caries,
caries experience, untreated decay, and the need for urgent dental treatment. It should be noted
that the BSS is not considered research or direct patient treatment but is classified as public health
surveillance. All 16 Head Start Centers located in 11 of the 17 Nevada counties were screened
(Figure 1). Las Vegas and Reno were not included in this survey because the Head Starts in these
greater metropolitan areas were already screened regularly through dental hygiene programs at the
College of Southern Nevada and Truckee Meadows Community College, through Community
Health Alliance, and through a research project conducted by the University of Nevada, Las Vegas
School of Dental Medicine (UNLV SDM). Overlap of these similar projects in these regions was
deemed undesirable.

1
    http://dpbh.nv.gov/uploadedFiles/dpbhnvgov/content/Programs/OH/Oral_Health_Program_Reports/healthysmilehappychildsurvey2003.pdf
2
    http://dpbh.nv.gov/uploadedFiles/dpbhnvgov/content/Programs/OH/Oral_Health_Program_Reports/BSSheadstart2007final73007.pdf

                                                                                                                                      8
In 2020, the DPBH, Oral Health Program again partnered with the DOE to conduct a dental
surveillance project. The DPBH, Oral Health Program, which was housed through contract (C
23271) at the UNLV SDM, received a grant from the DOE (C22479) to conduct a dental
surveillance project in Nevada's rural LCC.

The purpose of the project was to obtain information on the oral health of children attending non-
Head Start childcare and preschool programs in rural Nevada and compare the results with the
survey of children enrolled in rural Head Start programs which was previously completed (2017-
2018). A list of the rural childcare facilities licensed by the state of Nevada was obtained from the
Nevada Department of Health and Human Services. In Nevada, licensed childcare facilities fall
into three categories based on their size: center, group care home, or family care homes. The
sampling frame was limited to facilities designated as "centers" or "group care.” Centers are
facilities that stand alone and provide all-day curriculum childcare. “Group care” facilities within
an individual’s residential home, can care for up to 12 children within the home, and require one
additional caregiver and a curriculum. For this study, 91 licensed childcare facilities were
identified within the target geographic location of rural Nevada. In Nevada, this includes all
childcare centers outside of the urban centers of Las Vegas and Reno. Though all LCC were not
included in this survey, this data is important in that it focuses on oral health in Nevada’s rural
population and documents the extent of oral health needs in young children in these areas.
According to Oral Health in America: A Report of the Surgeon General,3 children from low-
income families have more tooth decay, more extensive tooth decay, and suffer more pain than
children from families with higher incomes. Screening results are expected to aid in targeted
interventions to prevent oral disease so that growth, development, and overall quality of life for all
of Nevada’s children is enhanced.

Data was collected through a BSS; an "open-mouth" screening conducted with parental consent to
assess for caries, caries experience, untreated decay, and the need for urgent dental treatment. The
BSS was developed by the ASTDD to monitor the burden of oral disease at state and local levels
for evaluation against Healthy People objectives. The BSS is a nationally recognized tool for
public health surveillance. Therefore, this project is not research but a public health surveillance
project to inform Nevada public health action, planning, and program evaluation. The underlying
project goal is to gather aggregate data that will focus programs and State funds to improve oral
health care by increasing the number of young children with dental "homes" and decreasing the
number of children with untreated tooth decay. There were 29 LCC located in 8 of the 17 Nevada
counties that were screened (Figure 1).

Oral health promotion, early detection, and classroom education were novel elements that were
included in this project that have not been included in the previous State BSS designs. Nevada
Registry approved oral health webinars that were offered to educators and equipped teachers with
oral health information that could be shared with the children in their care. Classroom
toothbrushing stations were also established within each center. By providing in-service training
and positively altering the attitudes of childcare educators, the residual influence of oral health
promotion will influence the oral health habits of students.

3U.S. Dept. of Health and Human Services. Oral Health in America: A Report of the Surgeon General. Rockville, MD: U.S. Dept. of
Health and Human Services, National Institute of Dental and Craniofacial Research, National Institutes of health, 2000.

                                                                                                                                  9
Figure 1. License Childcare Centers Oral Health Survey Locations 2020-2021

                                                                             10
Key Findings – 2021
Compared to children attending Head Start in rural Nevada, children attending preschool at
Licensed Childcare Centers in rural Nevada have a substantially lower prevalence of decay
experience and a lower prevalence of untreated decay.
26.8% of children enrolled in rural Licensed Childcare Centers in this survey had caries
experience (one or more teeth with untreated or treated decay) as compared to the 50% of rural
Head Start children in the survey. This finding is lower than the Healthy People 2020 objective
for untreated decay (27.9%).
Caries experience increases with age, with 14% of 3-year-olds, 33% of 4-year-olds, and 36% of
5-year-olds having caries experience.
20.2% of children enrolled in rural Licensed Childcare Centers in this survey had untreated decay
as compared to the 26% of rural Head Start children. This finding exceeds the Healthy People
2020 objective for untreated decay (11.9%).
Although the prevalence of decay experience is similar for rural Nevada preschool children and
the U.S. average (27% and 28% respectively), preschool children in rural Nevada have a higher
prevalence of untreated decay (20% vs. 12%).
19% of children enrolled in rural Licensed Childcare Centers in this survey needed either early
or urgent dental care, compared with the 29% of these rural Head Start children who needed
either early or urgent dental care in the 2017 survey.
52% of parents reported that the cost of dental care was the reason their child was not able to get
dental care when they needed it, followed by office closures caused by COVID-19 (43%), inability
to take time off work (19%), and not having dental insurance (14%).
11Methodology
Since all 29 LCC were screened, the results of this screening are reported as a “census.” It was
determined that, rather than research, this dental screening was considered an oral health
surveillance effort to continue to monitor the oral health status of this population. While the
program may share the name of screened children with the childcare facility center administrator
for follow-up, no individual child will be identified in any reports. Only aggregate results will be
reported (e.g., from centers, counties, or regions). Participating childcare centers will be the first
to receive such reports.
Letters went out first to each site Administrator for their approval to participate in the project (see
appendices). The letter included information on the project and an optional oral health webinar.
Follow-up calls were made to secure participation, answer questions, and schedule a screening
visit.
After securing participation, all consent forms were mailed in advance to the childcare facility for
distribution to parents. Packets included a letter to parents, a fluoride varnish brochure, a consent
form, and a questionnaire (see appendices). All documents distributed to parents were available in
English and Spanish. To improve consent form return, children were given a colored wrist band to
remind their parents that they went home with paperwork that required attention. Assessment
questions within the consent form provided information on local access to care and the child's
susceptibility to dental decay. This questionnaire allowed the study to assess oral health at a state
and local level.
Compensation to subjects consists of a free screening, a free fluoride varnish application, and a
free patient care bag with a toothbrush, toothpaste, floss, timer, and sticker. The administrators and
teachers within the identified LCC were vital to encouraging the completion of parental consent
forms and ensuring that documents are returned promptly. The project offered school incentives
in the form of a $100 gift card to Lakeshore Learning for those sites reaching a 70% response rate
to improve the return rates of consent forms. The percentage of completed consent forms was
associated with forms with a parental signature regardless of whether the parent accepts or denies
the child's participation in the study.
In addition, a webinar was offered to all staff, educators, and administration within each of the
identified LCC. A vital component of this project was equipping educators with tools and
information on oral health. In total, seven comparable, 2.5-hour Nevada Registry-approved
webinars were offered that provided an overview of the dental screening (BSS) process, evidence-
based oral health education, dental first aid, and tips to incorporate oral health into the daily
curriculum. These webinars met the standards set forth by the Department of Education's Silver
State Stars Quality Rating and Improvement System (QRIS). Content mastery was evaluated using
a pre- and post-survey. Colgate Bright Smiles, Bright Futures (BSBF) was an integral partner in
providing these webinars. Colgate BSBF contributed to both the presentation and suppling the
LCC and educators with oral hygiene supplies.
Prior to the site visits, follow-up confirmation and reminder calls were made to the centers a week
before the visit date, and then the day before the visit.
12The screening portion was based on the ASTDD Basic Screening Survey (BSS) protocol. All
children with a signed positive consent form who were present the day of screening were screened
in an area designated by the Childcare Center. The dental screenings were completed by the
Nevada-licensed Interim State Public Health Dental Hygienist, who was calibrated on the BSS
protocol beforehand. The State Dental Health Officer, who has similarly been standardized on the
BSS protocol, was available to provide screening support as needed. Screenings were conducted
with a headlamp, disposable gloves, a disposable mirror, and gauze (as needed to remove debris).
A fluoride varnish application was provided to those children who meet all of the following
indications: separate consent for the fluoride varnish, no contraindications listed on the consent
form, and willingness to cooperate with the procedure. The screener entered the screening results
for each child on a paper screening form on-site and filled out “Take Home Findings” to be sent
home with the child that included post-fluoride varnish application instructions and dental care
tips. A list of low-cost community dental clinics in Nevada was also attached (see appendices).
Children received an oral health supply bag with a toothbrush, toothpaste, floss, and a timer for
use with brushing to take home with them.
A Microsoft Access database was created and tested, and decision rules were written for data entry.
The data recorder entered all information into the database.
Conditions were recorded as follows:
1. Non-Cavitated White Spot (y/n) was marked yes if at least one tooth had decalcification
with no break in the enamel. Included were the number of teeth fitting the description.
2. Untreated Decay (y/n) was marked if at least one tooth had a break in the enamel that was
large enough to be detected visually. Staining was not included as untreated decay.
Included were the number of teeth fitting the description.
3. Treated Decay (y/n) was marked if at least one tooth was extracted due to decay or had
amalgam (silver) or composite (white) fillings, stainless steel crowns, white-faced crowns,
or “other.” Included was the number of teeth fitting the description.
4. Treatment Urgency was considered the whole mouth, with “Urgent” marked for signs or
symptoms that included pain, or infection, swelling or soft tissue ulceration of more than
two-weeks’ duration as determined by questioning were present. “Early” was marked if
visible caries without accompanying signs or symptoms were present, or there was
spontaneous bleeding of the gums or suspicious white or red soft tissue areas. “None” was
marked if the child was without any of the problems listed above.
Oral health education and health promotion for the entire classroom were key components to this
project. An interactive presentation on oral health, nutrition, the classroom toothbrushing station,
and a child appropriate story on dental health was read to each classroom. Children were able to
ask questions and interact during the demonstrations.
Classroom toothbrushing stations were established within each of the centers. Enough supplies
were provided to cover 880 children with oral hygiene kits to be used in the classroom. However,
in-classroom toothbrushing implementation was delayed due to COVID-19 related safety
standards. The follow-up survey with the centers assessed the benefits of the toothbrushing station.
13Following the site visits, a satisfaction survey was sent to each site administrator for project
feedback. The survey asked for feedback received from staff, parents, or children regarding
project, the screening, the educational presentation, or any aspects of the project.
14Summary of Basic Screening Survey Protocol Changes Across Surveys from 2003-2021
The basic screening survey (BSS) is a nationally recognized tool for public health surveillance.
The basic screening survey was developed by the Association of State and Territorial Dental
Directors to monitor the burden of oral disease at state and local levels for evaluation against
Healthy People objectives. The screening includes visual observation of the child's dental health
with a mouth mirror and light.
• The 1999 version had one data element for race and another for ethnicity. Field testing
found two problems with the 1999 method – missing data, and the inability to code multi-
racial children. The 2003 version of BSS updated the method for collecting race and
ethnicity information by combining them into one question (to reduce the amount of
missing data) and included a code for multi-racial children.
• The 1999 version of Basic Screening Surveys: An Approach to Monitoring Community
Oral Health included “untreated decay” and “caries experience” as two of the screening
indicators. Combining these two indicators, however, did not allow states to determine
which children had received previous treatment for caries. In 2007, the ASTDD Executive
Committee approved changing the “caries experience” indicator to “treated decay.”
• It was then recommended that caries experience, which is still an indicator for the National
Oral Health Surveillance System (NOHSS), be calculated from untreated decay and treated
decay.
• As states developed their oral health surveillance infrastructure, some indicated interest in
collecting information on disease severity in addition to prevalence data. The 2008 version
of BSS added a set of options for each indicator, ranging from a simple “no/yes” prevalence
measure to more complex measures indicating severity of disease. If a severity option is
selected, prevalence can still be calculated as one of the NOHSS indicators.
• In 2015, the early childhood caries (ECC) indicator – decay experience on maxillary
anterior teeth – was deleted because the generally accepted definition of ECC is decay on
any tooth rather than only on the maxillary anterior teeth. The optional questions were
updated to align with national surveys.
• In 2017, optional indicators for dental sealants on primary molars and potentially arrested
decay were added for states wishing to monitor the use of primary molar sealants and caries
arresting agents such as silver diamine fluoride. The optional questions were again updated
to align with current national surveys. (Note: “sealants on primary teeth” and “potentially
arrested decay” were not recorded in the 2017 Nevada Head Start Survey.
15Response Rates and Demographics
In 2020, there were 69 childcare facilities in rural Nevada designated as either “centers” or “group
care”. The state Oral Health Program attempted to contact and invite all 69 facilities:
• 29 facilities agreed to participate
• 3 facilities were closed
• 6 facilities declined to participate
• 25 facilities did not respond to multiple enquiries
The participating childcare facilities distributed a combined consent form/questionnaire to all
parents. The consent form allowed parents to consent to a dental screening and/or a fluoride varnish
application. The questionnaire included several questions regarding their child’s oral health, oral
health related habits, access to dental care, and demographics. A total of 749 consent
forms/questionnaires were distributed to parents/caregivers and 445 were returned to the school
(55%). Of these, 414 were for children 3-5 years of age. Of the 414 children aged 3-5 years:
• 48 had parents that refused the screening
• 366 had parents that allowed their child to have a screening
• 321 children aged 3-5 years received a screening (45 children were absent on the day of
the screening)
A fluoride varnish application was offered along with the screening. Many parents chose not to
participate in this free fluoride varnish application for their children, with 209 children (65%)
receiving fluoride varnish. While the option for refusal could be due to allergies (4%), medical
issues (0%), and/or recent fluoride application (14%), nearly 78% did not provide consent for
fluoride application. This result may reflect continuing attitudes of mistrust related to fluoride and
fluoride preventive regimens.
A $100 gift card to an online educational supply store was offered as an incentive for centers with
at least a 70% consent return rate. Of the 29 schools, 12 met or exceeded the 70% rate (Table 1).
Gift cards were distributed following the visit to the centers.
Table 1. Consent Form Return Rate
Consent Return Rate Number of
Schools
100% 1
90-99% 2
80-89% 5
70-79% 4
Below 70% 17
The demographic characteristics of age, gender, and race/ethnicity for the 2021 rural Nevada
Licensed Childcare Center survey participants can be seen in Figures 2 and 3.
16Figure 2. Gender Distribution of Children in Rural Nevada Licensed Childcare Centers Screened
in 2020-2021
Gender Distribution of Children in Rural
Nevada Licensed Childcare Centers
Screened in 2020-2021
50.5% 49%
0.5%
Female Male Unknown/Missing
Figure 3. Age Distribution of Children in Rural Nevada Licensed Childcare Centers Screened in
2020-2021
Age Distribution of Children in Rural
Nevada Licensed Childcare Centers
Screened in 2020-2021
50.2%
35.3%
14.5%
Age 3 Age 4 Age 5
Race/Ethnicity – On the consent form, the parent/guardian could select one or more choices from
the following list: White, Black/African American, Asian, Hispanic/Latino, Native
Hawaiian/Pacific Islander, American Indian/Alaska Native, Multi-Racial and Unsure. For
summary purposes the responses were organized into mutually exclusive groups using the
following logic. If Hispanic was selected as one of the choices, then the child was categorized as
Hispanic. If only White was selected, then the child was categorized as White. If only Black was
selected, then the child was categorized as Black. If only American Indian/Alaska Native was
selected, then the child was categorized as American Indian/Alaska Native. If a parent selected
17multi-racial or multiple selections (not including Hispanic) the child was categorized as multi-
racial.
Figure 4. Race/Ethnicity Distribution of Children in Nevada Licensed Childcare Centers Screened
in 2020-2021
Race/Ethnicity Distribution of Children in Nevada
Licensed Childcare Centers Screened in 2020-2021
65.5%
14.0% 13.8%
0.5% 5.3% 1.0%
White Black Hispanic American Multiracial Unknown/Missing
Indian/Alaskan
Native
18Healthy People 2020
Healthy People 2020 is a set of health objectives for the nation to achieve by the year 2020.4 There
are 17 specific oral health objectives to prevent and control oral diseases and reduce oral health
disparities. Three oral health indices are included for children three to five years of age.
OH 1.1 Reduce the proportion of children aged 3 to 5 years with dental caries experience in their
primary teeth (target – 30%)
OH 2.1 Reduce the proportion of children aged 3 to 5 years with untreated dental decay in their
primary teeth (target 21.4%)
OH 12.1 Increase the proportion of children aged 3 to 5 years who have received dental sealants
on one or more of their primary molar teeth (target 1.5%)
Figure 5 compares caries experience and untreated decay for children in Nevada LCC (age three
to five) to Healthy People 2020 objectives 1.1 and 2.1. This clearly demonstrates the gap in
achieving the Healthy People 2020 objectives for children of families with low incomes. The LCC
survey did not assess dental sealants on primary teeth.
Figure 5. Children Aged 3-5 Years in Rural NV with Decay Experience and Untreated Decay
Compared to Health People 2020 Target
50.0%
HP 2020 Target – 30%
26.8% 27.9% HP 2020 Target – 21% 26.0%
20.2%
11.9%
Decay Experience Untreated Decay
RuralNV
Rural NVPreschool,
LCC, 2020-2021
2020-21 Rural NV Head Start, 2017 United States, 2013-16
4
https://www.healthypeople.gov/
19Comparison of 2017 Head Start and 2021 Licensed Childcare Center Screening Results
A comparison of 2021 rural LCC screening results to the results of children in the 2017 rural Head
Start programs indicates that oral health status is more favorable (Figure 6). Caries experience,
untreated decay, and need for treatment were all lower in the 2021 survey compared to results for
rural Head Start children in 2017. The overall caries experience prevalence of 27%, is lower than
the 50% prevalence for rural Head Start children in 2017. Untreated decay shows a prevalence of
20% compared to rural Head Start children prevalence 26% in 2017. Rural LCC children exceeded
both the caries experience and untreated decay Healthy People 2020 goals while the Nevada Head
Start Children fell short of the of 30% for caries experience and 21% for untreated decay.
Figure 6. Comparison of 2017 Rural NV Head Start and 2021 Rural NV Licensed Childcare
Screening Results – Caries Experience and Untreated Decay
Comparison of 2017 Rural NV Head Start and 2021
Rural NV Licensed Childcare Screening Results –
Caries Experience and Untreated Decay
50%
27% 26%
20%
CARIES EXPERIENCE UNTREATED DECAY
Head Start Licensed Childcare Centers
Figure 7 displays the distributional findings of treatment need for rural Nevada LCC children from
the 2021 survey compared to rural Nevada Head Start children from the 2017 survey. In comparing
to rural results for the 2021 survey and combining “urgent” and “early” dental needs, the 2021
results reveal that 19% of rural LCC children have need for dental care, compared to 28% of rural
Nevada Head Start children in 2017. The 1% of children with “urgent” need for dental care
represents children with dental pain or infection at the time of the screenings is significantly less
than the 8% of urgent need reported from the 2017. The survey showed that 81% of children in
rural Nevada LCC were not in immediate need of dental care, far less than the 71% surveyed in
2017.
20Figure 7. Comparison of 2017 Rural NV Head Start and 2021 Rural NV Licensed Childcare
Screening Results – Treatment Urgency
Comparison of 2017 Rural NV Head Start and 2021 Rural
NV Licensed Childcare Screening Results – Treatment
Urgency
81%
71%
20% 18%
8% 1%
URGENT CARE EARLY CARE NO CARE NEEDED
Head Start Licensed Childcare Centers*
*Note: Information on urgency of need for dental care was missing for 14 children. It is assumed that they were not in need of care.
21Consent Form and Parent Questionnaire Results
This study involves only minimal risk as it meets the definition set by the Federal Regulations at
45CFR46.102(i), “Minimal risk means that the probability and magnitude of harm or discomfort
anticipated in the research are not greater in and of themselves than those ordinarily encountered
in daily life or during the performance of routine physical or psychological examinations or tests.”
Standard questions were included on the parent consent form to obtain further information from
parents that could be related to the oral health status of the children. General health questions asked
parents whether their child had asthma, allergies, medical conditions, current medications, current
fluoride tablets or drops, and fluoride varnish treatment in the past three months. There were
relatively few positive responses to these questions, with 4% reporting their children had asthma,
about 17% reporting allergies, about 3% reporting medical conditions, more than 5% reporting
that the child was currently taking medications, about 3% reporting that the child was currently
getting fluoride tablets or drops, and about 16% of the children having received a fluoride varnish
application in the past three months. Compared with the results of the 2017 survey where 5%
reported their children had asthma, about 11% reported allergies, about 3% reported medical
conditions, more than 5% reported that the child was currently taking medications, about 3%
reported that the child was currently getting fluoride tablets or drops, and about 8% of the children
having received a fluoride varnish application in the past three months.
The parental consent form includes a brief questionnaire and a parental permission section that
included the statement, “Yes, I give permission for my child to have a dental screening. I
understand that this screening does not replace a full dental exam, and that my child should still
go to a dentist. I understand that the results of this screening may be shared with the Nevada
Department of Health and Human Services, Head Start, and with dental providers for my child.”
The consent form allows the parent to either accept or withhold their child’s participation. This
project requires only nominal participant involvement as the parental consent form and
questionnaire takes less than five minutes to complete. Participation is voluntary, and a parent may
withdraw consent at any time. Administrators, site coordinators, parents, and teachers are
encouraged to ask questions about the project.
Consent forms were collected by the screener upon arrival to the centers. The consent and
screening forms from the sites were placed in a locked compartment of the suitcase used for this
project’s supplies. Data forms were then transferred to a locked file box to be secured until entry
and analysis was complete. The data on the forms was entered and kept in password-protected
State-issued computers within the DPBH Oral Health Program located at UNLV SDM. No home
addresses were collected; only home zip codes to be used to identify areas of decay and consequent
need. The data was sent to the ASTDD for analysis via an encoded file. State protocol for electronic
transfer was followed. Only aggregate data has been included in this report. Hard-copy screening
and consent forms will be maintained for three years and subsequently destroyed.
The consent form also included questions directly related to the dental care and oral health of the
child. When asked about time since the child last visited a dental provider, over 60% of parents
reported that child has seen within the last year. The full results for this question are shown in
Figure 8.
22Figure 8. Time Since Child’s Last Visit to a Dental Provider
Time Since Child’s Last Visit to a
Dental Provider
61%
13% 1% 14% 11%
g
s
s
r
s
ve
th
ar
ar
in
i ss
Ye
on
Ye
Ne
M
M
e
3
or
1-
n/
12
M
w
st
no
or
La
nk
3
/U
w
no
tK
n'
Do
Most children (90%) had visited the dental provider for a routine recall, either initiated by the
parent or by the dental provider. Only 3% of the dental visits were related to a dental problem or
dental pain. The distribution of reasons for a dental visit are shown in Figure 9.
Figure 9. Reason for Child’s Last Visit to a Dental Provider
Reason for Child’s Last Visit to a
Dental Provider
88%
2% 2% 5% 3%
Routine care – Routine care – Something Was Went for Other
patient provider Wrong Treatment
initiated initiated
23A further indication of dental care access was addressed by a question asking parents if they had
experienced trouble getting their child needed dental care in the past 12 months. A total of 26% of
parents indicated that their child needed care but could not get it. The reasons for why the child
could not get dental care are seen in Figure 10.
Figure 10. Reason Child Could Not Get Needed Dental Care
Reason Child Could Not Get Needed Dental Care
52%
43%
19%
14% 0% 10% 10% 5% 5% 5% 5% 0% 0% 0%
…
t…
n
t
er
r
s
19
k
e
sy
us
ay
gh
ice
en
ep
he
ist
or
nc
tio
Bu
vid
io
w
D-
Hi
rv
W
ni
nt
Ot
cc
ra
ta
rA
er
VI
Se
ro
oo
ve
o
tA
De
su
or
of
gS
To
CO
Fa
rP
on
er
T
In
sp
No
e
of
in
st
o
ov
m
he
tC
o
an
th
To
Co
id
N
d
Ti
tC
ot
No
Tr
Di
No
ra
ke
e
An
No
Af
fic
er
rs
Ta
id
Of
ou
d
to
ov
Di
fH
Pr
le
e
Of
nc
ab
ra
Un
su
In
*Note: Parents could select more than one response, total percentage may exceed 100.
When asked specifically about dental insurance, the most frequent response was Medicaid or other
public insurance (Figure 11).
Figure 11. Type of Child’s Dental Insurance
Type of Child’s Dental Insurance
31%
28%
25%
16%
Medicaid or Other Private None Unknown/Missing
Public Insurance
*Note: Four children had both private insurance and Medicaid; they were classified as having private insurance.
24Finally, most parents reported a low daily frequency of sugary snacks and drinks for their children.
The results for this question are displayed in Figure 12.
Figure 12. Average Daily Sugary Snacks or Drinks for Child
Average Daily Sugary Snacks or Drinks or
for Child
66%
25%
0% 9%
2 or Less 3 to 5 6 or More Unknown/Missing
25Special Considerations - COVID-19
The contract for this project was originally projected to start December 2019 but the original
contract was revised due to the COVID-19 pandemic. The primary activity of the contract was to
provide dental screenings and classroom education for childcare centers in rural Nevada. Due to
the closure of childcare centers during the COVID-19 pandemic, all travel and visits were
postponed. As childcare centers began to reopen the trips were rescheduled for November 2020 to
February 2021. State motor pool closed during the month of December which resulted in
additional delays.
Since this project was completed during the COVID-19 pandemic, at a time when centers were
facing unprecedented challenges, many centers that would have been included in the study notified
the team that they were planning to close due to loss of enrollment, were undergoing quarantine,
or were uncomfortable with outside visitors.
For the sites that were included in the survey, additional infection control measures were
implemented as outlined by the Center for Disease Control and Prevention (CDC)5 and
Occupational Safety and Health Administration (OSHA).6 Dental screenings and oral health
education fall under low to moderate risk for disease transmission as they are non-/low-
aerosolizing procedures. All members of the team visiting the childcare centers had a daily
temperature check, wore surgical bouffant cap, disposable gown, eye protection, level III surgical
mask, and gloves. All surfaces were disinfected with EPA-approved cleaners before, between, and
after each screening.
Figure 13. Comfortable Going to the Dentist Post-COVID-19
Comfortable Going to the Dentist Post-
COVID-19
84%
6% 10%
Yes No Unknown/Missing
5 https://www.cdc.gov/coronavirus/2019-ncov/hcp/dental-settings.html
6https://www.osha.gov/SLTC/covid19/dentistry.html?fbclid=IwAR3Rv52Zrg_rNDmU3Fc_GyNfTAZDc6ipadD0kA7iVafaOUgpsfXMu
_0BA3o
262021 Summary - Caries Experience
Caries experience includes the presence of fillings and untreated decay in primary (baby) teeth,
and primary teeth missing due to caries. Almost 27% of Nevada rural LCC 3 to 5-year-old children
have decay experience. There was a higher prevalence of caries experience in males (31%) than
females (22%) with caries experience. The following results show caries experience for these
children by age, race/ethnicity and other potentially associated variables from the parent
questionnaire.
As expected, caries experience increases with age, increasing in prevalence by 22% between ages
3 and 5 (Figure 14), with 27% of rural Nevada 3 to 5-year-old LCC children having caries
experience. For reference, the National Health and Nutrition Examination Survey (NHANES) for
2013-2016 found an estimated 28% of all 3 to 5-year-olds (not just rural LCC or Head Start
children) had caries experience.7 NHANES results did show higher caries experience with lower
family income level.
Figure 14. Caries Experience of Rural Nevada Licensed Childcare Centers – by Age
Caries Experience of Rural Nevada Licensed
Childcare Centers – by Age
36%
33%
14%
3 Year Olds 4 Year Olds 5 Year Olds
Hispanic or non-White children in LCC had slightly higher prevalence of caries experience
(27.3%) than their White (not Hispanic) counterparts (26.6%).
7
https://www.healthypeople.gov/2020/data-search/Search-the-Data?nid=4992
27Figure 15. Caries Experience of Rural Nevada Licensed Childcare Center Children – by
Race/Ethnicity
Caries Experience of Rural Nevada
Licensed Childcare Center Children –
by Race/Ethnicity
27.3%
26.6%
White (Non-Hispanic) Hispanic or Non-White
Caries experience is lowest for Nevada LCC children with private dental insurance and highest for
those with Medicaid or other public insurance (Figure 16).
Figure 16. Caries Experience of Rural Nevada Licensed Childcare Center Children – by Dental
Insurance
Caries Experience of Rural Nevada Licensed
Childcare Center Children – by Dental
Insurance
35%
28%
24%
Medicaid or Other Public Private None
Insurance
There was no significant difference in caries experience between children seen by a dentist in the
last year (25.8%) and those that had not (25.7%). Caries experience considers both treated and
untreated decay and indicates that children either have dental decay or have been to the dentist to
remove decay.
28Figure 17. Caries Experience of Rural Nevada Licensed Childcare Center Children – by Last
Dental Visit Within 12 Months
Caries Experience of Rural Nevada
Licensed Childcare Center Children –
by Last Dental Visit Within 12 Months
25.8% 25.7%
Yes No
Lower caries experience was seen in children with lower frequency of sugary drinks and snacks
consumption (Figure 18).
Figure 18. Caries Experience of Rural Nevada Licensed Childcare Center Children – by Sugary
Snack Frequency
Caries Experience of Rural Nevada Licensed
Childcare Center Children – by Sugary
Snack Frequency
36%
22%
2 or Less 3 to 5
Each child present, whose parent/guardian gave permission, was screened for untreated and treated
decay (caries experience). Per the BSS criteria, untreated decay and treated decay in the following
categories were counted: cavitated carious lesions, amalgam (silver) or composite (white) filled,
stainless steel crowns, white-faced crowns (a type of esthetic crown for front teeth) and extracted
teeth.
29Of the children screened, 27% had decayed or treated primary teeth (caries experience). Of those
children with any type of decayed or treated teeth, 12% had one or two teeth, 5% had three to four
teeth, 5% had five to six teeth, and 3% had seven or more teeth that were involved (Figure 19).
Figure 19. Caries Experience of Rural Nevada Licensed Childcare Center Children – by Number
of Teeth Involved
Caries Experience of Rural Nevada Licensed
Childcare Center Children – by Number of
Teeth Involved
73.9%
12.3% 5.3% 5.3% 3.1%
0 Teeth 1-2 Teeth 3-4 Teeth 5-6 Teeth 7+ Teeth
*Note: Information on the number of teeth with caries experience was missing for three children.
302021 Summary - Untreated Decay
Untreated decay refers to caries experience (a cavity) that is visible but has not been filled or
treated. More than one in five (20%) of Nevada LCC children have untreated decay. There was a
higher prevalence of caries experience in males (23%) than females (18%) with untreated decay.
The following results show caries experience for these children by age, race/ethnicity and other
potentially associated variables from the parent questionnaire.
Untreated decay prevalence shows the biggest change between ages 3 and 4, with an additional
increase also seen by age 5 (Figure 20), with 20% of rural LCC 3 to 5-year-old children having
untreated cavities overall. The National Health and Nutrition Examination Survey (NHANES) for
2013-2016 found an estimated 12% of all 3 to 5-year-olds (not just rural LCC or Head Start
children) had untreated decay.8 And as with NHANES results for caries experience, results showed
higher prevalence of untreated decay with lower family income level.
Figure 20. Untreated Decay of Rural Nevada Licensed Childcare Centers – by Age
Untreated Decay of Rural Nevada Licensed
Childcare Centers – by Age
24%
21%
14%
3 Year Olds 4 Year Olds 5 Year Olds
Hispanic or non-White children in LCC had higher prevalence of caries experience (24.2%) than
their White (not Hispanic) counterparts (20.6%).
8
https://www.healthypeople.gov/2020/data-search/Search-the-Data?nid=5016
31Figure 21. Untreated Decay of Rural Nevada Licensed Childcare Centers – by Race/Ethnicity
Untreated Decay of Rural Nevada
Licensed Childcare Center Children –
by Race/Ethnicity
24.2%
20.6%
White (Non-Hispanic) Hispanic or Non-White
Untreated decay is lowest for Nevada LCC children with private dental insurance and highest for
those with Medicaid or other public insurance (Figure 22).
Figure 22. Untreated Decay of Rural Nevada Licensed Childcare Center Children – by Dental
Insurance
Untreated Decay of Rural Nevada Licensed
Childcare Center Children – by Dental
Insurance
33%
25%
17%
Medicaid or Other Public Private None
Insurance
Lower prevalence of untreated caries was seen in children with a dental visit in the past year (26%)
than children not seen in the last year (29%) (Figure 23).
32Figure 23. Untreated Decay of Rural Nevada Licensed Childcare Center Children – by Last
Dental Visit Within 12 Months
Untreated Decay of Rural Nevada
Licensed Childcare Center Children – by
Last Dental Visit Within 12 Months
25%
18%
Yes No
Like caries experience, children with a lower frequency of sugary snacks and beverage
consumption had a lower prevalence of untreated decay (Figure 24).
Figure 24. Untreated Decay of Rural Nevada Licensed Childcare Center Children – by Sugary
Snack Frequency
Untreated Decay of Rural Nevada Licensed
Childcare Center Children – by Sugary
Snack Frequency
30%
17%
2 or Less 3 to 5
33Figure 25. Untreated Decay of Rural Nevada Licensed Childcare Center Children – by Number
of Teeth Involved
Untreated Decay of Rural Nevada Licensed
Childcare Center Children – by Number of
Teeth Involved
79.9%
12.9% 4.7% 2.2% 0.3%
0 Teeth 1-2 Teeth 3-4 Teeth 5-6 Teeth 7+ Teeth
342021 Summary – White Spots
In addition to untreated cavitated lesions, the children were screened for white spots that may
indicate initiation of a carious lesion. Standardization of screeners for identifying white spots is
more difficult than standardization for cavitated carious lesions, but we were interested in
assessing children who may have developing caries even if there are no frank cavitated lesions yet.
Screenings revealed that 27% of these rural Nevada LCC children had one or more teeth with
white spots, indicating a significant proportion of these children have teeth in the early stages of
future tooth decay, and should be targeted for preventive measures.
As expected, caries experience increases with age, increasing in prevalence by 17% between ages
3 and 5 (Figure 26), with 27% of rural Nevada 3 to 5-year-old LCC children having white spot
lesions.
Figure 26. White Spots of Rural Nevada Licensed Childcare Centers – by Age
White Spots of Rural Nevada
Licensed Childcare Centers – by Age
32% 34%
17%
3 Year Olds 4 Year Olds 5 Year Olds
White spot lesions were lowest for Nevada LCC children with private dental insurance and highest
for those with Medicaid or other public insurance (Figure 27).
Figure 27. White Spots of Rural Nevada Licensed Childcare Center Children – by Dental
Insurance
White Spots of Rural Nevada Licensed
Childcare Center Children – by Dental
Insurance
46%
25%
18%
Medicaid or Other Public Private None
Insurance
352021 Summary - Treatment Urgency
After screening was completed for each child, the screener assigned the child to one of three
treatment urgency categories. The categories were:
1. No Obvious Problem – continue with routine dental checkups
2. Needs Dental Care – needs to be seen soon (before their next regularly scheduled dental
visit)
3. Urgent Care Needed (Pain, Swelling or Infection present) - needs immediate dental care
within 24 – 48 hours
The following results summarize the overall treatment urgency for children in rural Nevada LCC:
urgent dental care needed (1%), early dental care needed (18%), and no immediate dental care
needed (20%). The Nevada Policy for Urgent Dental Issues Identified During Community
Screening9 was followed for those children identified as ‘urgent’ in this study.
Note: Information on urgency of need for dental care was missing for 14 children. Based on
information provided on the forms, it is assumed that they were not in need of care.
The only difference evident when the data was evaluated by gender was a slightly higher
percentage of females categorized as having urgent treatment needs. Treatment urgency by age is
displayed in Figure 28. There was some variation in treatment urgency by age, with a slight
decrease in five-year-old children with no treatment need.
Figure 28. Treatment Urgency Distribution of Children in Rural Nevada Licensed Childcare
Centers – By Age
Treatment Urgency Distribution of Children in Rural
Nevada Licensed Childcare Centers – By Age
25%
24%
21%
16%
11% 11%
5%
0% 1%
URGENT CARE EARLY CARE ROUTINE CARE
3 Year Olds 4 Year Olds 5 Year Olds
9
https://dpbh.nv.gov/uploadedFiles/dpbhnvgov/content/Programs/OH/dta/Boards/2018_Meetings/Policy%20for%20Urgent%20Dental%
20Issues%20Identified%20During%20Community%20Screening-Nina%20Edits.pdf
36You can also read