Full crystallographic orientation (c and a axes) of warm, coarse-grained ice in a shear-dominated setting: a case study, Storglaciären, Sweden
←
→
Page content transcription
If your browser does not render page correctly, please read the page content below
The Cryosphere, 15, 303–324, 2021
https://doi.org/10.5194/tc-15-303-2021
© Author(s) 2021. This work is distributed under
the Creative Commons Attribution 4.0 License.

Full crystallographic orientation (c and a axes) of warm,
coarse-grained ice in a shear-dominated setting: a case study,
Storglaciären, Sweden
Morgan E. Monz1 , Peter J. Hudleston1 , David J. Prior2 , Zachary Michels1 , Sheng Fan2 , Marianne Negrini2 ,
Pat J. Langhorne2 , and Chao Qi3
1 Department of Earth and Environmental Sciences, University of Minnesota, Minneapolis, MN, USA
2 Department of Geology, University of Otago, Dunedin, New Zealand
3 Key Laboratory of Earth and Planetary Physics, Chinese Academy of Sciences, Beijing, China

Correspondence: Morgan E. Monz (monzx001@umn.edu)

Received: 8 May 2020 – Discussion started: 8 June 2020
Revised: 21 November 2020 – Accepted: 2 December 2020 – Published: 22 January 2021

Abstract. Microstructures provide key insights into under-        a axes parallel to the shear plane with a maximum perpendic-
standing the mechanical behavior of ice. Crystallographic         ular to the shear direction. This pattern compares well with
preferred orientation (CPO) develops during plastic defor-        patterns produced by subsampling datasets from ice sheared
mation as ice deforms dominantly by dislocation glide on          in laboratory experiments at high homologous temperatures
the basal plane, modified and often intensified by dynamic        up to strains of ∼ 1.5. Shear strains in the margin of Stor-
recrystallization. CPO patterns in fine-grained ice have been     glaciären are much higher than those in experimental work.
relatively well characterized and understood in experiments       At much lower natural strain rates, dynamic recrystallization,
and nature, whereas CPO patterns in “warm” (T > −10 ◦ C),         particularly grain boundary migration, may have been more
coarse-grained, natural ice remain enigmatic. Previous mi-        effective so that the CPO represents a small, final fraction of
crostructural studies of coarse-grained ice have been limited     the shear history. A key result of this study is that multimax-
to c-axis orientations using light optical measurements. We       ima CPOs in coarse-grained ice reported in previous work
present the first study of a axes as well as c axes in such       may be due to limited sample sizes and a sampling bias re-
ice by application of cryo-electron backscatter diffraction       lated to the presence of island grains of a single host that
(EBSD) and do so in a shear-dominated setting. We have            appear several times in a thin section.
done this by developing a new sample preparation technique
of constructing composite sections, to allow us to use EBSD
to obtain a representative, bulk CPO on coarse-grained ice.
We draw attention to the well-known issue of interlocking         1   Introduction
grains of complex shape and suggest that a grain sampling
bias of large, branching crystals that appear multiple times      Ice sheets and glaciers play crucial roles in Earth’s climate
as island grains in thin sections may result in the typical       system, and understanding their dynamic behavior is essen-
multimaxima CPOs previously identified in warm, coarse-           tial for a variety of predictive purposes, including making
grained ice that has been subjected to prolonged shear. CPOs      projections of glacier and ice sheet discharge and sea level
combined from multiple samples of highly sheared ice from         rise (e.g., Bindschadler et al., 2013; Faria et al., 2014b; Dut-
Storglaciären provide a more comprehensive picture of the         ton et al., 2015; Golledge et al., 2015; Bamber et al., 2019).
microstructure and yield a pronounced cluster of c axes sub-      In addition, glacial ice is a monomineralic rock that deforms
normal to the shear plane and elongate or split in a plane nor-   at high homologous temperatures as ice flows, and glaciers
mal to the shear direction as well as a concomitant girdle of     represent natural tectonic systems that undergo the equiva-
                                                                  lent of regional high-grade metamorphism under known driv-

Published by Copernicus Publications on behalf of the European Geosciences Union.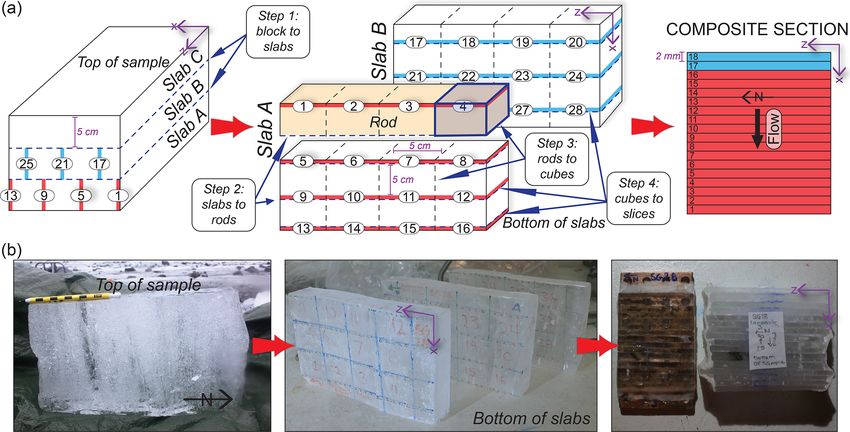
304                                       M. E. Monz et al.: Full crystallographic orientations of warm, coarse-grained ice

ing forces (Hambrey and Milnes, 1977; Van der Veen and             warm (T > −10 ◦ C) glaciers. Work on coarse-grained ice is
Whillans, 1994). Similar to rocks in active orogens, flowing       especially important because basal ice in ice sheets may ac-
glacial ice develops both structures and crystallographic fab-     commodate much more of the ice flow than the colder ice
rics or crystallographic preferred orientations (CPOs) that re-    higher up the ice column (e.g., Rignot and Mouginot, 2012;
flect the conditions and kinematics of deformation. Studying       MacGregor et al., 2016), and clearly coarse-grained ice ex-
the internal structure of glaciers on the crystal scale provides   periences large strains in valley glaciers (e.g., Kamb, 1959).
key insights into ice mechanics and aids in the understand-        Previous studies on coarse-grained ice have likely only mea-
ing of tectonic processes (Hambrey and Milnes, 1977; Hooke         sured partial CPOs, typically by optical methods (c axes
and Hudleston, 1978; Faria et al., 2014b; Wilson et al., 2014;     only), and have identified what may be apparent multimax-
Hudleston 2015).                                                   ima patterns defined by isolated clusters of c axes (Fig. 1b;
   Quantifying flow behavior of ice under natural conditions       e.g., Rigsby, 1951; Kamb, 1959; Jonsson, 1970). However,
is essential for the accurate incorporation of glacier flow        these multimaxima patterns are incompletely understood and
into climate models and for using ice as an analog for high-       defined, in part because there has been no practical method
temperature deformation of crustal and mantle rocks (Ham-          for measuring the a axes associated with such patterns. Mea-
brey, 1997; Wilson, 1981; Faria et al., 2014b; Wilson et al.,      suring the a axes means that we can tell whether two grains
2014). Glaciers move by two gravity-driven processes: (1)          (in a 2D slice) with the same c-axis orientation also have the
frictional sliding (including deformation of underlying sed-       same a axes and may be two slices through the same grain
iments) of the ice mass over the underlying rock surface           in 3D. Work on coarse-grained ice has been limited because
(e.g., Flowers, 2010, and references therein) and (2) slow,        methods used to measure CPOs are restricted to section sizes
continuous creep (flow) within the ice mass itself (e.g., Glen,    of 100 mm × 100 mm or smaller, which results in there being
1955; Alley, 1992; Budd and Jacka, 1989; Cuffey and Pa-            an insufficient number of grains needed to clearly define the
terson, 2010). Creep is governed by thermally dependent,           CPO pattern without making use of multiple sections from a
micro-scale deformation processes and therefore participates       given volume of ice (Bader, 1951; Rigsby, 1968).
in important thermo-mechanical feedbacks in the Earth’s               We aim to (1) better quantify the CPO patterns (c and
cryosphere, atmosphere and oceans. This is especially im-          a axes) associated with warm, coarse-grained ice using cryo-
portant because of the highly non-linear dependence of strain      electron backscatter diffraction (EBSD), (2) understand how
rate on stress (Glen, 1955; Budd and Jacka, 1989; Bons et al.,     and why the apparent multimaxima CPO patterns develop,
2018).                                                             and (3) interrogate the relationships among multimaxima
   Terrestrial glaciers, ice sheets and ice shelves comprise       CPO patterns and local deformation conditions in the ice.
crystals of hexagonal ice (Ih; Fig. 1a; Pauling, 1935; Faria       To address these objectives, we combine results from field-
et al., 2014b). As ice deforms plastically during flow,            work and laboratory analyses on Storglaciären, a small val-
anisotropy in the form of a CPO develops due to a dominance        ley glacier in northern Sweden, and compare the results with
of intracrystalline glide on the basal plane, and this is modi-    the results of experimental work on ice deformation. Field-
fied by recrystallization (Weertman, 1983; Duval et al., 1983;     work included detailed mapping of structural features to pro-
Faria et al., 2014b). Similarly to other crystalline materials,    vide a large-scale kinematic framework for our lab-based,
such as rocks (e.g., Wenk and Christie, 1991), CPO develop-        microstructural study. Importantly, in the lab we developed
ment modifies the internal flow strength (e.g., Steinemann,        a new sample preparation method to allow us to measure a
1958; Lile, 1978; Pimienta and Duval, 1987; Alley, 1988,           representative volume and the number of grains necessary
1992; Azuma and Azuma, 1996; Gagliardini, 2009), and               for robust CPO characterization in coarse-grained ice using
thus documenting natural ice CPOs provides insight into the        cryo-EBSD.
large-scale flow rates of glaciers and ice sheets (e.g., Azuma,
1995; Azuma and Azuma, 1996; Faria et al., 2014b; Montag-
nat et al., 2014; Llorens et al., 2016a; Vaughan et al., 2017).    2   Previous work
The CPO of ice is commonly represented by the preferred
orientation of c axes. This is useful because the c axis of an     Much of the preexisting research on CPO development in
ice crystal is normal to the basal plane (Fig. 1a), and glide on   natural ice has been done on ice cores from Antarctica and
this plane dominates deformation (Duval et al., 1983). How-        Greenland, and this has been nicely summarized by Faria et
ever, the orientations of a axes are needed to fully character-    al. (2014a). Schytt (1958) produced the first microstructural
ize the orientation of ice crystals and to better understand       study of deep polar ice from the ice core extracted from the
deformation mechanisms, since slip in the basal plane is           Norwegian–British–Swedish Antarctic Expedition of 1949–
not necessarily isotropic (Kamb, 1961), as has been demon-         1952. Many studies of ice cores have been subsequently un-
strated in recent shear experiments that result in the align-      dertaken, in both Antarctica (Gow and Williamson, 1976;
ment of the a axes (Qi et al., 2019; Journaux et al., 2019).       Lipenkov et al., 1989; EPICA community members, 2004;
   Coarse-grained (highly variable but typically > 20 mm;          Seddik et al., 2008; Durand et al., 2009; Weikusat et al.,
see Fig. 2) ice is common at the base of ice sheets and in         2009b, 2017; Azuma et al., 1999, 2000) and Greenland (Her-

The Cryosphere, 15, 303–324, 2021                                                      https://doi.org/10.5194/tc-15-303-2021
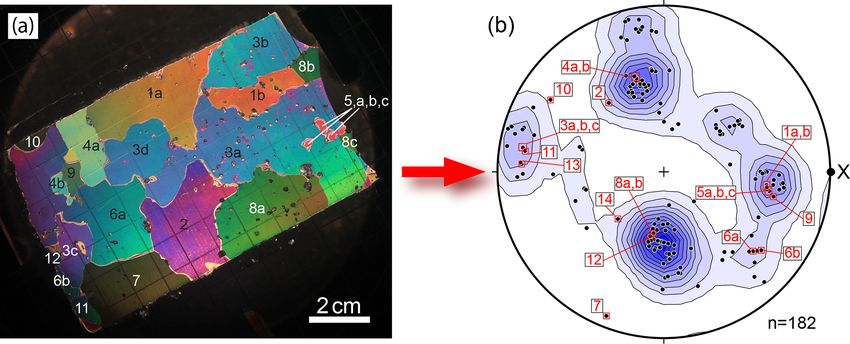
M. E. Monz et al.: Full crystallographic orientations of warm, coarse-grained ice                                                           305

Figure 1. Schematic image showing (a) an ice crystal and its defining c and a axes and (b) a multimaxima fabric pattern identified in warm,
coarse-grained glacial ice. The x, y and z axes define the symmetry, but the kinematics are debated. (c) A small circle girdle or cone shape
under uniaxial compression and (d) a strong single maximum fabric plus or minus a weaker second maximum in simple shear. Panels (c)
and (d) are from experiments, and (c) (arguably) and (d) are also from nature, and the axes x, y and z define the kinematic reference frame.
CPO plots here and in subsequent figures are all equal-area, lower-hemisphere projections. In (b) and (d), z is normal to the foliation and x
is parallel to the shear direction. There is no shear plane implied in (c).

Figure 2. (a) A thin section under cross-polarized light from sample SG6-B collected in 2016. Grains are labeled based on their c-axis
orientations, measured using a universal Rigsby stage. Grains with the same orientation were tentatively marked as the same grain as indicated
by lettering. Color gradients across some larger grains are a result of inconsistent thin-section thickness; (b) Associated c-axis plot compiled
from eight thin sections from the sample SG6-B. This plot contains orientations of all grains measured and is contoured using the Kamb
method (Kamb, 1959). When possible duplicates within the same section are removed; the pattern maintains its multimaxima nature but is
weaker (not shown). Numbered data points correspond to numbered grains in (a). In order to obtain 100 individual crystal measurements,
5–15 thin sections had to be made for each sample, depending on the overall grain size in the individual sample. The projection is plotted
such that the pole to foliation is vertical and x is the flow direction. The data in this figure are not included in the combined Fig. 8 because,
after U-stage work, there was not enough of this sample to use for EBSD, and thus there are no a-axis data available.

ron and Langway, 1982; Herron et al., 1985; Langway et                     Piazolo et al., 2013; Montagnat et al., 2015; Vaughan et al.,
al., 1988; Thorsteinsson, 1997; Gow et al., 1997; Wang et                  2017; Qi et al., 2017). Whether this CPO occurs in nature is
al., 2002; Svensson et al., 2003b; Montagnat et al., 2014).                less clear. Possible examples are described at the center of
Studying microstructures in ice sheets offers the advantages               ice domes, where they would be expected (e.g., Hooke and
of examining an extensive record of ice deforming under rel-               Hudleston, 1981; Lile et al., 1984; Gow and Meese, 2007).
atively simple kinematic conditions. As a result, CPOs in ice              There are certainly fabrics close to open cones (sometimes
caps have been well defined and interpreted from ice cores,                referred to as small circle girdles) in the upper parts of many
except perhaps at the base of ice sheets.                                  polar ice cores (e.g., Ross ice shelf – Gow and Williamson,
   There are two typical end-member c-axis CPO patterns                    1976; Byrd Station – Gow and Williamson, 1976; Camp Cen-
that have been identified in experimental work, and these                  tury – Herron and Langway, 1982; Cape Folger – Thwaites
are useful in interpreting natural CPOs. At warm tempera-                  et al., 1984; Dye 3 – Herron et al., 1985; Siple Dome –
tures and lower strain rates, under uniaxial compression, the              DiPrinzio et al., 2005; Siple Dome – Gow and Meese, 2007;
c axes define an open cone shape or small circle girdle at 30–             NEEM – Montagnat et al., 2014). Additionally, some CPOs
60◦ about the axis of compression on a CPO plot (Fig. 1c;                  in coarse-grained ice at the base of ice sheets have been iden-
e.g., Jacka and Maccagnan, 1984; Alley, 1988; Budd and                     tified as possible open cones or modifications of open cones
Jacka, 1989; Jacka and Jun, 2000; Treverrow et al., 2012;                  (e.g., Byrd Station – Gow and Williamson, 1976; Tison et

https://doi.org/10.5194/tc-15-303-2021                                                                The Cryosphere, 15, 303–324, 2021
306                                        M. E. Monz et al.: Full crystallographic orientations of warm, coarse-grained ice

al., 1994; GRIP – Thorsteinsson et al., 1997; GISP2 – Gow              Previous studies of coarse-grained ice in valley glaciers
et al., 1997; Siple Dome – DiPrinzio et al., 2005; Siple Dome       done by Rigsby (1951) on Emmons Glacier, Kamb (1959)
– Gow and Meese, 2007), even though these types of fabrics          on Blue Glacier and Jonsson (1970) on Isfallsglaciären used
typically show clustering that is interpreted as a multimax-        light optical measurements to delineate a CPO characterized
ima CPO. It is important to note, however, that the eigenvalue      by a multimaxima pattern of the type described above but
technique of fabric representation, often used with more re-        were limited to measuring c-axis orientations. Such studies
cent analyses, does not distinguish between small circle gir-       used a Rigsby universal stage to individually orient c axes
dles and multimaxima fabrics (Fitzpatrick et al., 2014) and is      (Langway, 1958), and they demonstrated a relationship of
inappropriate for multimaxima fabrics.                              the overall c-axis CPO to other structural elements, with the
   Under simple shear conditions, the basal planes of ice           pole to foliation typically located centrally among the max-
crystals dominantly align with the shear plane, and the c axes      ima (Kamb, 1959; Jonsson, 1970).
form an asymmetric bimodal distribution with both a strong             Possible analogs to the multimaxima CPOs found in na-
maximum perpendicular to the shear plane and a weaker sec-          ture have been produced in experiments by Steinemann
ondary cluster offset at an angle antithetic to the rotation as-    (1958) and Duval (1981), in both cases at temperatures near
sociated with the shear direction (Fig. 1c). The angle between      the melting point and under torsion–compression conditions.
the two clusters varies with shear strain, and the weaker           The maxima developed at high angles to the shear plane. It
cluster ultimately disappears with increasing strain leaving        should be noted, however, that the grain size in the experi-
a strong single maximum pattern normal to the shear plane           ments is much smaller than in natural ice with these CPOs.
(Fig. 1d; e.g., Duval, 1981; Bouchez and Duval, 1982; Budd             Ice with the multimaxima CPO in valley glaciers (Rigsby,
and Jacka, 1989; Budd et al., 2013; Qi et al., 2019; Journaux       1951; Meier et al., 1954; Kamb, 1959; Higashi, 1967; Jons-
et al., 2019). This dual-maxima pattern of CPO development          son, 1970; Fabre, 1973; Vallon et al., 1976; Tison and Hub-
under simple shear has been described in nature (Hudleston,         bard, 2000; Hellmann et al., in review) and deep in ice sheets
1977a; Jackson and Kamb, 1997). It is probable that the             (Gow and Williamson, 1976; Matsuda and Wakahama, 1978;
strong single vertical maxima seen in many ice cores from           Russell-Head and Budd, 1979; Gow et al., 1997; Diprinzio
Antarctica and Greenland are associated with zones of sub-          et al., 2005; Gow and Meese, 2007; Montagnat, 2014; Fitz-
horizontal simple shear (e.g., Gow and Williamson, 1976;            patrick et al., 2017; Li et al., 2017) consists of large, branched
Azuma and Higashi, 1985; Paterson, 1991; Alley, 1992; Ti-           crystals that lack undulose extinction and have irregular, lo-
son et al., 1994; Thorsteinsson et al., 1997; Faria et al.,         bate grain boundaries (Figs. 2a and 3). Individual grains are
2014a; Montagnat et al., 2014). However, there are almost           so large that even with the maximum-size thin section (us-
no new data for the evolution of the CPO of natural ice in          ing any method of analysis), the exact shape and extent of
shear zones, because there is very little close control of strain   individual grains remain unknown. Additionally, the branch-
gradients in natural ice. Nearly all the published data come        ing nature of these crystals may result in sectioning artifacts
from laboratory experiments. As far as we are aware there is        that lead to apparent “island grains” – branches of the same
still only one study of fabrics in natural ice constrained to be    grain appearing multiple times throughout one 2D thin sec-
from a well-defined shear zone (Hudleston, 1977).                   tion (Fig. 3; e.g., as illustrated in glacial ice by Bader (1951)
   An enigmatic CPO pattern can develop in valley glaciers          and Rigsby (1968), in sea ice by Dempsey and Langhorne
and deep in ice sheets in coarser-grained ice that has un-          (2012), and in quartz by Stipp et al. (2010)). Without a com-
dergone significant recrystallization. This pattern is always       plete crystal orientation – one that includes ice a axes – it
associated with warmer (T > −10 ◦ C) conditions and an in-          is difficult to confirm the existence of such island grains
crease in grain size and is characterized by three–four max-        and determine their effect on the characterization of a rep-
ima (sometimes with sub-maxima), arranged around an axis            resentative CPO. Early work tried to address the problem
that is vertical in ice sheets (Gow and Williamson, 1976;           of sample size by making multiple sections from different
Thwaites et al., 1984; Goossens et al., 2016) and perpendic-        parts of a sample or core, spacing thin sections between 5
ular to foliation in valley glaciers (Figs. 1b and 2; Kamb,         and 15 cm intervals, (Rigsby, 1951; Gow and Williamson,
1959; Allen, 1960; Budd, 1972; Jonsson, 1970). In most              1976; Thwaites et al., 1984) or taking them from more than
cases, given the coarse grain size (Fig. 2a), the number of         one sample (Kamb, 1959). Nonetheless, there remains the
grains measured per thin section is small, usually no more          uncertainty about whether the maxima are truly distinct or
than ∼ 100. This may or may not be enough to reveal a me-           reflect repeated measurements of individual grains. It might
chanically significant CPO pattern (Fig. 2b; Rigsby, 1960).         be noted that in recent work little or no explicit attention is
By contrast, CPO plots produced for fine-grained ice and            given to the problem of sample size in coarse-grained ice (see
other deformed crystalline materials typically include data         Dahl-Jensen et al., 2013; Montagnat et al., 2014; Fitzpatrick
from several hundred unique grains or crystals, which can           et al., 2014; Li et al., 2017) and to the significance of possi-
usually be collected from a single sample section. This would       ble island grains on fabric (see Diprinzio et al., 2005; Gow
be difficult or impossible to accomplish with coarse-grained        and Meese, 2007; Dahl-Jensen et al., 2013; Montagnat et al.,
ice.                                                                2014; Fitzpatrick et al., 2014; Li et al., 2017). This problem

The Cryosphere, 15, 303–324, 2021                                                        https://doi.org/10.5194/tc-15-303-2021
M. E. Monz et al.: Full crystallographic orientations of warm, coarse-grained ice                                               307

may not have been highlighted, as CPO in coarse-grained ice          Optical studies using the Rigsby stage, such as those illus-
was not the sole focus of these ice core studies.                    trated in Fig. 2, which accommodates 100 mm×100 mm thin
   A number of interpretations have been proposed for the            sections, are time-consuming, especially when many sec-
multimaxima CPOs, though it is clear that there is no sin-           tions must be made for one sample and are limited not only
gle explanation that can be applied to all cases. Earlier stud-      by incomplete crystal orientations but also by data resolu-
ies made efforts to quantify an angular relationship between         tion. Automatic ice texture analyzers (AITAs), which can
clusters of c axes, but no consistent relationship could be          also accommodate larger grain sizes, use an image-analysis
found, and a mechanism that produces such a pattern – with           technique under cross-polarized light to determine c axes
regular angular relationships or otherwise – has not been            (Russell-Head and Wilson, 2001; Wilen et al., 2003). AITA
established. For one thing, the number, shape and relative           analyses are attractive for their speed and data resolution but
intensity of the maxima that define the CPO are variable             are also limited by incomplete crystal orientations (Russell-
(e.g., Rigsby, 1951, 1960; Kizaki, 1969; Jonsson, 1970), even        Head and Wilson, 2001). For both the Rigsby stage and AITA
though the “ideal” shape is classified as rhomboid or dia-           methods, it is not possible to relate two grains with the same
mond (Rigsby, 1951, 1960). It has been proposed that the             c-axis orientation in two dimensions to the same parent grain,
multimaxima pattern may be the result of mechanical twin-            unless traced through an undetermined number of successive
ning (Matsuda and Wakahama, 1978), although the texture in           thin sections. This is near impossible for all grains since the
thin sections gives little indication of this. (It should be noted   exact size and shape of the crystals remains undefined.
that twinning can only be investigated if both a and c axes are         Three methods – etching (Matsuda, 1979; Matsuda
known.) It is often assumed that CPOs are related to the state       and Wakahama, 1978), semi-automated Laue diffraction
of stress and that the maxima reflect the basal-plane align-         (Miyamoto et al., 2011; Weikusat et al., 2011) and EBSD
ment with orientations of high shear stress (Duval, 1981). If        (Dingley, 1984; Prior et al., 1999) – enable the measure-
this were the case, there should be no distinction between           ment of full crystallographic orientations in ice (Obbard et
CPOs formed in coaxial and non-coaxial kinematics, there             al., 2006; Obbard and Baker, 2007; Weikusat et al., 2017;
should be just two maxima, and there should be a consistent          Kim et al., 2020). Etching is time-intensive, and the results
relationship between fabric elements and the principal stress        are of low angular resolution. The other two methods pro-
directions. However, in pure shear, found in the center of the       duce results of high angular resolution. Laue X-ray diffrac-
ablation zone near the surface of valley glaciers, where ice         tion has been applied as a spot-based method, while EBSD
undergoes longitudinal compression, the maximum principal            provides the orientation of every pixel measured.
stress is horizontal and the multimaxima pattern is centered            Cryo-EBSD as a technique was first applied to ice in 2004
about the axis of compression (Hellmann et al., in review),          (Iliescu et al., 2004), and modern cryo-EBSD methods en-
which in the case of Blue Glacier is also the pole to folia-         able routine work on water ice (Prior et al., 2015). CPOs
tion (Kamb, 1972, Fig. 17b). By contrast, in simple shear,           derived from EBSD datasets include a-axis orientations and
assumed to hold near glacier margins, the maximum princi-            provide a comprehensive view of ice microstructure that can
pal stress is inclined at 45◦ to the foliation (shear plane) and     improve our knowledge of the CPO and its relation to ice
the maxima are arranged about the normal to the foliation            flow mechanisms on the grain scale. In addition, the speed,
(Kamb, 1959) and not centered about the maximum princi-              angular precision and spatial resolution attainable with mod-
pal stress direction.                                                ern EBSD systems offer major advantages over optical meth-
   A number of previous studies have proposed that recrys-           ods. However, until now, EBSD has not been applied to
tallization dominated by grain boundary migration results in         warm, coarse-grained ice because a sample of the maximum
the multimaxima CPOs (Rigsby, 1955; Gow and Williamson,              size for analysis (60 mm × 40 mm; Prior et al., 2015; Wong-
1976; Gow et al., 1997; Duval, 2000; Diprinzio et al., 2005;         pan et al., 2018) will only contain a few grains. The proce-
Gow and Meese, 2007; Montagnat et al., 2014). While dy-              dure we apply in this paper addresses this limitation.
namic recrystallization likely plays an important role, these
studies do not provide an interpretation as to why recrys-
tallization results in the geometrically spaced clustering of        3   Glaciological setting
c axes rather than in the well-understood patterns found in
fine-grained ice. Some authors suggest the multimaxima pat-          Storglaciären is a small polythermal valley glacier located in
tern illustrates the transition between small circle girdles         the Tarfala Valley in northern Sweden (Fig. 4). The glacier
and single maximum CPOs (e.g., Rigsby 1955; Gow and                  is 3.2 km long, extending in an E–W direction, with a total
Williamson, 1976; Gow and Meese, 2007; Fitzpatrick et al.,           surface area of 3.1 km2 . A cold surface layer (annual mean
2017) but again do not provide a reason for why this would           of −4.0 ◦ C) (Hooke et al., 1983a; Holmlund and Eriksson,
result in several distinct maxima.                                   1989; Pettersson et al., 2007) of variable thickness (20–60 m)
   We argue that previously employed methods have most               (Holmlund and Eriksson, 1989; Holmlund et al., 1996; Pet-
probably not been able to clearly determine a representative         tersson et al., 2003) and a cold-based margin and terminus
CPO for glacial ice consisting of coarse, branching crystals.        (annual mean of −4.0 ◦ C) (Holmlund et al., 1996; Petters-

https://doi.org/10.5194/tc-15-303-2021                                                       The Cryosphere, 15, 303–324, 2021
308                                         M. E. Monz et al.: Full crystallographic orientations of warm, coarse-grained ice

Figure 3. (a) Schematic branching crystal and associated (b) thin section highlighting the notion of island grains that appear when viewing
a two-dimensional plane. Numbered branches in three dimensions correspond to the numbered island grains in two dimensions. Part of the
grain in (a) lies above the section and part below.

son, 2007) characterize the ablation zone (Holmlund et al.,             4     Methods
1996b). The thermal regime influences glacier dynamics; the
center of the glacier undergoes basal sliding, but the mar-             4.1    Fieldwork
gins and terminus are frozen to the underlying and marginal
rock (Holmlund et al., 1996), causing most of the deforma-              Detailed mapping in 2016 and 2018 on the surface of the
tion in these areas to be a result of creep (Pettersson et al.,         glacier provides the structural framework for this study.
2007). Storglaciären was chosen because (1) a compilation               Data collection was focused on multiple transects across
of preexisting information on surface velocities and seasonal           the glacier in the ablation zone. Relevant data, presented in
changes gathered over many years exists to provide back-                Fig. 4, highlight the relationship of the structures to one an-
ground for the study, (2) the multimaxima pattern has been              other and the known kinematics.
observed optically in strongly sheared marginal and basal ice              We collected samples from eight areas of intense defor-
(Fig. 2), and (3) it is comparatively easy to access.                   mation in the ablation zone during the 2018 field season.
   Primary stratification is easily identified above the equilib-       For the purposes of this paper, we are focusing on three
rium line on the glacier as gently undulating layers roughly            samples from the intensely sheared southern margin (SG23,
parallel to the ice surface. The ice in Storglaciären under-            SG27 and SG28) (Fig. 4) because they are from a small area
goes horizontal compression and shortening as it enters the             with well-defined kinematics. The other samples collected in
valley from the accumulation cirques, and this amplifies the            2018 were spread out across the glacier in various and more
slight undulations in primary stratification, causing upright,          complex local settings and were not clustered in such a way
similar folds (Ramsay, 1967) near the margins of the val-               that data could be combined for a strong interpretation, and
ley (walls) where shearing, which combines with shorten-                thus they do not contribute to the arguments we present here.
ing, is most intense. Folds range from a centimeter to me-              We excavated 100–200 mm of surficial ice before sampling
ter amplitude and generally have axial surfaces that are ver-           to avoid a layer of solar-damaged, recrystallized ice. Dam-
tical near the margins and contain the flow direction. They             aged ice was broken up using an ice axe and removed with
are associated with an axial planar foliation and have hinges           a shovel. Blocks of ice were removed from the glacier using
that plunge gently west, away from the flow direction. Folia-           a small chainsaw. Each sample was ∼ 150 × 150 × 300 mm,
tion develops from preexisting stratification, veins and frac-          oriented such that the top of the block was parallel to the
ture traces where shear is most intense (e.g., Hambrey, 1975;           glacier surface and the long axis was N–S, perpendicular to
Roberson, 2008; Jennings et al., 2014) and is defined by vari-          the flow direction. The shear plane, used to define the kine-
ations in crystal size, shape, and bubble concentration and             matic reference frame for subsequent microstructural analy-
distribution (e.g., Allen et al., 1960; Hambrey, 1975; Ham-             ses, is assumed to be parallel to the foliation. Samples were
brey and Milnes, 1977; Hooke and Hudleston, 1978). Folia-               immediately shaded with a tarp upon removal to avoid solar
tion tends to become perpendicular to the maximum shorten-              damage and then labeled and insulated with ice and jackets
ing direction and thus rotates with progressive shear towards           to be transported off the glacier. We trimmed samples with
parallelism with the flow direction along the glacier margins           a band saw in a cold room at the University of Stockholm,
(Fig. 4; Ragan, 1969), reflecting cumulative strain (Hambrey            Sweden, and marked the top north edge with a notch. We
and Milnes, 1977; Hooke and Hudleston, 1978; Hambrey et                 transported these samples to the University of Otago, New
al., 1980; Hudleston, 2015).                                            Zealand, in doubly insulated Coleman Xtreme 48 L wheeled
                                                                        coolers, each of which can only contain four samples, to
                                                                        be stored in a biohazard freezer set to −31 ◦ C. Samples re-
                                                                        mained below −20 ◦ C for the entire transport pathway.

The Cryosphere, 15, 303–324, 2021                                                             https://doi.org/10.5194/tc-15-303-2021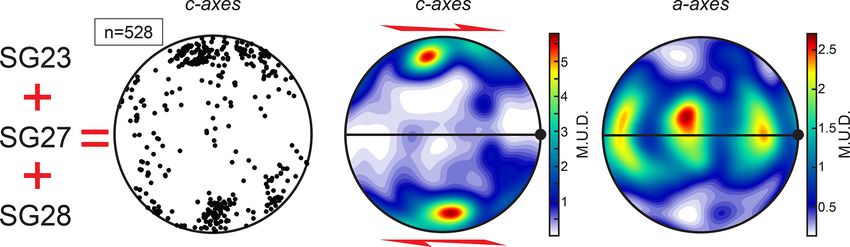
M. E. Monz et al.: Full crystallographic orientations of warm, coarse-grained ice                                                     309

Figure 4. Simplified map of Storglaciären highlighting the traces of structural elements and orientations of foliation and bedding for the
north margin, south margin and center of the glacier in the ablation zone. Locations of samples SG6-B, SG23, SG27 and SG28 are labeled.
The orientation diagrams of planar fabric elements (stratification and foliation) are in geographic coordinates. The sample reference frame
for the remainder of the paper is represented, where x is the flow or shear direction, y is the vorticity axis, and z is north.

4.2   Sample preparation                                                wet paper towels around the compiled stack to adhere the
                                                                        slices into a coherent block, ∼ 36 × 50 × 50 mm. We then cut
We prepared samples for EBSD mapping and microstructural                these blocks in half to generate a flat composite surface, la-
analysis in a cold room (−20 ◦ C) at the University of Otago.           beled each half and returned one to storage for future use.
To do this, we developed a novel composite sample prepara-              We mounted sections on 40 × 60 mm copper and aluminum
tion method to maximize the number of grains collected and              ingots in the cold room using the freeze-on technique out-
minimize the number of repeated grains, in order to obtain              lined by Craw et al. (2018) and, to ensure secureness, used
a representative CPO. We made at least two composite sec-               thin slices of wet paper towels around the edges in contact
tions for imaging from each of the eight samples, totaling 18           with the ingot. The exposed surface was then flattened and
composite sections. We emphasize that we are not the first to           polished using progressively finer sandpaper and then cooled
combine orientation data from multiple oriented sections to             slowly to ∼ −90 ◦ C before being inserted into the SEM.
overcome the problem of sampling when dealing with very                    We note that there are associated errors of misorientation
large grain sizes (e.g., Rigsby, 1951; Kamb, 1959; Gow and              with each step. We consider the process in several stages.
Williamson, 1976; Thwaites et al., 1984). Our method pro-               Each sample is first squared into a rectangular prism, with
vides a way of dealing with the specific technical challenges           one side vertical and another parallel to foliation, using
of using EBSD for coarse-grained ice since the time and re-             guides to ensure perpendicularity. Guides are then used for
source limitation for EBSD is time on the instrument, and               each of steps 1–4 (Fig. 5), cutting the sample progressively
with fast EBSD speeds, the sample exchange rather than the              into slabs, rods, cubes and slices. The errors involved in each
analysis time becomes the limit. Making composite sections              stage of this process are estimated to be less than 0.5◦ . The
enables us to collect data equivalent to 10–20 full sample sec-         error involved in slight twisting between slices during assem-
tions with only one exchange of samples, taking a half day of           bly into a composite section is estimated to be no more than
scanning-electron-microscope (SEM) time rather than what                1◦ . Combining data from two or three composite sections in a
would otherwise be 2 weeks.                                             sample adds only possible errors of misalignment in mount-
   The sample preparation procedure is highlighted in Fig. 5.           ing for EBSD measurement. This is estimated to be no more
We initially cut each sample block into three 50 mm thick               than 0.5◦ . These sum to give possible errors of misorienta-
slabs perpendicular to the foliation. We then divided each              tion of the slices making up the composites and thus of the
slab into rods, spaced by 50 mm, perpendicular to the flow              pole figures derived from them of 3–4◦ .
direction and to the foliation. These rods were cut such that              Whole sections of certain areas of the original blocks were
they were staggered between sequential slabs, and a series              prepared for examination, to mitigate loss of information on
of ∼ 2 mm thick slices were cut off of the bottom or top of             internal structure due to the small slices for the compos-
each rod (it was easiest to divide each rod into equally spaced         ite sections. Slabs cut perpendicularly to foliation (first step
cubes before cutting slices due to the delicacy of individual           in composite preparation) were polished using progressively
slices). Each slice was labeled, oriented and stacked sequen-           finer sandpaper, allowed to sublimate overnight and then il-
tially between two wooden blocks within a clamp to hold                 luminated using low-angle light, which revealed grains in-
loose slices together before being cemented. We wrapped                 tersecting the surface. Areas of interest in these slabs were

https://doi.org/10.5194/tc-15-303-2021                                                           The Cryosphere, 15, 303–324, 2021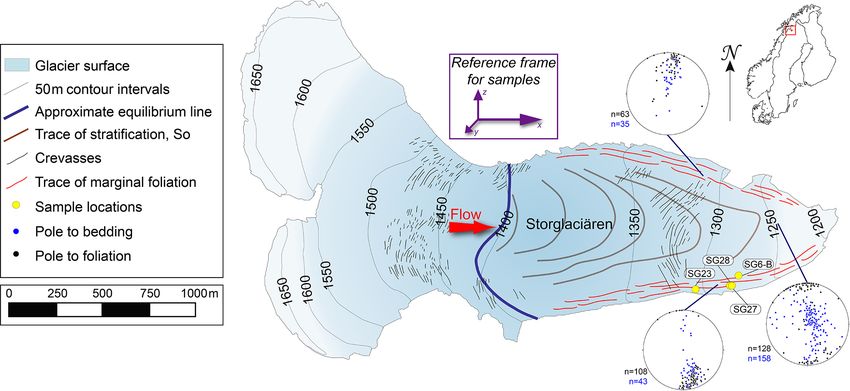
310                                         M. E. Monz et al.: Full crystallographic orientations of warm, coarse-grained ice

Figure 5. (a) Schematic sample preparation for one composite section. Steps for each cut to progress from sample to slice are specified with
dashed lines, and examples of each are highlighted with dark-blue arrows. Individual 2 mm slices are shown throughout the process on slab
A and slab B, and the numbers correspond to the unique slice in the final composite stack. At least 36 slices were cut from every sample
(using slabs A, B and C) to construct composite sections. At least two composites for each sample comprised the final dataset (one composite
comprised of slices 1–18 is shown in this figure). (b) Sample preparation illustrated using SG28 from block sample to composite section.
Note that the number sequences varied from sample to sample, so the numbers on the slabs do not match the schematic in (a). Composites
are oriented in a kinematic reference frame such that x is the flow or shear direction, y is the vorticity axis, and z is north.

targeted for whole section analysis. At least two whole sec-            4.3    Orientation data collection
tions were taken from each sample.
   It is important to note that the copper and aluminum ingots          A Zeiss Sigma variable-pressure field-emission-gun SEM fit-
on which the samples were mounted were up to 40 × 60 mm                 ted with a Nordlys EBSD camera from Oxford Instruments
because that is the maximum size the SEM can analyze with-              was used for cryo-EBSD analyses. The instrument is fitted
out significant risk of sample crashes (Prior et al., 2015,             with a custom-built cryo-stage that is continuously cooled
show a larger sample, but 40 mm × 60 mm is now the stan-                by liquid nitrogen from an external dewar via a copper braid
dard max size). This size pushes the limits of the instrument,          connection (Prior et al., 2015). The stage is cooled to be-
and therefore we aimed to make sections that were not quite             low −100 ◦ C prior to sample insertion. During the transfer
60 mm wide. We experimented with the width of the com-                  process, the sample did not exceed −80 ◦ C. Once the stage
posite slices, initially starting with 5 mm (see Fig. 7, SG23           cooled back down to −100 ◦ C, we vented the SEM chamber,
composite 2 EBSD image – this was the first composite con-              allowing the stage temperature to rise to −75 ◦ C, inducing a
structed), and determined that in order to maximize the num-            sublimation cycle outlined by Prior et al. (2015) to remove
ber of grains, we needed to use more slices that were thinner.          any residual frost from the sample surface before imaging.
We ultimately aimed for 36 spaced slices per sample – 18 per               We collected full cross-sectional-orientation maps of
composite – that were each approximately 2 mm wide. This                whole sections (e.g., Fig. 6a and b) and composite sections
allowed extra room, which was important because different               (e.g., Fig. 7a) at a 50 µm step size in order to balance data
bubble concentrations throughout the sample made certain                resolution with such a coarse grain size. SEM settings for
areas more fragile than others. Slices in areas with a high             cryo-EBSD acquisition were a stage temperature ≈ −90 ◦ C,
bubble concentration needed to be a bit wider (2.5–4 mm).               a chamber pressure of 3–5 Pa, an accelerating voltage of
Ultimately, most of the composite sections were between                 30 kV, a beam current ≈ 60–70 nA and a sample tilt of 70◦ .
36 mm and 50 mm wide. Thus it was practical considerations              Each large section takes > 1 h to analyze at this coarse step
that limited the width of the sections we produced. Addition-           size; additional time to analyze any areas of interest in finer
ally, for whole sections, we were interested in examining the           detail; and another hour to do a sample exchange, run the
internal structure of the largest grains, which included sub-           sublimation cycle to clean frost off the sample for imaging,
grain boundaries, and also the misorientations between grain            bring the stage down to the correct temperature and set up
boundaries. Many of the sections measured were mounted                  another analysis. When all goes smoothly, only three–four
on the larger ingots (40 mm × 60 mm), but due to the lim-               sections can be analyzed per day.
ited number of these, some were mounted on smaller ingots                  EBSD data were collected using Aztec Software from
(30 mm × 30 mm). All produced similar analytical results.               Oxford Instruments and exported into Oxford HKL Chan-
                                                                        nel 5. We used EBSDinterp 1.0, a graphic-user-interface-

The Cryosphere, 15, 303–324, 2021                                                              https://doi.org/10.5194/tc-15-303-2021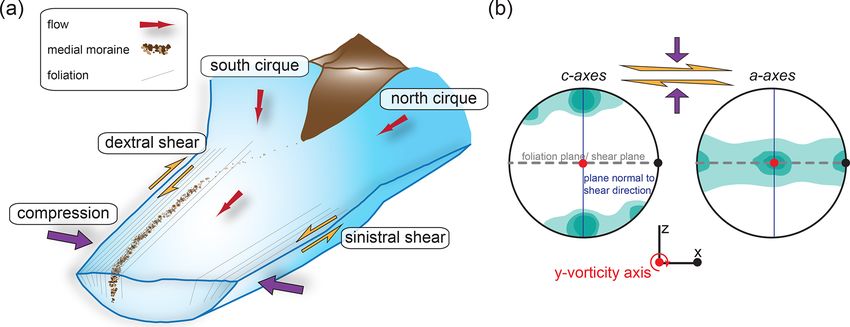
M. E. Monz et al.: Full crystallographic orientations of warm, coarse-grained ice 311
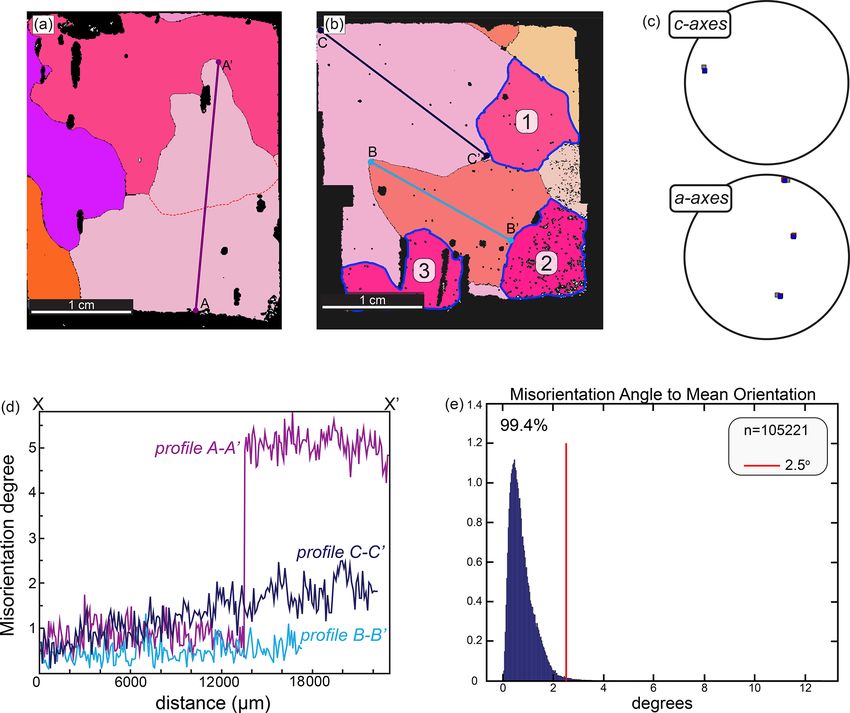
Figure 6. A typical whole section EBSD analysis with (a, b) maps of whole sections from SG28. (a) Subgrain boundary is shown with a
dashed red line, and profile A–A0 crosses that boundary, (b) highlighting three potential island grains within the section and profile lines
B–B0 and C–C0 across two grains; (c) one-point-per-grain c and a axes of the highlighted grains 1, 2 and 3 in (b). (d) Misorientation profiles
relative to the first pixel along A–A0 , B–B0 and C–C0 ; (e) misorientation angle of each pixel on EBSD map (b) with respect to the mean
orientation of the grain. The red line highlights that 99.4 % of the misorientations between pixels lie below 2.5◦ .
based MATLAB® program developed by Pearce (2015) to 5 Results
reduce noise and interpolate non-indexed EBSD data points
using band contrast variations. Noise-reduced data were 5.1 Fieldwork
then processed using MTEX, a texture analysis toolbox for
MATLAB® (Bachmann et al., 2010), to determine full crys- Orientation measurements of bedding and foliation are con-
tallographic orientations, intergranular misorientations and sistent with previous observations on Storglaciären and other
grain boundaries and to calculate one-point-per-grain CPO valley glaciers. Bedding is difficult to distinguish from foli-
plots (Mainprice et al., 2015). The overall CPO in our sam- ation at the margins of Storglaciären but is more obviously
ples is best represented using one-point-per-grain plots rather recognizable in the center of the glacier. Although locally
than all-pixel orientation plots due to the area bias introduced variable due to folding, in the center of the ablation zone,
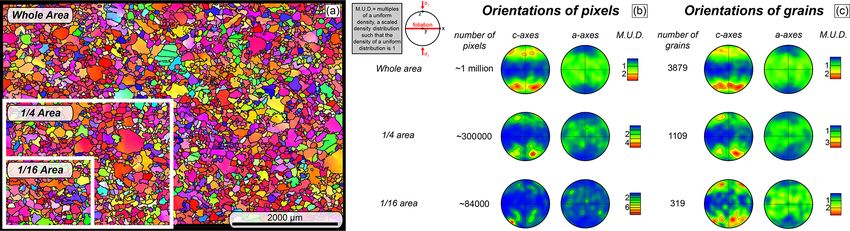
by larger grains in a small sample size. We note that repre- bedding generally dips shallowly west. Along the margins,
senting the data using all-pixel orientations does take into the foliation is subvertical, dipping steeply inwards towards
account the issue of parent grains with satellite island grains, the center of the glacier (Fig. 4). In the center towards the
but this is only if the sample is large enough to contain a suffi- front of the glacier, the foliation becomes progressively shal-
cient number of grains to provide a truly representative CPO lower and dips shallowly up the glacier where sheared basal
(Appendix A). If the sample does not contain a representative ice is closer to the surface (Fig. 4). The combination of
number of grains, as is often the case with coarse-grained ice, transformed stratification and foliation in the ablation zone
then using one point per grain provides a more representative forms a series of arcs on the surface reflecting in three di-
CPO (Fig. A1). The kinematic reference frame used for plot- mensions an overall nested-spoon arrangement, opening up-
ting CPO is shown in Fig. 4. glacier, much in the same way as described by Kamb (1959)
for Blue Glacier.
https://doi.org/10.5194/tc-15-303-2021 The Cryosphere, 15, 303–324, 2021
312 M. E. Monz et al.: Full crystallographic orientations of warm, coarse-grained ice
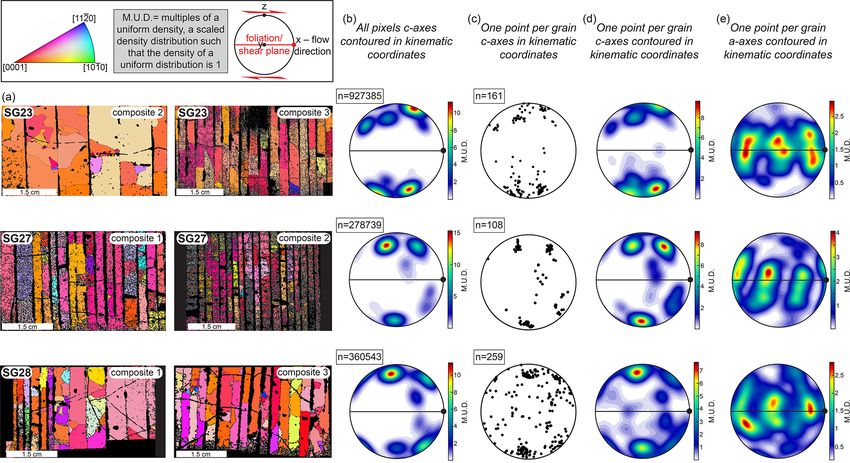
Figure 7. EBSD maps and associated CPOs for composite sections from samples SG23, SG27 and SG28. Data from each pair of composites
are combined to give the bulk CPO for each sample. (a) EBSD images of the two composite sections, where the vertical black lines represent
junctions between individual slices of the composite. (b) Contoured plots of c-axis orientations of all pixels; (c) uncontoured plots of c-axis
orientations representing one point per grain; (d) contoured plots of c-axis orientations representing one point per grain; and (e) contoured
a-axis orientations representing one point per grain. All plots are in a kinematic reference frame where x is the shear flow or shear direction
(black dot), y is the vorticity axis, and z is north.
5.2 Microstructure because the data resolution was high (not many misindexed
points or holes in the data or cracks in the section) in compar-
Grains are locally variable in size, ranging from 1 to > ison with those from the larger ingots. These sections high-
90 mm. They have no apparent consistent shape preferred light all the features we discuss.
orientation (SPO). Air bubbles exist as a secondary phase Misorientation profiles A–A0 (Fig. 6a) and B–B0 (Fig. 6b)
and are found both within grains and on grain boundaries show that the orientation gradient across individual grains
(Figs. 2a and 6a and b). Broadly, there is an inverse corre- is low. The pixel-to-pixel scatter, mostly less than ±0.5◦ , is
lation between bubble concentration and grain size and also typical of the angular error for fast EBSD acquisition (Prior
between bubble concentration and grain boundary smooth- et al., 1999). Profile A–A0 shows an abrupt change of about
ness. 4◦ across a subgrain boundary and no distortion within the
grain or subgrain. In nine whole sections analyzed for this
5.2.1 Whole section study, ∼ 15 % of grains contain subgrain boundaries, with
misorientations ranging between 2.5 and 5.5◦ (e.g., Fig. 6a).
The size of an individual whole section is determined by Profile B–B0 shows a grain that has no internal distortion,
the technique used for the analysis. For U-stage work it is and profile C–C0 shows an orientation change of about 2.5◦
100 mm × 100 mm, whereas for EBSD work it is 40 mm × across ∼ 20 mm. The statistics of misorientation between ev-
60 mm. Neither section size is large enough to clearly mea- ery pixel and the average orientation for that grain (Fig. 6e)
sure the coarse crystal size, but such sections capture the show that 99 % of these misorientations are below 2.5◦ .
complexity of grain boundaries and crystal shapes. Larger There is very little orientation spread, a measure of lattice
crystals have lobate–cuspate boundaries (Figs. 2a and 6a and distortion in the grains, in this and all of the other sections
b), and many grains are larger than the size of the thin sec- shown.
tion. Many larger grains within one measured section have
the same color in thin sections under cross-polarized light 5.2.2 Composites
and are shown to have the same crystallographic orientations
by EBSD data, with near-identical c-axis and a-axis orien- Several c-axis maxima clustered around the normal to the
tations (Figs. 2 and 6b and c). We chose to show sections shear plane are present in individual samples, and this is
from the smaller ingots (≈ 30 mm × 30 mm) (Fig. 6a and b) largely independent of whether we plot all measured pixel
The Cryosphere, 15, 303–324, 2021 https://doi.org/10.5194/tc-15-303-2021M. E. Monz et al.: Full crystallographic orientations of warm, coarse-grained ice 313
orientations or one-point-per-grain orientations (Fig. 7b–d). crystals amplify individual maxima within the overall CPO
The maxima in the all-pixel diagrams (Fig. 7b) have differ- pattern typically identified in warm, coarse-grained ice. This
ent relative intensities compared to those in the one-point- may particularly be the case in studies that only use ∼ 100 or
per-grain CPO plots (Fig. 7c and d), reflecting the increased fewer grains to identify a c-axis pattern, because if 10–15 is-
weight given to the larger grains in the per-pixel data. In ei- lands comprising the same grain were measured as separate
ther case, many c axes within an individual cluster are only grains, that would automatically lead to a c-axis maximum
separated by 3–5◦ . The a axes define a diffuse girdle, parallel due to that grain.
to sub-parallel with the shear plane, containing three distinct Whole section analyses also allowed us to better under-
clusters (Fig. 7e). Each cluster is elongate towards the pole stand the deformation mechanisms. While some subgrains
to foliation. are present in the suite of whole sections analyzed, most crys-
When composites SG23, SG27 and SG28, which are in tals show little evidence of significant lattice distortion. Indi-
the same kinematic reference frame, are individually plot- vidual grains are relatively strain-free (Fig. 6e). A lack of in-
ted as one point per grain, and these results are combined on tragranular distortion, combined with the presence of lobate–
one CPO plot, the multimaxima nature of the pattern dimin- cuspate grain boundaries; no visible shape preferred orienta-
ishes (Fig. 8). The composite pattern has one c-axis maxi- tion; and evidence of grain boundary drag around bubbles
mum roughly perpendicular to the shear plane, which is elon- (e.g., Fig. 6a), similar to pinning effects discussed by Evans
gated or split into two maxima aligned in a plane normal et al. (2001), suggests that recrystallization in these samples
to the shear direction, and an a-axis girdle parallel with the is dominated by grain boundary migration (Urai et al., 1986).
shear plane with a concentration of a axes perpendicular to These interpretations are consistent with those in microstruc-
the shear direction (parallel to the inferred vorticity axis of tural studies of experimentally deformed ice at high temper-
flow). Two weak c-axis sub-maxima are offset from the main atures (e.g., Kamb, 1972; Montagnat et al., 2015; Vaughan et
maximum in a plane perpendicular to the vorticity axis: the al., 2017; Journaux et al., 2019) and natural ice samples de-
more distinct one ∼ 30◦ synthetic to the shear direction and formed at relatively high temperatures (Duval and Castelnau,
the less distinct one ∼ 50◦ antithetic to the shear direction 1995).
(Fig. 8).
It is important to note that another source of error in creat- 6.2 Composite sections and combined samples
ing Fig. 8 results from combining data from the three samples
into one pole diagram. The reference frame for this is the fo- Patterns of c-axes for individual samples appear to represent
liation plane (x–y plane with vertical, y, recorded on each typical multimaxima CPO patterns of the kind that have pre-
block when removed from the glacier). The error in combin- viously been identified in warm, coarse-grained ice (Fig. 7b
ing data from the three samples is estimated to be no more and c), with two–three strong maxima and one–two weaker
than 1◦ . Adding this source of error to those associated with maxima all centered about the pole to foliation. However,
sample preparation (see above), we estimate the uncertainties on CPO plots of one-point-per-grain c axes, we interpret
in positioning points on the pole diagrams in Fig. 8 to be no the small angular difference between many of the individ-
more than 6◦ . The overall effects of such errors are likely to ual points as most likely due to branched grains appearing
modestly diffuse rather than strengthen the maxima shown, multiple times throughout the sample section and thus being
but they will not modify the basic pattern. We assert that the counted more than once, consistent with observations made
measurements we have made are sufficient to establish the on whole sections. This interpretation is strengthened be-
main features of the fabric in Fig. 8. cause c-axis clusters in Fig. 7 are coupled with corresponding
a-axis clusters. The small 3–5◦ misorientations of individual
c axes within a cluster are likely due to the combination of
slight non-parallelism and the rotation of slices that occurred
6 Discussion
during the sample preparation process (as described above)
6.1 Whole sections and the internal structure of individual grains. On this ba-
sis, we propose that multimaxima patterns such as those de-
EBSD maps of whole sections confirm that island grains scribed in previous studies may be an apparent result caused
are likely part of the same larger grain based on identical by grain sampling bias, with some samples containing fewer
full crystallographic orientations (Fig. 6a and b). Individual than 30 unique grains within a set of 100 apparent grains
grains within a two-dimensional surface that have exactly the (i.e., the case assuming no multiple counting). Thus, even for
same orientation or a slight misorientation are likely branch- the composite samples, the data in Fig. 7 likely do not truly
ing segments of the same grain, or subgrains of the larger provide a representative one-point-per-grain CPO. Combin-
grain in three dimensions (Figs. 3 and 6b and c). Even small ing sections for SG23, SG27 and SG28 provides a more rep-
(30 mm × 50 mm) 2D sections can contain 3–5 island grains resentative dataset (Fig. 8), reducing but not entirely elimi-
that have the same orientation (Fig. 6b and c). By appear- nating the bias.
ing several times in the same section, some of the larger
https://doi.org/10.5194/tc-15-303-2021 The Cryosphere, 15, 303–324, 2021314 M. E. Monz et al.: Full crystallographic orientations of warm, coarse-grained ice
Figure 8. Combined data (one point per grain) from SG23, SG27 and SG28 in the same kinematic reference frame. Plots from left to right
show c axes uncontoured, c axes contoured and a axes contoured.
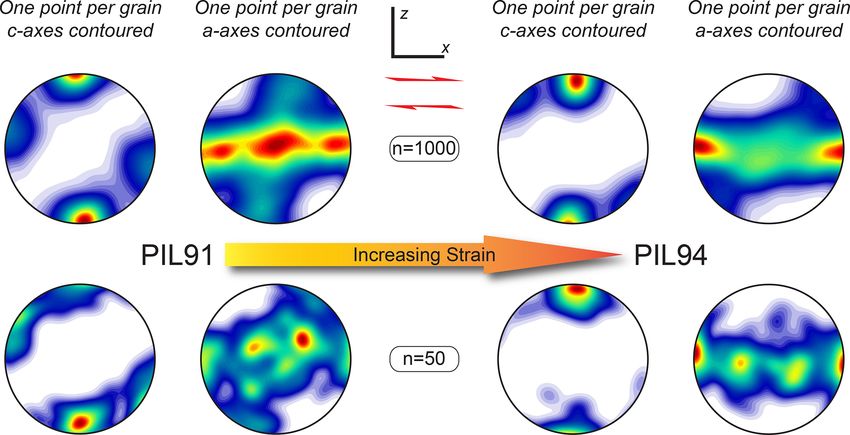
6.3 Comparison with experimental results The angle between the strong maximum and sub-maximum
decreases with increasing shear strain. Clusters of c axes are
Only two published sets of experiments document both c- somewhat elongate in a plane normal to the shear direction.
axis and a-axis CPOs in simple shear in ice, and those are The elongation of the main c-axis maximum in a plane
the ones by Qi et al. (2019) and Journaux et al. (2019). The normal to the shear plane and in a direction perpendicular to
results of these two sets of experimental studies are coherent, the shear direction is found both in simple shear experiments
exhibiting two clusters of c axes, a strong cluster normal to (Kamb, 1972; Bouchez and Duval, 1982; Journaux et al.,
the imposed shear plane at all strains and a secondary clus- 2019; Qi et al., 2019) and in experiments involving simple
ter in a profile plane antithetic to the imposed shear direction shear with the added effect of compression or flattening nor-
at lower strains. Both studies highlight the disappearance of mal to the flow plane (Kamb, 1972; Duval, 1981; Budd et al.,
the weaker maximum and an enhancement of the stronger 2013; Li et al., 2000). It is also found in our samples (Fig. 8).
maximum with high shear strains. Except for grain size, we There are many proposed explanations, a combination of
interpret microstructures in the ice from both the warm tem- which likely tells the story along the margin of Storglaciären.
perature experiments by Qi et al. (2019) and the experiments The combination of uniaxial compression (cone distribution
done by Journaux et al. (2019) to be similar to those in our about the compression axis) with simple shear (single maxi-
samples from Storglaciären (including c- and a-axis CPOs) mum perpendicular to the shear plane for large strains) pro-
and to other examples (including only c-axis CPOs) of warm, vides the clearest explanation for the split maximum (Kamb,
natural ice (Rigsby, 1951; Kamb, 1959; Jonsson, 1971). In- 1972; Budd et al., 2013). Bouchez and Duval (1982) and
dividual grains from these “warm” experiments by Qi et al. Journaux et al. (2019) observe the tendency for the main c-
(2019) and Journaux et al. (2019) are characterized by ame- axis maximum to spread, but not split entirely, in experiments
boidal shapes and lobate boundaries, and portray little to no using fixed platens where compression could not be a factor.
SPO in the two-dimensional plane. Li et al. (2000) attribute the spreading to transverse exten-
We provide a more detailed comparison of our CPOs sion accompanying the flattening of the sample during de-
from natural ice to experimentally obtained CPOs from two formation in their experiments. Two-dimensional numerical
warm-temperature (−5 ◦ C) direct-shear experiments by Qi et simulations by Llorens et al. (2016a, 2017) show this spread-
al. (2019), at relatively low (γ = 0.62) and high (γ = 1.5) ing and splitting occurs in simple shear with no flattening
strains. A major advantage of using an experimental dataset strain and that it is enhanced by dynamic recrystallization. It
for our comparison is that it comprises hundreds more grains is most pronounced at low strain rates. Qi et al. (2019) sug-
than can be measured in a single sample of coarse-grained gest that the spreading increases with increasing shear strain.
glacial ice – even with using the novel composite-section In our case, at the margins of Storglaciären, the ice is de-
sampling techniques addressed in this paper. Given the simi- forming at high temperatures and low strain rates and to high
larity in grain-shape characteristics and deformation temper- finite strains, consistent with conditions that enhance spread-
ature and owing to the greater number of analyzed crystal ing in experiments (Qi et al., 2019) and in modeling (Llorens
orientations, we argue that CPO patterns from both the Qi et et al., 2016a, 2017). The degree of spreading and splitting is
al. (2019) and Journaux et al. (2019) samples represent an likely enhanced in these samples due to compression normal
excellent analog for crystallographic texture evolution of ice to the valley walls, in a direction normal to the shear plane,
along the margins of Storglaciären. a pattern similar to that observed by Kamb (1972) and Budd
Orientation data from Qi et al. (2019) show well-defined et al. (2013).
CPO patterns with a two-cluster c-axis pattern: a strong c- The a axes in both the low- and high-strain experiments of
axis maximum perpendicular to the shear plane and a c-axis Qi et al. (2019) define a girdle parallel with the shear plane
sub-maximum rotated from the dominant maximum 45–70◦ (Fig. 9). In the lower-strain experiments, the a axes mostly
in a direction antithetic to the shear-induced rotation (Fig. 9). cluster perpendicularly to the shear direction (parallel to the
The Cryosphere, 15, 303–324, 2021 https://doi.org/10.5194/tc-15-303-2021You can also read