Non-Targeted Screening Approaches for Profiling of Volatile Organic Compounds Based on Gas Chromatography-Ion Mobility Spectroscopy (GC-IMS) and ...
←
→
Page content transcription
If your browser does not render page correctly, please read the page content below
Review

Non-Targeted Screening Approaches for Profiling of Volatile
Organic Compounds Based on Gas Chromatography-Ion
Mobility Spectroscopy (GC-IMS) and Machine Learning
Charlotte Capitain and Philipp Weller *

                                          Institute for Instrumental Analytics and Bioanalytics, Mannheim University of Applied Sciences,
                                          68163 Mannheim, Germany; c.capitain@hs-mannheim.de
                                          * Correspondence: p.weller@hs-mannheim.de; Tel.: +49-(0)621-292-6484

                                          Abstract: Due to its high sensitivity and resolving power, gas chromatography-ion mobility spec-
                                          trometry (GC-IMS) is a powerful technique for the separation and sensitive detection of volatile
                                          organic compounds. It is a robust and easy-to-handle technique, which has recently gained attention
                                          for non-targeted screening (NTS) approaches. In this article, the general working principles of GC-
                                          IMS are presented. Next, the workflow for NTS using GC-IMS is described, including data acquisi-
                                          tion, data processing and model building, model interpretation and complementary data analysis.
                                          A detailed overview of recent studies for NTS using GC-IMS is included, including several examples
                                          which have demonstrated GC-IMS to be an effective technique for various classification and quan-
                                          tification tasks. Lastly, a comparison of targeted and non-targeted strategies using GC-IMS are pro-
Citation: Capitain, C.; Weller, P.        vided, highlighting the potential of GC-IMS in combination with NTS.
Non-Targeted Screening
Approaches for Profiling of Volatile      Keywords: gas chromatography ion mobility spectroscopy (GC-IMS); volatile organic compounds
Organic Compounds Based on Gas            (VOCs); non-targeted screening (NTS) using machine learning
Chromatography-Ion Mobility
Spectroscopy (GC-IMS) and
Machine Learning. Molecules 2021,
26, 5457. https://doi.org/                1. Introduction
10.3390/molecules26185457
                                               Quality control and early detection of hazard chemicals, allergens, or biological con-
Academic Editor: Thomas Letzel
                                          taminants are critical to ensure product safety. Environmental pollutants, pesticides, or
                                          toxins, among others, can compromise food safety and pose a public health risk [1]. Fur-
Received: 24 July 2021                    thermore, food adulteration and food fraud, accelerated by globalization, continue to
Accepted: 1 September 2021                cause economic losses and customer dissatisfaction and emphasize the need for robust,
Published: 8 September 2021               inexpensive, and fast analytical methods [2]. While new scientific findings continuously
                                          identify potential hazardous or allergenic compounds [3], commonly employed methods,
Publisher’s Note: MDPI stays neu-         which focus on the detection and identification of a particular compound or class of com-
tral with regard to jurisdictional        pounds, lack the ability to identify new or unknown compounds. Due to the inherent di-
claims in published maps and institu-     versity of biogenic samples, as observed in food analysis, and the chemical complexity of
tional affiliations.                      the sample matrices, analysis often requires advanced sample preparation strategies [4].
                                          For systematic monitoring of product quality, it is therefore desirable to develop analyti-
                                          cal methods capable of discovering unknown or non-targeted compounds from the com-
                                          plex sample matrices. This approach, also referred to as NTS, requires comprehensive ex-
Copyright: © 2021 by the authors. Li-
                                          traction and analysis of compounds of interest. Analysis of the volatile organic com-
censee MDPI, Basel, Switzerland.
                                          pounds (VOCs) of samples, also known as VOC profiling, allows for the detection of com-
This article is an open access article
                                          pounds in complex sample matrices without the need for detailed a priori knowledge of
distributed under the terms and con-
ditions of the Creative Commons At-
                                          the molecular composition. Due to its high sensitivity and resolving power on the one
tribution (CC BY) license (http://crea-
                                          hand and its simplicity and robustness on the other, ion mobility spectrometry (IMS) has
tivecommons.org/licenses/by/4.0/).        gained popularity for the analysis of VOCs [5]. Moreover, gas chromatography coupled
                                          to ion mobility spectroscopy (GC-IMS) has been shown to be an easy-to-handle and yet
                                          highly effective tool for VOC profiling [6]. As a result, non-targeted VOC profiling based

Molecules 2021, 26, 5457. https://doi.org/10.3390/molecules26185457                                                 www.mdpi.com/journal/molecules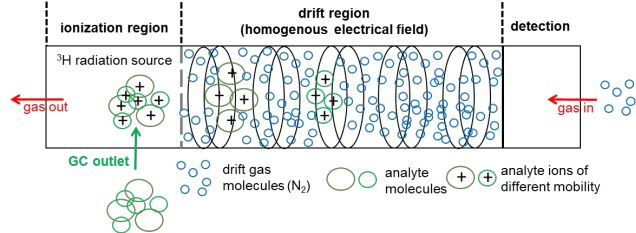
Molecules 2021, 26, 5457                                                                                            2 of 23

                              on GC-IMS in combination with machine learning has emerged as a promising method
                              for sample monitoring.
                                    Since the 1970s, when IMS was first known as ‘plasma chromatography’, IMS has
                              developed into a highly sensitive technique for the analysis of VOCs at ultratrace concen-
                              tration levels, which accounts for additional information regarding the ion’s mobility [7–
                              9]. Due to the robust and easy-to-handle instrumentation, a wide range of application
                              fields have been found for IMS today, such as food flavor analysis [5], process monitoring
                              [10,11], and quality control [12], as well as detection and quantification of warfare agents
                              [13] and explosives [14,15].
                                    With IMS, analytes are first ionized in the ionization region of the instrument. The
                              most common ionization method is the atmospheric pressure chemical ionization [16] by
                              beta emitters, which frequently use nickel-63 (Ni-63) [11,15,17,18] or the less hazardous
                              beta-emitting tritium (H-3) [19] or alpha-emitting americium-241 (Am-241) [20,21]. Other
                              ionization methods are atmospheric pressure photo ionization (APPI) [22], which uses
                              ultraviolet light (UV) [23,24] or corona discharge (CD) atmospheric pressure chemical ion-
                              ization [17,25–27], where a high electric field between a needle and a metal plate or dis-
                              charge electrode is used. Yet another method is the laser desorption/ionization technique
                              (LDI), which employs a laser pulse as ion source [28].
                                    According to the European Union directive, the exemption limit for the total activity
                              for tritium was set to 1 GBq [29]. Therefore, the usage of a low-radiation tritium ion source
                              with an activity of 300 MBq is not subject to authorization, hence leading to a broad adop-
                              tion of tritium ion sources in a number of commercially available systems on the market
                              [30–34]. Beta particles, which are emitted by the tritium source, initiate a gas-phase reac-
                              tion cascade of the drift gas (nitrogen or air), resulting in predominant proton-water clus-
                              ters H+[H2O]n, which are commonly referred to as ‘reactant ions’ [35]. The number of water
                              molecules (n) depends on the gas temperature and the moisture content of the gas atmos-
                              phere [8]. Depending on the proton affinity, molecules entering the ionization region react
                              with the reactant ions to protonated monomers MH+[H2O]n−x, while decreasing the inten-
                              sity of the reactant ion peak (RIP). At higher analyte concentrations, proton-bound dimers
                              M2H+[H2O]m−x are formed by the attachment of additional analyte molecules. When the
                              concentration further increases, the formation of higher molecular cluster ions, such as
                              trimers or tetramers, is possible; however, due to their low stability and short lifetime,
                              higher molecular cluster ions are rarely observed [36]. In general, nonlinear behaviors are
                              observed for the ratio of the RIP and the distribution between the protonated monomer
                              and the proton-bound dimer [36,37]. The principles of a drift-time IMS including a H-3
                              ionization source are shown in Figure 1.

      Figure 1. Setup of a drift-time IMS with a tritium (H-3) ionization source, adopted from [38] with permission
      (ID5138730886281).
Molecules 2021, 26, 5457 3 of 23
Subsequent to ionization, the analyte ions enter the drift region, where they are ac-
celerated towards the detector, typically a Faraday plate, and are separated by their drift
time (or mobility) in an electrical field at ambient pressure. The ions are slowed down by
the collision with counterflowing drift gas molecules in the collision cross-section (CCS).
Due to an equilibrium between the acceleration by an electric field and deceleration by
the collision with the drift gas molecules, the ions move with a constant velocity to the
detector. Depending on the characteristic mass, charge, and structure, the ions are sepa-
rated in the drift tube and reach the detector at different drift times [39]. For identification
of the analyte, the inverse of the measured drift time is normalized to the drift length and
the electric field resulting in the spectrum of ion mobility. The reduced ion mobility K0
(see Equation (1)), which is independent of ambient conditions and experimental setup, is
obtained after further normalization to pressure and temperature.
L p T0
K0 = ∙ ∙ (1)
E ∙ t D p0 T
With
K0 = reduced ion mobility in cm²V−1s−1
L = drift length in cm
E = electric field strength in Vcm−1
tD = drift time in s
p = pressure of the drift gas in hPa
p0 = ambient pressure: p0 = 1013.2 hPa
T = temperature of the drift gas in K
T0-ambient temperature: T0 = 273.2 K
Instead of measuring temperature and pressure, the normalization is often carried
out using the known mobility of the ions produced in the pure drift gas or by adding a
reference analyte [40]. The signal intensity is proportional to the concentration and ena-
bles the quantification in ppbv (for some compounds even pptv) levels within a few milli-
seconds.
The state-of-the-art IMS technologies can be classified into time-dispersive, space-
dispersive, and trapping technologies [41]. Time-dispersive IMS separates ions as a func-
tion of their mobility in a neutral gas, whereas space-dispersive IMS separates ions by the
ratio of low-field to high-field mobilities [42]. Examples of time-dispersive IMS are drift
tube ion mobility spectrometry (DTIMS) and travelling tube ion mobility spectrometry
(TWIMS). High-field asymmetric waveform ion mobility spectrometry (FAIMS) and dif-
ferential ion mobility spectrometry (DIMS or DMS) are examples for space-dispersive
techniques [43]. The third class is represented by trapped ion mobility spectrometry
(TIMS), which contains a trapping technology able to confine and release ions.
IMS alone has been applied for quantification [11,15,17,27] and classification [5] tasks
in controlled environments. However, due to the inherent diversity of biogenic samples,
the applications of IMS with direct sample introduction are often not sufficient, requiring
prior purification or separation. The commonly used purification methods for VOC pro-
filing in combination with IMS are solvent extraction [20,26,44] and solid-phase microex-
traction (SPME) [13]. SPME devices are constructed of a silica fiber coated with a thin layer
of a suitable polymeric sorbent or immobilized liquid, used for the direct extraction of
analytes from gaseous and liquid media [45]. While SPME coupled to IMS has been suc-
cessfully used for quantification tasks, such as the detection and quantification of precur-
sors and degradation products of chemical warfare agents [13], SPME is commonly ex-
tended by column separation techniques [18,46,47].
To avoid clustering in the ionization or drift region, IMS devices are commonly cou-
pled to column separation techniques, such as liquid chromatography (LC) or gas chro-
matography (GC). Column separation coupled to drift-time IMS separates analytes into
two orthogonal features, first the retention time through chromatography and second, the
drift time or mobility through IMS, resulting in a two-dimensional (2D) highly resolvedMolecules 2021, 26, 5457 4 of 23
GC-IMS spectrum [6,38]. In LC analysis, any soluble compound can be separated, but
sample preparation is a critical step for the data quality [48]. A comprehensive extraction
method which enables the extraction of a wide range of compounds with minimized po-
tentially interfering coextractives is needed for NTS approaches, since unspecific com-
pounds are being targeted [49]. LC-MS in combination with NTS has been applied for the
detection of food contaminants and environmental hazards [50,51].
In GC analysis, the volatility of a sample is a prerequisite. Headspace (HS)-based
techniques allow for the analysis of untreated samples, avoiding the time-consuming sam-
ple pretreatment steps [52]. The analysis of non-volatile samples may be achieved through
the derivatization with a functional group onto the molecule of interest. Although the
modification of the functional group enables the analysis of compounds that otherwise
could not be easily monitored by GC, NTS approaches usually do not incorporate deri-
vatization, in particular due to the high level of variance.
The advantages of GC-IMS in comparison to established techniques, such as mass
spectrometry, are its simple and inexpensive design primarily due to being operated at
atmospheric pressure and hence not requiring vacuum pumps [8]. Furthermore, the use
of radioactive ionization sources allows for portability, miniaturization, and mechanical
robustness and therefore is suitable for field and benchtop applications [52]. Due to effi-
cient ionization, in combination with its fast and sensitive detection, IMS is a universal
technique for the analysis of organic and inorganic molecules, atoms, or particles [38]. One
potential challenge of IMS analysis is that spectra may contain interference due to wide-
spread ionization, which results in low selectivity. The addition of suitable dopant sub-
stances, however, has been shown to overcome these limitations [53,54]. A nonlinear con-
centration range was previously described for IMS, requiring the careful monitoring of
sample concentration to avoid sample saturation. Furthermore, the separation, which is
based on CCS, often provides limited information regarding specific qualities concerning
size and shape of analytes. However, the drawback of interference caused by spectral
complexity and nonlinearities can be overcome by using computer-based analysis tools
[55].
The complexity of biological samples results from the presence of a variety of com-
pounds, which provide in their entirety a characteristic HS-GC-IMS spectrum, often re-
ferred to as the VOC profile or ‘fingerprint’ [56,57]. HS-GC-IMS has been demonstrated
to be an effective technique for the evaluation of VOC profiles of biological samples due
to its simple system setup, robustness, and price [44,58–61]. The chemical fingerprinting
of food and beverages in combination with chemometric analysis is widely used for food
authentication and ultimately to identify food adulteration and fraud [62]. Furthermore,
the VOC profile is influenced by production processes as well as storage conditions. Con-
sequently, process control and quality assurance, such as the control of food freshness or
food safety, are topics of interest for NTS using HS-GC-IMS [63,64] techniques.
2. Motivation for Non-Targeted Screening Using HS-GC-IMS
Labelling fraud, e.g., of organic certifications or geographic origin, is the most com-
mon type of fraud in agricultural and food markets [65,66]. According to the European
Commission, honey and olive oil are particularly affected by mislabeled botanical origin,
as well as dilution with inferior or less expensive products [2,67]. Moreover, food adulter-
ation and food fraud have led to cases of economic loss and may pose health risks [2]. The
detection of food fraud or adulteration often involves the identification of compounds of
unknown molecular composition. Since no identified chemical markers or sets of markers
are commonly accessible for a target-based analysis, an analytical approach covering a
multitude of parameters in parallel paired with strong discrimination power is required.
The currently used methods to determine quality and authenticity, such as sensory anal-
ysis and physicochemical analysis [68], are time- and resource-consuming, while lacking
sensitivity as well as prediction accuracy, not at least due to univariate analysis. To over-Molecules 2021, 26, 5457 5 of 23
come the limitations of traditional, wet-chemistry-based assays, targeted and non-tar-
geted approaches using chromatographic methods [69,70], often in combination with
mass spectrometry [71–73], as well as infrared (IR)-based spectroscopy [74,75], and proton
nuclear magnetic resonance (1H NMR) spectroscopy [76,77] have been discussed for vari-
ous applications. However, to obtain the required reproducibility needed for chemomet-
ric analysis, time-consuming sample preparation, including precise adjustments of pH,
water content or particle size, have been reported in combination with the mentioned
methods. Furthermore, the high costs of ownership and maintenance, as well as the re-
quirement for expert knowledge, may limit applications. Finally, high-end instrumenta-
tion also requires suitable laboratory infrastructures, which are usually not available at
the point of care. Thus, robust, inexpensive, and fast analytical methods, such as HS-GC-
MS, are needed, which require little or no sample preparation but deliver high selectivity.
Application examples for HS-GC-IMS with NTS:
A plethora of studies have shown the potential of HS-GC-IMS in combination with
NTS for monitoring food quality or confirmation of geographical or botanical origin, de-
spite the complexity of the samples. For example, HS-GC-IMS with NTS has been widely
applied for the classification of olive oil between high-priced type 1 extra-virgin olive oil
(EVOO), medium-priced type 2 virgin olive oil (VOO or OO), and non-edible type 3 olive
oil, also known as pomace olive oil (POO) or lampante (virgin) olive oil (L(V)OO)
[32,33,78,79]. Furthermore, HS-GC-IMS with NTS was successfully used for reliable clas-
sification of geographical origins for both olive oil (EVOO) [34,80,81] and wine [30]. More-
over, HS-GC-IMS with NTS was applied for the classification of honey according to bo-
tanical origin [52,81,82], as well as for the detection and quantification of honey adulter-
ated with sugar cane or corn syrups [83,84]. Recently, HS-GC-IMS with NTS has been
applied to assess the freshness of food [85] and for the detection of mold formation on
milled rice [86], peanut kernels [87], and wheat kernels [88]. Further examples of recent
studies using HS-GC-IMS with NTS are provided in Table 1.
Table 1. Recent studies of HS-GC-IMS with NTS.
Reference Matrice Separation (Length × Comple- Method and Data-Split;
Aim of Ref- IMS Type (Ion- Unsupervised and Su-
(Main Au- (Number of Inner Diameter (ID), mentary Number of Com- (Cross-) Vali-
erence ization Source) pervised Methods
thor/Yeat) Samples) Film Thickness (ft)) Analysis pounds Identified dation
FS-SE-54-CB stationary
Arroyo- classification
dry-cured FlavourSpec by phase (30 m × 0.32 mm PCA
Manza- between library search (LS)
Iberian ham GAS (tritium, ID, 0.25 µm ft; 94% me- PCA-LDA (90%), kNN 80/20
nares/2017 pig’s food 5
(24) 6.5 keV) thyl, 5% phenyl, 1% vi- (k = 3, 90%)
[89] sources
nyl silicone)
detection of
Arroyo- OPLS-DA (97.4% pre-
adulteration FlavourSpec by HP-5MS UI (nonpolar)
Manza- diction of class, 93.75%
(sugar cane honey (198) GAS (tritium, (30 m × 0.25 mm ID, 0.25 0 80/20
nares/2019 prediction of adultera-
or corn 6.5 keV) μm ft)
[84] tion degree)
syrup)
ZB-5 ms column (30 m ×
detection of OEM IMS by reference sub- leave-one-out
Brendel/2021 citrus juice 0.25 mm, 0.25 μm ft; 5% PCA HS-GC-
botanical GAS (tritium, stances (RS) (LOO) 4- and
[90] (47) phenyl- PCA-LDA (91.5%) MS/IMS
origin 300 MBq) 9 6-fold CV
methylpolysiloxane)
FS-SE-54-CB-1 station-
Cavanna/201 detection of ary phase (15 m × 0.53
PCA RS, SPME-GC-MS leave-one-out
8 food fresh- egg (132) FlavourSpec mm ID, 1 µm ft; 94%
OPLS-DA (97%) 5 CV
[85] ness methyl, 5% phenyl, 1%
vinyl silicone)
detection of Chinese yel- FlavourSpec by
Chen/2020 nonpolar column (30 m, PCA LS
geographical low wine GAS (tritium, 70/30
[30] 95% methyl, 5% phenyl) QDA (95.35%) 12
origin (122) 6.5 keV)
quality as- SE-54-CB (30 m × 0.32
del Contre- FlavourSpec by PCA
sess- olive oil mm, 0.25 µm ft; 94% LS, RS 80/20;
ras/2019 GAS (tritium, non-targeted (PCA-
ment/classi- (701) methyl, 5% phenyl, 1% 20 7-fold CV
[33] 6.5 keV) LDA, kNN k = 3: 79.4%),
fication vinyl silicone)Molecules 2021, 26, 5457 6 of 23
targeted OPLS-DA:
74.3%)
portable UV–
IMS instrument
quality as- (UV ionization PCA 71/29 and
Garrido-Del-
sess- source: 10.6 eV) MCC (nonpolar) OV-5 UV-IMS: kNN (k = 3, 64/26;
gado/2011 olive oil (49) 0
ment/classi- and Flavour- (20 cm) 86.1%); GC-IMS: kNN (k leave-one-out
[80]
fication Spec by GAS = 3, 100%) CV
(tritium, 6.5
keV)
quality as- PCA
Garrido-Del- FlavourSpec by MCC (nonpolar) OV-5 Organo- bootstrap vali-
sess- Targeted: kNN (k = 3, LS, RS
gado/2012 olive oil (98) GAS (tritium, (20 cm, 1000 parallel leptic dation (B =
ment/classi- 79%), non-targeted: 10
[78] 6.5 keV) glass capillaries) analysis 100)
fication kNN (k = 3, 87%)
two different types of
columns: MCC (20 cm ×
quality as- PCA
Garrido-Del- FlavourSpec by 3 mm ID, 900 parallel
sess- MCC-IMS: kNN (k = 3, LS, RS bootstrap vali-
gado/2015 olive oil (55) GAS (tritium, glass capillaries: 40 µm
ment/classi- 79%); CC-IMS: kNN (k = 26 dation
[32] 6.5 keV) ID, 0.2 µm ft) and CC
fication 3, 83%)
(30 m × 0.25 mm, 0.5 µm
ft)
NB-225 (25 m × 0.32 mm
Ger- detection of FlavourSpec by PCA
× 0.25 μm ft; 25% phe- RS
hardt/2017 geographical olive oil (40) GAS (tritium, PCA-LDA (98%) and 10-fold CV
nyl, 25% cyanopropyl 4
[34] origin 6.5 keV) kNN (k = 5, 92%)
methyl siloxane)
DB-225 (25 m × 0.32 PCA
Ger- detection of advanced IMS
mm, 0.25 μm ft; 25% PCA−LDA (98.6%), kNN RS 87/13;
hardt/2018 botanical honey (74) by GAS (trit- 1 H NMR
phenyl, 25% cyanopro- (k = 5, 86.1%), PLS-DA 18 10-fold CV
[52] origin ium, 300 MBq)
pyl methyl siloxane) (PLS = 5, 97.0%)
quality as- DB-225 (25 m × 0.32 mm PCA, HCA
Ger- FlavourSpec by Organo-
sess- × 0.25 μm ft; 25% phe- PCA-LDA (10 PCs, RS
hardt/2019 olive oil (94) GAS (tritium, leptic 10-fold CV
ment/classi- nyl, 25% cyanopropyl 83.3%), kNN (73.8%), 25
[79] 6.5 keV) analysis
fication methyl siloxane) SVM (88.1%)
PCA, HCA
GA-SVM, Artificial
samples: (Classification:
detection of wheat ker-
FlavourSpec by MXT-WAX (nonpolar) 100%), (Quantification >
Gu/2020 quality nels infected LS
GAS (tritium, (30 m × 0.53 mm ID, 0.1 93.9%); 67/33
[88] changes dur- with mold 13
6.5 keV) μm ft) Natural samples: (Clas-
ing storage (90)
sification: 60–86.7%,
Quantification: 72.6–
88.9%)
milled rice
detection of
infected FlavourSpec by PCA electric
Gu/2020 quality LS, partially RS 67/33;
with Asper- GAS (tritium, SE-54-CB kNN (k = 3, 94.44%), nose (E-
[86] changes dur- 25 10-fold CV
gillus spe- 6.5 keV) PLSR (90.9%) nose)
ing storage
cies (108)
peanut ker- PCA
detection of 67/33;
nel infected Rtx-WAX (30 m × 0.32 OPLS-DA (93.3%), low- fluores-
Gu/2021 quality LS 7-fold CV,
with aflatox- FlavourSpec mm ID, 0.25 μm ft, RT- level data fusion (90%), cence
[87] changes dur- 3 200× permuta-
igenic fungi 12,424) mid-level data fusion analysis
ing storage tion test
(180) (96.7%)
real-time IMS:
classification self-made posi- sensory 10-fold CV,
Li/2019 green tea PCA
between tive photoioni- - evalua- 0 1000× permu-
[5] (23) PLS-DA (95.6%)
aroma zation (PP-IMS) tion tation test
with KR lamp
detection of PCA
honey and
Schwolow/2 botanical advanced IMS Honey: PCA-LDA previous studies
olive oil (64 DB-225 (25 m × 0.32 87/13;
019 and geo- by GAS (trit- (33%); Olive oil: PCA- FT-MIR (18 honey, 7 olive
honey, 54 mm, 0.25 μm ft) 10-fold CV
[81] graphical ium, 300 MBq) LDA (78%), PCA-LDA + oil)
EVOOs)
origin data fusion (100%)Molecules 2021, 26, 5457 7 of 23
IMS-KS-100 by
detection of
Wuhan Syscan recursive support vector
Shuai/2014 adulteration flaxseed oil
Technology n-hexane extraction machine (R-SVM) 0 10-fold CV
[44] (with vege- (78)
(pulse glow (93.1%)
table oils)
discharge)
Deep learning (88.8%),
Vega- quality as- SE-54-CB (30 m × 0.32
FlavourSpec by SVM (83.1%), kNN
Marquez/20 sess- olive oil mm, 0.25 µm ft; 94% LS, RS
GAS (tritium, (84.5%), Tree (78.3%), 80/20
19 ment/classi- (701) methyl, 5% phenyl, 1% 20
6.5 keV) Regressor (85.5%),
[91] fication vinyl silicone)
XGBoost (85.7%)
detection of FlavourSpec by PCA
Wang/2019 FS–SE–54–CB-0.5 (15 m HS-SPME-GC-MS 200× permuta-
botanical honey (40) GAS (tritium, OPLS-DA (95%) (VIP >
[82] × 0.53 mm ID) 8 tion test
origin 6.5 keV) 1.5)
detection of FlavourSpec by
Wang/2019 FS–SE–54–CB-0.5 (15 m PCA LS
botanical honey (120) GAS (tritium, CV-ANOVA
[83] × 0.53 mm ID) PLS-DA (84%) 25
origin 6.5 keV)
Yuan/2020 metabolomic FS-SE-54-CB-1 (15 m × PCA LS 200× permuta-
rat feces (30) FlavourSpec
[92] studies 0.53 mm ID) OPLS-DA (86.6) 11 tion test
PCA
quality as- PCA-LDA (65.7%), PLS-
MXT-WAX (polar) (30 sensory
Zhu/2020 sess- DA (58.7%), kNN (k = 5, RS 85/15; 10-fold
wine (143) FlavourSpec m × 0.53 mm ID, 0.5 μm evalua-
[31] ment/classi- 60.8%), SVM (51.8%), >30 CV
ft, polyethylene glycol) tion
fication XGBoot (81.8%), ANN
(89.5%)
3. NTS-Workflow
NTS aims to identify the compounds of unknown molecular composition. The work-
flow for NTS generally consists of sample preparation, instrumental analysis, and post-
acquisition data processing [93]. Since little or no a priori knowledge of the chemical struc-
tures and behavior of compounds is required, NTS approaches benefit from gentile sam-
ple preparation, robust instrumental analysis, and standardized data processing. The
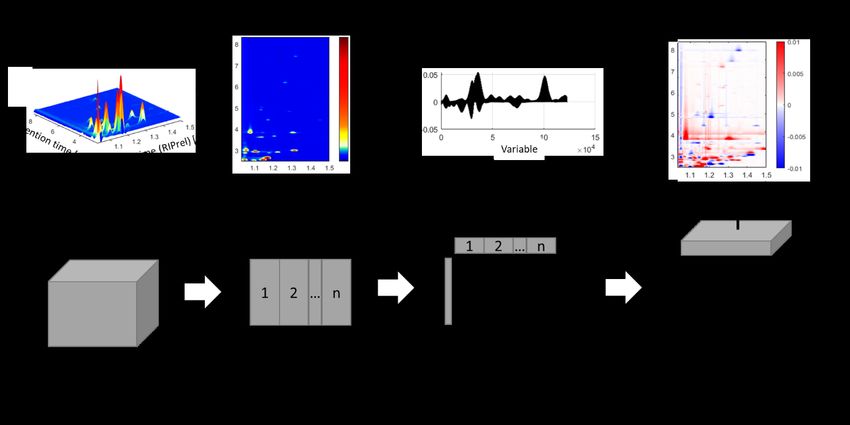
workflow for NTS using GC-IMS is shown in Figure 2. The first step, data acquisition,
involves sample preparation and subsequent extraction and separation of VOCs. The col-
lected data are then preprocessed and analyzed in the data-processing step. Since no pre-
existing knowledge is used, the entire spectral fingerprint obtained by HS-GC-IMS anal-
ysis is subject to data analysis and classification or quantification models being built using
machine learning tools. In the third step, model interpretation, key compounds are iden-
tified, which are extracted through back projection of loadings. Complementary analyses,
such as sensory analysis of GC-MS measurements, provide further insight into sample
composition and can be used to improve model accuracy. The model coherency is evalu-
ated and finally applied for benchtop profiling.Molecules 2021, 26, 5457 8 of 23
Figure 2. Workflow for non-targeted screening using HS-GC-IMS.
3.1. Data Acquisition
In untargeted approaches, sample preparation strategies need to be suitable for a va-
riety of matrices and enable the extraction of a wide range of compounds [49]. In order to
minimize the extraction-related formation of artifacts, static headspace extraction (SHS) is
commonly used for the analysis of volatile compounds in samples of different origin [94].
The limited sensitivity and the bias related to the extraction of low-volatile compounds
are generally considered as the main limitations of SHS methods, which can be overcome
through dynamic headspace extraction (DHS) [95]. If the preconcentration of analytes is
needed for analysis, high-concentration-capacity HS techniques, such as SPME can be
used, where the selective isolation of compounds of interest from samples with minimal
matrix contamination is crucial [95–97]. However, SPME is less commonly applied to IMS
with NTS, possibly due to drawbacks which have been associated with commercially
available extraction phases, such as the low recovery of polar compounds, insufficient
matrix-compatibility, and the reduced life-time and robustness of the coating against ma-
trix macromolecules [98].
VOC profiling based on IMS in combination with NTS has been shown to be an ef-
fective tool for various classification tasks, such as the differentiation between various
green teas with chestnut-like flavor [5]. Using PLS-DA, the authors were able to obtain an
accuracy of 95.6% for the classification of tender, pure, and roasted green tea aromas.
However, due to the complexity of many biogenic samples, IMS with direct sample intro-
duction is often not sufficient for NTS approaches, requiring extraction and/or column
separation techniques. Shuai and coworkers analyzed adulterated flaxseed oils after n-
hexane extraction using a handheld IMS and subsequent data analysis. A recursive sup-
port vector machine (R-SVM) led to a model with an accuracy of 93.1% for the identifica-
tion of adulterated flaxseed oil [44].
To address the complexity of biogenic samples, pre-IMS separation techniques are
commonly applied. To avoid the clustering and formation of heteromers in the ionization
or drift region, IMS devices are commonly coupled to GC. The spectra obtained by HS-
GC-IMS are 2D, with the GC retention time as the first dimension and the IMS drift timeMolecules 2021, 26, 5457 9 of 23
as the second dimension. The complexity of biological samples results from a plethora of
compounds, which provide in their entirety a characteristic GC-IMS spectrum that is often
referred to as VOC profile or ‘fingerprint’ [56,57]. For GC separation in combination with
IMS and NTS, both the capillary column (CC) and multicapillary column (MCC) have
been coupled to IMS. Among others, nonpolar CCs, such as fused silica SE-54-CB (94%
methyl, 5% phenyl, 1% vinyl silicone) [32,33,86,89,92], as well as polar CCs, such as DB-
225 (25% phenyl, 25% cyanopropyl methyl siloxane) [79,81], were used for HS-GC-IMS
with NTS. For MCCs, which are composed of a large number of parallel glass capillaries
(~1000), nonpolar OV-5 (5% diphenyl, 95% dimethylpolysiloxane) was used [78,99]. Com-
pared to the ordinary CC, MCCs allow the separation to be carried out at an elevated
speed and can be operated at increased carrier gas flows, which may pose an advantage
for IMS analysis [100]. However, Garrido-Delgado and coworkers obtained the better pre-
dictive accuracy for the classification (kNN classifier with k = 3) between different qualities
of olive oil (EVOO, OO, and LVOO), when CC-IMS (83%) versus MCC-IMS (79%) was
employed for the separation of the VOCs [32].
The data acquisition is finalized with the evaluation of the suitability of the collected
data for factorial analysis. This sampling adequacy is commonly determined using the
Kaiser–Meyer–Olkin (KMO) test, which is a measure of the proportion of variance among
variables [101].
3.2. Data Processing and Model Building
The ion velocity and thus the signal position are highly dependent on temperature
and ambient pressure; therefore, the drift-time alignment is a crucial preprocessing step
[36,102]. For baseline correction, drift times are often normalized to the RIP position,
which is, however, not sufficient for the determination of absolute mobilities [103]. Alter-
natively, a reference peak/substance can be used for alignment, which is recommended
when GC-IMS measurements are performed with long separation columns. In a second
preprocessing step, multiple measurements are averaged, and the background noise is
subtracted. Scaling methods, such as unit variance (UnVa) scaling, Pareto (Par) scaling,
and mean centering (Ctr) scaling, can be alternatively used for data set normalization [5].
In UnVa scaling, the variance of each variable is unified using the standard deviation,
while in Par scaling, the square root of the standard deviation is used for normalization,
whereas Ctr scaling emphasizes the analysis of data fluctuations and the large-fold change
in the data [82]. For further noise reduction, smoothing algorithms, such as Savitzky-Go-
lay or Gaussian smoothing, are applied to the spectra [52]. Interfering peaks and nonrele-
vant areas can be removed by the careful selection of relevant GC retention time and drift-
time ranges. Prior to data analysis, the 2D spectra (GC retention time × drift time) are
unfolded into arrays, which are then concatenated to the final data set (samples × meas-
urements). For supervised data analyses, the data set is finally split into training and test
sets, where the training set is used for model building and the test set for model validation.
Nonlinear behavior has been described for the ratio of the RIP and the distribution
between the protonated monomer and the proton-bound dimer [36,37,104]. By increasing
the molecular concentration of the analyte, the monomer peak decreases, while the dimer
peak increases. These typical nonlinear monomer-dimer distributions in IMS are often ac-
companied by tailing effects of the monomer or dimer peak [105], requiring careful con-
sideration for quantification. In univariate regression (UR), the peak area or intensity of a
single peak is correlated against concentration [46]. Due to the nonlinear behavior be-
tween the monomer and dimer peak, linearity can only be approximated for narrow con-
centration ranges when using the regression analysis based on single-peak analysis [36].
Occasionally, the sum of the volume of monomer and dimer is correlated against the con-
centration [106]; however, in complex mixtures, quantification is further complicated by
overlapping peaks, competitive ionization situations between coeluting analytes and the
occurrence of multicomponent cluster ions (heterodimeric ions), which are composed of
coeluting analytes [37].Molecules 2021, 26, 5457 10 of 23
3.2.1. Exploratory Data Analysis and Machine Learning Techniques
Due to the complexity of food matrices, abstract terms such as ‘food quality’ and ‘au-
thenticity’ are the sum of multiple characteristics, which implies that the correlation to a
single analyte or analytical technique is often not sufficient or even impossible; hence,
multivariate variate data analysis (MVA) techniques are required [81]. MVA approaches
can be divided into exploratory, classification, and quantitative regression methods. Ex-
ploratory methods, such as PCA or HCA, are unsupervised and typically used for pattern
recognition, whereas classification methods such as PCA-LDA, kNN, or PLS-DA are su-
pervised methods. In this context, PLS-DA is a special case of classification, as it basically
uses a regression approach with class boundaries instead of single values, as in quantita-
tive regressions. For sample quantification, the latter methods, such as PLS regression,
Kernel-PLSR, MCR-ALS, or ANN are commonly applied.
Principal component analysis (PCA) is a powerful technique for unsupervised dis-
covery of patterns in data, which is further used for dimension reduction [107]. The infor-
mation extracted from a data matrix is explained by principal components (PCs), which
are orthogonal (mathematically independent) to each other. Since PCA models are pre-
dicted without labels or validation by test data, they are generally considered unsuper-
vised. Unsupervised statistical methods are exploratory methods that can be used to study
data structures and search for clusters of samples [108]. Hierarchical cluster analysis
(HCA) of PCA models in a tree-like diagram (dendrogram) is, e.g., used for the visualiza-
tion of multivariate association and sample similarities [109]. An extension of PCA for
processing three-dimensional (3D) data is provided by multiway principal component
analysis (MPCA) [110], which has been applied for the feature extraction of GC-IMS ma-
trices, without prior transformation of the 2D data [99]. Further alternatives to PCA and
PLS are models based on PARAFAC [111] or Tucker3 [112], which may also be used with
3D data.
Compared to unsupervised techniques, which provide predictions without labels or
target variables, supervised techniques aim to build models able to predict target varia-
bles. In supervised learning, several data points or samples are described using predictor
variables or features and target variables. For classification tasks, the scores obtained by
the unsupervised exploratory analysis are combined with subsequent supervised pattern
recognition techniques to distinguish samples according to defined categories. Among
PCA-based qualitative methods are linear discriminant analysis (LDA) and k-nearest
neighbors (kNN). Whereas PCA-LDA maximizes the interclass variance, kNN assigns the
category most common among the k-nearest neighbors. The downside of using PCA-
based methods is that the correlation between dependent and independent variables are
not considered during PCA analysis, which can result in the loss of information included
in higher PCs [107]. An alternative is provided by partial least squares (PLS), where the
scores are calculated by considering the relationship between the independent and de-
pendent variables.
Other supervised methods used in NTS with HS-GC-IMS are gradient boosting (e.g.,
XGBoost) [31], decision tree classification (Tree) [91], logistic regression (Regressor) [91],
orthogonal partial least-squares discriminant analysis (OPLS-DA), quadratic discriminant
analysis (QDA) [30], or soft independent modeling of class analogy (SIMCA) [82]. Fur-
thermore, nonlinear classifications are often performed using support vector machines
(SVMs). By using the kernel trick, which transforms the input data into high-dimensional
feature spaces, SVMs can perform nonlinear classifications, in addition to performing lin-
ear classification [113]. This is of particular importance when no linear hyperplanes are
separating the respective classes.Molecules 2021, 26, 5457 11 of 23
3.2.2. Model Performance and Validation
The performance of a model is usually measured as ‘accuracy’, which is the fraction
of correctly classified samples. The classification accuracy determines the fraction of cor-
rectly classified samples for a given sample set. The classification accuracy, however, is
susceptible to overfitting and thus should only be used as reference. To prevent overfit-
ting, the data set is split into training and test data. The ratio between training and test
data, which is commonly referred to as ‘train–test split’, is usually between 2:1 [88] and
4:1 [33], and sometimes as low as 6:1 [31]. The test set is used to determine the prediction
accuracy, which is usually lower than the classification accuracy but more meaningful
[88]. For small and inhomogeneous data sets, a single split of the data into training and
test set may give misleading results [114]. An alternative model validation is therefore
provided by resample methods, such as cross validation (CV), bootstrapping, or permu-
tation testing, where multiple random subsets are generated. For the CV of samples, a
subset of the data is held out for use as a validation set, and a model is fit to the remaining
data (training set) and used to predict the validation set. The process of generating a sub-
set of data, model fitting, and evaluation is performed repeatedly, and an overall predic-
tion accuracy is determined by averaging the quality of the predictions across the valida-
tion sets. Leave-one-out CV leaves out a single observation at a time, while k-fold CV
splits the data into k subsets, which are one by one held out as the validation set [107]. For
NTS using HS-GC-IMS, 10-fold CV is commonly performed [31,52], alongside with leave-
one-out CV [80,85]. Bootstrapping is a resampling method that can be used as an alterna-
tive to CV to estimate the prediction performance of a model with a low number of train-
ing samples. Due to drawing with replacement, a bootstrapped data set contains the same
number of cases as the original data set, and it can contain multiple instances of the same
original cases [114]. Another resampling method is permutation testing, where labels are
switched on data points when performing the test statistics. Both bootstrapping [32,78]
and permutation tests [82,92] have been applied with HS-GC-IMS and NTS.
The success rate of different chemometric models for classification depends on many
factors, such as botanical origin of the samples, number of samples or the selection of PCs,
PLS, and k values. Gerhardt and coworkers compared different chemometric methods for
the classification of the botanical origins of honey (acacia, canola, and honeydew) using a
resolution-optimized HS-GC-IMS. They found a 98.6% accuracy with PCA-LDA, 86.1%
with kNN (k = 5), and 97.0% with PLS-DA after employing 10-fold CV [52]. Quality assess-
ment of olive oils based on temperature-ramped HS-GC-IMS and sensory evaluation con-
ducted by Gerhardt and coworkers reported a 83.3% accuracy with PCA-LDA, 73.8% with
kNN (k = 5) and 88.1% with SVM models, after employing 10-fold CV [79].
Artificial neural networks (ANNs) are a powerful modeling approach, which is
vaguely inspired by the biological neural networks in the brain [115]. Due to their hidden
layers, ANNs have the ability to capture complex interactions present in biological sam-
ples. Furthermore, ANNs can be applied for pattern recognition, classification tasks, and
quantification problems, as well as data preprocessing. ANN has recently the gained at-
tention for applications in food science and technology, while often being limited by the
requirement of having sufficiently large data sets [116,117]. Zhu and coworkers have
shown the superior prediction performance of ANN (89.5%) over PCA-LDA (65.7%), PLS-
DA (58.7%), kNN (k = 5, 60.8%) and SVM (51.8%), and XGBoost (81.8%), for the classifica-
tion of Sauvignon Blanc via SHS-GC-IMS [31]. Vega-Márquez and coworkers evaluated a
deep learning network and five different benchmark methods for the classification of olive
oil samples into EVOO, OO, and LVOO, based on HS-GC-IMS spectra obtained for 701
olive oil sample from two different harvests [91]. Among the five benchtop models used
for comparison, XGBoost offers the best accuracy of 85.7%, compared to SVM (83.1%),
kNN (84.5%), Tree (78.3%), and Regressor (85.5%). However, even better results were
achieved with the deep learning approach, obtaining an accuracy of 88.8%, which under-
lines the potential of ANNs.Molecules 2021, 26, 5457 12 of 23
3.2.3. Quantification Tasks
For quantification tasks, partial least squares regression (PLSR) has become the
standard method used in chemometrics, including the fields of sensorial analysis in food
chemistry [107,110]. PLSR is used to describe the relationship between two data matrices,
X (experimental data) and Y (actual concentrations), which are decomposed into X = TPT
+ E and Y = UQT + F, by finding the maximum covariance and linear relationship between
the score matrices T and U. P and Q represent the loading matrices and E and F the ma-
trices of residuals. After multiplying X with a nonlinear function, linear PLS can be ap-
plied as described above. After the successful implementation of multivariate models for
the interpretation of the training data, the model performance is commonly tested using
test data. The model quality can be determined by different figures of merit, such as the
determination coefficient (R2) and the relative percentage error of prediction (RE), as well
as root mean square error (RMSE), systematic error (Bias), or standard error of prediction
(SEP).
One limitation to PLSR is the typically lower performance on nonlinear and hetero-
scedastic data, as is partially the case for IMS data. Several studies have analyzed nonlin-
ear IMS data, as shown by the quantification of histamine in tuna stomach [7] or allergenic
fragrance compounds, such as citral, in complex cosmetic products [38]. Nonlinear rela-
tionships between the matrices T and U can be described by kernel PLSR (also known as
nonlinear PLSR), where the data are transformed into higher-dimensional spaces using
the kernel trick [118].
An alternative to PLSR or kernel PLSR is provided by multivariate curve resolution
alternating least squares (MCR-ALS). MCR decomposes the initial data matrix D with n
sample spectra and m data points in the spectra to D = CST + E. The matrices C (n × l) and
S (l × m) represent the concentration and spectra profiles of D for l components, while the
matrix E (n × m) contains the residuals not explained by C and S [119]. MCR-ALS may
deconvolute overlaying spectra from coelution and reconstitute the pure spectra for quan-
titation. A comparison of UR, PLSR, MCR-ALS, and Kernel-PLSR for the quantification of
fragrances using GC-IMS analysis was provided by Brendel and coworkers. For both, a
mixture of geraniol and citral as well as a mixture of the citral and cinnamal, Kernel-PLSR
demonstrated the superior ability for the quantification of the nonlinear relationships of
GC-IMS data since Kernel-PLSR was able to significantly reduce the RE of prediction and
increase R2 of calibration.
3.3. Model Interpretation
Once a robust and reliable model is built, whose predictive abilities are sufficient for
the chosen task, the model should be checked for plausibility. Therefore, the influencing
variables, also referred to as markers, are extracted, identified, and subsequently used for
interpreting and explaining the model. By using PCA for marker extraction, the loadings
obtained by multivariate analysis are projected backwards into the original data space
and are subsequently evaluated either manually or automatically. This allows one to iden-
tify the signals with the main influence for separation in the respective principal compo-
nents with relation to the original data (Figure 3). Another example is the use of PLS-DA,
where volcano plots and variable importance in projection (VIP) analysis have been per-
formed to determine the final markers for each discrimination task [56]. Compounds with
a VIP score > 1 are generally considered as suitable markers [120].
Web-based platforms, such as MetaboAnalyst (http://www.metaboanalyst.ca, ac-
cessed on 1 July 2021) [121] and XCMS Online (https://xcmsonline.scripps.edu/, accessed
on 1 July 2021) [122], are designed to handle comprehensive untargeted metabolomic data.
Compared to GC-MS data, which include m/z information, GC-IMS data are intrinsically
limited to (normalized) drift times and retention times. While MetaboAnalyst has also
been used for the processing of GC-IMS data, including the preprocessing (normalization
and scaling) of data [82], VIP analysis [83], and entire chemometric analysis [123], the lackMolecules 2021, 26, 5457 13 of 23
of m/z information limits the use of these metabolomic data processing tools for com-
pound identification. However, the combination of retention indices and normalized drift
times is considered as a reliable alternative; as in particular, drift times are highly repro-
ducible. By comparing markers obtained from the GC-IMS data to databases, which are
often provided by IMS manufacturers, the substances of interest can be identified
[124,125]. Furthermore, a search of the literature and subsequent confirmation by refer-
ence substances can be used for substance identification [126–128]. Since coelution and
matrix effects can influence GC-IMS data, a common technique is to spike a complex sam-
ple with the pure substance. To increase the number of substances identified and to fur-
ther increase the model’s accuracy, complementary data, such as GC-MS [123], can be
used as described in Section 3.4. This procedure is optional, as reliable models for classi-
fication and quantification tasks can be built solely from HS-GC-IMS data [44,80]. Typi-
cally, these MS detectors are unit-resolved and, as such, again limited in their selectivity
in comparison to high-resolution systems, such as TOF or Orbitrap systems. However, a
full spectral interpretation is not always necessary in NTS approaches. Some studies solely
detect markers without subsequent identification of substances [43,80,84].
Figure 3. Data analysis and backwards projection of loadings for identification of key substances.
NTS is a powerful approach for complex classification and quantification tasks. How-
ever, next to model overfitting, the transferability of a model to new data poses a major
challenge. A dramatic example is given by Contreras and coworkers who analyzed 701
olive oil samples from the years 2014–15 and from 2015–16 for the classification into
EVOO, OO, and LVOO, using HS-GC-IMS with NTS [33]. A model built with olive oil
samples from 2014–15 obtained a prediction percentage of 67.8%. A better prediction suc-
cess was achieved for a model built with olive oil samples from 2014–15 and 2015–16,
obtaining 79.4% accuracy. However, when applying the NTS model built with samples
from the year 2014–15 to predict the years 2015–16, a prediction success of only 36.0% was
achieved, revealing the low transferability of the model. This is however not an effect
solely to be attributed to GC-IMS but rather is a general issue of profiling techniques so
far and is mainly driven by typically high analytical variance together with a high biolog-
ical variance of the samples.
To achieve good predictive abilities and transferability of a model to new data, large
sample sets containing independent and diverse samples are necessary; however, studies
are often limited by sample availability. To overcome this issue and to reveal influencing
factors, a comprehensive evaluation of the model should be performed. The identificationMolecules 2021, 26, 5457 14 of 23
of influencing substances, for instance, may reveal the characteristic compounds or classes
of substances in which the classes differ. A subsequent comprehensive evaluation can de-
termine which factors may be caused by systematic errors and which factors allow for true
differentiation between classes. High predictive accuracies for classification and quantifi-
cation tasks can be achieved without substance identification, yet a comprehensive eval-
uation of the model helps to detect strategic errors, such as a narrow sample distribution,
and thus should always be part of NTS approaches. Due to its robustness and comparably
low prices, HS-GC-IMS is suitable for benchtop profiling. In combination with NTS ap-
proaches, HS-GC-IMS data can be used for the implementation of models, which are suit-
able for classification and quantification task in various fields.
3.4. Complementary Data (Optional)
Due to the complexity of biological matrices, the substance identification with GC-
IMS data alone can be challenging, which is why stand-alone IMS are rarely used to in-
vestigate the sample composition. Complementary techniques, such as GC-MS [129] or 1H
NMR [130], are often used to identify decisive marker substances [131].
Next to marker identification, complementary data can be combined with GC-IMS
data to build a multimodal model. The process of integrating multiple data sources, which
is commonly known as ‘data fusion’, has the potential to increase model accuracy and
reliability, while reducing interferences and error rates [132]. The process of data fusion
is categorized as low-level, mid-level (or intermediate-level), and high-level data fusion,
depending on the fusion strategies used [133]. In low-level (or data-level) fusion ap-
proaches, data from all sources are preprocessed, concatenated into a common data ma-
trix, and subsequently analyzed using classical multivariate methods, such as PCA or PLS
(see Section 3.2). Mid-level data fusion approaches, which are also referred to as feature-
level data fusion, are based on the extraction of relevant features from each data source
separately [87]. Several latent variables, such as the score values from PCA or PLS, are
selected for this feature-based data fusion, concatenated, and subsequently analyzed us-
ing classical multivariate methods. The third fusion approach is high-level or decision-
level data fusion, where completely independent models are calculated from each data
set; this level is the most challenging due to the determination of the ideal parameters for
each separate multivariate model. Careful considerations of parameters, together with the
implementation of a voting or scoring scheme, which prioritizes results from different
data sources, can provide a combined model, which outperforms the individual models
[134].
Schwolow and coworkers showed that the data fusion approach significantly in-
creased both the predictive power and the robustness of the resulting classification model
for the determination of geographical origin of olive oil [81]. The prediction accuracy ob-
tained for Fourier-transform infrared (FT-IR) data alone was 67% and for GC-IMS 78%,
while resulting a perfect score for a low-level data fusion approach using the complemen-
tary chemical information provided by GC-IMS and FT-IR analysis. The extra effort
needed for data fusion approaches, however, is not always rewarded. Gu and coworkers
classified fungal growth on peanut kernels into potentially aflatoxigenic fungi and non-
aflatoxin producing fungal species using HS-GS-IMS and fluorescence measurements
[87]. The predictive accuracy for HS-GC-IMS measurements alone was 93.3% with an
OPLS-DA model, while low-level data fusion reduced the accuracy to 90%. The predictive
accuracy of the OPLA-DA after mid-level data fusion using VIP > 1.3 further decreased to
86.7%. Only a mid-level data fusion using 10 PCs increased the model accuracy to 96.7%.
Another approach to increase the discrimination power of a classification model is
the parallel analysis of IMS and MS, which has recently gained attention for classification
and quantification tasks [90,106,127]. Although IMS and MS cannot be seen as fully com-
plementary methods, in particular due to the identical volatile fraction being monitored
by both techniques [90], it was shown that the soft ionization and drift-time-based ion
separation on the one hand and a hard ionization and m/z-based separation on the otherMolecules 2021, 26, 5457 15 of 23
hand improved substance identification in the case of coelution in hops analysis [127].
While complementary data in general can increase the interpretability and accuracy of a
model developed with HS-GC-IMS, they are optional for NTS via GC-IMS.
4. Comparison of NTS and Targeted Strategies
An alternative approach to NTS is targeted screening. While NTS of HS-GC-IMS data
uses no pre-existing knowledge and the entire spectral fingerprint is subject to data anal-
ysis, for targeted analysis, specific markers are chosen prior to the data analysis. The mark-
ers used for targeted screening can be either handpicked or mathematically determined
[33,135]. One-way analysis of variance (ANOVA), using for example a Tukey’s test, is of-
ten applied to identify volatile compounds which exhibit significant differences, com-
monly quantified at a 5% significance level (p ≤ 0.05) [59]. Various other methods, such as
Gabor filters, local binary pattern, Haar, and histograms of oriented gradients (HOG),
have been proposed for feature extraction [136,137]. Chen and coworkers applied MPCA
and HOG for feature extraction and data reduction of MCC-IMS data, with subsequent
canonical discriminant analysis for the generation of nonlinear boundaries, for the suc-
cessful quantification of the adulteration degree of canola oil. A predictive accuracy of
more than 95.2% was reported for a PLS model, which was obtained using a train–test
split of 70–30 [99]. Using targeted approaches and applying PCA-kNN, the same authors
reported a successful classification of rapeseed oils according to their quality (grade 1–4)
and a successful determination of vegetable oil according to its botanical origin (sesame
oil, rapeseed oil, and camellia oil). For the classification of the rapeseed oil quality, the
colorized differences method was applied to CC-IMS data, resulting in 34 peaks of interest
and a predictive accuracy of 100% [138]. Furthermore, Otsu’s method and colorized dif-
ferences method was used for automatic peak detection, resulting in 88 peaks of interest
and a predictive accuracy of 98.3% for the classification of vegetable oil using MCC-IMS
data [139]. The advantage of preselecting markers with significant differences is the sim-
ultaneous reduction of noise in the data, which, however, includes the risk of overlooking
valuable information.
NTS approaches (spectral fingerprinting) have also been directly compared to tar-
geted approaches (extraction of specific markers) for the analysis of IMS data. Garrido-
Delgado and coworkers compared targeted and NTS approaches for the classification of
olive oil into EVOO, OO, and LVOO, using data obtained by MCC coupled to IMS [78]. A
PCA-LDA model was used for data reduction and data clustering, followed by kNN (k =
3) for classification, obtaining a prediction percentage of 79% for the targeted strategy and
85% for NTS strategy. For the classification of olive oil harvested in 2014–15, Contreras
and coworkers obtained a prediction percentage of 56.9% for the targeted strategy and
67.8% for the NTS strategy [33]. An improved prediction success was achieved for models
built with olive oil samples from 2014–15 and 2015–16, obtaining 74.3% for the targeted
strategy and 79.4% for the NTS, hence suggesting superior abilities of the NTS approach
versus the selection of specific markers. By contrast, the authors also reported that a tar-
geted model built with samples from the years 2014–15 (prediction success of 51.6%) was
superior to the NTS approach (prediction success of 36.0%) when applied to the years
2015–16. Both models built with the data from the years 2014–15 show weak prediction
abilities for the prediction of samples from the following year, revealing some fundamen-
tal challenges in data science: the predictive ability of a model is highly dependent on the
number of samples as well as on the sample diversity. Both approaches include the risk
of overfitting to a specific problem [33].
Arroyo-Manzanares and coworkers likewise obtained superior classification accu-
racy using HS-GC-IMS for a model based on a targeted marker selection (100%) compared
to a model based on the whole spectral fingerprint (90%) for the distinction between dry-
cured Iberian ham from pigs fattened on acorns and pasture or on feed [89]. However, the
model based on marker selection was built using OPLS-DA, while kNN (k = 3) and PCA-
LDA were used for the model based on spectral fingerprints; hence, the differences in theYou can also read