Linked thick- to thin-skinned inversion in the central Kirthar Fold Belt of Pakistan - Solid Earth
←
→
Page content transcription
If your browser does not render page correctly, please read the page content below
Solid Earth, 10, 425–446, 2019
https://doi.org/10.5194/se-10-425-2019
© Author(s) 2019. This work is distributed under
the Creative Commons Attribution 4.0 License.

Linked thick- to thin-skinned inversion in the central
Kirthar Fold Belt of Pakistan
Ralph Hinsch1 , Chloé Asmar1 , Muhammad Nasim2 , Muhammad Asif Abbas2 , and Shaista Sultan2
1 OMV   Upstream, Exploration, Vienna, 1020, Austria
2 OMV   (Pakistan) Exploration GmbH (subsidiary of United Energy Group Limited), Islamabad, Pakistan

Correspondence: Ralph Hinsch (ralph.hinsch@omv.com)

Received: 17 December 2018 – Discussion started: 18 December 2018
Revised: 21 February 2019 – Accepted: 6 March 2019 – Published: 22 March 2019

Abstract. The Kirthar Fold Belt is part of the transpressive         tion front, forming a large fault-propagation fold. Shortening
transfer zone in Pakistan linking the Makran accretionary            within the studied sections is calculated to be 18 %–20 %.
wedge with the Himalaya orogeny. The region is deforming                The central Kirthar Fold Belt is a genuine example of a
very obliquely, nearly parallel to the regional S–N plate mo-        hybrid thick- and thin-skinned system in which the paleo-
tion vector, indicating strong strain partitioning. In the central   geography controls the deformation. The locations and sizes
Kirthar Fold Belt, folds trend roughly N–S and their struc-          of the former rift faults control the location and orientation of
tural control is poorly understood. In this study, we use newly      the major folds. The complex tectonostratigraphy (rift, post-
acquired 2-D seismic data with pre-stack depth migration,            rift, flexural foreland) and strong E–W gradients define the
published focal mechanisms, surface and subsurface geolog-           mechanical stratigraphy, which in turn controls the complex
ical data, and structural modelling with restoration and bal-        thin-skinned deformation.
ancing to constrain the structural architecture and kinematics
of the Kirthar Fold Belt.
   The central Kirthar Fold Belt is controlled by Pliocene
to recent linked thick-skinned to thin-skinned deformation.          1   Introduction
The thick-skinned faults are most likely partially inverting
rift-related normal faults. Focal mechanisms indicate dip-           The external regions of fold–thrust belts are typically in-
slip faulting on roughly N–S-trending faults with some dip           terpreted using templates from classical thin-skinned thrust-
angles exceeding 40◦ , which are considered too steep for            related deformation. However, more and more thrust belts are
newly initiated thrust faults. The hinterland of the study area      interpreted as showing a strong influence of linked basement-
is primarily dominated by strike-slip faulting. The inverting        involved deformation (Lacombe and Bellahsen, 2016, and
faults do not break straight through the thick sedimentary           references therein). The inversion of inherited rift faults is
column of the post-rift and flexural foreland; rather, the in-       one possibility of thick-skinned contribution in a thrust belt.
version movements link with a series of detachment hori-             Furthermore, the direct linkage of inverting basement faults
zons in the sedimentary cover. Large-scale folding and layer-        to thin-skinned thrusts in the external parts of orogens (hy-
parallel shortening has been observed in the northern study          brid thick- and thin-skinned system) has received more at-
area. In the southern study area progressive imbrication of          tention recently (e.g. Giambiagi et al., 2008; Fuentes et al.,
the former footwall of the normal fault is inferred. Due to the      2016; Mahoney et al., 2017).
presence of a thick incompetent upper unit (Eocene Ghazij               As an outcome of structural investigations for hydrocar-
shales) these imbricates develop as passive roof duplexes. In        bon exploration we are able to report a well-constrained ex-
both sectors the youngest footwall shortcut links with a major       ample of linked thin-skinned to thick-skinned deformation
detachment and the deformation propagates to the deforma-            at the deformation front of the central Kirthar Fold Belt in
                                                                     Pakistan. This example illustrates the kinematic linkage be-
                                                                     tween inverting deep-reaching faults and the associated thin-

Published by Copernicus Publications on behalf of the European Geosciences Union.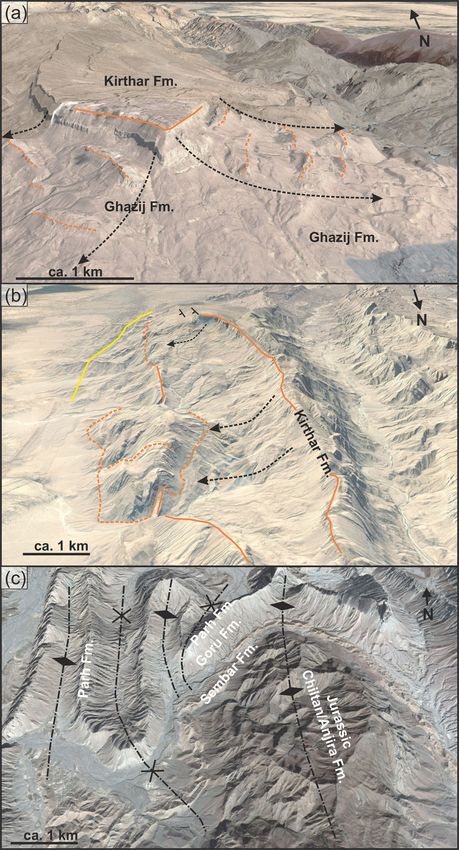
426                                                                        R. Hinsch et al.: Inversion in the central Kirthar Fold Belt

                                                                            plate structural models to interpret in areas of poor seismic
                                                                            image resolution.
                                                                               In this study we use observations from surface geology
                                                                            (fieldwork, Google Earth) and subsurface data (recent 2-D
                                                                            seismic surveys and well data) to constrain the structural
                                                                            style and kinematics of the central Kirthar Fold Belt.
                                                                               We use seismic interpretation, section analysis techniques,
                                                                            kinematic forward modelling and regional constraints to nar-
                                                                            row structural solutions and develop a most likely struc-
                                                                            tural model. Based on the resulting balanced cross sections
                                                                            through the area, we conclude that the central Kirthar Fold
                                                                            Belt is driven by thick-skinned inversion linked with thin-
                                                                            skinned deformation further toward the foreland. The thin-
                                                                            skinned deformation pattern is dominated by folding with
                                                                            no major thrusts cutting through these structures. The key
                                                                            controlling parameters for the deformation in this area are
                                                                            the pre-existing structures and the mechanical stratigraphy,
                                                                            which is itself a result of the paleo-evolution.

Figure 1. Simplified structural sketch of the wider Kirthar Fold
Belt area on a shaded relief map. Location is indicated in the              2     Regional setting
inset map. The approximate plate motion is from Mohadjer et
al. (2010). Locations of sections in Fig. 2 are indicated: a: Jadoon        2.1    Structural setting
et al. (1992), b + c: Banks and Warburton (1986), d: Szeliga et
al. (2009), e: Fowler et al. (2004), f: Schelling (1999), g: this study.    The wider Kirthar Range area is situated on the lateral plate
                                                                            boundary of India. The India–Pakistan plate is moving in
                                                                            a northward direction relative to Eurasia (Mohadjer et al.,
                                                                            2010, Fig. 1), placing the margin in an overall setting of
skinned deformation; it also shows how this hybrid system is                left-lateral transpression. The Chaman Fault, a large-scale
strongly controlled by its paleostructural (extension–rift) and             strike-slip fault, is considered to represent the lithospheric
paleogeographic (mechanical stratigraphy) inheritance.                      plate boundary (transform fault) in this lateral collision zone
   The Kirthar Fold Belt belongs to the western fold belts in               (Lawrence et al., 1981; Bannert et al., 1992). East of the plate
Pakistan, which is a zone of strike-slip faults and fold belts              boundary, a 150–200 km wide deformation zone is present
along the western lateral boundary of the Indian Plate linking              (Bannert et al., 1992; Szeliga et al., 2009; Figs. 1, 2). Strain
the Himalaya orogen with the Makran accretionary wedge                      partitioning is active (see Szeliga et al., 2009, and references
(Lawrence et al., 1981; Bannert et al., 1992, Fig. 1). The                  therein), documented by the presence of strike-slip faults as
northern Kirthar Fold Belt, as well as the Sulaiman Moun-                   well as folds and thrusts (Fig. 1). This deformation is also re-
tains to the north of it, had been traditionally interpreted with           flected in the distribution of seismically active faults, which
classical fold–thrust belt geometries with an implied shorten-              show strike-slip deformation mainly towards the hinterland
ing magnitude of 30 %–40 % (Banks and Warburton, 1986;                      and dip-slip reverse faults close to the deformation front
Humayon et al., 1991; Jadoon et al., 1992, 1993; Fig. 2a–                   (Fig. 3; see also Reynolds et al., 2015).
c; see location examples in Fig. 1). In contrast, the southern                 Most publications on the structural style of the Sulaiman
Kirthar Fold Belt had been field investigated (Smewing et                   and Kirthar ranges describe these to be thin-skinned fold–
al., 2002a) and modelled (Fowler et al., 2004) with the con-                thrust belts. Initially, a passive roof duplex style of deforma-
clusion that the deformation in the belt is dominated by in-                tion was attributed to these fold belts (Banks and Warburton,
version tectonics (Fig. 2e) with an estimated shortening of                 1986; Jadoon et al., 1992; Fig. 2a–c). The associated per-
approximately 17 %.                                                         centage of shortening accommodated by such a thrust- and
   The reported contrasting styles of deformation in the                    duplex-dominated deformation was valued to be of the or-
Kirthar Fold Belt would imply significant and potentially                   der of 37 %, estimated for a section through the Sulaiman
implausible along-strike variation in the shortening magni-                 Lobe (Jadoon et al., 1992). Jadoon et al. (1992) propose the
tudes. In order to understand how deformation is accommo-                   same structural style for the northern Kirthar Belt. For the
dated along this lateral plate boundary, adequate estimations               frontal part of the southern Kirthar Fold Belt, thin-skinned
on shortening are essential. Furthermore, constraining the                  fold–thrust styles have been constructed based on fieldwork
deformation style is fundamentally important for the explo-                 (Schelling, 1999; Fig. 2f; see approximate location in Fig. 1).
ration of resources, as seismic interpreters usually use tem-               In contrast, Smewing et al. (2002a) infer, based on fieldwork,

Solid Earth, 10, 425–446, 2019                                                                          www.solid-earth.net/10/425/2019/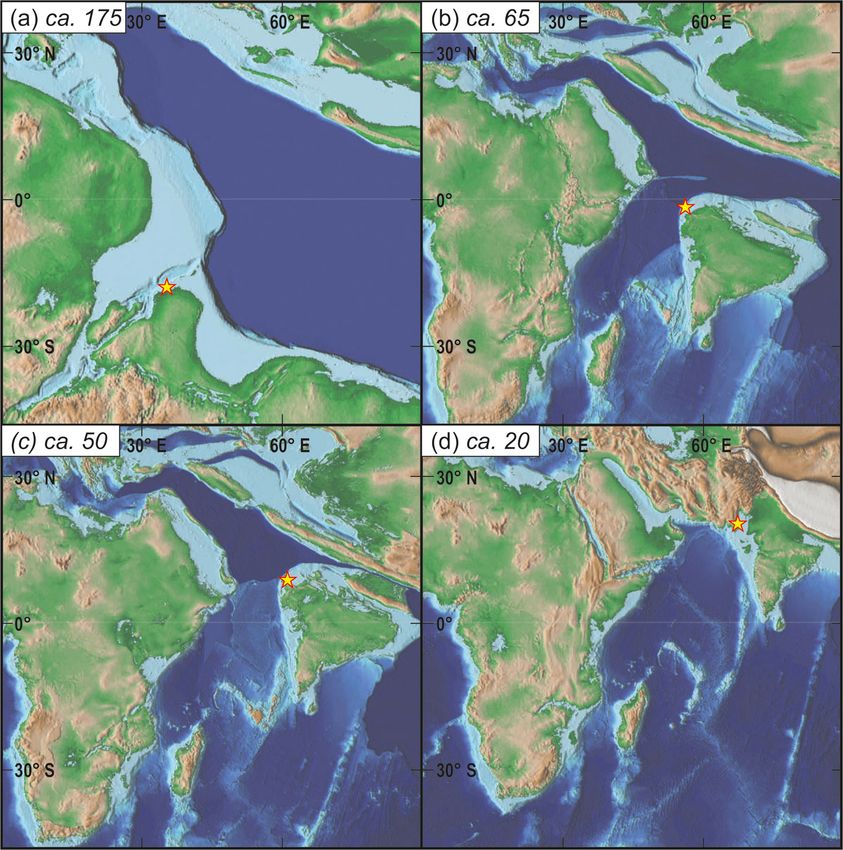
R. Hinsch et al.: Inversion in the central Kirthar Fold Belt                                                                                 427

Figure 2. Selected sections in the southern western fold belt of Pakistan (for section locations see Figs. 1, 3). (a) After Jadoon et al. (1992),
(b, c) after Banks and Warburton (1986), (d) after Szeliga et al. (2009); red line indicates the approximate shape of the fault considered
responsible for the 1931 Mach event. (e) After Fowler et al. (2004), (f) after Schelling (1999), (g) this study; the frontal part (strong colours)
is a slightly projected section elaborated for the northern sector of this study area. The western part is a tentative regional sketch section
based on the geological map of Bannert et al. (1992), as shown in Fig. 3. G.F.: Ghazeraband fault. (h) Average topography of a 20 km wide
section centred on the trace of (g) with 5 times vertical exaggeration.

that the southern Kirthar Fold Belt is dominated by the in-                situation that persisted until the onset of Triassic to Jurassic
version of Jurassic normal faults. Also based on fieldwork                 rifting (Smith, 2012; Scotese, 2016; see the Jurassic time step
and seismic interpretations, Fowler et al. (2004)model the                 in Fig. 5a). Northern Pakistan was positioned at the northern
southern Kirthar Fold Belt as inversion deformation. Their                 margin of Gondwana facing the Paleo-Tethyan Ocean. Salt
sections show shortening on detachment horizons in the sed-                deposits formed along the Gondwana margin in sub-basins,
imentary cover, but the kinematic link between the shorten-                which are present and observable in the Zagros Hormuz Salt
ing in the basement and in the cover remains conceptual and                and the Salt Range Formation of northern Pakistan (Kadri,
partly unclear (Fig. 2e).                                                  1995; Smith, 2012). It remains unknown whether deposits
                                                                           (with or without salt) from this period are present in the sub-
2.2   Tectonostratigraphic evolution                                       surface of the study area. Further north in Pakistan, Cambrian
                                                                           sediments are overlain unconformably by Permian strata, and
                                                                           it is not certain whether or not the intervening systems were
The known stratigraphic section in the study area spans from
                                                                           deposited and later eroded (Kadri, 1995). During the late Per-
the Triassic to recent times (from outcrop and wells; Fig. 4);
                                                                           mian, the Paleo-Tethys was at its widest, indicating ongoing
however, older sediments are known along the western mar-
                                                                           drifting in the ocean. The passive margin of northern Pakistan
gin of the Indian Plate. During the late Precambrian and early
                                                                           was tectonically quiescent with shallow marine to paralic
Paleozoic, the Indo-Pakistan plate was part of Gondwana, a

www.solid-earth.net/10/425/2019/                                                                            Solid Earth, 10, 425–446, 2019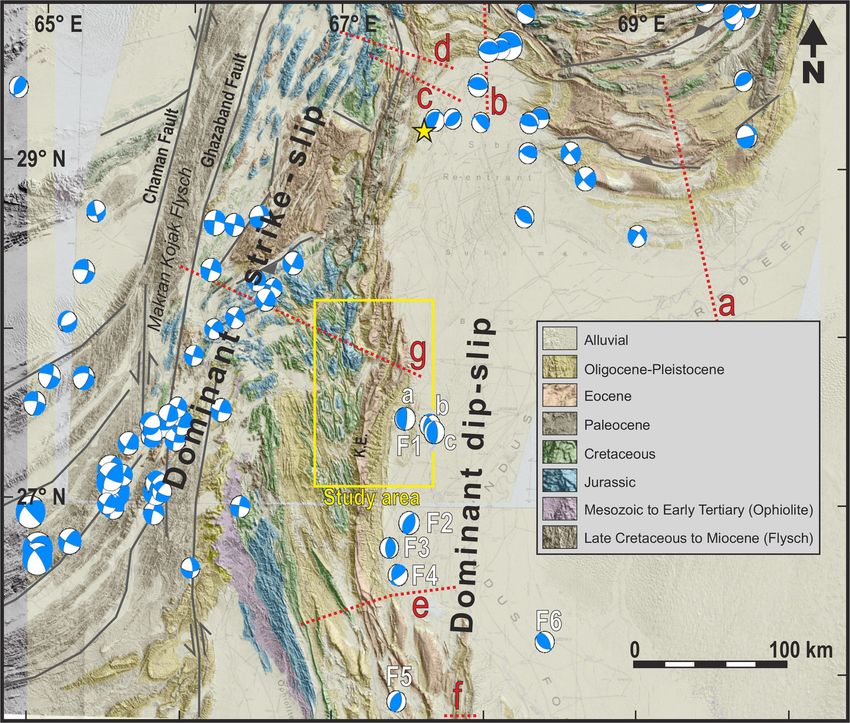
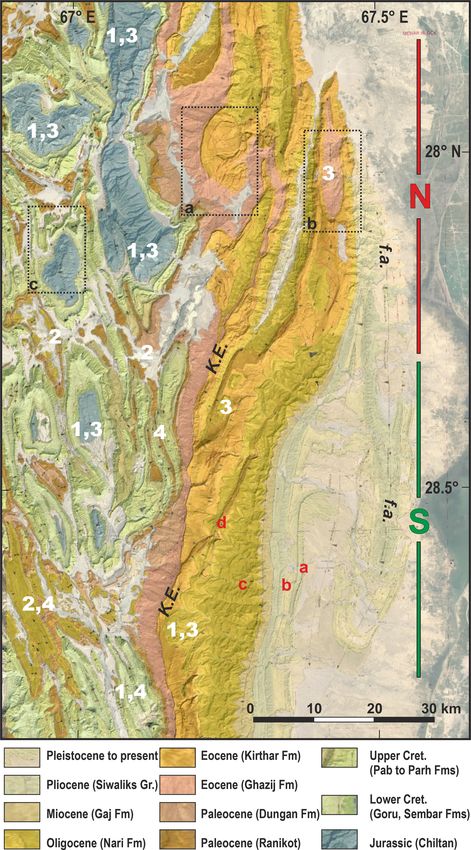
428                                                                      R. Hinsch et al.: Inversion in the central Kirthar Fold Belt

Figure 3. Nodal planes from the International Seismological Centre (2015) database, DEM with draped geological map after Bannert et
al. (1992) and selected structural elements. Location of the figure is indicated in Fig. 1. Dotted red lines are locations of sections in Fig. 2.
Labelled events are listed in Table 1. Yellow star marks the 1931 Mach event after Szeliga et al. (2009). K.E.: Kirthar Escarpment.

conditions prevailing up to the Late Triassic (Kadri, 1995).               from wells in the study area. We interpret the deep water–
The break-up of Gondwana, which formed the Indian and                      shallow water relationship of the Anjira–Chiltan limestones
the Afghanistan–Arabia–Africa plates, developed in Triassic                as an expression of a hinge zone related to differential post-
and Jurassic times (see Jurassic time step, Fig. 5a); however,             rift subsidence. The unconformity on top of the Chiltan lime-
the exact timing for rifting in the vicinity of the study area             stones is interpreted as break-up unconformity (Smewing et
seems uncertain.                                                           al., 2002b). Wandrey et al. (2004) consider Jurassic or earlier
   Kadri (1995) reports that from the Middle Triassic on-                  extensional tectonics and failed rifting along the Indus River
wards the sedimentation on both sides of the Paleo-Tethys                  to contribute to buried horst-and-graben structures and the
suture is different. In general the Triassic mixed successions             division of the greater Indus Basin into three sub-basins. The
of shallow marine clastics and carbonates are grouped in the               top of the Jurassic strata is marked by a basin wide uncon-
Alozai Group or Wulgai Formation (Kadri, 1995). Contin-                    formity (Wandrey et al., 2004; Smewing et al., 2002b). The
ued rifting is interpreted for the Lower Jurassic deepwater                slightly contradicting reported times for Triassic–Jurassic
Shirinab Formation (which can be separated into three mem-                 rifting could either be the result of several pulses of rifting
bers: Springwar, Loralai and Anjira; see Fig. 4). Smewing                  related to the break-up of Gondwana or an interpretational
et al. (2002a) find evidence for Early Jurassic normal fault-              uncertainty.
ing due to syn-kinematic debris flows and slumping in the                     The Cretaceous sediments are interpreted to have been de-
Lower Jurassic Shirinab Formation. Smewing et al. (2002b)                  posited on a westward-sloping Indian shield (Kadri, 1995)
placed the rift in the Kirthar area in the Early to Late Juras-            in the drift phase (see Fig. 5b). Large deltas prograded from
sic time (Fig. 5a), mainly marked by the successive drown-                 the emergent Indian continent, depositing the shaly to sandy
ing of the Springwar sandstones and mudstone cycles fol-                   Sembar and Goru formations in the middle Indus Basin
lowed by the pelagic Loralai and Anjira members, as well                   (MIB) and shedding turbidites into the Kirthar Fold Belt area
as the limestones of the Chiltan Formation. The pelagic An-                (Fowler et al., 2004). Portions of the Indian shield were up-
jira limestones are replaced eastward with the thickly bed-                lifted during the Cretaceous, which is partly related to the
ded limestones of the Chiltan Formation. East of the Kirthar               plate passing over an active mantle hotspot (Eschard et al.,
Escarpment, the pelagic Anjira limestones are not known                    2004); this generated unconformities towards the interior of

Solid Earth, 10, 425–446, 2019                                                                          www.solid-earth.net/10/425/2019/
R. Hinsch et al.: Inversion in the central Kirthar Fold Belt                                                                          429

                                                                       Figure 5. Paleogeographic evolution of the study area as part of
                                                                       the Indian Plate since the Jurassic. (a) Jurassic, ca. 175 million
                                                                       years; a rift evolves northwest of the approximate study area lo-
                                                                       cation (star; map from Scotese, 2014a). (b) At ca. 65 million years,
                                                                       Cretaceous–Paleocene, drifting northward. A strip of emergent land
                                                                       (likely an intra-oceanic arc) is visible north of the approximate
                                                                       study area location (map from Scotese, 2014b). (c) At ca. 50 mil-
Figure 4. Lithostratigraphic overview with mechanical stratigraphic    lion years, Eocene, post-ophiolite obduction, but pre-collision with
interpretations (after Kadri, 1995; Tectostrat, unpublished, 2001;     Eurasia (map from Scotese, 2014c). (d) At ca. 20 million years,
Smewing et al., 2002b; and author observations). S.H.: seismic hori-   Miocene, early collision stage with flexural foreland stage (map
zons used in this study.                                               from Scotese, 2014c).All background images (a)–(d) copyright by
                                                                       the PALEOMAP Project/Christoopher R. Scotese.

the continent. The Cretaceous strata thin strongly towards
the Jakobad High, which is an intra-basinal high in the In-            carbonate depositions (e.g. Dungan Formation; Fig. 4). The
dus Basin (Kadri, 1995) northeast of our study area. The in-           northwest corner of the Indian Plate started to collide with
ternal structuration of the Indus Basin is interpreted as re-          Eurasia during the Eocene (Fig. 5c). The remaining segment
licts of a failed rift (Zaigham and Mallick, 2000; Wandrey et          of the Tethys Ocean narrowed further and eventually com-
al., 2004). Mixed clastic and carbonate deposits represent the         pletely closed. In the study area this phase is represented by,
Upper Cretaceous succession, consisting of the Parh, Mughal            on one side, carbonate deposits on the shelf edge (Laki For-
Kot and Pab Formation (Fig. 4). Island arc collision and ophi-         mation, Sui Main limestone; Fig. 4) and, on the other, a west-
olite obduction occurred on the northwestern margin of the             ward rapidly deepening basin filled partly with shales and
Indian Plate during the Paleocene (Khan et al., 2009). The             siliciclastic deposits shed from the N-NW (Ghazij Forma-
Muslim Bagh and Bela ophiolites were obducted onto the                 tion; Wandrey et al., 2004; Ahmad et al., 2012). For the study
Indian margin (an island arc is anticipated northwest of the           area Ahmad et al. (2012) observe a dramatic east-to-west
drifting Indian Plate in Fig. 5b). Obduction of these ophi-            thickness increase in the Ghazij Formation from thin layers
olites onto the Indian continental margin in western Pak-              of shale (in a well on the frontal anticline) to about 1000 m
istan is stratigraphically constrained between the late Maas-          thickness (outcrop section) in the area west of the Kirthar
trichtian and early Eocene (between ca. 67 and ca. 50 Ma;              Escarpment within less than 40 km of distance. A final and
Khan et al., 2009, and references herein). Likely as a result          short switch back to slightly more quiet conditions is indi-
of this obduction, the shelf basin deepened and received more          cated by the deposition of the Kirthar Formation (limestones
clastic influx. Local inversion movements are considered to            with intercalated shales). During the Oligocene and lower to
be responsible for the presence of erosional unconformities.           middle Miocene, the Indian Ocean coastline gradually mi-
Subsequent quiescent phases are represented by widespread              grated southward in the foreland basin and marine condi-

www.solid-earth.net/10/425/2019/                                                                      Solid Earth, 10, 425–446, 2019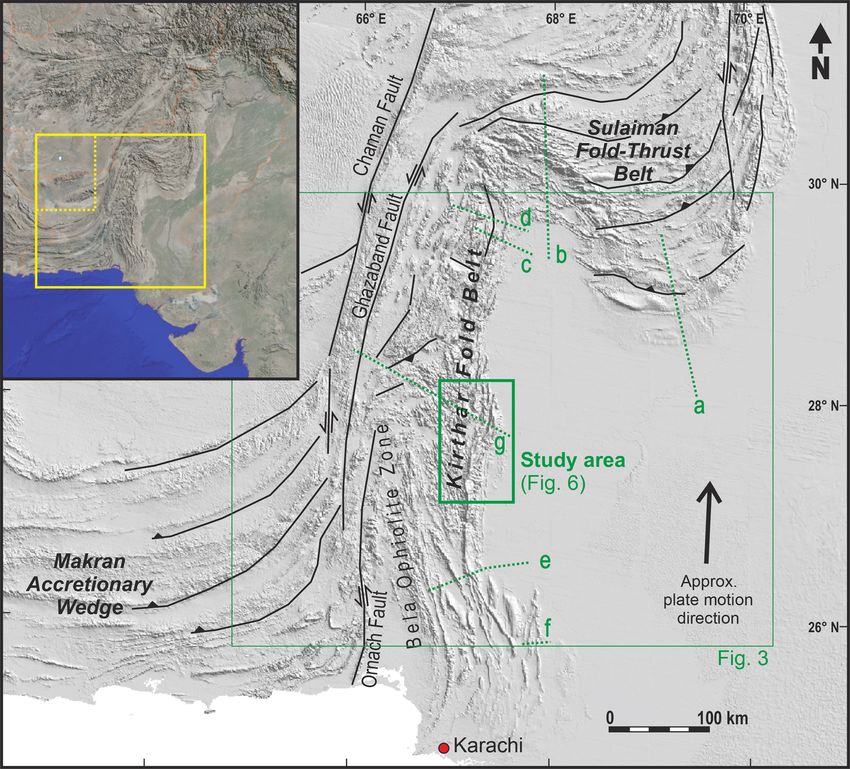
430                                                                 R. Hinsch et al.: Inversion in the central Kirthar Fold Belt

tions were progressively replaced by continental conditions
(Fig. 5d). Marine conditions prevailed in the study area until
early–middle Miocene times and are represented by shallow
marine carbonates, clastics and shales of the Oligocene Nari
Formation and the mid-Miocene Gaj Formation (Fig. 4). In
the late Miocene to Pliocene the collision between India and
Eurasia resulted in the uplift of the main Himalaya and enor-
mous quantities of clastic material reached the lower Indus
Basin (i.e. Siwaliks Group; Fig. 4). During this time, trans-
pressive deformation along the western plate margin propa-
gates onto the lower Indus Basin. Recent ongoing deforma-
tion in the study area and regional uplift lead to erosion rather
than deposition. Sediments along the Indus are bypassing the
foreland into the Indian Ocean.

2.3    Mechanical stratigraphy

The behaviour of the sedimentary column when deformed is
defined by its mechanical stratigraphy, which itself is the re-
sult of the tectonostratigraphic evolution. The formations de-
posited on the shelf margin during the drift phase are located
in our study area. The presence of a long-lived hinge zone in
the study area results in an E–W proximal–distal sedimen-
tological relationship of having successively more incom-
petent layers present towards the west. Several detachment
horizons can be interpreted in the stratigraphic succession
(Fig. 4, right column). A colour code indicates if a certain
level is interpreted as detachment based on field or seismic
observations and/or modelling.

3     Remote fieldwork

The core study area covers the area east of the Kirthar Es-
carpment (a morphological cliff at the western limit of ex-          Figure 6. Semi-transparent lithostratigraphic map (modified after
posed Kirthar limestones; Fig. 6), where seismic data are            Tectostrat, unpublished, 2001) of the study area draped in Google
                                                                     Earth. Dotted rectangles with labels a, b, c indicate approximate
available. There, only Cenozoic rocks are outcropping and
                                                                     areas seen in slanted view in Fig. 7a–c. Red labels in (a–d) indi-
were partly investigated by fieldwork. The area west of the
                                                                     cate locations of field photographs in Fig. 8. Northern and southern
Kirthar Escarpment, where older rocks crop out, was not ac-          sectors of the fold belt are indicated by bold red and green lines, re-
cessible due to security reasons. Therefore, the western area        spectively. Bold white numbers indicate examples for 1: structural
was investigated by remote methods: observations in Google           highs, 2: structural lows, 3: long-wavelength anticline, and 4: short-
Earth and remote assessment of bedding attitude data.                wavelength folding. K.E: Kirthar Escarpment, f.a.: frontal anticline.

3.1    Remote fieldwork using Google Earth

Google Earth was utilized to investigate structures in the           young, ongoing deformation is a gravitationally triggered
study area on a broad and detailed scale. A quality check of         mass movement that is a result of the competency contrast
the data from Google Earth revealed that images from 2010–           and rapid erosion of the soft shales. These shales reach sev-
2014 fit best to the digital elevation model (DEM) (fewer            eral hundred metres of thickness east of the Kirthar Escarp-
draping effects and least offset from the DEM).                      ment. Similarly, but a bit more challenging to observe, is the
   Figure 7 shows several examples from the virtual field-           gravity sliding on the large anticline in the northern part of
work with a few important observations on the deformation            the study area (Fig. 7b). There, slabs of Kirthar limestones
and mechanical stratigraphy for the study area. The strong           (forming part of the roof of the anticline) have collapsed
mechanical contrast between the Eocene Kirthar limestones            across the partly eroded forelimb. As a consequence, sub-
and the Eocene Ghazij shales is demonstrated by young grav-          horizontal Kirthar limestone beds are superposed over the
ity bookshelf faulting along an escarpment (Fig. 7a). This           steep to partly overturned younger beds of the forelimb. Sim-

Solid Earth, 10, 425–446, 2019                                                                    www.solid-earth.net/10/425/2019/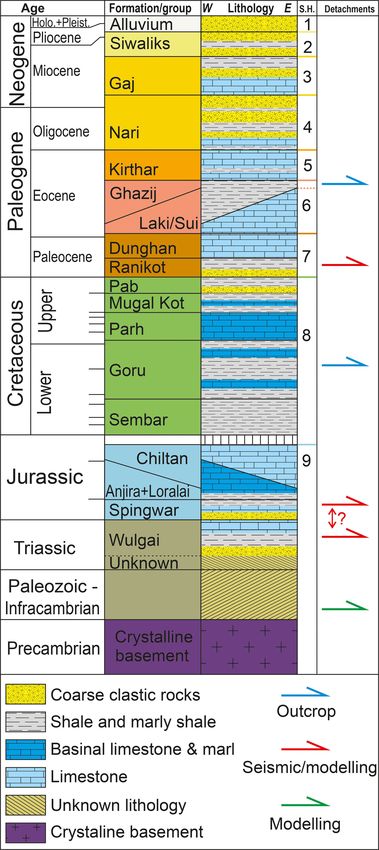
R. Hinsch et al.: Inversion in the central Kirthar Fold Belt                                                                        431

ilar features have been observed in numerous examples in the
Zagros in Iran (Harrison and Falcon 1934, 1936). A potential
sequence of the landslide evolution after the mechanism sug-
gested by Harrison and Falcon (1934, 1936) is shown in Sup-
plement Fig. S1 along with an alternative solution. One of the
main requirements for the landslide solution is the presence
of a thick weak layer underneath the Kirthar limestone that
can act as a décollement. Further to the south (towards the
background in Fig. 7b) the Kirthar beds represent the hinge
zone of the anticline. There, extensional faults are visible, in-
cluding relay ramps and other associated features which also
demonstrate the young gliding motion of the limestones on
top of the soft Ghazij shales towards the east onto the eroded
forelimb.
   One example of the deformation style west of the Kirthar
Escarpment is shown in Fig. 7c. Jurassic limestones and
younger strata are partly folded on different wavelengths
(disharmonic folding). The large, dark, gentle anticline con-
sists of Jurassic basinal limestones. Bright limestones on the
ridges of the higher-frequency folds are from the Cretaceous
Parh Formation. The required decoupling and ductile defor-
mation between those layers is located in the Goru Forma-
tion, known to consist of soft shales.
   Consequently, the observations indicate potential décolle-
ment horizons in the Ghazij and Goru Formation, as indi-
cated in Fig. 4.

3.2   Remote fieldwork to assess bedding attitude data

In addition to the observations done in Google Earth, we used
the “three-point method” to obtain additional measurements
of bedding dip and strike. We used a high-resolution DEM
and draped satellite images to calculate bedding dip and dip        Figure 7. Example for remote fieldwork with Google Earth. Loca-
direction data from three digitized points that are located on      tions of the views are indicated in Fig. 6. (a) Recent mass wasting:
                                                                    blocks of Kirthar limestones glide down the eroded flanks of soft
a considered geological plane. The quality and level of detail
                                                                    Ghazij Formation; (b) sub-recent to recent mass wasting: a large
that can be achieved is highly dependent on the quality and         slab of Kirthar limestones from the anticline roof is slumped over
resolution of the input data and the outcrop conditions. We         the forelimb of the anticline (see Fig. S1). In the background exten-
used a 30 m horizontal resolution SRTM DEM (Jarvis et al.,          sional faults are visible in the Kirthar limestones representing the
2008) and Landsat 7 images (Landsat 7 image courtesy of the         roof of the anticline. The limestones partly glide over the vertical
U.S. Geological Survey). Measurements were only created             beds of the forelimb. (c) Disharmonic folding: Jurassic rocks show
in areas with univocal identification of large-scale bedding        large-wavelength folding, while the hard limestones of the Creta-
planes. A quality check of the generated data and compari-          ceous Parh Formation are folded in smaller wavelength and higher
son to locally existing field measurements show that bedding        frequency. A weak décollement zone is located in the Goru shales.
strike is generally very reliable, whereas the bedding dip re-
sults may partly be underestimated.
                                                                    due to the outcrop conditions under which recent outcrop
3.3   Fieldwork                                                     degeneration was present, but small alterations of the dom-
                                                                    inant dip of the limbs of the large-scale structure have been
The fieldwork focused on collecting bedding dip data to             observed, possibly a result of internal thickening within the
supplement existing data and to partly quality-check the re-        formation caused by space problems in the inner part of the
motely assessed data. Furthermore, the style of deformation         folds. The necessary flexural slip has been documented even
as observable at the field scale was investigated. Sub-recent       in the very young, likely Pleistocene sediments. Figure 8b
sediments (Pleistocene to present) are tilted (Fig. 8a), be-        shows striations on bedding planes in sandy beds of a tilted
ing part of the large-scale fold–flexure in the southern sec-       sandstone–conglomerate succession (location Fig. 6, point
tor (Fig. 6, point a). Changes in dip are primarily apparent        b). In rare cases small-scale (e.g. Fig. 8c) and medium-scale

www.solid-earth.net/10/425/2019/                                                                    Solid Earth, 10, 425–446, 2019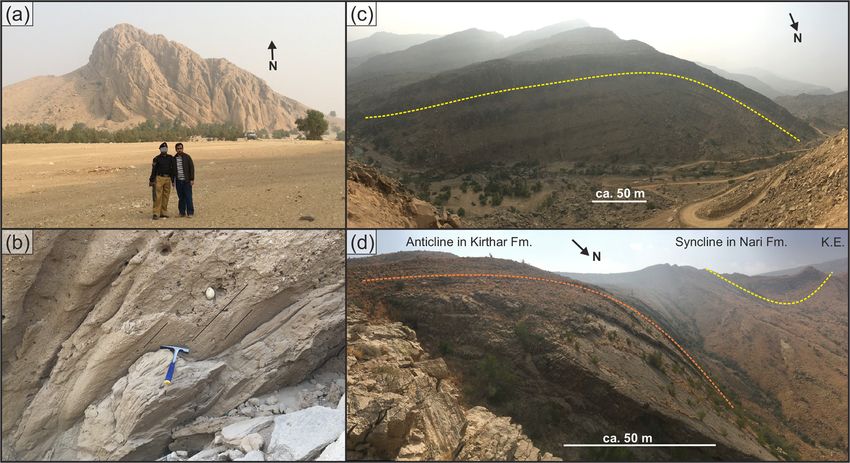
432                                                                   R. Hinsch et al.: Inversion in the central Kirthar Fold Belt

Figure 8. Examples for observations from fieldwork. (a) Sub-recent conglomeratic sediments are folded and eroded. (b) Striations on
a bedding plane in (Pleistocene?) conglomerates indicating flexural slip folding. (c) Small-scale anticline in Nari Formation rocks. The
amplitude and wavelength of the fold suggest that the lower detachment horizon is likely in the lower Nari Formation. (d) Small- to medium-
scale folding in the Kirthar and Nari Formation. The fold is a mappable feature (see Fig. 6) and indicates a detachment horizon below the
Kirthar limestones.

(e.g. Fig. 8d) folds were observed (locations in Fig. 6, point          the Eocene Kirthar limestones (see Fig. 4) is indicated on lo-
c and d, respectively). These folds are interpreted to reflect          cations where well or seismic data unambiguously allow for
higher-order folds caused by local accommodation of space               that interpretation or where it is constrained by surface ge-
problems in relation to the large-scale folding.                        ology (Fig. 9, orange interpretation). The top of the Kirthar
                                                                        limestones is one of the most characteristic features in the
                                                                        seismic data. It is represented by a strong, continuous reflec-
4   Seismic interpretation and analysis                                 tor on top of a package of weaker reflectors with good conti-
                                                                        nuity. In the following section, a brief description of the main
The frontal-most anticline (Fig. 6) hosts several gas conden-           structures at the level of the Kirthar limestones is given and
sate fields and is partly covered by 2-D seismic and at least           structures in areas of good seismic image quality are anal-
one 3-D seismic cube. From 2014–2017 two new 2-D seis-                  ysed.
mic surveys were acquired west of this frontal anticline. For
confidentiality reasons we are unable to show the exact lo-             4.1   Northern sector
cations of the seismic lines and the well data. However, we
subdivided the area into a northern and a southern sector               In the northern sector, the undeformed foreland is marked by
(Fig. 6) and use two representative W–E-oriented compos-                approximately horizontal reflectors (Fig. 9a, point a). Sub-
ite seismic sections to discuss the structural differences of           horizontal seismic reflectors indicate the presence of sedi-
these sectors (Fig. 9). The seismic surveys have up to 6 km             mentary rocks to at least 8 km of depth. A minor anticlinal
horizontal of spread for up to 240 folds and utilized dynamite          feature (Fig. 9a, point b) and a more pronounced anticline
as the source. Processing of the lines in Fig. 9 is to pre-stack        (Fig. 9a, point d) are separated by a zone of discontinuous
depth migration (PSDM). These seismic lines have been tied              reflectors (Fig. 9a, point c) that is interpreted as a fault off-
to the existing seismic data and wells for stratigraphic con-           setting the Kirthar limestone. More details on these frontal
trol. Stratigraphic control on the lines is given by wells on the       structures are depicted in the growth strata imaged on a time-
frontal anticline or in the foreland via a grid of existing 2-D         domain seismic section nearby (Fig. 10).
lines or the 3-D seismic cube. Based on these data robust                  The interpreted growth strata packages a and b show west-
grids of Oligocene to Cretaceous (Jurassic partly) horizons             ward thinning and onlap and thus a pattern of apparent pro-
exist along the frontal anticline and the undeformed foreland.          gressive limb rotation. The seismic interpretation at depth in-
Horizons are indicated in the undeformed foreland in Fig. 9             dicates a thrust fault (thrust 1 in Fig. 10a). There is no addi-
and in the stratigraphic column (Fig. 4).                               tional thin-skinned deformation east of the tip of the wedge
   The seismic quality tends to degrade towards the west and            documented in confidential seismic data east of the section or
also with depth. Consequently, the structural architecture in           on the surface. Therefore, this thrust is interpreted as part of
those parts is less constrained. On both sections, the top of           a structural wedge roofed by a bedding-parallel thrust (thrust

Solid Earth, 10, 425–446, 2019                                                                     www.solid-earth.net/10/425/2019/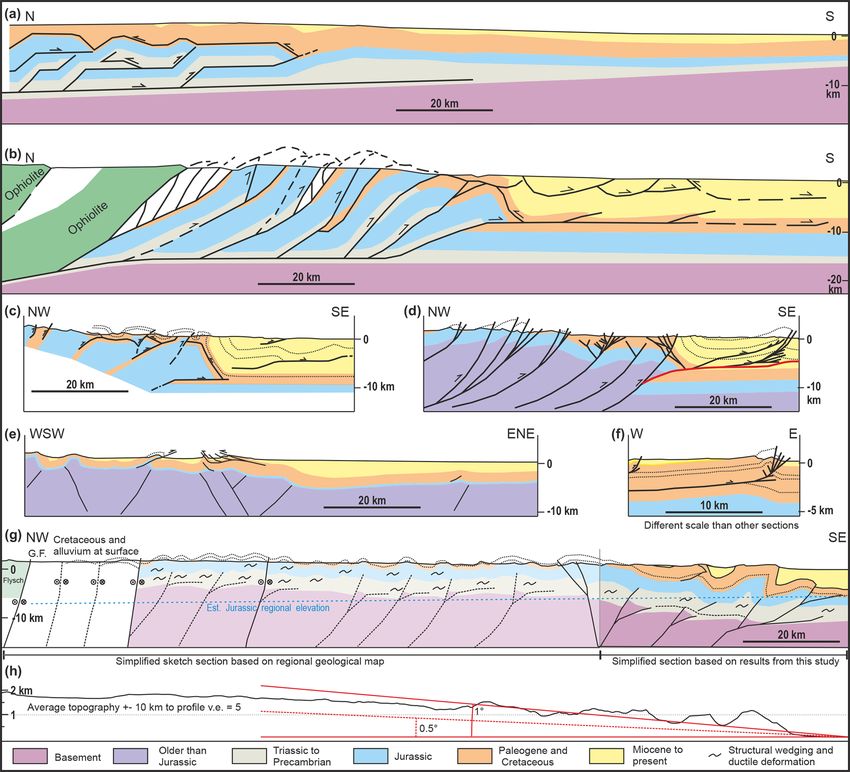
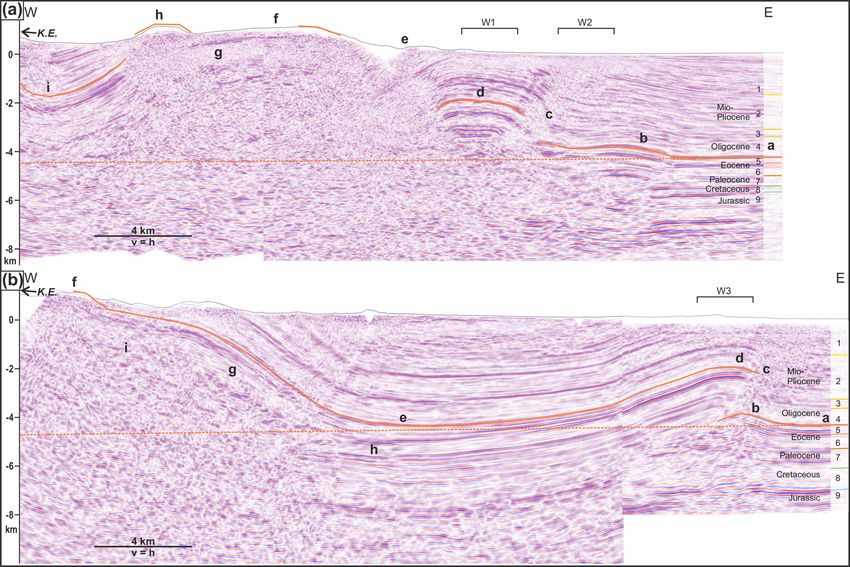
R. Hinsch et al.: Inversion in the central Kirthar Fold Belt                                                                             433

Figure 9. Two W–E-oriented pre-stack depth-migrated seismic sections. Orange interpretations indicate the clearly constrained top of the
Kirthar Formation from seismic, well and outcrop data. The stippled orange line is the anticipated pre-contractional regional elevation of the
Kirthar Formation. K.E.: Kirthar Escarpment. A high-resolution image without interpretation is available as a Supplement figure. The final
interpreted seismic lines are part of Figs. 12a and 13a; (a) seismic section composed from two overlapping 2-D seismic lines in the northern
sector (exact position not shown for confidentiality reasons). W1: well control within 4 km (to Jurassic level). W2: well control within 5 km
(to Paleogene level). Labels a–i are used to indicated features discussed in the text. Numbered horizons in the east refer to horizons as in
Fig. 4; (b) section composed from 2-D and 3-D seismic data. W3: well control within 1 km (to Upper Cretaceous level). Labels a–i are used
to indicated features discussed in the text. Numbered horizons in the east refer to horizons as in Fig. 4.

2 in Fig. 10a). Tilted strata below thrust 1 with a slightly             (Sui Main limestones; see Fig. 4), characterized by a low-
westward-offset kink axis (white stippled line in Fig. 10a)              reflectivity seismic character. The deeper segments of thrusts
indicate a potential deeper wedge. Figure 10b–d show a pos-              1 and 3 are relatively uncertain based on the seismic profiles.
sible sequence of deformation events that honours the growth             However, the Jurassic Chiltan Formation has been drilled in
strata pattern and structures identified in the seismic image.           the hanging wall of thrust 3, indicating that the thrust cuts
By stacking two wedges the deformation front can stay rel-               below the Jurassic.
atively stationary and develop a growth strata package sim-                 A syncline is located west of these frontal structures,
ilar to the imaged one. Migrating kink bands are likely not              though it is not imaged on the seismic data due to steeply
resolved due to low sedimentation rates and potential inter-             dipping to overturned beds (Fig. 9a, point e). A large-scale
vals of erosion. Unlike what is shown, the wedges might also             anticline with Kirthar limestones on the surface level is indi-
be partially active at the same time, complexly accommodat-              cated at point f (Fig. 9a; see also Fig. 6). The low-reflectivity
ing large-scale layer-parallel shortening. The youngest thrust           seismic facies below the Kirthar limestones represent the
shortcuts the wedges (Fig. 10d, fault 3 in Fig. 10a) and de-             Eocene Ghazij (shales) Formation (Fig. 9a, point g). These
forms the youngest growth strata package (c in Fig. 10a). The            shales thicken dramatically from the wells on the frontal an-
relatively good seismic image and nearby well control allow              ticline in the east (several tens of metres) towards the west
for the definition of the stratigraphic level of the roof thrust         (several hundred metres, constrained by seismic velocities
(fault 2 in Fig. 10). The thrust has a trend that is parallel to         and outcrop information just west of the Kirthar Escarp-
the bedding in the Paleocene shales (upper Ranikot shales;               ment; see Fig. 6 and Ahmad et al., 2012). A small-scale
see Fig. 4) just below the thick and competent limestones                anticline of higher order exposes Kirthar limestones on the

www.solid-earth.net/10/425/2019/                                                                         Solid Earth, 10, 425–446, 2019
434                                                                   R. Hinsch et al.: Inversion in the central Kirthar Fold Belt

                                                                       the estimated regional level is 5500–6000 m with an uncer-
                                                                       tainty related to the interpreted slope of the regional eleva-
                                                                       tion. A rough depth-to-detachment analysis conducted with
                                                                       the excess area approach (Epard and Groshong, 1993) on the
                                                                       large-scale anticline suggests an upper detachment depth of
                                                                       8–10 km. The spread in the predicted detachment is due to
                                                                       high uncertainty in the deeper stratigraphic picks on the seis-
                                                                       mic section and the fact that the Kirthar Formation is not
                                                                       returning to regional elevation in the syncline to the west.

                                                                       4.2   Southern sector

                                                                       In the southern section, the undeformed foreland (Fig. 9b,
                                                                       point a) shows sub-horizontal reflectivity to at least 8 km of
                                                                       depth. To the west a minor flexure (Fig. 9b, point b) is sit-
                                                                       uated underneath a seismic noise zone hiding a thrust fault
                                                                       (Fig. 9b, point c). The anticline above the thrust (Fig. 9b,
                                                                       point d) is the southern along-strike continuation of the an-
                                                                       ticline on the northern section (Fig. 9a, point d, frontal an-
                                                                       ticline in Fig. 6). The syncline towards the west (Fig. 9b,
                                                                       point e) is much broader than its northern equivalent. Sub-
                                                                       horizontal reflectors indicate the presence of sedimentary
                                                                       rocks to at least a depth of 10 km. The frontal structures
                                                                       have been analysed and interpreted. Finally, the concluded
                                                                       model is illustrated and tested by running a kinematic for-
                                                                       ward model (Fig. 11). The interpreted fault geometries as
                                                                       well as a stratigraphic template elaborated from wells and
                                                                       outcrop sections are used for the starting configuration of
                                                                       the model (Fig. 11a). Step 1 follows the sequence elaborated
                                                                       in the northern sector (i.e. wedging before fault-propagation
                                                                       folding; see Fig. 10), which shows a small fault-bend fold
                                                                       that forms a small triangular structure at the deformation
                                                                       front (Fig. 11b). This triangular structure is cut by a sub-
                                                                       sequent thrust, forming a fault-propagation fold (Fig. 11c).
                                                                       This step is modelled using the tri-shear implementation in
                                                                       Move software (Midland Valley, 2016; Fig. 11c). There are
                                                                       several parameters that control the shape of the anticline.
                                                                       In detail, more than one solution (combination of parame-
                                                                       ters) can generate an approximate fit to the given constraints
                                                                       (seismic data, well data (not shown) and surface dips), but
Figure 10. (a) 2-D seismic section in time domain in the northern
                                                                       differences are not significant. The reasonable fit shown in
sector (exact position not shown for confidentiality reasons) with
fault and growth strata interpretation. (b)–(d) A possible solution    Fig. 11c supports the fault interpretation and the amount of
for the growth strata pattern as discussed in the text. The seismic    shortening applied to these frontal structures (about 5000 m
image in the background of panel (d) is a roughly depth-converted      of horizontal shortening). To the west of the red stippled line
version of panel (a).                                                  in Fig. 11c, the model does not exactly match the seismic
                                                                       image; the interpreted Kirthar Formation is constantly rising
                                                                       until the limestones crop out in a small-scale fold (Fig. 9b,
surface (Fig. 9a, point h). A syncline marks the western end           point f). West of point f the Kirthar Formation is continu-
of the seismic line (Fig. 9a point i). The Kirthar Formation           ously exposed to the Kirthar Escarpment (just west of the end
also crops out at the Kirthar Escarpment west of the section           of the seismic line) at an elevation of around 1850 m a.s.l.
(Fig. 6; northern sector, at approximately 1150 m above sea               Similar to the northern section, the Eocene Ghazij shales
level, a.s.l.). It is notable that the structural elevation of the     thicken westward. The shales are thin (several tens of metres)
Kirthar limestone increases from east to west (approximately           in the frontal anticline (Fig. 9b, below point d) and thicken
2.5 km in the western syncline; Fig. 9a point i). At the high-         towards the west (Fig. 9b, point g). This thickening is es-
est outcropping point of Kirthar limestones the difference to          pecially pronounced west of the clinoforms (Fig. 9b, point

Solid Earth, 10, 425–446, 2019                                                                   www.solid-earth.net/10/425/2019/
R. Hinsch et al.: Inversion in the central Kirthar Fold Belt 435
5 Linking thick-skinned and thin-skinned deformation
Despite some structural differences between the northern and
southern sectors, the common observation is an overall in-
crease in the elevation of the Kirthar and other formations
above the regional from the east to the west. Such an in-
crease in elevation can be explained by several mechanisms:
(a) a strong wedge shape of the pre-deformational strata be-
low the Kirthar, (b) a thrust–fault to a deeper structural level,
and (c) internal structural thickening of formations below the
Kirthar Formation or any combination thereof as these pro-
posed mechanisms are not mutually exclusive.
For several reasons discussed throughout this chapter, we
propose that the most likely scenario for driving the struc-
tural uplift is a thick-skinned contribution that is probably
caused by the partial inversion of existing structures linking
upwards with suitable detachments in the sedimentary col-
umn. The balanced sections of the southern and the northern
zone are displayed in Figs. 12 and 13, respectively. The sec-
tions honour the seismic interpretation and constraints from
the structural modelling and fit the regional context and con-
straints. Before discussing the sections individually in detail
we need to elaborate these constraints and arguments. This
includes addressing the following main questions: (a) could
a pure thin-skinned (duplex) solution explain the same (re-
gional) pattern? (b) What are the indications for inversion in
contrast to a (non-inversion) basement-involved model?
5.1 Constraints from regional structures
West of the area covered in Fig. 6 the topographic (see
Figure 11. Forward modelling of the frontal structures in the south- Fig. 2h) and structural elevation remains high (more than
ern sector. (a) The seismic image, surface geometry including dips, 6000 m), as indicated by the outcropping of the Jurassic in
the present-day deformed state of the top Eocene limestones (con- various folds (Figs. 3, 6). A conceptual regional cross sec-
strained by nearby well control), and the interpreted and constructed tion based mainly on a low-resolution geological map (scale;
faults are given as a reference frame for the forward model. The Bannert et al., 1992) is displayed in Fig. 2g. The section
model uses a stratigraphic wedge with thicknesses which are con- tentatively shows some relatively steep thick-skinned faults
strained by well and outcrop observations. (b) A small triangular and gently folded strata above. Due to the limited data and
structure at the deformation front is modelled with fault-bend fold-
the problems of cross-sectional orientation and non-plane
ing. The lower detachment (1) is in Lower Jurassic or Triassic suc-
strain conditions, balancing this regional section is prob-
cession, and the upper one is interpreted in the soft Cretaceous Goru
shales (dotted line). (c) A fault-propagation fold forms hinterland- lematic. However, the folds shown in the section accommo-
ward of the triangular structure by a thrust ramp (2) modelling done date approximately 10 % of line length shortening. Based on
with tri-shear. The model mimics the structure imaged in the seis- the balancing results from our own sections where higher-
mic section approximately from the deformation front (east) to the resolution data are present, we argue that the actual short-
red stippled line. ening can be somewhat higher (of the order of 15 %–20 %)
and that the difference is due to scale problems as well as
unresolved shortening in wedges and other distributed short-
h), which are interpreted as the carbonate margin of the Laki ening. A conceptual section compares a thick-skinned to a
(Sui Main) limestones. thin-skinned solution (Fig. 14). In both cases the deformation
On the southern section the structural elevation of the is pinned at the deformation front. The thick-skinned model
Kirthar limestones rises constantly from the syncline axis envisages the total amount of shortening as accommodated in
(Fig. 9b, point e) towards the Kirthar Escarpment in the west. the contractional structures above the approximately equally
The structural elevation gain above regional at the Kirthar shortened basement (Fig. 14a). The thin-skinned model as-
Escarpment is more than 6500 m (with uncertainty related to sumes that the basement remains undeformed beneath the
the interpreted regional level; Fig. 9b, stippled orange line). duplex structures (Fig. 14b) and has to be shortened towards
www.solid-earth.net/10/425/2019/ Solid Earth, 10, 425–446, 2019436 R. Hinsch et al.: Inversion in the central Kirthar Fold Belt Figure 12. (a) Constructed W–E section in the southern sector of the study area with a PSDM seismic section in the background (see Fig. 9b). The section is balanced between the red loose line and the eastern end of the section (fixed line). KE: Kirthar Escarpment; (b) restored section (50 % scale of a). Calculated shortening is approximately 10 km or 20 %. Figure 13. (a) Constructed W–E section in the northern sector of the study area with a PSDM seismic section in the background (see Fig. 9a). Dip measurements projected between 2.5 and 4 km. The section is balanced between the red loose line and the eastern end of the section (fixed line). (b) Restored section (at 50 % scale of a) by using line length and area balancing methods. Calculated shortening is approximately 11.2 km or 18 %. the hinterland. The thin-skinned duplex solution shown (as- require a set of back-thrusts as the plane of the roof thrust suming reasonable stratigraphic thicknesses) does not reach is severely folded and thus not likely a viable slip plane. No the structural uplift observed (more than 6000 m) and has se- such back-thrusts or other structures that would accommo- rious balancing problems. Increasing the magnitude of short- date the excess shortening are observable on the geologi- ening would allow the solution to attain higher structural ele- cal maps. Furthermore, the basement is required to shorten vation(s), but increases the balancing issue at the same time. somewhere as well with the same magnitude. Usually this The shortening of the strata above the duplexes would likely shortening would happen towards the hinterland (by a stair- Solid Earth, 10, 425–446, 2019 www.solid-earth.net/10/425/2019/
R. Hinsch et al.: Inversion in the central Kirthar Fold Belt                                                                         437

                                                                         are preserved, which represent relative structural lows (la-
                                                                         belled with bold number 2 in Fig. 6). A further characteristic
                                                                         is the presence of long-wavelength folds with several kilome-
                                                                         tres of wavelength (labelled with bold number 3 in Fig. 6) and
                                                                         folds with much smaller wavelengths and higher frequencies
                                                                         (labelled with bold number 4 in Fig. 6), indicating a much
                                                                         shallower detachment horizon. The large-scale anticlines are
                                                                         usually double plunging and have roughly NNW–SSE- to N–
                                                                         S-trending axes, but a variety of subordinate directions are
                                                                         present as well. A plausible deformation model should be
                                                                         able to explain this complex pattern.
                                                                            As lined out above, a thick-skinned contribution to the
                                                                         structural elevation is necessary. In a transpressional system
                                                                         we would expect a zone of shortening in which the short-
Figure 14. Simplified sketch comparing thick- vs. thin-skinned so-
lutions for the structural elevation uplift of the Jurassic level. El-
                                                                         ening features are striking 45◦ to parallel to the dominant
evations are with respect to the regional elevation of the Jurassic      strike-slip features (Sanderson and Marchini, 1984; Fossen
(0 km); (a) a series of thick-skinned faults with a total of 20 km of    et al., 1994; Schreurs and Colleta, 1998). The Chaman and
shortening (16 %). Due to the pinning at the deformation front, a        Ghazeraband faults are in an N–S to NNE to SSW orien-
roof thrust under the horizons needs to be present. The excess line      tation (Fig. 1), and thus shortening structures should have a
length of the sediments above the roof thrust (about 13.5 km) needs      strike orientation of NE–SW to NNE–SSW. The NNW–SSE-
to be accommodated in the section as well, which could happen in         to N–S-trending axes west of the Kirthar Escarpment in the
internal shortening and amplification of the folds. The solution ex-     central Kirthar Fold Belt (Fig. 6) seem rather unusual with
plains a structural uplift towards the hinterland of 5–7 km. (b) One     respect to the orientation of the transpressive margin. Thus,
example of a duplex solution with total 48 km of shortening (38 %).      it seems reasonable to assume that the NNW–SSE to N–S
The example solution stays below 5 km of structural uplift. In or-
                                                                         orientation is not linked to newly initiated faults at depth but
der to increase the uplift, more shortening in the duplexes would
be required, which would increase the balancing issues. A tentative
                                                                         is associated with localized deformation controlled by inher-
thrust cutting into the basement behind the duplexes would uplift        ited zones of weakness.
basement rocks towards the hinterland.
                                                                         5.2   Constraints from seismicity

case thrust system). As a consequence, deeper stratigraphic              We use nodal planes derived from the International Seismo-
rocks or basement would be uplifted towards the hinterland               logical Centre (ISC) bulletin database to constrain potential
(tentatively shown in Fig. 14b). However, towards the hin-               fault geometries in the subsurface in the wider study area
terland no such root zone is present in the Kirthar Fold Belt            (Fig. 3). Given the tectonic setting of a lateral collision zone,
(see Figs. 2g, 3). Furthermore, the fold belt as such does not           it is not surprising that earthquakes towards the current plate
show a prominent surface slope from hinterland to foreland               boundary at the Chaman Fault document dominantly strike-
(only 0.5◦ –1◦ , Fig. 2h). This could indicate that the trans-           slip faulting. Some focal mechanisms of earthquakes close
pressive fold belt likely does not represent a critical tapered          to the deformation front show dominant dip-slip shortening
accretionary wedge (see Dahlen et al., 1984; Suppe, 2007),               (Fig. 3 and Table 1). All these events are in depth ranges
although we do not have good control on the basal angle of a             of 10–15 km, with the exception of F4 (Fig. 3 and Table 1),
potential wedge. A governing wedge shape is probably nec-                which is at greater depth (33 km). Interestingly, this event is
essary to allow for the sustained basal accretion of duplexes.           the only one with a slightly oblique character. Given the po-
Steeper faults, also affecting the basement, do require much             tential error ranges on the depth of the events the shallow
less shortening to uplift overlying strata to a high structural          events could be located in the crystalline basement or in the
elevation (Fig. 14a) and are consistent with the missing root            lower part of the sedimentary column.
zone towards the plate boundary (Figs. 2g, 3).                               For the events listed in Table 1 is not clear which of the
   In our study area, the outcropping structures west of the             two nodal planes was the moving plane. We could either as-
seismic coverage and west of the Kirthar Escarpment yield                sume it is the one with the lowest dip or it is westward dip-
some indications about the structural architecture below the             ping, corresponding to southeast- or eastward-directed short-
Kirthar and Ghazij Formation (Fig. 6). The area west of the              ening. For the first assumption fault dips are between 15 and
Kirthar Escarpment has a high mean elevation (more than                  45◦ and for eastward-dipping faults between 15 and 57◦ . In
1000 m a.s.l.; see Fig. 2h). The anticlines with Jurassic out-           both cases, the steeper faults are considered to be too steep
crops represent the structures with the highest elevations in            to represent newly initiated thrust faults. We therefore inter-
the area (labelled with bold number 1 in Fig. 6). In between             pret these steep faults as parts of pre-existing faults that are
are areas where Paleocene (and sparsely also Eocene) rocks               in a suitable angle for reactivation. The shallower dipping

www.solid-earth.net/10/425/2019/                                                                       Solid Earth, 10, 425–446, 2019
438 R. Hinsch et al.: Inversion in the central Kirthar Fold Belt
Table 1. Nodal planes from the International Seismological Centre (2015) database for reviewed events only. In addition to the dip, the dip
azimuth of the planes is calculated. The strike and rake values from the database are given for completeness and assessment of obliquity.
Event F1 has three different solutions in the database. The differences are a rough indication of the uncertainty in the data. Bold and italic
dip values indicate the lower and higher dip surfaces of the pair. The author column refers to the original provider in the database (see Lentas
et al., 2018, and references therein).
Figure Event ID Mw Z Date Author Dip Dip Strike Rake Dip Dip Strike Rake
label azimuth azimuth
F1a 603867342 5.4 −10 100 19.12.2013 NEIC 253.8 14.7 163.8 70.9 93.5 76.2 3.5 94.9
F1b 603867342 5.4 −12 000 19.12.2013 GCMT 291.0 39.0 201.0 133.0 61.0 63.0 331.0 61.0
F1c 603867342 5.4 −12 000 19.12.2013 NEIC 277.0 26.0 187.0 99.0 87.0 64.0 357.0 85.0
F2 308027 5.4 −15 000 21.01.1992 HRVD 306.0 48.0 216.0 104.0 105.0 44.0 15.0 75.0
F3 301671 4.9 −15 000 28.03.1992 HRVD 272.0 57.0 182.0 89.0 93.0 33.0 3.0 91.0
F4 259589 5.1 −33 000 28.12.1992 HRVD 263.0 33.0 173.0 32.0 146.0 73.0 56.0 119.0
F5 13436558 5.0 −12 000 17.03.2009 GCMT 304.0 45.0 214.0 106.0 102.0 47.0 12.0 75.0
F6 604543379 5.0 −12 000 08.05.2014 GCMT 212.0 42.0 122.0 69.0 59.0 52.0 329.0 108.0
events could represent newly initiated faults, of which those
at depths above 12 km could be located in the sedimentary
column.
Based on levelling data, surface deformation associated
with the 1931 Mach earthquake in front of the northern
Kirthar ranges has been investigated by Ambraseys and Bil-
ham (2003) and by Szeliga et al. (2009). The authors model
different fault slip solutions to match the seismic and post-
seismic elevation gain at the deformation front. In a geolog-
ical section Szeliga et al. (2009) consider listric thrust faults
with angles exceeding 45◦ , linking shortening on a deep flat
décollement (likely in the basement) to higher levels in the Figure 15. (a, b) Model of extension with subsequent inversion on
sediments (Fig. 2d). In order to match the surface deforma- curved linked faults (modified after Yamada and McClay, 2004).
tion after the 1931 Mach earthquake with elastic models, (c) Adding leading thin-skinned deformation and shortcut fault to
a fault geometry comprising deep detachment, a ramp sec- the sketch of inverted curved linked fault system. (d) Sketch of
tion (part of a steep listric fault) and a branching gently dip- half-graben systems with overlapping faults for anticipation of more
ping thrust towards the deformation front are needed. The complex subsurface geometries before inversion.
fault shape considered responsible for the event by Szeliga et
al. (2009) is tentatively shown in Fig. 2d as a red line. Such
a geometry supports our proposed model close to the defor- nature, this is likely not the case. Inversion likely affects only
mation front, where basement faults link with shallower de- those parts of the faults that are suitable for frictional reacti-
tachments and thrusts in the sediments. vation. In listric fault systems these would be dominantly the
deeper segments located in the ridged basement (depending
5.3 A simplified thick-skinned – thin-skinned inversion on the post-rift strain history). Other inversion-related defor-
model mations, like hanging-wall shortcut faults, reverse faults and
buttressing effects (see Cooper et al., 1989; Hayward and
We propose that an inversion model is the best solution to Graham, 1989), are likely to be present as well and can be
explain all the different observations and constraints. Ya- considered indirect inversion. In the study area the shortening
mada and McClay (2004) demonstrated that the shape of of the inverting normal fault is considered to be transferred to
the normal fault and associated (half-) graben with its syn- a detachment in the sediments (Fig. 15c), explaining the pres-
kinematic fill (Fig. 15a) defines the shape of the inversion ence of short-wavelength folds adjacent to large-wavelength
anticline (Fig. 15b). It is interesting to note the presence of folds (see Fig. 6). The linking from the deeper inverting fault
double plunging anticlines and the possibility of local lows to the detachment in the sediments might be associated with
between the anticlines and towards the hinterland (Fig. 15b), the above-mentioned complex deformation, e.g. a footwall
which resembles the structural pattern west of the Kirthar shortcut fault (Fig. 15c).
Escarpment in map view. The analogue experiments are lim- We further suggest that the complex map pattern is likely
ited by the rigid boundary conditions (non-deformable foot- the result of a much more complex inverted fault pattern as
wall, constant length of the hanging-wall fault), whereas in observed in natural rifts. An en-echelon pattern and overlaps
Solid Earth, 10, 425–446, 2019 www.solid-earth.net/10/425/2019/R. Hinsch et al.: Inversion in the central Kirthar Fold Belt 439
of faults with intact and broken relay ramps and horses, for phase of dominant wedging and layer-parallel shortening in
example (Fig. 15d), could contribute to a more complex de- the section. In the model, this deformation is linked to a slight
formation pattern if directly or indirectly inverted. Addition- inversion of the displayed normal fault (Fig. 16b); however,
ally, several stacked detachment horizons allow for the ac- the deformation could also be linked to shortening further in
commodation of shortening by linking stacked wedges and the west, which is transferred via thin-skinned detachments.
distributed ductile strain. As a consequence, the amount of The generation of the interpreted small passive roof thrusts is
shortening introduced by basement faults is partly dissemi- considered to be the result of the main inversion of the nor-
nated and thrusts, if they reach the surface, have relatively mal fault generating shortcut faults with a slightly smaller dip
small displacements (relative to the amount introduced by the angle in the sediments of the footwall. The presence of sev-
basement faults). We consider the inverting faults to be inher- eral weak stratigraphic units allows for some wedging as well
ited from the original rift phase on the lateral boundary when as the passive roof back-thrust in the Ghazij shales (Fig. 16b
the Indian Plate rifted from northern Gondwana (Fig. 5a). and c). This stage reflects large-scale layer-parallel shorten-
The direction of the rift faults would thus also define the N– ing of the stratigraphy above and/or in front of the invert-
S direction of the anticlines, which is strongly oblique to the ing normal fault. The youngest deformation is occurring on
plate kinematic vector. the thrust in the frontal anticline. In order to explain this we
suppose that with increasing inversion above the null point,
5.4 Southern section kinematic model and balanced the stress on the basement in the footwall likely increases
section and it finally yields. A basement shortcut develops and links
with a suitable detachment, generating the frontal anticline
The kinematic model of the frontal deformation structures in (Fig. 16d). With such a kinematic model all the features and
the southern section (Fig. 11) accommodates approximately constraints visible in the seismic data and at the surface, es-
5000 m of shortening. However, this amount of shortening is pecially the structural elevation uplift at the Kirthar Escarp-
not enough to explain the 6500 m of regional uplift towards ment, can all be explained with one major fault inversion
the hinterland at the Kirthar Escarpment when taking into (Fig. 16d). West of the Kirthar Escarpment the structural el-
consideration reasonable fault dips. A fault with a 45◦ angle evation remains relatively high and is not dropping as in the
and a displacement of 5000 m would generate a structural simplified model (Fig. 16d, hatched area). For that area, ad-
uplift of 5000 m from a simple geometric perspective. Either ditional shortening is required to maintain the high structural
a steeper fault is necessary (i.e. > 52◦ ) or some additional elevation, which could be related to additional (partly) invert-
shortening associated with the inverting fault is required to ing normal faults, similar to the sketch section in Fig. 2g.
explain the 6500 m of regional uplift. From careful seis- The balanced section in Fig. 12a shows the final interpreta-
mic interpretation and dip analysis we have interpreted the tion for the seismic line displayed in Fig. 9b, with further de-
presence of small passive roof duplexes underneath the soft tails than shown in the kinematic section (Fig. 16). This sec-
Eocene Ghazij shales. Below point g (Fig. 9b) some strong tion is restored to the pre-contractional situation as shown in
but laterally discontinuous reflector packages are present (be- Fig. 12b. The balanced section has been constructed by line
tween points h and i). The reflectors are interpreted to repre- length restoration onto a carefully constructed stratigraphic
sent the Paleocene limestones. The discontinuous pattern is template that takes well data and regional thickness trends
interpreted to be caused by poor imaging and by structural into account. An overall areal balance has been considered.
imbrication. East of point i (Fig. 9b), a small back-thrust is The amount of shortening is about 10 km, corresponding to
interpreted. The structural solution is presented in the bal- 20 % between the fixed pin and the loose line. The Eocene
anced section (Fig. 12a). By adding the shortening of these and Oligocene strata have shorter line lengths than the older
small passive roof duplexes to the total displacement on the strata due to roof back-thrusting on the Eocene Ghazij shales
basement fault, the required regional uplift at the Kirthar Es- and subsequent erosion. The loose line in Fig. 12b is not
carpment can be achieved, as is demonstrated in Fig. 16. absolutely straight for Paleocene and older horizons, docu-
We use a kinematic forward model (Fig. 16) to test and menting a small remaining error of the order of 1 %, which
illustrate how the undeformed (restored) section (Fig. 12b) is within accuracy and meaningful with respect to all uncer-
can develop in a plausible manner into the deformed sec- tainties.
tion (Fig. 12a). The initial configuration of the model has one The upper part of the section can be considered well con-
major normal fault (Fig. 16a) as in the restoration. For sim- strained (seismic image, surface geology and well control).
plicity we will assume syn-kinematic growth in the Lower The deeper part of the section is constrained by kinematic
Jurassic formations, although the fault might have been ac- and balancing considerations (interpretation and kinematic
tive as a normal fault earlier and later as well (see Sect. 2.2 on modelling go hand in hand in an iterative process). In detail,
tectonostratigraphic evolution). The frontal triangle and the there could be other solutions fulfilling the constraints (e.g. a
small interpreted back-thrust (corresponding to the wedge more complex pattern of imbrications and duplexes and other
modelled in Fig. 11 and the back-thrust east of point i; structures accommodating layer-parallel shortening). In that
Fig. 9b) are suggested to have formed in an early deformation sense, the presented section is a most likely scenario honour-
www.solid-earth.net/10/425/2019/ Solid Earth, 10, 425–446, 2019You can also read