Winter atmospheric nutrient and pollutant deposition on Western Sayan Mountain lakes (Siberia) - Biogeosciences
←
→
Page content transcription
If your browser does not render page correctly, please read the page content below
Biogeosciences, 18, 1601–1618, 2021
https://doi.org/10.5194/bg-18-1601-2021
© Author(s) 2021. This work is distributed under
the Creative Commons Attribution 4.0 License.

Winter atmospheric nutrient and pollutant deposition on
Western Sayan Mountain lakes (Siberia)
Daniel Diaz-de-Quijano1 , Aleksander Vladimirovich Ageev1 , Elena Anatolevna Ivanova1 , and
Olesia Valerevna Anishchenko1,2
1 Siberian
         Federal University, 79, Svobondyi prospekt, Krasnoyarsk, 660041, Krasnoyarsk Krai, Russian Federation
2 Institute
        of Biophysics, Siberian Branch, Russian Academy of Sciences, 50/50, Akademgorodok, Krasnoyarsk, 660036,
Krasnoyarsk Krai, Russian Federation

Correspondence: Daniel Diaz-de-Quijano (ddiasdekikhanobarbero@sfu-kras.ru, daniquijano@gmail.com)

Received: 6 April 2020 – Discussion started: 21 September 2020
Revised: 30 December 2020 – Accepted: 12 January 2021 – Published: 5 March 2021

Abstract. The world map of anthropogenic atmospheric ni-          temperature-inhibited responses of phytoplankton to nutrient
trogen deposition and its effects on natural ecosystems is not    shifts.
described with equal precision everywhere. In this paper, we
report atmospheric nutrient, sulfate and spheroidal carbona-
ceous particle (SCP) deposition rates, based on snowpack
analyses of a formerly unexplored Siberian mountain region.       1   Introduction
Then, we discuss their potential effects on lake phytoplank-
ton biomass limitation.                                           Worldwide nitrogen cycle perturbation is the second most
   We estimate that the nutrient depositions observed             important global environmental concern, just after mas-
in the late-season snowpack (40 ± 16 mg NO3 -N m−2                sive extinction of species and even more important than
and 0.58 ± 0.13 mg TP-P m−2 ; TP for total phospho-               global warming (Rockström et al., 2009; Steffen et al.,
rous) would correspond to yearly depositions lower                2015). The anthropogenic mobilization of formerly inacces-
than 119 ± 71 mg NO3 -N m−2 yr−1 and higher than                  sible nitrogen compartments has more than doubled natural
1.71 ± 0.91 mg TP-P m−2 yr−1 . These yearly deposition            nitrogenase-mediated inputs of reactive nitrogen forms into
estimates would approximately fit the predictions of global       the global nitrogen cycle (Vitousek et al., 1997). Massive fos-
deposition models and correspond to the very low nutrient         sil fuel combustion since the industrial revolution, chemical
deposition range, although they are still higher than world       fixation of atmospheric diatomic nitrogen to produce fertil-
background values.                                                izers since the Second World War and the wide extension of
   In spite of the fact that such a low atmospheric nitrogen      leguminous crops are the most important human sources of
deposition rate would be enough to induce nitrogen limita-        nitrogen cycle perturbation (Vitousek et al., 1997). A sub-
tion in unproductive mountain lakes, phosphorus deposition        stantive part of this anthropogenic reactive nitrogen is then
was also extremely low, and the resulting lake water N : P ra-    spread, air-transported and deposited all over the world with
tio was unaffected by atmospheric nutrient deposition. In the     a diverse impact on different ecosystems.
end, the studied lakes’ phytoplankton appeared to be split           The effects of atmospheric nitrogen deposition on primary
between phosphorus and nitrogen limitation. We conclude           production have been documented in the usually nitrogen-
that these pristine lakes are fragile sensitive systems exposed   limited terrestrial ecosystems (Bobbink et al., 2010; De-
to the predicted climate warming, increased winter precipi-       Forest et al., 2004; Güsewell, 2004; LeBauer and Treseder,
tation, enhanced forest fires and shifts in anthropogenic ni-     2008), as well as in commonly phosphorus-limited lakes
trogen emissions that could finally couple their water chem-      (Bergström et al., 2005). A series of studies all over Sweden
istry to that of atmospheric nutrient deposition and unlock       and abroad showed atmospheric nitrogen deposition turned
                                                                  unproductive lake phytoplankton from natural nitrogen to in-

Published by Copernicus Publications on behalf of the European Geosciences Union.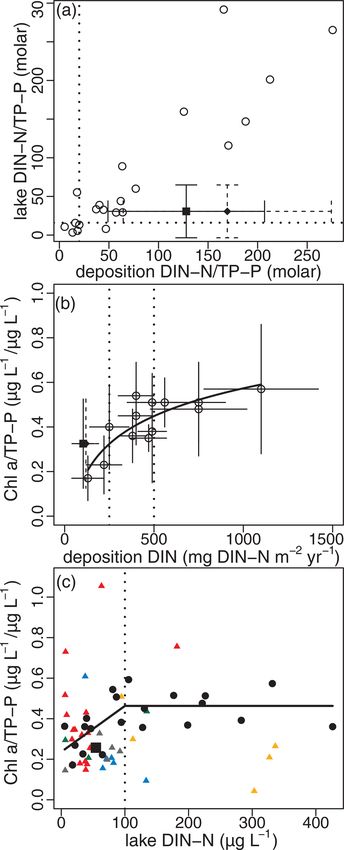
1602                                             D. Diaz-de-Quijano et al.: Winter atmospheric deposition on Siberian lakes

duced phosphorus limitation (Bergström and Jansson, 2006;
Bergström et al., 2005; Elser et al., 2009) when temperature
was not a limiting factor (Bergström et al., 2013). Of course,
these changes do not only concern primary production limita-
tion but also primary producer species composition, cascade
effects over the food web, secondary production, species in-
teractions, etc. Likewise, these studies showed that it was rea-
sonable to study the relationship between atmospheric nutri-
ent deposition and lake phytoplankton growth limitation in-
dependently from biogeochemical processes occurring at the
levels of the watershed, runoff and river transport, lake sedi-
ments, etc.
   Nevertheless, ecological processes are not homogeneous
around the world. There is a particular and dynamic geog-
raphy of reactive nitrogen sources, an atmospheric conveyor
belt with a conspicuous structure, an evolving climate with
patchy temperature and precipitation changes, and a multi-
plicity of lake districts with distinct individual lakes in them.
If it is true that climatic and atmospheric nutrient deposi-
tion models have helped a lot to describe this geography,
the latter ones lack empirical measurements for some re-
gions elsewhere in the world, which might undermine their           Figure 1. Distribution of sampling points in the Ergaki Natural
regional spatial reliability in comparison to climate models        Park. Snow cores: Tsirkovoe (A), Oiskoe (B) and Tushkan (C).
(Fagerli et al., 2019; Gauss et al., 2019; Lamarque et al.,         Lakes: Tsirkovoe (1), Oiskoe (2), Raduzhnoe (3), Karovoe (4) and
2013; Mahowald et al., 2008). Moreover, not all lake dis-           Svetloe (5). Olenya Rechka Meteorological Station (M). Ergaki
tricts of the world have been studied with the same inten-          location in Eurasia. Mountain ridge (gray), open spaces (white),
sity, so certain processes might be overlooked, and the limno-      forest and bushes (green), and three-lane federal road (yellow).
logical paradigms might be site-biased (Marcé et al., 2015).        Source: http://www.shandl.narod.ru/map.htm and Wikipedia CC
                                                                    BY-SA 3.0.
In this study, we analyzed the snowpack in the Western
Sayan Mountains (south-central Siberia) in order to gauge at-
mospheric nitrogen, phosphorus, sulfate and spheroidal car-         2     Methods
bonaceous particle (SCP) deposition rates. As far as we
know, no such measurements had been pursued in this site            2.1    Study site and sampling
before, so they might be useful to contrast and inform world
deposition models. Besides, we have also assessed the lake          The Western Sayan Mountain range is located in south-
phytoplankton nutrient limitation regime and discussed the          central Siberia (Fig. 1). It has a central position in the Altai–
potential influence of nutrient deposition on it.                   Sayan mountain system, in between the Altai Mountains (to
   According to published global models (IPCC, 2013;                the west) and Eastern Sayan Mountains (to the east), which
Lamarque et al., 2013), the Western Sayan Mountains, in             are constituents of the Sayan–Baikal mobile fold belt south
south-central Siberia, correspond to a low atmospheric ni-          of the Siberian craton (Logatchev, 1993). Western Sayan
trogen deposition area with a cold but increasingly warming         orogeny occurred in the ancient Paleozoic, by folding Pa-
climate in the last decades. Our aim was to corroborate it be-      leozoic and Precambrian deposits, during the Baikal tecto-
cause in case it was confirmed, it would be an adequate site        genesis and in the Cenozoic era (namely during the Pliocene
to study the effects of global warming on ecosystems with a         and Pleistocene epochs) (Chernov et al., 1988). With a north-
minimal interference of atmospheric nitrogen deposition. In         western orientation and heights from 400 to 2700 m a.s.l., the
other words, identifying and studying such areas could help         Western Sayan Mountains combine old eroded and typical
disentangle warming and nitrogen fertilization as drivers of        glacial reliefs, carved during the Pleistocene glaciation in the
ecological change. It could also contribute to assessing the        highest ridges. The source of Yenisei River, the first Siberian
worthiness of implementing global nitrogen cycle policies           river in terms of discharge, is located in the Western Sayan
other than climate ones.                                            Mountains, and its headwater tributaries are also Sayanic.
                                                                       The present study was performed in the Ergaki Natural
                                                                    Park, in the Western Sayan Mountains. With an altitude range
                                                                    from 700 to 2466 m a.s.l., this park is well known for the
                                                                    glacial landscapes of both Ergaki and Aradan ridges embed-
                                                                    ded in a boreal mountainous taiga matrix that extends far

Biogeosciences, 18, 1601–1618, 2021                                                    https://doi.org/10.5194/bg-18-1601-2021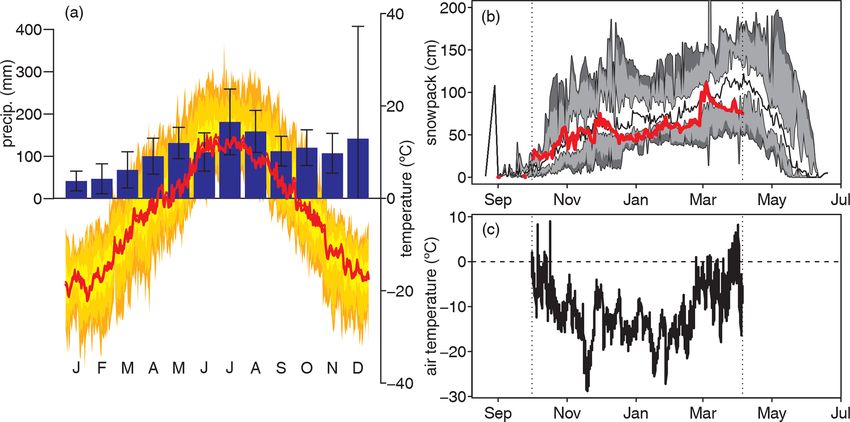
D. Diaz-de-Quijano et al.: Winter atmospheric deposition on Siberian lakes                                                    1603

to the north. The landscape is spattered with monumental            (        ) are relatively large forest lakes (0.57 and 0.37 km2
and pictoric granite–syenite rocks, and the general geology         and 21 and 24 m maximum depth, respectively) with low
is rich in granitoids (Voskresenskii, 1962). South from the         water transparency (4 and 8 m average Secchi disk, respec-
park, sub-boreal larch taigas and central Asian steppes de-         tively). Lake Tsirkovoe, Lake Raduzhnoe (             ) and Lake
velop. The closest gardens and agricultural fields are located      Karovoe (          ) are located at an alpine landscape and are
downhill more than 35 km north from the northernmost sam-           smaller and shallower (0.02, 0.03 and 0.08 km2 , respectively;
pling point and constitute a modest patch within the taiga ma-      15, 4 and 7 m deep, respectively). Secchi disk was not tested
trix. Meteorological conditions in the Ergaki Natural Park are      at Lake Tsirkovoe, but at Lake Raduzhnoe and Lake Karovoe
characterized by high precipitation (1243 mm) and extreme           lake beds were visible. Lake Karovoe and Lake Svetloe rep-
temperatures, ranging from −36.8 to +33.3 ◦ C (Fig. 2a).            resent 7 % of the watershed area; Lake Tsirkovoe and Lake
From a geobotanical point of view the park is located in            Oiskoe represent 5 %; and Lake Raduzhnoe is only 1.4 % of
the holarctic kingdom, circumboreal region and Altai–Sayan          its watershed area.
province (Takhtadzhyan, 1978). An exhaustive floristic de-             As for vegetation cover, the Lake Oiskoe and Lake Svetloe
scription is available in Stepanov (2016), where our study          watersheds have a 25 % and 28 % forest cover, whereas the
area corresponds to the L3 district.                                other lakes have less than 10 % forest cover. These two wa-
   Snowpack cores were sampled at three sites of the Ergaki         tersheds are quite similar in terms of land cover: they have
Natural Park: next to Lake Tsirkovoe (            ), next to Lake   quite equilibrated percentages of forests, shrubs, meadows
Oiskoe (        ) and on a forest glade close to Tushkan stream     and scree. Lake Oiskoe is also the watershed with the high-
(       ) (Fig. 1 and Table 1). Snow sampling was conducted         est peatland cover (6 %), followed by Lake Svetloe (3 %)
on 5 April 2017, integrating a snowfall period of 6 months          and Lake Raduzhnoe (1.6 %). The Lake Karovoe and Lake
and 5 d according to precipitation data recorded in the nearby      Raduzhnoe watersheds are dominated by scree (73 % and
Olenya Rechka Meteorological Station (http://rp5.ru, last ac-       52 %, respectively) and meadows (14 % and 24 %, respec-
cess: 5 September 2018). The 1 and 24 September 2016                tively), whereas the Lake Tsirkovoe watershed is dominated
snowfalls, which were thinner than 0.5 and 2 cm, respec-            by shrubs (56 %) and scree (37 %).
tively, were registered, but they melted the following day.            Lake water was sampled at different depths (from one to
The first important snowfall occurred on the evening of 1 Oc-       five separate depths or with a composite sample from those
tober 2016 and left a 22 cm pack that was not significantly         depths, depending on the sampling expedition, see Table S2
reduced anymore until the sampling day (Fig. 2b). Air tem-          from Diaz-de-Quijano et al., 2020) and consequently ana-
peratures recorded in the mentioned meteorological station          lyzed for chlorophyll and nutrient content in early Septem-
during this time window were mostly below zero, with posi-          ber 2015 (Lake Tsirkovoe, Lake Oiskoe and Lake Raduzh-
tive temperatures only for some hours around midday during          noe) and in late August 2017 (Lake Tsirkovoe, Lake Oiskoe
the first and last weeks (Fig. 2c).                                 and Lake Karovoe). Data from a previously published study
   The snow core sampling was conducted following a mod-            integrating June and August samplings for 2011–2012 (Lake
ified version of the MOLAR (Mountain Lake Research)                 Oiskoe, Lake Raduzhnoe, Lake Karovoe and Lake Svetloe)
project protocols for atmospheric deposition assessment             were also used (Anishchenko et al., 2015). Water samples
(Mosello et al., 1997). Sampling areas were chosen on a map         were sieved in situ to remove zooplankton, transported to the
to be accessible but as far as possible from local sources of air   field laboratory at 4–10 ◦ C in the dark, filtered for chloro-
pollution. Definitive locations were also chosen to represent       phyll analyses and frozen at −20 ◦ C for further chemical
average snowpack thicknesses by checking it across the sam-         analyses.
pling areas using a snow probe. Hence, wind- and orography-
induced secondary modifications of the snowpack were min-           2.2   Chemical analyses
imized. An aluminum tube and piston (1 m × 2.5 cm inner di-
ameter), plastic shovel, plastic containers and rubber gloves       Snow and lake water samples were fully thawed and stirred
were soaked in ∼ 4 % HCl and MQ (Milli-Q) water rinsed              before analyses. Snow water equivalent (SWE) was calcu-
before being used to pick up snow cores. A protective mask          lated by multiplying the snowpack depth and the ratio of
and synthetic clothes were worn during sampling. The snow           melted water volume to sampled snow volume. Samples
was stored in the plastic containers and kept at −20 ◦ C until      were gently vacuum-filtered for NO−        −
                                                                                                         2 , NO3 , soluble reac-
                                                                                                       2−
further analyses. Two cores divided in three segments (0–40,        tive phosphorus – SRP – and SO4 analyses and filtered
40–80 and 80–115 cm) were sampled at Tsirkovoe, whereas             with single-use plastic syringes for NH+ 4 analyses. Cellu-
three cores divided in two segments (0–60 and 60–115 cm)            lose filters were used in the 2011 and 2012 surveys ac-
were sampled at Oiskoe and Tushkan.                                 cording to the Russian national standards (Gladyshev et
   A selection of five accessible Ergaki mountain lakes was         al., 2015; Tolomeev et al., 2014), and “Porafil” 0.45 µm
chosen to represent a variety in dimensions, altitude and wa-       membrane filters (Macherey-Nagel, Germany) were used in
tershed vegetation covers (Fig. 1, Table 1 and Table S1 from        2015 and 2017. Nitrate was reduced to NO−    2 by the cad-
Diaz-de-Quijano et al., 2020). Lake Oiskoe and Lake Svetloe         mium reduction method. Nitrite was determined by the col-

https://doi.org/10.5194/bg-18-1601-2021                                                    Biogeosciences, 18, 1601–1618, 2021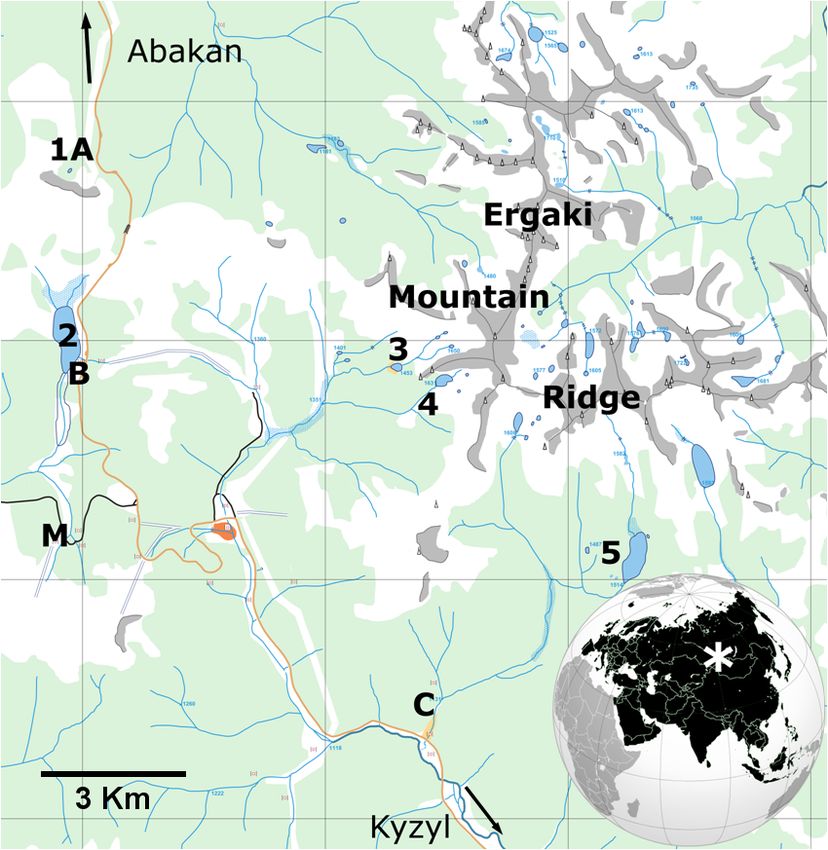
1604                                              D. Diaz-de-Quijano et al.: Winter atmospheric deposition on Siberian lakes

Figure 2. Records at the Olenya Rechka Meteorological Station. (a) Climograph (1 February 2005–30 April 2019). The median yearly
precipitation was 1242.975 mm, with winter (2 October to 5 April) and summer precipitations of 464.95 and 778.025 mm, respectively.
Temperature: median (red), interquartile range (yellow band), 5th to 25th percentiles and 75th to 95th percentiles (lower and upper golden
bands), and below the 5th percentile and above the 95th percentile (lower and upper orange bands). (b) Snowpack thickness (2005–2017):
median (black), interquartile range (white band), 5th to 25th percentiles and 75th to 95th percentiles (lower and upper light gray bands),
and below the 5th percentile and above the 95th percentile (lower and upper dark gray bands). The red line corresponds to the 2016–2017
snowpack thickness record until the snow sampling date. (c) Air temperatures measured every 3 h during the time period when analyzed
snowpacks were laying on their respective locations (2016–2017).

Table 1. Sampling sites and distance to local perturbations. Temporary summer camps are present on the shore of Lake Svetloe and used to
be on that of Lake Raduzhnoe. See Table S1 from Diaz-de-Quijano et al. (2020) for lake and watershed cover characteristics.

                              Symbol in    Latitude           Longitude          Altitude    Distance in meters to local
                              the map                                                 (m)         pollution sources
                                                                                            Road   Cottage    Inflow from
                                                                                                                   houses
                Tsirkovoe     1, A         52◦ 520 28.300 N   93◦ 140 53.100 E      1428     466        –               –
                Oiskoe        2, B         52◦ 500 28.300 N   93◦ 140 46.000 E      1418     251      229             288
                Tushkan       C            52◦ 460 16.900 N   93◦ 210 17.000 E      1125     725      471               –
                Raduzhnoe     3            52◦ 500 08.400 N   93◦ 200 44.500 E      1462    4600     3000               –
                Karovoe       4            52◦ 490 57.400 N   93◦ 210 41.600 E      1632    5265     4000               –
                Svetloe       5            52◦ 480 02.200 N   93◦ 250 05.400 E      1511    5647     5470               –

orimetric method after reacting with sulfanilamide and α-                tional standards (Gladyshev et al., 2015; Tolomeev et al.,
naphthylamine. Detection limits were 0.001 mg N-NO−      −1
                                                      3 L ,              2014), which generally coincide to those from the American
0.0002 mg N-NO−   2  L −1 and 0.011 mg N-NH L−1 . Lake wa-
                                             4                           Public Health Association (APHA) (APHA, 1989). In 2015
ter dissolved inorganic nitrogen (DIN) was calculated as the             nutrients were measured using a Lachat QuickChem 8500
sum of nitrate, nitrite and ammonium. Soluble reactive phos-             Series 2 Flow Injection Analysis (FIA) System (Hach
phorus was assessed using the ascorbic acid and ammonium                 Ltd, Loveland, CO, USA). The method detection lim-
molybdate method. Total phosphorus (TP) was measured the                 its (MDLs) were 0.0263 mg N-NO3 L−1 , 0.0057 mg N-
same way after persulfate digestion of unfiltered samples. In            NO2 L−1 , 0.0479 mg N-NH3 L−1 and 0.0011 mg P-PO4 L−1 .
the 2015 survey, lake water TP was calculated as the sum                 As for SO−4 analysis, snow and lake water samples were con-
of soluble reactive phosphorus and seston particulate phos-              centrated by heating; a HClO4 and HNO3 mixture was added
phorus (PP). The latter was collected on the abovementioned              and evaporated; and then an ion-exchange column was used
membrane filters and measured after persulfate digestion.                to remove interferences of cations. Samples were titrated
All these analyses were made according to the Russian na-                with a BaCl2 solution in the presence of nitrochromazo un-

Biogeosciences, 18, 1601–1618, 2021                                                         https://doi.org/10.5194/bg-18-1601-2021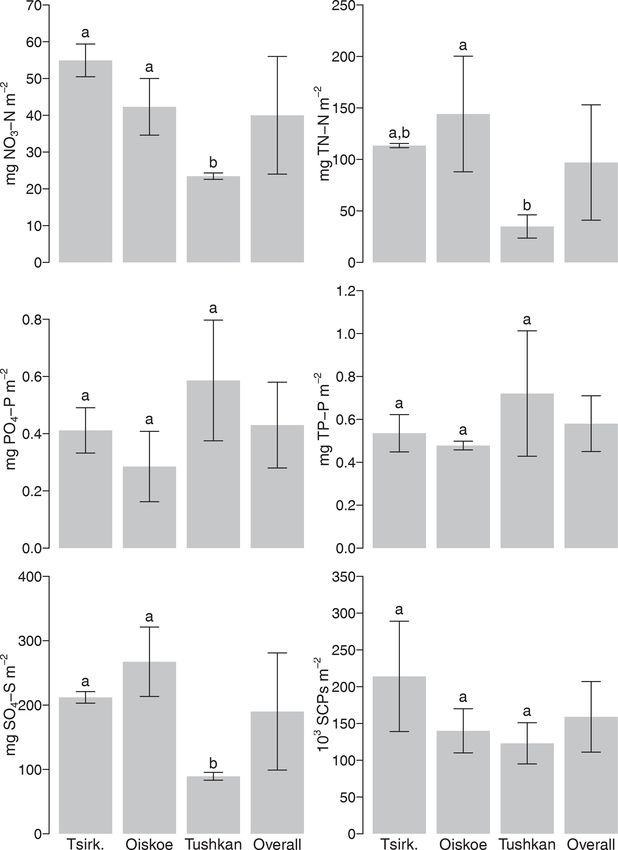
D. Diaz-de-Quijano et al.: Winter atmospheric deposition on Siberian lakes                                                    1605

til the appearance of a blue color (Kalacheva et al., 2002).        (ellipsoid) distance method within the “geosphere” package
Finally, total nitrogen (TN) was digested from total snow           (Hijmans, 2017). The “openair” package was used to deter-
and lake water samples using persulfate and boric acids and         mine wind direction and to draw wind roses (Carslaw and
subsequently transformed into NO−   3 (Grasshoff et al., 1983).     Ropkins, 2012). The number of coordinates per hour at 0 m
The natural light absorption of this nitrate at 210 nm was de-      above model ground level was calculated to characterize the
termined using a SPEKOL 1300 photometer (Analytik Jena,             direct interaction of each air mass with Earth’s crust. Retro-
Germany) and corrected for organic matter interference by           trajectories were mapped using the “ggmap” package (Kahle
subtracting absorption at 275 nm (Slanina et al., 1976).            and Wickham, 2013). One-way ANOVA comparing sites and
                                                                    Pearson correlation analyses of chemical and wind variables
2.3   Chlorophyll and SCP analyses                                  in the seven analyzed snow core sections were performed us-
                                                                    ing built-in functions of the R statistical environment.
A known fraction of melted snow samples was filtered                   Detailed watershed land cover and land use maps were
through glass fiber filters (Whatman GF/C) to collect SCPs          manually defined for each lake. Polygons were defined using
(Mosello et al., 1997). Nitric, hydrofluoric and chlorhydric        QGIS 3.14.16-Pi on the basis of Google Satellite and Open-
acids were used to remove organic, siliceous and carbon-            StreetMap XYZ tiles at a resolution that distinguished single
ate material, respectively (Rose, 1994; Yang et al., 2001).         trees. Lakes, whole watersheds, and different vegetation and
Determinate fractions of the samples were mounted on                land cover areas were calculated using the ellipsoidal project.
NAPHRAX and counted at 400 times zoom under an Ax-
iostar Plus microscope (Zeiss). Negative controls and a sed-
iment reference standard were likewise processed to correct         3     Results and discussion
final counts for eventual experimental bias (Rose, 2008).
   Phytoplankton chlorophyll was assessed according to              3.1    Potential fragmentation of nutrients by snow
the UNESCO (United Nations Educational, Scientific and                     melting
Cultural Organization) standard protocols (Wright et al.,
1997). Samples had been filtered in the field laboratory            The three sampled snow cores were 115 cm deep but had
through BaSO4 -covered Porafil 0.45 µm membrane filters             different snow water equivalent (SWE) values: 25 ± 1 cm in
(Macherey-Nagel, Germany), folded inwards and frozen.               Tsirkovoe, 27 ± 1 cm in Oiskoe and 12 ± 0.3 cm in Tushkan.
They were then left to thaw, dried in the dark and scraped          First of all, the snowpack temperature profile was mea-
along with BaSO4 into centrifuge tubes. Pigments were ex-           sured to determine if snow melting could have occurred be-
tracted in 100 % acetone for 9 h in the dark at +4 ◦ C. Af-         fore sampling. Major snow thawing can be discarded in any
ter filtration through 0.2 µm polycarbonate filters, MQ water       of the three sampling sites because snow temperature was
was added to get pigments dissolved in a 90 % acetone solu-         not around 0 ◦ C but always lower. Nevertheless, the deep-
tion (final concentration). Photometric measurements were           est snowpack layers fall within the range between −2 and
used to calculate chlorophyll concentrations (Jeffrey and           0 ◦ C: Oiskoe at 110 cm deep, Tsirkovoe from 90 to 110 cm
Humphrey, 1975).                                                    and namely Tushkan from 60 to 110 cm deep. This indi-
                                                                    cates that snowmelt was either about to occur or could have
2.4   Air mass retro-trajectory analysis, maps and                  even started in these particular layers, triggering a sequential
      statistics                                                    elution of solutes (Mosello et al., 1997). In that hypotheti-
                                                                    cal case, snowpack-based atmospheric deposition estimates
The retro-trajectories of air masses flowing on the three           would be biased. In order to discard such a case, solute con-
snow sampling sites were obtained using the Hybrid Single-          centrations in the upper and colder snow layers were com-
Particle Lagrangian Integrated Trajectory (HYSPLIT) model           pared to those in the deeper and warmer ones (Fig. 3 and
for archive trajectories (Rolph et al., 2017; Stein et al., 2015)   Table S3 from Diaz-de-Quijano et al., 2020).
of the National Oceanic and Atmospheric Administration Air             The hypothesis was that deeper and warmer layers, sus-
Resources Laboratory (NOAA ARL, USA). A total of 187                pect of possible melting, would show lower solute concen-
daily retro-trajectories embracing the sampled period of at-        tration in case of important melting, preferentially in those
mospheric deposition were reconstructed as the snowpack             solutes that elute firstly during snow melting. Yet, because
bulk deposition airshed. Each trajectory started 3 d back in        the first centimeters of snowpack were formed much faster
the past. It recorded the latitude, longitude and altitude coor-    than the rest of the snowpack, it is conceivable that the deep
dinates every hour and ended up at the snow sampling coor-          layers were originally poorer in airborne chemicals and par-
dinates, at 0 m above model ground level at 24 h for consec-        ticles, which would affect the initial hypothesis. Indeed, the
utive days. All the analyses were performed within the R en-        first third of snowpack thickness at the Olenya Rechka Me-
vironment (R Development Core Team, 2017). Total retro-             teorological Station deposited in only 19 d (from 1 to 19 Oc-
trajectory length and average wind speed the hour before get-       tober), whereas it took 39 d (from 1 October to 8 November)
ting to the sampling point were calculated using the Vincenty       to attain half of its thickness at the sampling date (i.e. 187 d

https://doi.org/10.5194/bg-18-1601-2021                                                    Biogeosciences, 18, 1601–1618, 2021
1606                                               D. Diaz-de-Quijano et al.: Winter atmospheric deposition on Siberian lakes

                                                                       Besides, sulfate also had slightly lower concentrations in
                                                                       the deep snow layers, but this difference was not statis-
                                                                       tically significant. This is especially explanatory because
                                                                       preferential elution of ions during snowmelt occurs either
                                                                       in the sequence of SO2−            −       +
                                                                                                4 > NO3 > NH4 (Kuhn, 2001) or
                                                                           2−       +       −
                                                                       SO4 > NH4 > NO3 (Wang et al., 2018a), but sulfate al-
                                                                       ways elutes preferentially to inorganic nitrogen species, ac-
                                                                       cording to the literature (Cragin et al., 1996; Kuhn, 2001;
                                                                       Stottlemyer and Rutkowski, 1990; Williams and Melack,
                                                                       1991). In other words, higher proportions of sulfate are re-
                                                                       leased during early snow-melting steps as compared to ni-
                                                                       trate or ammonium. As a result, only significantly lower val-
                                                                       ues of sulfate should be observable in incipient thawing snow
                                                                       layers, whereas both sulfate and nitrate would be signifi-
                                                                       cantly leaked at a more advanced thawing stage. Therefore,
                                                                       we suggest that the only observed differences in nitrate con-
                                                                       centrations between layers might not be due to snow melting.
                                                                       Even if it is true that sulfate also tends to be lower at deep
                                                                       warm snow layers, the fact that it is non-significant allows
                                                                       us to discard thawing as a cause and entails sulfate load esti-
                                                                       mates that would not be thaw-biased as with any of the other
                                                                       solutes, which should elute at a later stage. As a conclusion,
                                                                       snowpack-based estimates of atmospheric deposition should
                                                                       always be cautiously considered, but major elution of so-
                                                                       lutes due to snow melting was not detected in the present
                                                                       study, probably thanks to the consistently negative tempera-
                                                                       tures along almost the whole integrated time period.

                                                                       3.2   Snow nutrients and pollutants composition
Figure 3. Chemical composition of upper (dark gray) and lower
(light gray) layers of the 2016–2017 snowpack in the Ergaki moun-
                                                                       Nutrient concentrations in Ergaki snowpack (Table 2 and
tains. All values are in µg L−1 except SCPs (counts L−1 ). Bars rep-
                                                                       Table S3 from Diaz-de-Quijano et al., 2020) generally
resent mean values, and whiskers represent the standard deviation.
The two upper layers were averaged in Tsirkovoe, where the snow        take intermediate positions in comparison with other snow-
core was divided into three layers. Column pairs with letters “a”      pack studies around the world. For instance the average of
and “b” are significantly different (one-way ANOVA, p-v < 0.05         191 ± 35 µg NO3 -N L−1 in Ergaki is comparable to an old
in the case of nitrate and t tests in the other cases; n = 3 except    record in the Pyrenees (115 ± 106 µg NO3 -N L−1 , Catalan,
in Tsirkovoe, where the upper layer is n = 4 and the lower layer is    1989) but lower than a later one in the same mountains
n = 2).                                                                (280 µg NO3 -N L−1 , Felip et al., 1995). It also takes an in-
                                                                       termediate position relative to the Alps: lower than in Ty-
                                                                       rolean Alps in the early 1990s (308 µg NO3 -N L−1 , Felip et
after initial snowpack formation). It is likely that the deep-         al., 1995) but higher than most sampling points in the French
est Tsirkovoe, Oiskoe and Tushkan snow core segments (80–              Alps in a more recent study (Dambrine et al., 2018). Finally,
115 cm in the first case and 60–115 cm in the others) would            nitrate concentration in Ergaki snow was in between that
have formed in about 19 and 39 d, respectively. Nevertheless,          of the Bothnian Bay of the Baltic Sea (480 ± 130 µg NO3 -
if the precipitation rate had a determinant effect on the verti-       N L−1 , Rahm et al., 1995) and the Lake Tahoe basin in the
cal distribution of solute and particle content, the lower val-        Sierra Nevada (14–138 µg NO3 -N L−1 , Pearson et al., 2015).
ues in deeper layers should be expected in all the measured            Note that, paradoxically, the former is considered a region of
variables, and it was not the case (Fig. 3).                           low atmospheric nitrogen deposition (Bergström and Jans-
   Thus, no significant differences were found between the             son, 2006), whereas the latter has been considered as an
upper and deeper layers in any of the measured variables               airborne-nutrient-enriched area (Sickman et al., 2003), where
except for nitrate, with lower values in the deep layers               atmospheric nitrogen deposition has shifted phytoplankton
(ANOVA, p = 7.75×10⁻⁵ ). The other significant differences             limitation from N and P colimitation to persistent P limita-
between upper and deeper snow layers (TN in Tsirkovoe,                 tion (Jassby et al., 1994).
SRP in Tushkan, TP in Oiskoe and SCPs in Tushkan;                         Total nitrogen and total phosphorus in Ergaki snow-
t tests) were not consistent across sampling sites (Fig. 3).           pack (Table 2) were higher than in the first men-

Biogeosciences, 18, 1601–1618, 2021                                                      https://doi.org/10.5194/bg-18-1601-2021
D. Diaz-de-Quijano et al.: Winter atmospheric deposition on Siberian lakes 1607
Table 2. Average concentrations, half-year depositions and estimated yearly deposition rates, as averaged by the three sampled sites (µg L−1 ,
mg m−2 and mg m−2 yr−1 , respectively) (SCPs in counts L−1 , 103 counts m−2 and 103 counts m−2 yr−1 ). Mean values are shown, with
the standard deviation in parenthesis; “n.d.” means non detected. Yearly deposition rates were estimated on the basis of measured winter
depositions and either assuming a constant deposition rate (time-weighted estimate, third row) or a precipitation-dependent deposition rate
(precipitation-weighted estimate, fourth row). See Sect. 3.3 for further discussion.
NH4 -N NO2 -N NO3 -N TN PO4 -P TP SO4 -S SCPs
Average concentration n.d. n.d. 191 483 2.55 3.33 864 805 SCPs L−1
in snow (µg L−1 ) (34) (165) (2.13) (2.42) (106) (275)
Half-year deposition n.d. n.d. 40 97 0.43 0.58 190 159 × 103
(mg m−2 ) (16) (56) (0.15) (0.13) (91) SCPs m−2
(48)
Deposition rate n.d. n.d. 79 191 0.84 1.13 372 312 × 103
(∼ time) (47) (132) (0.48) (0.60) (236) SCPs m−2
(mg m−2 yr−2 ) yr−1 (174)
Deposition rate n.d. n.d. 119 288 1.26 1.71 560 470 ×
(∼ precipitation) (71) (198) (0.73) (0.91) (356) 103 SCPs m−2
(mg m−2 yr−2 ) yr−1 (262)
Modeled deposition For the ca. 100 0.1–0.5 ca. 2 (Ma- 100–200
rates (mg m−2 yr−2 ) year (Lamarque (Mahowald howald et (Lamarque
2000 et al., 2013) et al., 2008) al., 2008) et al., 2013)
For the 50–200 50–200
year (Lamarque (Lamarque
2030 et al., 2013) et al., 2013)
tioned Pyrenean study but lower than in the Baltic: centrations reached intermediate–low values, but sulfate con-
194 ± 135 and 1054 ± 363 µg TN-N L−1 and 2.38 ± 0.59 and centration was remarkably high in Ergaki snowpack.
9.3 ± 5.1 µg TP-P L−1 , respectively. Total phosphorus con- The organic nitrogen in Ergaki snowpack represented
centration also was within the lowest range of that mea- 56 ± 19 % of the total nitrogen, which is a high but reason-
sured around Lake Tahoe (3–109 µg TP-P L−1 , Pearson et able value as compared to the literature. The relative share
al., 2015). Nevertheless, ammonium and nitrite were unde- of organic to total nitrogen in the snowpacks of the Pyre-
tectable in the present study but detected in most of the pre- nees, Alps and Sierra Nevada (USA) and on the Baltic Sea
vious studies in the snowpack (e.g. Catalan, 1989; Pearson were 10 ± 9 %, 41 ± 13 %, 49 ± 17 % and 21 ± 12 %, respec-
et al., 2015). Ammonium was also detected in the snow sur- tively (Catalan, 1989; Clement et al., 2012; Pearson et al.,
rounding the city of Krasnoyarsk by our own lab, using the 2015; Rahm et al., 1995). Organic nitrogen has been reported
same analytical method as here (O. V. Anishchenko, unpub- elsewhere to be higher in snowpack records than in wet de-
lished data). It is very likely that ammonium concentrations position because dry deposition of organic nitrogen is inte-
in the present study were under the detection limit, as ni- grated in the snowpack and because microbial uptake and
trate values were more than 5-fold lower than in the Kras- assimilation of inorganic nitrogen might occur in the snow-
noyarsk snow samples, where ammonium had been detected. pack (Clement et al., 2012; Pearson et al., 2015). In the case
Finally, nutrient bioavailability is an attribute of the Ergaki of microbial conversion from inorganic to organic nitrogen,
snowpack, as 73 ± 12 % TP was in the form of phosphate and it could be hypothesized that deeper and older snow lay-
about 44 ± 19 % TN was nitrate. ers should have higher organic nitrogen shares. Such a pat-
Besides ammonium and nitrite, sulfate concentrations in tern was only observed at Tushkan (ANOVA, p = 0.0178),
Ergaki snowpack were also unusual. Sulfate was the most whereas no significant differences were found in the percent-
abundant of the measured ions. It doubled that in the Pyre- age of organic nitrogen between the upper and lower snow
nees in the late 1980s (401 ± 106 µg SO4 -S L−1 , Catalan, layers at the Oiskoe and Tsirkovoe sites. We, therefore, hy-
1989) and quadrupled that on Lake Tahoe (Pearson et al., pothesize that a different combination of phenomena might
2015). Sulfate concentration in Ergaki snowpack was only be responsible for organic nitrogen dominance at different
similar to the highest values in the literature for non-urban sites.
areas, such as on the southern coast of Lake Superior in the
1980s (828 ± 216 µg SO4 -S L−1 on average, Stottlemyer and
Rutkowski, 1990). Altogether, nitrogen and phosphorus con-
https://doi.org/10.5194/bg-18-1601-2021 Biogeosciences, 18, 1601–1618, 20211608 D. Diaz-de-Quijano et al.: Winter atmospheric deposition on Siberian lakes
3.3 Atmospheric deposition load Ergaki precipitation seasonality (1.95) would correspond to a
phosphorus deposition seasonality of about 5.5. If we applied
The roughly half-year cumulative deposition corresponding these factors (2.4 and 5.5) to estimate snow-free season phos-
to the snow season of 187 d is summarized in Table 2 (sec- phorus deposition and added it to measured snow season de-
ond row; see Table S3 from Diaz-de-Quijano et al., 2020, for position, the yearly deposition rates would be 1.972 mg TP-
original measurements). Unfortunately, snow-free season de- P m−2 yr−2 and 1.462 mg PO4 -P m−2 yr−2 and 3.77 mg TP-
positions were not measured in the present study, and, con- P m−2 yr−2 and 2.795 mg PO4 -P m−2 yr−2 , respectively. The
sequently, yearly deposition rates could not be determined. latter factor (5.5) would definitely provide an overestimation
Nevertheless, preliminary estimations were conducted as- of snow-free season phosphorus deposition. The former one
suming either a constant deposition rate along the year – (2.4) resulted in slightly higher values than our precipitation-
time-weighted estimate – or a precipitation-weighted deposi- dependent estimate, and it is not certain if that would either
tion rate (Table 2, third and fourth rows, respectively). These over- or underestimate the actual value.
assumptions entail different simplifications concerning the The best atmospheric nitrate deposition estimate was the
seasonal pattern of emission, transport and deposition of the precipitation-dependent estimate (Table 2, fourth row), ac-
different chemical species in this particular part of the world. cording to its seasonal distribution in other natural forested
The precipitation-weighted estimate should be, a priori, a sites in the literature. The Ergaki autumn–winter nitrate de-
more accurate estimate because wet deposition is known position was 4 and 5 times lower than in a Chinese “back-
to be the main contributor to total deposition in wet cli- ground” and a southern Bohemian forest site, respectively
mates like that in the Western Sayan Mountains. Indeed, the (Kopáček et al., 2011a; Xu et al., 2018). Nevertheless, at-
accumulated precipitation registered in the Olenya Rechka mospheric concentrations of HNO3 and total inorganic nitro-
Meteorological Station during the studied snow season was gen species were stable along the year in the Chinese back-
419 mm, whereas an amount almost double that (819 mm) ground site, and only particulate NO3 was slightly higher
was registered during the following months up to a complete in autumn–winter than spring–summer. In the southern Bo-
year. Note that the 2016–2017 seasonality was slightly more hemian forest, the April–September precipitation and nitrate
prominent than the median 2005–2019 seasonal precipitation deposition were only 15 % and 5 % higher than in October–
(Fig. 2a). Nevertheless, both estimations neglect the emission March, respectively. Therefore, atmospheric nitrogen con-
seasonality, which might turn the constant deposition esti- centration was also fairly stable at this site, with just slightly
mate into the most credible option in some cases. To evaluate higher atmospheric nitrate concentrations in autumn–winter
our different estimates, we compared them to seasonal depo- that would be mainly counterbalanced by a lower precipita-
sitions in the literature and discussed their likely seasonal tion. In the light of these observations, it is likely that atmo-
emissions. spheric nitrate concentration in Ergaki during the snow sea-
The precipitation-dependent estimate of atmospheric son was either similar to or slightly higher than in the snow-
phosphorus deposition (Table 2, fourth row) was probably free season. In case of invariable atmospheric nitrate con-
the closest to the actual yearly load, although it might be an centrations throughout the year, higher precipitation during
underestimate. That is because two-thirds of the yearly pre- the snow-free season would trigger also a higher nitrate de-
cipitation and biogenic aerosols – mainly pollen – co-occur position, and our precipitation-dependent estimate (Table 2,
during the snow-free season, and pollen represents an impor- fourth row) would be our best estimate. In the hypothetical
tant share of atmospheric phosphorus sources in taiga land- case where the proportion between the snow and snow-free
scapes of low atmospheric phosphorus like Ergaki (Banks season atmospheric nitrate concentrations were the same as
and Nighswander, 2000; Doskey and Ugoagwu, 1992; Ma- in the Chinese site (1.24) and taking into account the higher
howald et al., 2008; Wang et al., 2015). In order to evaluate snow-free season precipitation in Ergaki (1.95), the result-
the magnitude of our underestimation, we checked similar ing snow-free nitrate deposition would be about 1.6 times
studies with seasonal resolution in cold forest landscapes in- higher than that measured in the snow season, and the yearly
cluding the Lake of Bays (ON, Canada) (Eimers et al., 2018), load would be about 104 ± 62 mg NO3 -N m−2 yr−1 . In con-
Lake Simcoe (ON, Canada) (Brown et al., 2011) and a Ti- clusion, the actual yearly nitrate deposition should be some-
betan forest (Wang et al., 2018b). Phosphorus loads during where in between the time-dependent and the precipitation-
the snow period were about 9, 11 and 18 times larger than dependent estimates but closer to the latter estimate.
in Ergaki; snow-free season atmospheric phosphorus depo- The time-based sulfate atmospheric deposition estimate
sitions were 2.4, 5 and 7.4 times higher than in the snow was better than the precipitation-dependent estimate. Win-
season; and snow-free season precipitations were 0.88, 0.91 ter atmospheric sulfate depositions were higher than in sum-
and 9.1 times that of the snow season, respectively. Thus, in mer both in the pristine Canadian Rocky Mountains (2–
the hypothetical case that phosphorus deposition seasonal- 5 times) and in a Japanese site receiving sulfate from Chi-
ity strictly depended on the yearly phosphorus load, the sea- nese coal combustion (3.5–4 times) (Ohizumi et al., 2016;
sonal factor for Ergaki should be much lower than 2.4. On the Wasiuta et al., 2015). Unexpectedly high seasonality in the
other hand, if it depended on precipitation seasonality alone, pristine location was due to much higher precipitation in
Biogeosciences, 18, 1601–1618, 2021 https://doi.org/10.5194/bg-18-1601-2021D. Diaz-de-Quijano et al.: Winter atmospheric deposition on Siberian lakes 1609 winter, but the atmospheric sulfate concentration was rela- of Siberia in 1850 or Antarctica and unpolluted parts of the tively constant throughout the year. On the other hand, sul- oceans in 2000 (Lamarque et al., 2013). As for total phos- fate deposition seasonality in the polluted site was attributed phorus deposition, the uncertainty linked to non-measured to higher coal burning and emissions in winter. As winter spring–summer biogenic and wildfire contributions makes atmospheric sulfate deposition in Ergaki (190 ± 91 mg SO4 - it hard to position the studied site within a world ranking. S m−2 ) was about 4 times higher than the background val- Our estimate excluding these important biogenic and wildfire ues in the Canadian Rocky Mountains (≤ 50 mg SO4 -S m−2 ) contributions (1.71 mg TP-P m−2 yr−2 ) and our literature- and 11–12 times lower than in a Japanese site, it is likely based estimate including them (1.972 mg TP-P m−2 yr−2 ) that winter atmospheric sulfate concentrations in Ergaki were would be lower than any terrestrial measurement, accord- also higher than in summer. In this case, the precipitation- ing to a worldwide review (≥ 3 mg TP-P m−2 yr−2 ) (Tipping weighted yearly deposition estimate would be an overestima- et al., 2014). Nevertheless, it is also possible that pollen tion, but we cannot rigorously determine if the actual value and wildfires accounted for a larger contribution and that would lay above or below the time-weighted estimate. At the present study site exceeded the latter value. In any most, we could assume a linear relationship between yearly case, atmospheric phosphorus deposition in Ergaki would sulfate deposition load and its seasonality. Then, a seasonal- be above the background values corresponding to the poles ity 11–12 times lower than in the Japanese site from the lit- and the oceans (≤ 1–2 mg TP-P m−2 yr−2 and ≤ 0.5 mg PO4 - erature would imply a yearly deposition load of 251 mg SO4 - P m−2 yr−2 ), excluding the Atlantic strip downwind of the S m−2 in Ergaki. Accordingly, our time-dependent estimate Sahara (Mahowald et al., 2008). Finally, our yearly sulfate would be our best estimate but still an overestimate. In con- deposition estimate should be cautiously considered, as it clusion, for the sake of a simpler discussion, we will only could be overestimated due to regionally widespread coal consider the time-weighted estimate of yearly sulfate deposi- combustion for heating during winter (see Sect. 3.5). In any tion and precipitation-weighted estimates of phosphorus and case, it would positively exceed the background values of 0– nitrate depositions. Nevertheless, these estimates must be in- 50 and 50–100 mg SO4 m−2 yr−1 typical in the polar areas terpreted cautiously: whereas nitrate and sulfate deposition and Southern Hemisphere oceans, respectively (Lamarque et estimates might be slightly overestimated, phosphorus would al., 2013). be underestimated. The selected yearly deposition rate estimates (Table 2, 3.4 SCP deposition rate third and fourth rows) were compared to global model pre- dictions from the literature (Table 2, fifth row). A global de- The calculated SCP deposition rate in the Ergaki Nat- position model predicted ca. 100 mg NO3 -N m−2 yr−1 and ural Park (312 ± 174 × 103 SCPs m−2 yr−1 ) was high 100–200 mg SO4 -S m−2 yr−1 loads in the Western Sayan above the background rates recorded in the Baikal mid- Mountains for the year 2000, whereas it forecasted ranges dle basin (57 × 103 SCPs m−2 yr−1 ), Svalbard Islands from 50 to 200 mg NO3 -N m−2 yr−1 and 50–200 mg SO4 - (13 × 103 SCPs m−2 yr−1 ) and Nevada Rocky Mountains S m−2 yr−1 in 2030, according to different scenarios (Lamar- (1.3 ± 0.8 × 10³ SCPs m−2 yr−1 ) (Reinemann et al., 2014; que et al., 2013). The EMEP (European Monitoring and Rose et al., 1998). Indeed, it is also far below the records Evaluation Programme) wet deposition model reported sim- in more polluted areas such as the case of Lake Paione ilar values (50–100 mg oxidized N m−2 yr−1 and 50–200 mg Superiore in the western Alps as it used to be during oxidized S m−2 yr−1 , including SO2 and SO4 and HNO3 , the more polluted times of the 1980s and early 1990s HONO and NO3 , respectively) for the year 2017 on the limits (40 900 × 103 SCPs m−2 yr−1 ) or a set of northern African of their geographical prediction, at a location about 200 km lakes (1098–23 694 × 103 SCPs m−2 yr−1 ), where produc- west of our sampling site (Fagerli et al., 2019; Gauss et al., tion of electricity by thermal means has increased in the last 2019). Therefore, our 2016–2017 nitrate deposition estimate years (Rose et al., 1999, 2003). In comparison to a couple roughly fitted the models, whereas sulfate deposition was of lakes sampled in 1992 in the Khamar-Daban Mountains clearly higher than expected. In the case of phosphorus de- (southern Siberia) (262 and 780 × 103 SCPs m−2 yr−1 ), the position, our TP estimate was slightly lower than predicted SCP deposition rate in Ergaki was more similar to the lake (ca. 2 mg TP-P m−2 yr−1 ), although uncertainties linked to that was relatively farther from the Irkutsk pollution source pollen contribution could make the actual TP-P deposition (Rose et al., 1998). Our data also fall in the lower range match or even surpass the modeled values. On the other hand, of the Tatra Mountains (225–5240 × 103 SCPs m−2 yr−1 ) the phosphate fraction would be clearly higher than expected and the Pyrenees (229–630 × 103 SCPs m−2 yr−1 ) in the (0.1–0.5 mg PO4 -P m−2 yr−1 , Mahowald et al., 2008). mid-1990s (Rose et al., 1998, 1999; Šporka et al., 2002). An In conclusion, the atmospheric nitrate deposition in the Er- interesting and paradoxical case to compare with is Lake gaki mountain ridge is at the very low range and is between 5 Grånästjärn in 1980, with a very similar SCP deposition rate and 20 times lower than in polluted areas of the world. Nev- (300 × 103 SCPs m−2 yr−1 ) but sulfate and nitrate deposition ertheless, it is clearly above the background deposition of rates 2.6 and 1.8 times higher than in Ergaki (Bergström 0–50 mg NO3 -N m−2 yr−1 , as used to be the case for most et al., 2005; Wik and Renberg, 1996). This may lead to https://doi.org/10.5194/bg-18-1601-2021 Biogeosciences, 18, 1601–1618, 2021
1610 D. Diaz-de-Quijano et al.: Winter atmospheric deposition on Siberian lakes
thinking that our SCP, sulfate and nitrate data did not match.
Nevertheless, at least sulfate depositions differing up to ca.
40 % have been observed at sites with particularly low SCP
deposition rates (Rose and Monteith, 2005). Additionally,
sulfate measurements in Sweden might include a higher
percentage of marine sulfate than in the heart of Eurasia.
Finally, apart from this single Swedish lake where the
proportion of nitrate to SCPs differs so much from ours,
both SCP and nitrate deposition rates measured in this study
are generally comparable to the low range of values in the
literature.
3.5 Spatial distribution and origin of atmospheric
depositions
The spatial distribution of deposited chemical species
showed two different patterns. On the one hand, phosphorus
forms and SCPs showed an even distribution between sam-
pling sites. On the other hand, NO3 , TN and SO4 depositions
were significantly higher on Tsirkovoe and Oiskoe than on
Tushkan (Fig. 4). Even distribution of phosphorus deposi-
tion suggests a common source of atmospheric phosphorus
for all Ergaki sites. Under very low atmospheric phospho-
rus deposition, like in the Ergaki mountain ridge, biogenic
and combustion origins are more important than mineral ori-
gin (Mahowald et al., 2008). This is supported by several
pieces of evidence in our case. Firstly, even if the predom-
inant western air mass retro-trajectories partly traverse the
Kazakhstan steppe in a percentage of days, they hardly ever
cross central Asian deserts (Fig. 5a and b). Moreover, di- Figure 4. Half-year deposition of some airborne chemical species
along with snow at three different sites in the Ergaki mountain ridge.
rect contact between air mass retro-trajectories and Earth’s
Bars are average values, and whiskers represent the standard devi-
crust occurs more often in the taiga ecoregion (yellow dots,
ation. Sites with different letters on error bars belong to different
Fig. 5a and b). Finally, the percentage of TP which is solu- groups defined by post hoc Tukey HSD (honestly significant differ-
ble in our snow samples (79 %) is comparable to European ence) analysis (one-way ANOVA p < 0.01).
aerosols (50 %–100 %) but much higher than Saharan dust
(8 %–25 %) (Mahowald et al., 2008), so it suggests that phos-
phorus aerosols in Ergaki was not of desert origin. Thus, Er-
gaki mountain lakes differ from Lake Baikal, which can be less, a shorter distance between Tsirkovoe and Oiskoe and
influenced by dust originating in the Gobi Desert (Jambers their wind regimes might be more decisive, even if the for-
and Van Grieken, 1997). mer is located on the northern face, and the latter is on the
Nitrate and sulfate are tracers of fossil fuel or biomass southern face. The wind speeds there were 3.4 and 3.3 m s−1 ,
combustion (Mahowald et al., 2008). Their spatial correla- respectively, whereas in Tushkan, farther from the ridge, it
tion (lower in Tushkan than in the other two sites, Fig. 4) was 3.0 m s−1 . Despite the fact that the wind rose circular
suggests that alternative nitrate origins like chemical fertiliz- correlation between Tsirkovoe and Oiskoe was not signifi-
ers or secondary transformations like nitrification and deni- cant, their local air mass retro-trajectories were much more
trification by microbes in the snowpack might be unimpor- similar than to Tushkan (Fig. 5d, e and f). Perhaps, the two
tant. In the same vein, nitrate and sulfate had a relatively more northern sites might be also more exposed to the dom-
high, although not significant, Pearson correlation coefficient inant snow-forming westerlies that flow between latitudes of
(0.63) in the seven analyzed snow core sections. The reason 52 and 53◦ N and higher (Fig. 5c). As for SCPs, which are
for lower nitrate and sulfate values in Tushkan is still un- also originated by combustion, the nitrate and sulfate spatial
clear. This site is a forest glade located at an altitude 300 m distribution is not followed. We speculate that the particulate
lower than the other two. We argue that this altitude differ- character of SCPs might impose different atmospheric trans-
ence is too limited to trigger any differences in nitrate de- port properties, so even if SCPs are good tracers of air pol-
position, and, in any case, the higher the site is, the lower lution, slight mismatches between SCPs and chemical pollu-
the expected deposition is (Dambrine et al., 2018). Nonethe- tants might occur (Rose and Ruppel, 2015; Wik and Renberg,
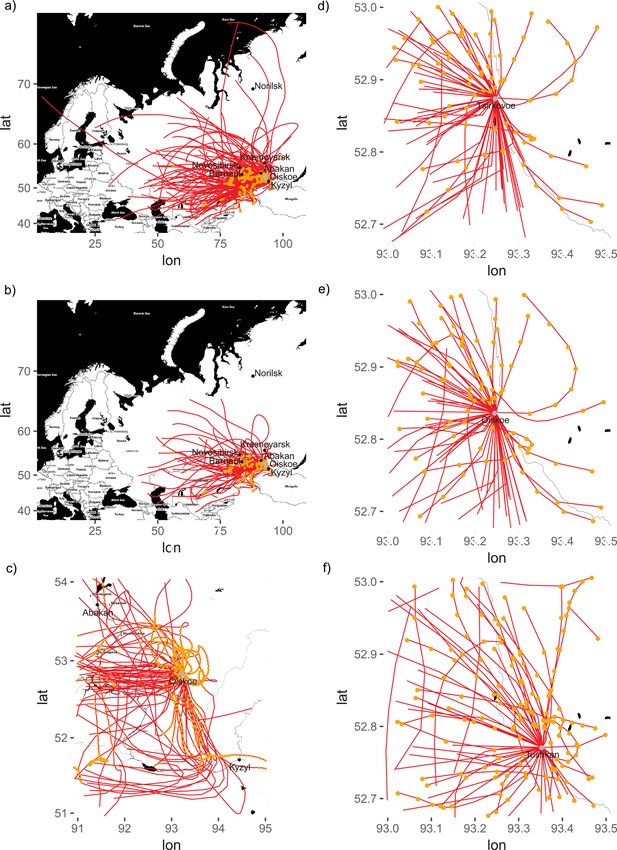
Biogeosciences, 18, 1601–1618, 2021 https://doi.org/10.5194/bg-18-1601-2021D. Diaz-de-Quijano et al.: Winter atmospheric deposition on Siberian lakes 1611 Figure 5. Daily 3 d long air mass retro-trajectories flowing onto Lake Oiskoe from 1 October 2016 to 5 April 2017 (a). Only retro-trajectories of air masses causing precipitation at Lake Oiskoe at different zooms (b, c, e) and at Lake Tsirkovoe (d) and at Tushkan (f). Yellow dots represent hourly records where the air mass retro-trajectories contacted Earth’s crust. Water bodies are in black. Gray lines are either political borders or the road. Sources: map tiles by Stamen Design, under CC BY 3.0. Data by © OpenStreetMap contributors 2014, distributed under a Creative Commons BY-SA License. Air mass retro-trajectories by http://www.ready.noaa.gov (last access: 8 November 2018). 1996). Anyway, a trend to higher values in the northernmost (−0.48), TP (−0.25) and TN (−0.20). This suggests that ni- sites is also observed (Fig. 4). trate deposited in the Ergaki mountains might originate at Finally, local wind speed differences between sites might farther distances than phosphorus and particulate nitrogen. be a tracer of air mass origin. Generally, faster winds would To sum up, we hypothesize that northern cities might con- be capable of delivering chemical species from longer dis- tribute more to the nitrate deposition than southern ones. tances. The average retro-trajectory length had a weak, non- These combustion-produced chemicals would be uploaded significant but still positive Pearson correlation with nitrate to the northernmost half of the dominant westerlies conveyor (0.47) and a negative Pearson correlation with phosphate belt flowing directly onto the Ergaki mountains, rather than https://doi.org/10.5194/bg-18-1601-2021 Biogeosciences, 18, 1601–1618, 2021
1612                                            D. Diaz-de-Quijano et al.: Winter atmospheric deposition on Siberian lakes

on the southernmost half of the westerlies flow, which mainly         The molar stoichiometry of Ergaki lake water was on av-
traverse Kazakhstan and turn northwards to the Ergaki moun-        erage above the Redfield ratio (30.7 ± 34.2 DIN-N / TP-P,
tain ridge just before reaching the city of Kyzyl (Fig. 5c).       Fig. 6a and Table S2 from Diaz-de-Quijano et al., 2020),
These urban sources might include not only those at the lo-        which suggests lake phytoplankton would generally be P lim-
cal scale (Abakan, Minusinsk and Chernogorsk rather than           ited. Nevertheless, values below the Redfield ratio (16 : 1),
Kyzyl in the south) but also those at a regional one (cen-         i.e., corresponding sensu lato to N limitation, were also fre-
tral and eastern southern Siberian rather than northern Kaza-      quently observed. All the lakes had DIN-N / TP-P ratios both
khstan cities).                                                    above and below the Redfield ratio at different surveys with
                                                                   the exception of Lake Tsirkovoe, which was always above
                                                                   the Redfield ratio (P limitation) (Table 3). Most lakes had
3.6    Nutrient deposition and lake water stoichiometry
                                                                   DIN-N / TP-P ratios below the Redfield ratio in June and Au-
                                                                   gust 2011 and early September 2015 and above it in June and
The molar stoichiometry of volume-weighted mean con-               August 2012 and late August 2017. Therefore, no temporal
centrations in the snowpack, i.e., the concentrations that         trend can be drawn from our lake water chemistry data set
would be measured if we had sampled the whole snow                 (see Table 3). Besides to the Redfield criterion, a previous
core at once, were 169 ± 76 NO3 -N / TP-P, 251 ± 134 NO3 -         study determined that DIN-N / TP-P molar ratios of 3.3, 4.9
N / PO4 -P and 486 ± 357 TN-N / TP-P (mol mol−1 ). The             and 7.5 would correspond to 75 %, 50 % and 25 % proba-
molar stoichiometry of estimated yearly atmospheric nutri-         bilities of chlorophyll increase under an N enrichment ex-
ent deposition in Ergaki were 169 ± 105 and 128 ± 79 NO3 -         periment (Bergström, 2010). According to this more restric-
N / TP-P (mol mol−1 ) according to the precipitation-              tive criterion, only Lake Oiskoe would approach the 75 %
dependent yearly load estimation and to the abovementioned         probability of having a positive increase of chlorophyll un-
literature-based corrections, respectively. As no other DIN        der N enrichment in the 2015 survey. Nevertheless, it is very
form but nitrate was detected in our samples, the NO3 -            likely that this case was due to watershed-level processes.
N / TP-P ratio can be compared to DIN-N / TP-P ratios in           Forest and peat cover (25 % and 6 %, respectively) in the
the literature. The latter ratio has been previously used to as-   Lake Oiskoe watershed are more important than in other
sess nitrogen and phosphorus bioavailability both from de-         lakes watersheds, and, more importantly, the lake receives an
position and in mountain lake water (Brahney et al., 2015).        inflow passing by nearby houses (Table 1 and Table S1 from
Total phosphorus was used instead of PO4 because (1) other-        Diaz-de-Quijano et al., 2020). A local phosphorus input from
wise, the fast biological uptake of deposited PO4 would lead       nearby houses could have occurred at Lake Oiskoe in 2015,
to underestimating the actual atmospheric load and (2) or-         pointing to the mesotrophic status of the lake. The high TP
ganic phosphorus sources are bioavailable to many mountain         values could be also partly due to having calculated TP as the
lake phytoplankton species via extracellular enzyme activ-         sum of SRP and PP instead of measuring it directly in 2015,
ity, phagotrophy and osmotrophy (Diaz-de-Quijano, 2014;            but only Lake Oiskoe recorded unprecedentedly high values,
Medina-Sanchez et al., 2004). Thus, our estimated NO3 -            which might be due to the mentioned human activities in its
N / TP-P deposition molar ratios in Ergaki would belong            watershed. In conclusion, lake water nutrient stoichiometry
to the higher quartile, as compared to a set of alpine re-         suggests a variable but slightly P-dominated nutrient limita-
gions elsewhere in the world (Brahney et al., 2015) (Fig. 6a).     tion regime.
The closest nutrient deposition stoichiometries to that of Er-        In conclusion, a decoupling between atmospheric deposi-
gaki (precipitation-dependent estimates) were recorded at          tion and the lake water nutrient ratio was observed in Ergaki
the Sant Nicolau valley in the Pyrenees during the second          as compared to many other mountain regions elsewhere in
half of the 1990s (170.5 DIN-N / TP-P, molar) and the Tatra        the world (Fig. 6a). We argue that this was due to the ex-
Mountains (165.8; calculation based on DIN wet deposi-             traordinarily low absolute values of nutrient, especially phos-
tion during 1990–1994 and average TP wet deposition dur-           phorus, atmospheric deposition in the Ergaki mountain ridge.
ing 1998–2009) (Brahney et al., 2015; Kopáček et al., 2000,       Accordingly, the sum of other biogeochemical processes oc-
2011b; Ventura et al., 2000). In the case of the alternative       curring at the watershed soils, runoff, rivers, water column,
128 ± 79 NO3 -N / TP-P (mol mol−1 ) deposition estimate for        sediments, etc. would be sufficient to modify the original sto-
Ergaki, the southern Swedish lake district was the closest         ichiometry of airborne nutrients.
value (125.6). In any case, Ergaki atmospheric nutrient de-
position stoichiometry was much larger than that of northern       3.7   Atmospheric input and lake phytoplankton
Sweden (20.1 molar DIN-N / TP-P), the paradigm of pristine               biomass limitation
areas with very low anthropogenic atmospheric nitrogen de-
position and naturally nitrogen-limited lakes. This was due        Atmospheric nitrogen deposition rate was lower in the West-
to the extraordinary low phosphorus deposition as compared         ern Sayan Mountains than in the most pristine areas in Swe-
to nitrogen, which was also relatively low but not that much       den during the period 1995–2001 and 2 orders of magnitude
(see Sect. 3.3).                                                   lower than the most impacted Swedish region (Bergström

Biogeosciences, 18, 1601–1618, 2021                                                  https://doi.org/10.5194/bg-18-1601-2021
You can also read