Estimating the potential for shared autonomous scooters
←
→
Page content transcription
If your browser does not render page correctly, please read the page content below
Estimating the potential for shared autonomous scooters
                                                                 Dániel Kondor1 , Xiaohu Zhang (张啸虎)1,2,∗ , Malika Meghjani1,3 ,
                                                                             Paolo Santi2,4 , Jinhua Zhao5 , Carlo Ratti2
                                                                     1
                                                                       Singapore-MIT Alliance for Research and Technology, Singapore
                                                                         2
                                                                         Senseable City Laboratory, MIT, Cambridge MA 02139 USA
                                                                    3
                                                                      Singapore University of Technology and Design, 487372 Singapore
                                                                         4
                                                                           Istituto di Informatica e Telematica del CNR, Pisa, Italy
                                                             5
                                                                 Department of Urban Studies and Planning, MIT, Cambridge MA 02139 USA
arXiv:1909.03679v4 [cs.CY] 20 Jul 2020

                                                                                          ∗
                                                                                            E-mail: zhangxh@mit.edu

                                                                                               July 21, 2020

                                         Abstract                                                            traditional modes [2]. Many companies that fall under
                                                                                                             the “sharing economy” paradigm offer new options such as
                                         Recent technological developments have shown significant            ride-hailing and ride-sharing [3], car-sharing [4] and bike-
                                         potential for transforming urban mobility. Considering              sharing [5, 6, 7]. Second, improvements in electric propul-
                                         first- and last-mile travel and short trips, the rapid adop-        sion and battery technology are resulting in cleaner and
                                         tion of dockless bike-share systems showed the possibility          lighter vehicles, reducing local emissions and opening up
                                         of disruptive change, while simultaneously presenting new           possibilities for new vehicle form factors [8, 9]. Lastly,
                                         challenges, such as fleet management or the use of public           rapid advances in autonomous driving can result in pro-
                                         spaces. At the same time, further advances are expected             found changes in urban mobility [10, 11, 12, 13, 14]; indeed,
                                         from adoption of electric vehicles and various forms of ve-         several large companies are racing to be the first to deploy
                                         hicle autonomy. In this paper, we evaluate the operational          fully autonomous taxis in commercial service.
                                         characteristics of a new class of shared vehicles that are
                                         being actively developed in the industry: scooters with                Despite the possibilities afforded by new technologies, it
                                         self-repositioning capabilities, that we expect to become           is still uncertain how the future of urban transportation will
                                         viable in the coming years and present an alternative to            look like and what policies are needed for technological ad-
                                         shared bicycles for short trips. We do this by adapting             vances to result in net benefits. There is an unclear picture
                                         the methodology of shareability networks to a large-scale           about the full benefits and drawbacks of ride-sourcing ser-
                                         dataset of dockless bike-share usage, giving us estimates of        vices, with concerns often raised about potential increase in
                                         ideal fleet size under varying assumptions of fleet opera-          total vehicle travel, congestion, and decreased public tran-
                                         tions. We show that the availability of self-repositioning          sit ridership [15, 16, 17]. Similarly, there are concerns that
                                         capabilities can help achieve up to 10 times higher uti-            the benefits of autonomous cars will be mitigated by in-
                                         lization of vehicles than possible in current bike-share sys-       creased volume of trips and total energy use [11, 12]. Con-
                                         tems. We show that actual benefits will highly depend on            sequently, providing a core transportation infrastructure of
                                         the availability of dedicated infrastructure, a key issue for       high-capacity modes will remain important, with the ques-
                                         scooter and bicycle use. Based on our results, we envision          tion of keeping transit attractive in the age of on-demand
                                         that technological advances can present an opportunity to           autonomous mobility being crucial [18, 19, 20, 21, 22].
                                         rethink urban infrastructures and how transportation can
                                         be effectively organized in cities.                                    A central issue in transportation that has been elusive in
                                                                                                             the past over hundred years is providing first- and last-mile
                                                                                                             travel so that commuters can reach high-capacity modes
                                         1    Introduction                                                   in a convenient and efficient manner. Despite research
                                                                                                             suggesting that ride-hailing can serve this role [15, 23],
                                         The transportation landscape in cities is changing rapidly,         there are concerns whether it could work in a scalable
                                         with three important areas of technological advancement             and affordable manner [23, 16]. In future-looking scenar-
                                         driving disruptive changes [1]. First, connected devices            ios, shared autonomous vehicles (SAVs) are envisioned to
                                         that enable real-time feedback, control, and optimization           provide first- and last-mile transportation in a more cost
                                         are becoming commonplace. The ubiquitous availability of            effective way [24, 18, 19, 20]. Nevertheless, other form fac-
                                         smartphones allowed new operators providing on-demand               tors beside full-size cars should be considered to further
                                         transportation options to successfully compete with more            reduce costs, congestion and energy use. Recently, shared

                                                                                                         1
bicycles and scooters1 have been deployed in many cities hicle fleet operations [41, 13]; a main difference is the slow
to provide a sustainable transportation mode for short speed of SRSPMD vehicles that can be a serious limitation
trips [25, 26, 6, 7, 27, 28]. While popular, these services when estimating which trips can be served consecutively
face serious challenges since imbalances in demand result by the same vehicle. To account for this, we explicitly fo-
in vehicles accumulating in some locations while being un- cus on related factors such as (1) state of infrastructure
available in others; to avoid this, operators are required to and effect of upgrades; (2) effect of predictions in demand
spend significant cost and effort on rebalancing the fleet, on fleet management; (3) variation of fleet utilization with
i.e. employing people to move vehicles to areas with high demand.
demand [29, 5, 30, 31]. Summarizing, the main contributions of this paper are:
In this paper, we consider a new form of transporta-
tion, self-repositioning shared personal mobility devices 1. Investigation into the fleet size requirements and ve-
(SRSPMD) as a potential way of providing efficient first- hicle utilization of an operator of shared scooters with
and last-mile transportation and serving short trips [32]. self-repositioning capabilities based on real-world data
An SRSPMD service would use small electric vehicles, about the demand for short trips.
e.g. scooters, that can move autonomously at slow speed to 2. Explicit characterization of the benefits of limited au-
reposition themselves, but require to be driven by their user tonomy, with the average vehicle speed being a main
during trips. This would allow efficient fleet operations, parameter.
while keeping the vehicles lightweight and simple. With re-
cent interest in new vehicle technologies, there is significant 3. Explicit characterization of the benefit of having a
ongoing research investigating the potential to create var- knowledge of trips in advance for a limited prediction
ious small form-factor autonomous vehicles, e.g. personal window.
mobility devices (PMDs), golf cars, wheelchairs, scooters 4. Explicit characterization of how fleet size and vehicle
or even bicycles [33, 34, 35, 36, 37, 38, 39]; thus we can utilization scales with demand.
expect such vehicles to be available in the near future. As
of 2019, we know of at least one company that is pursuing 5. Consideration of the benefits of selective infrastructure
commercial application of the SRSPMD concept [40]. upgrades.
We perform an evaluation of the benefits of SRSPMDs
under the rigorous theoretical framework of vehicle share-
ability networks [41] using real-world data of shared bicycle 2 The SRSPMD concept
usage [6] and public bus use for short trips in Singapore as
There has been significant research in vehicle technology,
our basis. This results in a characterization of ideal SR-
including lightweight electric propulsion and autonomy.
SPMD fleet size and vehicle utilization required to serve
There are prototype autonomous vehicles of small form-
trips currently taken by shared bikes. We compare these
factor, including buggies [35], wheelchairs [33], and heavy-
results to a simulated scenario of simple fleet management
weight personal mobility devices (PMDs) [34]. These all
without proactive rebalancing and with limited knowledge
provide functionality for autonomous driving with a user
of future trips. This way, we provide reasonable bounds
on board. This however requires the vehicles to be suffi-
of service efficiency for future operators under real-world
ciently bulky and heavy so that balancing is possible with
conditions and evaluate the benefits of predictive fleet man-
a person on board who is not aware of the steering and
agement. These results allow us to characterize the main
movement control – this is in contrast to truly light-weight
benefits and challenges for SRSPMDs in cities.
vehicles such as bicycles and (kick-)scooters that require
While a significant amount of work has focused on bike-
the rider to actively participate in balancing it. Due to
sharing, e.g. on understanding usage patterns [25, 6, 7, 27],
these constraints, providing fully autonomous operations
optimizing fleet rebalancing [30, 5, 31] or determining opti-
with vehicles that are significantly lighter than their pas-
mal fleet size [42, 43, 14], it is yet unclear how these results
senger is likely not possible. Furthermore, navigating in
would apply to an SRSPMD operator, or how to quantify
mixed pedestrian environment presents issues regarding de-
the benefits of self-relocation capabilities. An important
tection and communication of intentions or avoidance of
difference is that while rebalancing for conventional shared
collisions [44, 45, 46, 47]. This can result in autonomous
bikes or scooters is usually performed in batches, under
vehicles adopting a “defensive” driving style, characterized
constraints on the available manpower and vehicles, SR-
by frequent braking and overall low speed that makes them
SPMDs would allow operators to move vehicles individu-
unattractive to passengers.
ally, offering more flexibility. Indeed, our approach is more
Some of the above issues could be solved by “hybrid” ve-
similar to previous work focusing on taxi or autonomous ve-
hicles: in this case, the vehicle is driven by its user, but can
1 In this article, we use the term scooter to refer to a personal also move autonomously when a human is not on board.
mobility device which is suitable to travel on pedestrian path, with This presents two main advantages: (1) vehicles can be
the rider in a standing or sitting position, powered either by the rider smaller and lighter, since there is no need for self-balancing
(i.e. a kick-scooter) or by a small electric motor. We specifically limit
the term to not include small motorcycles that are often referred
with a person on board; (2) autonomous operations can
to scooters in other contexts, but are significantly higher-powered, target slower speeds and more defensive driving styles dur-
primarily designed to be used on roads. ing relocation trips, while during trips with a human, it is
2to manually drive the smaller vehicles.
We expect SRSPMDs to have multiple advantages com-
pared to conventional shared bicycles or scooters. First,
due to autonomous repositioning, they will be able to serve
a larger number of trips without the need for costly man-
ual rebalancing; investigating this benefit is the main focus
of the current work. Second, having a smaller fleet serv-
ing more trips per vehicle, combined with autonomous re-
balancing, will avoid the accumulation of idle vehicles in
popular destinations, a commonly cited issue with current
operators. Lastly, self-repositioning will allow operators to
provide a more reliable service. Currently, use of shared
bicycles or scooters is mainly opportunistic, since there is
a large uncertainty about the availability of vehicles. This
way, bicycles and scooters remain a secondary, optional
Figure 1: Typical light-weight vehicle that is used for choice for their users, who will still plan their trips without
shared micromobility services and that could be the basis wanting to rely on them. With self-repositioning, operators
of an SRSPMD service following hardware upgrades includ- can offer stronger guarantees on the availability of vehicles
ing (1) at least three wheels for balance; (2) cameras and in the right location and thus users can rely on SRSPMDs
optionally LIDAR sensors for localization; (3) low-power as their primary mode of transportation for short trips and
on-board computer for semi-autonomous navigation; (4) first- and last-mile trips. In summary, SRSPMD operations
actuators for computer-controlled steering control; (5) op- will be fundamentally different from current shared vehi-
tionally, connectors or wireless energy transfer equipment cles – either bicycles or scooters – and could present new
for autonomous charging. Even with these additions, the solutions to serve short trips in urban environments. Our
size, weight and maneuvering capacity of the vehicle is ex- work takes the first step in quantifying the potential bene-
pected to stay in the range typical of lightweight electric fits of SRSPMDs and raises important questions for further
scooters. research.
up to the rider to manage navigation among pedestrians 3 Methods
and other human-driven vehicles. This can result in vehi-
cles that are simpler and cheaper to develop and manufac- 3.1 Shared bike usage data
ture. There has been a significant amount of research to As the main data source for the current work, we use trips
develop electric bicycles with such self-repositioning capa- made by customers of a dockless bike-share operator over
bilities [39, 36, 37]. Furthermore, such bicycles have been the one week period between 2017.09.11 and 2017.09.17. [6],
proposed as a possible upgrade from current bikesharing available as Ref. [50]. Data collection and preprocessing
solutions [32]. Similarly, producing a light-weight, three- procedures were presented in more detail in Refs. [6, 7].
or four-wheeled electric scooter (similar in form-factor to Notably, after identifying trips, we filter out excessively
traditional kick-scooters) seems even easier to achieve and short and long trips; the former might be the result of
is actively pursued commercially as well [40, 48]. inaccurate GPS measurements, while the latter can corre-
In the current work, we use the generic term self- spond to the operator removing the bike for maintenance.
repositioning shared personal mobility device (SRSPMD) This way, we have a total of 284,100 trips over the course of
to refer to any vehicle that is small enough to be ridden the week. We show basic statistics of trips and bike usage
on paths similar to cycling infrastructure and has at least in our dataset in Fig. S2 in the Supplementary Material.
partial autonomy sufficient to reposition itself without a We note that overall, 35.9% of trips either start or end
rider present. Actual implementations can be similar to a within a 200 m distance of a rapid transit (MRT or LRT)
bicycle or a (kick-)scooter in form, such as the vehicle de- station exit, indicating that a significant share of trips are
picted in Fig. 1. We note that we consider these vehicles first- and last-mile transportation. This observation is con-
to be strictly separated from full-size cars, i.e. they are not sistent with previous work investigating shared bike usage
expected to travel on roads. Also, we only consider electric in Singapore [6, 7]. We display a more detailed analysis of
vehicles, powered by an on-board battery; current shared the pattern of trips starting or ending close to rapid transit
scooters typically have a range up to 50 km [49]. We note stations in Fig. S1 in the Supplementary Material.
that our work is naturally extensible to vehicles with full As the location of the bikes during the trips are not re-
autonomy, nevertheless, deployment of such fleets would ported, we first need to assign probable routes; we achieve
raise even more concerns about providing adequate road this by obtaining a representation of possible paths from
or path infrastructure. We envision that operators might OpenStreetMap [51], finding the shortest path for each trip
also deploy mixed fleets, where larger vehicles with full au- and assuming it is the route taken. Currently, the use of
tonomy are available for users who are unable or unwilling PMDs in Singapore on sidewalks and roads is forbidden;
3they are only allowed to be used on cycle paths, while previ- a small share of bus passengers switching will result in sig-
ously, their use on sidewalks was allowed. Worldwide, with nificant demand. Considering the whole of Singapore, we
the increasing popularity of electric scooters and PMDs, find that 13% of them, or approximately 512 thousand trips
cities are adopting different regulations, with use on side- per day could be replaced by a PMD trip shorter than 1
walks and cycling routes being prominent [52, 49]. It is km; 48%, or about 1.9 million trips per day could be re-
uncertain what regulations will apply to SRSPMDs; in the placed by a PMD trip under 2 km. We additionally note
current work, we use the assumption that they can use both that 73.6% of the bus trips within the Toa Payoh area ei-
sidewalks and cycling paths. ther start or end at the vicinity of a rapid transit station;
After assigning shortest paths to each trip, we calcu- see Fig. S4 in the Supplementary Material for more details.
late average travel speeds and filter out trips that have an We created potential “trips” for SRSPMD users based
average speed above 30km/h. One probable explanation on the bus trips. We generated trips of length up to R =
for having such trips is that the path network obtained 2 km as candidates. We generated a subset of trips by a
from OpenStreetMap is incomplete, thus for some trips, random selection of trips from the bus trip dataset. We
our estimated “shortest” path is still longer than the real denote the size of this random subset by nt and varied it
route taken by the user. After these processing and fil- between 100 and 40,000. Since the time resolution of the
tering steps, we have a total of 278,826 trips left made by bus dataset is one hour, we assign a uniformly random trip
32,782 unique bikes (identified by the 9 digit unique ID for start time within the one hour time window for each trip.
each bike reported in the dataset). Furthermore, for each trip, we assigned a building as the
This would mean that each bike makes on average 1.2151 start and end location in a uniform random way from a set
trips per day. In reality however, the number of bikes used of buildings obtained from OpenStreetMap and matched
each day is much lower, between 13,000 and 18,000, thus to the start and end bus stops previously. We note that
the average number of trips per bike per day is between when generating trips, we assume users travel at a speed
2.3 and 2.75 (see Fig. 2 and SI Table S1) and on average, of 5 km/h when using SRSPMDs. For each value of nt ,
each bike is used for 26.2 minutes each day (see SI Fig. S2). we repeated the random trip generation process 100 times,
We speculate that the large discrepancy between the total and calculated minimum fleet sizes for each realization. In
fleet size and daily active fleet is due to multiple factors, Fig. 6, we report the average and standard deviation of the
including intentional oversupply of bikes in a highly com- results among the 100 random realizations.
petitive market at the time of our data collection, and bikes
being broken or left in hard-to-find locations by users for
extended periods of time.
3.3 Oracle model for estimating minimum
fleet size
3.2 Random trips based on bus usage data We use the methodology of shareability networks [41] to
estimate a theoretical minimum for the fleet size. We use
As a further data source, we downloaded bus usage data the list of trips as the input, and require all trips to be
from the Singapore Land Transport Authority’s DataMall served by the fleet of SRSPMDs without any delay. For
interface for January 2019 [53]; we share this data online each day, we represent trips by nodes of a graph that are
along with other data used in this work [50]. The data connected by a directed edge if the two trips can be served
includes the monthly total number of trips taken between by the same vehicle (in the time order that corresponds to
any two bus stop pairs in Singapore, separated between the direction of the edge). Calculating an ideal dispatch-
weekdays and weekends and with a time resolution of one ing strategy is then equivalent to calculating a minimum
hour. We identify bus stops inside a limited study area path cover on this graph [41]. In practice, we consider a
based on the Toa Payoh neighborhood (mostly dense resi- weighted version of the problem, that also minimizes the
dential); we have a total of 94 bus stops (see Fig. S3 in the total travel distance of the fleet as well. We display an
Supplementary Material for on overview of the study area). overview of runtimes and the size of the shareability net-
Between all bus stop pairs, we divide the total number of works in Tables S6 and S7 and in Fig. S16 in the Supple-
trips made on workdays by 22, the number of workdays in mentary Material. Since this methodology require advance
January 2019. We find that the average number of total knowledge of all trips, we call this an oracle model, using
daily trips in the study area is thus 68,499. Among these, the terminology of Santi. et al [3] and Vazifeh et al. [41].
we find that about 28% (approximately 19,364 trips per The result of this estimation then shows the potential
day) could be replaced by a PMD trip of less than 1 km, for efficient fleet management under ideal conditions, i.e. it
while 84% (approximately 57,508 trips per day) could be gives the smallest possible number of vehicles to serve the
replaced by a PMD trip that is less than 2 km long. For given number of trips without delay. By comparing the
comparison, in the original bike dataset, we have on av- case with and without self-repositioning, we can character-
erage 710 trips within the Toa Payoh area per day. This ize the maximum potential benefit of autonomy. We note
shows that there is a large amount of additional short trips however, that even in the case of an “oracle” model, this
happening that could be served by SRSPMDs beside those solution is ideal only if we constrain ourselves by taking
that are already made by shared bicycles. Of course, not the trip start times as fixed; further optimizations are pos-
every bus passenger could switch to using PMDs, but even sible if trip start times can vary in an interval, leading to
4the well-known dial-a-ride problem [54], a central problem utes to several hours allows us to explore cases in-between
in operations research where obtaining optimal solutions is the oracle and online models. We achieve this by running
computationally infeasible for realistic problem sizes [55]. an extended version of the online model, repeating assign-
ment of vehicles every tb = 5 min and including knowledge
of all trips in the TLA window.
3.4 Online model for estimating opera-
tional characteristics
3.5 Estimating reachability for vehicles
In previous work applied to taxi data [41], Vazifeh et al.
show that an online version of maximum matching can of- Both methods for estimating fleet size rely on estimating
fer similar performance to the oracle model with only short when a vehicle can reach a trip request. We do this by
delays. We note that a fundatmental difference in the case extracting the network of sidewalks and cycle paths from
of SRSPMDs is the slow relocation speed of vehicles that OpenStreetMap [51] and using this as the path networks
can hamper performance. It is thus important to investi- SRSPMDs can navigate on. Since we do not have esti-
gate an online model, where the operator does not have mates of vehicle travel speed in real-world conditions, we
advance knowledge of trip requests. introduce the parameter vR , the average speed that SRSP-
We use a combination of greedy heuristics and batched MDs are able to travel during relocation. We emphasize
maximum matching in short time windows [13, 41] to simu- that in our analysis, vR is not the actual travel speed of
late the performance of a fleet operator with a simple oper- the vehicles, but the average speed, i.e. the total distance
ating strategy that only includes response to user requests; of the relocation trip divided by the total time taken; this
we share the source code of this model online [56]. In this includes any time spent stopping or slowing down due to
case, requests are aggregated in tb = 1 min time windows; traffic interactions, a main limitation while navigating in
for each time window, the operator performs a maximum complex environments [44, 45, 47]. This way, we are able
matching between available vehicles and unserved requests to incorporate different assumptions on the infrastructure
with the goal of serving the largest number of requests with available to SRSPMDs by varying this parameter. We use
the minimum amount of total waiting time. We explored low values of vR = 1 km/h and 2.5 km/h as representative
different values of tb and found that the value of one minute of a case where SRSPMDs will continue to use sidewalks,
performs best when considering short maximum waiting thus are required to carefully navigate among pedestrians,
times, i.e. tw = 5 min, in line with the on-demand nature limiting both maximum and average speed for the sake of
of our setting. Furthermore, as a departure from earlier safety. We further perform our analysis with higher vR val-
works focusing on car-based services, we also consider that ues of 5 km/h and 10 km/h that represent scenarios where
passengers are willing to walk a short distance as directed SRSPMDs can perform an increasing share of their reloca-
by the reservation system to meet a vehicle that is trav- tion trips on a path infrastructure separated from pedes-
elling to pick them up [14]. We then investigate how this trians [59, 46].
affects performance as such arrangements can be significant
especially if the relocation speed of vehicles is low.
We note that the main limitation of the online model is 4 Results
that we are not considering strategic decisions made by the
operators to rebalance the fleet of vehicles that can affect 4.1 Oracle model
the performance drastically [5]. Notwithstanding the fact
that bad decisions about fleet rebalancing can still result in We display main results for lower and upper bounds on
worse performance than doing nothing, we expect that real fleet size in Figs. 2A-2D. Further details are given in Ta-
operating conditions will present a middle ground between bles S1–S5 in the Supplementary Material. Ideal fleet
the two cases considered in our work. As commute pat- sizes in the oracle model range from around 4,000 vehi-
terns are highly regular [57, 58], operators will be able to cles for vR = 1 km/h, to between 1,500 and 2,000 for
make valuable predictions about expected future demand vR = 10 km/h. These present 4 to 10 times reductions
and thus make proactive rebalancing decisions. Even with- compared to the number of active bicycles each day of the
out actual predictions, an operator can make rebalancing bikeshare operator which ranges between 13,500 and 18,000
movements with the aim of balancing the spatial distribu- and up to 17 times reduction compared to the total number
tion of vehicles in the service area, ensuring maximum spa- of bikes seen in the fleet over the course of one week. At the
tial coverage. This can drastically improve the performance same time, average daily travel per vehicle is still limited to
of the system [30, 31], however, such strategic methods are below 40 km (see SI Table S5), well within the capabilities
demand and scenario dependent and thus not addressed in of commercial scooters, indicating that any extra costs due
this work. to charging infrastructure will be limited.
To better explore how intelligence or predictions about To better estimate the benefits and limits of self-
upcoming trips affect performance, we additionally inves- relocation, we perform two comparisons in the oracle
tigated a further, “limited oracle” model: in this case, the model. First, we estimate an ideal fleet size without au-
operator is assumed to have knowledge of trips in a look- tonomy. We do this by assuming stationary vehicles and
ahead window TLA . Varying this window from a few min- the willingness to walk up to dwalk = 100 m by users to
5A 20000
B 20000
15000 15000
fleet size
fleet size
current fleet size
ideal fleet without autonomy
10000 vR = 1 km/h 10000
vR = 2.5 km/h
vR = 5 km/h
vR = 10 km/h
maximum utilization
5000 5000
0 0
Mon Tue Wed Thu Fri Sat Sun Mon Tue Wed Thu Fri Sat Sun
C 30 D 12
25 10
avg. trips per vehicle
avg. trips per vehicle
vR = 1 km/h
20 8 vR = 2.5 km/h
vR = 5 km/h
vR = 10 km/h
15 6 current fleet size
10 4
5 2
0 0
Mon Tue Wed Thu Fri Sat Sun Mon Tue Wed Thu Fri Sat Sun
E 30
vR = 1 km/h
F 1
vR = 2.5 km/h
25 vR = 5 km/h
0.8
trips served under 5 min wait
vR = 10 km/h
average wait time [min]
20
0.6
15
0.4
10
0.2 vR = 1 km/h
5 vR = 2.5 km/h
vR = 5 km/h
vR = 10 km/h
0 0
0 5000 10000 15000 0 5000 10000 15000
fleet size fleet size
Figure 2: Main results for fleet size, vehicle utilization and passenger waiting times. Top row: fleet sizes for the oracle
modes (A) and online mode (B) are compared over the course of seven days for different average relocation speed of
SRSPMDs (vR ). We further show the current fleet size (green line; only bikes that are used at least once that day
are counted), the result of an optimal allocation of bikes without autonomy and a walking distance of up to 100 m for
passengers (dark blue line) and the maximum number bikes in use at any time during the day (black line). Note that
fleet sizes in the online model can be larger than the current bikeshare fleet size as a result of uncertainties in GPS
data and filtering procedure we carried out for the raw data as described in the Materials and Methods section. On the
contrary, when calculating an ideal fleet size without autonomy, we accounted for by keeping the real sequence of trips
for each bike as an additional possibility, even if that required larger connection distances. Middle row: average fleet
utilization (i.e. number of trips per vehicle per day) in the oracle mode (C) and online model (D). Bottom row: average
waiting times (E) and ratio of trips served under tw = 5 min waiting time (F) in the online model.
6size of 5,000 vehicles, for vR = 10 km/h, we have an aver-
age waiting time of 2.2 min and 92.6% of trips are served
Relocation
speed [km/h] within 5 minutes.
Decrease in required fleet size
40
1
These results are easily understandable considering that
in the online model, the operator needs to be ready to
2.5
serve any trip request occurring in the service area with
20
5 small delay; if trip requests are not known in advance, this
requires an idle vehicle to be available at most tw travel
10
distance from any location in their service area. For an
average relocation speed of vR = 1 km/h and tw = 5 min,
0
this would mean that a vehicle should be available no more
0 100 200 300
than 83 meters away from any possible location. Obviously,
Maximum walking distance [m] this translates into having a large number of vehicles dis-
tributed in a regular fashion standing by to serve any re-
Figure 3: Decrease in fleet sizes achievable if passengers are quest.
willing to walk short distances to meet a vehicle. Results
By drawing a 100 m circle around every trip start loca-
are shown for the online model as a function of the maxi-
tion in the dataset and merging the area of these, we obtain
mum walking distance acceptable to passengers. Walking
an estimate of 312 km2 as the service area of the dockless
speed is assumed to be 3.6 km/h, which is notably faster
bike share operator in Singapore. For vR = 1 km/h, we
than vehicle relocation speed in some of the cases. We
would need at least NI =22,464 idle vehicles distributed
see that significant savings are possible even for short dis-
evenly in the city to be able to serve any trip request within
tances, i.e. up considering only 100 m walking. −2
tw = 5 min. Obviously, NI ∼ vR , thus larger relocation
speeds allow much smaller number of vehicles to cover the
reach a bicycle. This corresponds to a case where the op- service area: with vR = 2.5 km/h we already only need
erator assigns a bicycle to each user for their trip based on 3,594 such vehicles, for vR = 5 km/h we need 899 vehicles
the results of an “oracle”, instead of the user freely choos- and for vR = 10 km/h we need 225 vehicles. In reality,
ing any available bike. We see in Fig. 2 that this result available vehicles are not evenly distributed in the service
offers only moderate improvements in fleet size over the area, nor is the demand. Furthermore, we have to account
base case, thus we can conclude that self-relocation capa- for the vehicles engaged in serving trips or relocating be-
bilities are essential for making significant improvements side NI . Empirically, we find a lower exponent of about
in fleet size and vehicle utilization. We also calculate an 0.87 when we consider fleet sizes necessary to serve at least
absolute minimum on fleet size as the maximum number 50% of trips with a maximum of 5 min waiting time (see
of bicycles in use simultaneously; this results in very low Figure S5 in the Supplementary Material). We note that
numbers, between 800 and 1,110. this relationship will likely be influenced by the overall den-
sity of trips, since as total demand grows, the size of the
“stand-by” fleet, NI will constitute a decreasing fraction of
4.2 Online model total fleet size.
Having estimated theoretical minimum fleet sizes in the Results so far were based on the assumption that trips
oracle model, we compare these with the upper bounds ob- have a fixed start location where passengers are waiting
tained in the online model. We perform two variations to for a vehicle that is used for the trip. In the case of short
obtain (1) an estimation of “ideal” fleet size without knowl- trips however, it makes sense to assume that users would
edge of trips in advance; (2) a characterization of service start their trip walking and continue the trip using an SR-
quality in terms of waiting time for users. In the first case, SPMD vehicle that they encounter at a suitable “meeting
we start the simulation with zero vehicles and allow the op- point”. This resembles how shared vehicles without auton-
erators to “create” new vehicles when a trip request would omy operate currently, where users have to find a nearby
go unserved for tw = 5 min, similarly to the methodology vehicle. A willingness of passengers to walk a short dis-
used to estimated SAV fleet sizes previously [13, 60]. This tance effectively increases the radius where available ve-
results in significantly larger fleet sizes (Fig. 2B), compa- hicles can come from and thus lower the NI idle vehicle
rable to the original fleet size of bicycles for low values of number needed to cover an area. We display results as
vR and a more reasonable number of between 4,000 and the change in fleet size in Fig. 3 and in vehicle utilization
5,000 if vehicles can travel faster (vR = 10 km/h). In the in Fig. S6 in the Supplementary Material. We find that
second case, we run the simulation with a predetermined a maximum walking distance of 100 m results in decreas-
number of vehicles distributed randomly in the city and ing the necessary fleet size by over 25% for vR = 1 km/h.
record average waiting times and the ratio of trips served We see that passenger walking has the largest effect for
under tw = 5 min. We can make similar conclusions as in slow vehicle relocation speeds, but is still significant even
the previous case: in Figs. 2E-2F, we again see that a fleet in the case of higher speeds as it results a 10% decrease
size between 4,000 and 5,000 vehicles and high vR values of necessary fleet size even for vR = 10 km/h. Even higher
are necessary for adequate service, e.g. considering a fleet decreases in fleet size are possible for larger maximum walk-
725 4.4 Effects of upgrading infrastructure
Relocation Our analysis so far outlines that the vR average reloca-
20 speed [km/h] tion speed plays a crucial role in the viability of an SR-
SPMD service, especially in the online model. To further
Avg. trips per vehicle
1
15
2.5
characterize the benefits from upgrading path infrastruc-
ture, we repeat our previous analyses in a presumed “two-
10 5 tiered” infrastructure system: in this case, we have separate
10
paths upgraded specifically for PMD, SRSPMD and poten-
5 tially bicycle use, allowing high average relocation speed of
∗
vR = 15 km/h. The ratio of such paths among all is con-
0 trolled by the parameter r ∈ {0.05, 0.1, 0.2, 0.25, 0.5}. On
0 1 2 3 4 the rest of the path network, we assume the same travel
Look−ahead window size [hours]
speeds as previously, namely, vR = 1 km/h, 2.5 km/h,
Figure 4: Average fleet utilization as a function of look- 5 km/h or 10 km/h. We exploit the fact that usage of paths
ahead window size TLA in the limited oracle model. We in the system is not uniform: some path segments see signif-
varied TLA from 5 minutes to 4 hours; in contrast to the icantly higher usage than others (see SI Fig. S8), similarly
online model, and similarly to the oracle model, we require to what was observed regarding taxi trips previously [61].
trips to be served without waiting. Results are averaged Thus, we envision path upgrades starting with the most
over one week of data; separate results for each day are used segments, continuing by decreasing usage rank un-
shown in Fig. S7 in the Supplementary Material. til a total of r fraction of path length is reached. While
a more complex approach would naturally consider other
constraints as well [59, 46], we perform a simpler choice of
path segments to upgrade based only on activity to gain a
ing distances. These results are consistent with the findings better understanding of the underlying fundamental rela-
of Ref. [14] who investigated the performance of a fleet of tionship between path infrastructure and fleet utilization.
multi-class vehicles with optional walking in a limited geo-
We display results for average vehicle utilization using
graphic area and with synthetic demand data.
the two-tier infrastructure in Fig. 5. We see that signifi-
cant improvements in utilization are possible for relatively
minor upgrades in infrastructure. These increases in aver-
4.3 Limited oracle model age vehicle utilization correspond to decrease in total fleet
size; more detailed results are displayed in Figs. S9–S14 in
We anticipate that real operating conditions will present a the Supplementary Material.
middle ground between the oracle and online models; oper-
ators will likely be able to make valuable predictions on the 4.5 Scaling of utilization with demand
demand for trips. To evaluate how operations in-between
the two models analyzed so far, we also present results for Our main analysis was carried out using data from a bike-
a limited oracle model where trip requests are assumed to share operator as an estimate of the demand for short trips,
be known in advance in a time window TLA and vehicle but is in itself limited by the usage patterns and market
assignments are recalculated periodically based on the new share of the operator. To overcome this limitation, we per-
information that is available. Of course, under realistic formed an additional analysis in which we sampled trips
conditions, the operator will not know the exact trips in made by bus passengers in Toa Payoh, a dense residen-
advance, nevertheless, predictive models will likely result tial neighborhood of Singapore (see map of study area in
in estimations of demand that can be used in a similar Fig. S3 in the Supplementary Material).
fashion. In Figure 4, we show improvements in average ve- We display results in Fig. 6 as average daily vehicle uti-
hicle utilization as a result of increasing the TLA look-ahead lization as a function of the number of daily trips. We see
window size. Depending on the relocation speed, small to that initially there is a strong dependence between these.
moderate window sizes result in a drastic increase in vehi- However, as the number of daily trips grows, vehicle uti-
cle utilization. For TLA above four hours, average utiliza- lization seems to saturate: above 5,000 trips per day, there
tion approaches the results obtained in the oracle model. are only marginal benefits of more trips. In Fig. S3 in the
Notably, for the slowest speed, vR = 1 km/h, utilization in- Supplementary Material, we show that below this satura-
creases only gradually, while for larger speeds, significant tion, average utilization of vehicles can be well modeled to
gains are possible only for TLA = 1 hour, meaning that grow logarithmically with the number of daily trips. Com-
a prediction of demand in the next hour can already be paring these results with our results for the bikeshare data
a valuable resource for an operator. These results high- shown in Fig. 2, we see that there is a moderate room for
light the importance of predictive rebalancing, especially improvement if higher usage rates are achieved; e.g. in our
since a key difference from a system utilizing full-size cars “best case” scenario (with vR = 10 km/h), the average uti-
is the slow speed and thus longer time interval needed to lization of vehicles can be increased from between 20 to 25
reposition vehicles. to slightly above 30 trips per day.
830 15
25
average vehicle utilization
avg. vehicle utilization
20 10
15
10 5
vR = 1 km/h vR = 1 km/h
5 vR = 2.5 km/h vR = 2.5 km/h
vR = 5 km/h vR = 5 km/h
vR = 10 km/h vR = 10 km/h
0 0
0 0.1 0.2 0.3 0.4 0.5 0 0.1 0.2 0.3 0.4 0.5
rel. length of improved paths rel. length of improved paths
Figure 5: Average utilization of SRSPMD fleet in the oracle model (left) and online model (right) after improving a given
relative length of paths, compared to the original utilization at a given relocation speed vR . It is assumed that vehicles
∗
can travel at an average speed of vR = 15 km/h on upgraded path segment and with vR on original path segments.
Results are averaged over the 7 days of data; separate results for each day are shown in the Supplementary Material.
We see in Fig. 6 that in the case of the oracle model, plementary Material for a more detailed analysis of capital
results based on the bikeshare data (constrained to trips costs). We note that beyond capital costs, further factors
happening in the Toa Payoh region in this case, between will include extra liability insurance and maintenance re-
600 and 800 trips per day in total) and the bus usage data quirements for the SRSPMDs, while at the same time, sig-
fit together well, thus we can regard the results from the nificant savings can be realized due to eliminating the man-
bus trip data as a meaningful extrapolation. Conversely, power needs for fleet rebalancing. Both conventional and
we find that there is no such correspondence in the case autonomous scooters are expected to incur similar costs
of the online model; there, results based on bikeshare data for battery charging or swapping; at the same time, auto-
show much higher vehicle utilization than results based on mated solutions for charging could realize further savings
bus trips. One possible explanation for this is that the bike- for operators.
share trips are already biased by the availability of vehicles,
While our results show that self-repositioning shared per-
since we have no data on lost demand. This highlights the
sonal mobility devices (SRSPMDs) offer a promising trans-
difficulties likely encountered by an operator that aims to
portation concept for short trips and first- and last-mile
provide reliable service, i.e. with a low level of lost demand.
segments of longer trips, there are several challenges for
adoption. We have seen that a crucial parameter is vR , the
average speed SRSPMDs are able to achieve when reposi-
5 Discussion tioning themselves. While we used vR as a parameter in
our models, in reality it will be determined by the ability
We note that there is a clear cost component of SRSP-
of the vehicles to navigate in a complex environment. This
MDs, i.e. the extra hardware and software needed to en-
way, operations can be severely affected if SRSPMDs have
able autonomy. We estimate the average cost of conven-
to share narrow sidewalks with pedestrians [44, 45, 46, 47].
tional electric scooters approved by the Land Transport
Differences between the oracle and online models presented
Authority of Singapore as 566 SGD [62] and the cost of an
in the current work also highlight the need for predictive
autonomous version to be about thrice as much, i.e. around
repositioning instead of reactive fleet management, espe-
1,500 SGD (including the cost for a short range LIDAR and
cially in areas where repositioning speed remains slow. Be-
an on-board computer); similar price estimates are given
ing able to ensure a high availability of vehicles would po-
by manufacturers actively developing scooter models with
sition SRSPMDs as a primary mode of transportation for
limited autonomy [63]. This implies that considering the
short trips instead of the mainly opportunistic use cur-
static cost of deploying a fleet, using SRSPMDs instead of
rently typcial of shared bikes and scooters.
conventional scooters will be financially reasonable if self-
relocation capabilities allow the fleet size to be reduced In the current work, we mainly focused on the oper-
to approximately one third or less. While this is clearly ational efficiency aspects of the average relocation speed
the case for the solutions of the oracle model, focusing on and the main reason for path upgrades was to allow vehi-
the online model, we see that a fleet size of 5,000 could cles to travel faster. At the same time, more infrastructure
potentially provide reasonable service if an average relo- will be also needed to avoid conflicts among pedestrians,
cation speed of vR = 5 km/h or higher is achieved, at a SRSPMDs, and cyclists. An important future direction
comparable cost of deploying a fleet of over 15,000 conven- needs to assess interactions between SRSPMDs, pedestri-
tional scooters, or the equivalent of the active fleet size in ans, other PMD users, cyclists and even traditional and
the bikesharing system studied (see Fig. S15 in the Sup- autonomous cars to determine the best road, sidewalk and
9A 35 B 30
30 25
Trips served per vehicle
Trips served per vehicle
25
20
20
15
15
10
10
vR = 1 km/h vR = 1 km/h
5 vR = 2.5 km/h 5 vR = 2.5 km/h
vR = 5 km/h vR = 5 km/h
vR = 10 km/h vR = 10 km/h
0 0
0 5000 10000 15000 20000 0 200 400 600 800 1000 1200 1400 1600
Number of trips in a day Number of trips in a day
C 9 D 12 vR = 1 km/h
8 vR = 2.5 km/h
10 vR = 5 km/h
7 vR = 10 km/h
Trips served per vehicle
Trips served per vehicle
6 8
5
6
4
3 4
2 vR = 1 km/h
vR = 2.5 km/h 2
1 vR = 5 km/h
vR = 10 km/h
0 0
0 5000 10000 15000 20000 0 200 400 600 800 1000 1200 1400 1600
Number of trips in a day Number of trips in a day
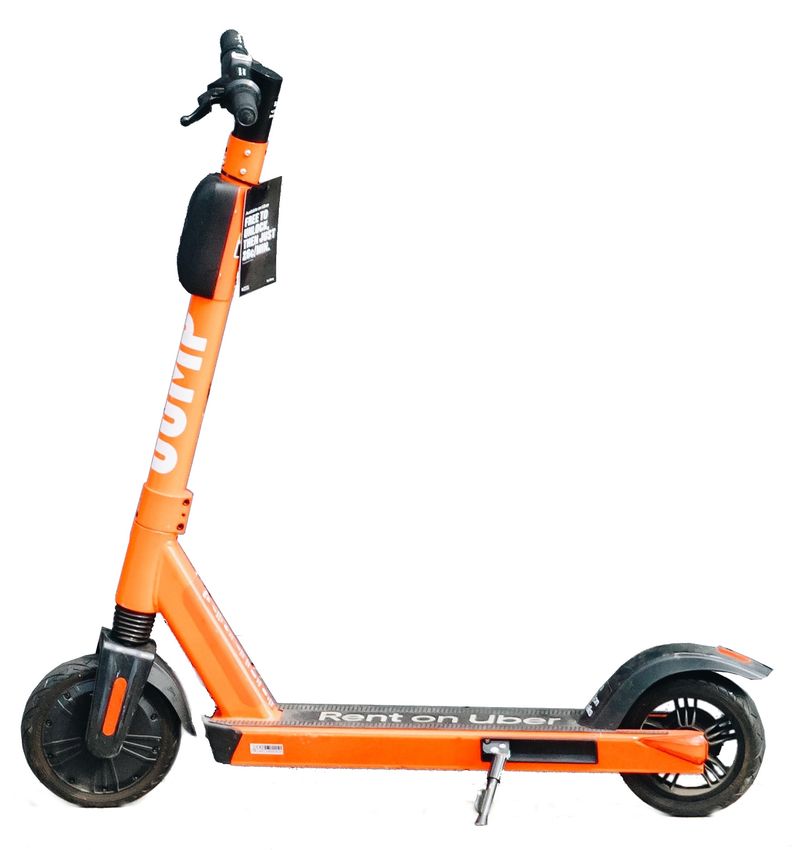
Figure 6: Average fleet utilization as the function of the number of daily trips in Toa Payoh, with trips generated based
on bus usage data. Top row shows results in the oracle model, while bottom row shows results for the online model,
with tw = 5 min maximum wait time. Left panels (A and C) show results for a wide range of daily activity values. Right
panel (B and D) show results for relatively small number of daily trips. In these figures, dots show results calculated
based on the bikeshare dataset, limited to trips happening in the Toa Payoh area. These show good agreement with
results based on bus trips data in the oracle model (B), while there is a significant difference in for the online model
(D).
10path design to achieve this goal, while allowing ideal flow of for Natural Resources and the Environment, Shenzhen,
people and efficient relocation of SRSPMDs. This will re- UBER, Victoria State Government, Volkswagen Group
quire extending the limited research on cyclist behavior and America, and all of the members of the MIT Senseable
maneuvering [64, 65] for the case of human-driven and self- City Laboratory Consortium for supporting this research.
repositioning scooters. Well-designed sidewalks and PMD
paths will be essential for SRSPMDs to gain acceptance.
Further research should consider the full sustainability References
benefits of SRSPMDs, including lifecycyle energy use un-
[1] Lew Fulton, Jacob Mason, and Dominique Meroux. Three
der different scenarios of usage patterns and integration Revolutions in Urban Transportation. Technical re-
with public transit services [20]. We believe the main po- port, ITDP, 2017. https://www.itdp.org/wp-content/
tential for positive change is solving the first- and last-mile uploads/2017/04/UCD-ITDP-3R-Report-FINAL.pdf.
transportation problem. SRSPMDs can effectively increase
the catchment area of rapid transit stations [66], and re- [2] Jörg Firnkorn and Martin Müller. Selling Mobility instead
lieve buses and road capacity from short trips. Increased of Cars: New Business Strategies of Automakers and the
convenience can help transit remain a competitive choice Impact on Private Vehicle Holding. Business Strategy and
the Environment, 21(4):264–280, 2012. ISSN 09644733.
for travel; this is especially important considering a future
https://doi.org/10.1002/bse.738.
with autonomous cars offering cheap point-to-point trans-
portation [18, 21]. At the same time, SRSPMDs pose an [3] Paolo Santi, Giovanni Resta, Michael Szell, Stanislav
attractive alternative to short trips that are currently made Sobolevsky, Steven H Strogatz, and Carlo Ratti. Quan-
by active modes (i.e. walking or cycling) or transit, imply- tifying the benefits of vehicle pooling with shareabil-
ing a potentially disruptive change for local bus service ity networks. PNAS, 111(37):13290–13294, 2014. ISSN
operations and highlighting the need a for a more rigorous 0027-8424, 1091-6490. https://doi.org/10.1073/pnas.
1403657111.
study considering the net sustainability effects of SRSP-
MDs. [4] Diana Jorge and Gonçalo Correia. Carsharing sys-
Planning will need to consider the opportunities pre- tems demand estimation and defined operations: A lit-
sented by SRSPMDs and the trade-offs in building and erature review. European Journal of Transport and
upgrading a path infrastructure for them, e.g. the oppor- Infrastructure Research, 13(3):201–220, 2013. ISSN
tunity to place rapid transit stations further apart, or a 15677141. http://www.ejtir.tudelft.nl/issues/2013_
decreased need for roads if SRSPMDs provide an attrac- 03/pdf/2013_03_02.pdf.
tive alternative for first- and last-mile trips. Looking be- [5] Meghna Lowalekar, Pradeep Varakantham, Supriyo
yond, we believe that deployment of SRSPMDs and the im- Ghosh, Sanjay Dominik Jena, and Patrick Jaillet. On-
plied infrastructure needs should be studied together with line repositioning in bike sharing systems. 27th Inter-
the opportunities offered by the three main technological national Conference on Automated Planning and Schedul-
advances in transportation, i.e. connected devices, electric ing, 2017. ISSN 23340843. http://web.mit.edu/jaillet/
mobility, and autonomy. The combination of these offers www/general/icaps17-bikeshare.pdf.
us the opportunity to rethink the design of transportation
[6] Yu Shen, Xiaohu Zhang, and Jinhua Zhao. Understand-
infrastructure in cities, a change that can be compared to ing the usage of dockless bike sharing in Singapore. In-
the effect that the internal combustion engine and elec- ternational Journal of Sustainable Transportation, 8318:
tric rail transit had on cities more than a hundred years 1–15, 2018. ISSN 15568334. https://doi.org/10.1080/
ago. Competition between private cars and mass transit 15568318.2018.1429696.
could be transformed into the management of a more fluid
landscape of shared, connected, electric and autonomous [7] Yang Xu, Dachi Chen, Xiaohu Zhang, Wei Tu, Yuanyang
Chen, Yu Shen, and Carlo Ratti. Unravel the Land-
transportation solutions of various form factors and oper-
scape and Pulses of Cycling Activities from A Dockless
ational models. The transportation network infrastructure
Bike-Sharing System. Computers, Environment and Ur-
shall evolve to support the above landscape to provide con- ban Systems, 75:184–203, 2019. ISSN 01989715. https:
venient, accessible and green transportation in dense new //doi.org/10.1016/j.compenvurbsys.2019.02.002.
megacities as well as in sprawling suburban areas inherited
from the 20th century. [8] Alexander Lamprecht, Martin Baumann, Tobias Massier,
and Sebastian Steinhorst. Decentralized non-neighbor ac-
tive charge balancing in large battery packs. In 2019
Acknowledgements Design, Automation & Test in Europe Conference & Ex-
hibition (DATE), pages 432–437. IEEE, 2019. https:
This research is supported by the Singapore Ministry of Na- //doi.org/10.23919/DATE.2019.8714894
tional Development and the National Research Foundation,
[9] Alexander Lamprecht, Swaminathan Narayanaswamy, and
Prime Minister’s Office, under the Singapore-MIT Alliance Sebastian Steinhorst. Improving fast charging efficiency of
for Research and Technology (SMART) programme. reconfigurable battery packs. In 2018 Design, Automation
We thank Allianz, Amsterdam Institute for Advanced & Test in Europe Conference & Exhibition (DATE), pages
Metropolitan Solutions, Brose, Cisco, Ericsson, Fraunhofer 585–588. IEEE, 2018. https://doi.org/10.23919/DATE.
Institute, Liberty Mutual Institute, Kuwait–MIT Center 2018.8342075
11[10] Erick Guerra. Planning for Cars That Drive Themselves. system: A supply-side simulation of the first-mile ser-
Journal of Planning Education and Research, 36(2):210– vice in Singapore. Transportation Research Part A: Pol-
224, 2015. ISSN 0739-456X. https://doi.org/10.1177/ icy and Practice, 113:125–136, 2018. ISSN 09658564.
0739456x15613591. https://doi.org/10.1016/j.tra.2018.04.004.
[11] Bryant Walker Smith. Managing Autonomous Transporta- [21] Rounaq Basu, Andrea Araldo, Arun Prakash Akkinepally,
tion Demand. Santa Clara Law Review, 52(4):1401–1422, Bat Hen Nahmias Biran, Kalaki Basak, Ravi Seshadri,
2012. ISSN 02729490. https://doi.org/10.1525/sp. Neeraj Deshmukh, Nishant Kumar, Carlos Lima Azevedo,
2007.54.1.23. and Moshe Ben-Akiva. Automated Mobility-on-Demand
vs. Mass Transit: A Multi-Modal Activity-Driven Agent-
[12] Corey D. Harper, Chris T. Hendrickson, Sonia Mangones, Based Simulation Approach. Transportation Research
and Constantine Samaras. Estimating potential increases Record, pages 1–11, 2018. ISSN 21694052. https://doi.
in travel with autonomous vehicles for the non-driving, org/10.1177/0361198118758630.
elderly and people with travel-restrictive medical condi-
tions. Transportation Research Part C: Emerging Tech- [22] Baichuan Mo, Yu Shen, and Jinhua Zhao. Impact of
nologies, 72:1–9, 2016. ISSN 0968090X. https://doi. Built Environment on First- and Last-Mile Travel Mode
org/10.1016/j.trc.2016.09.003. Choice. Transportation Research Record: Journal of the
Transportation Research Board, 2018. https://doi.org/
[13] Dániel Kondor, Paolo Santi, Kakali Basak, Xiaohu Zhang, 10.1177/0361198118788423
and Carlo Ratti. Large-scale estimation of parking require-
ments for autonomous mobility on demand systems. arXiv [23] Xiang Yan, Jonathan Levine, and Xilei Zhao. Integrating
preprint, 2018. http://arxiv.org/abs/1808.05935. ridesourcing services with public transit: An evaluation
of traveler responses combining revealed and stated pref-
[14] Malika Meghjani, Scott Drew Pendleton, Katarzyna Anna erence data. Transportation Research Part C: Emerging
Marczuk, You Hong Eng, Xiaotong Shen, Marcelo H. Technologies, (July):1–14, 2018. ISSN 0968090X. https:
Ang, and Daniela Rus. Multi-class fleet sizing and mo- //doi.org/10.1016/j.trc.2018.07.029.
bility on demand service. In Michel Alexandre Cardin,
Daniel Hastings, Peter Jackson, Daniel Krob, Pao Chuen [24] Menno D. Yap, Gonçalo Correia, and Bart van Arem. Pref-
Lui, and Gerhard Schmitt, editors, Complex Systems De- erences of travellers for using automated vehicles as last
sign & Management Asia, pages 37–49. Springer Interna- mile public transport of multimodal train trips. Trans-
tional Publishing, 2019. ISBN 978-3-030-02886-2. https: portation Research Part A: Policy and Practice, 94:1–16,
//doi.org/10.1007/978-3-030-02886-2_4 2016. ISSN 09658564. https://doi.org/10.1016/j.tra.
2016.09.003.
[15] Regina R. Clewlow and Gouri Shankar Mishra.
Disruptive Transportation: The Adoption, Uti- [25] Pierre Borgnat, Céline Robardet, Jean-Baptiste Rouquier,
lization, and Impacts of Ride-Hailing in the Patrice Abry, Éric Fleury, and Patrick Flandrin. Shared
United States. Technical Report 07, 2017. Bicycles in a City: a Signal Processing and Data Analysis
https://steps.ucdavis.edu/wp-content/uploads/ Perspective. Advances in Complex Systems, 14(03):415–
2017/10/ReginaClewlowDisuptiveTransportation.pdf. 438, 2011. ISSN 0219-5259. https://doi.org/10.1142/
S0219525911002950.
[16] Scarlett T. Jin, Hui Kong, Rachel Wu, and Daniel Z. Sui.
Ridesourcing, the sharing economy, and the future of cities. [26] Ahmadreza Faghih-Imani, Sabreena Anowar, Eric J.
Cities, 76(October 2017):96–104, 2018. ISSN 02642751. Miller, and Naveen Eluru. Hail a cab or ride a bike? A
https://doi.org/10.1016/j.cities.2018.01.012. travel time comparison of taxi and bicycle-sharing sys-
tems in New York City. Transportation Research Part
[17] Alejandro Henao and Wesley E. Marshall. The impact A: Policy and Practice, 101:11–21, 2017. ISSN 09658564.
of ride-hailing on vehicle miles traveled. Transportation, https://doi.org/10.1016/j.tra.2017.05.006.
(0123456789), 2018. ISSN 15729435. https://doi.org/
10.1007/s11116-018-9923-2. [27] Grant McKenzie. Spatiotemporal comparative analysis of
scooter-share and bike-share usage patterns in Washing-
[18] M. Salazar, F. Rossi, M. Schiffer, C. H. Onder, and ton, D.C. Journal of Transport Geography, 78(March):19–
M. Pavone. On the interaction between autonomous 28, 2019. ISSN 09666923. https://doi.org/10.1016/j.
mobility-on-demand and public transportation systems. In jtrangeo.2019.05.007.
21st International Conference on Intelligent Transporta-
tion Systems (ITSC), pages 2262–2269, 2018. https: [28] Rui Zhu, Xiaohu Zhang, Dániel Kondor, Paolo Santi, and
//doi.org/10.1109/ITSC.2018.8569381. Carlo Ratti. Understanding spatio-temporal heterogene-
ity of bike-sharing and scooter-sharing mobility. Com-
[19] Jian Wen, Yu Xin Chen, Neema Nassir, and Jinhua Zhao. puters, Environment and Urban Systems, 81(May 2020):
Transit-oriented autonomous vehicle operation with in- 101483, 2020. ISSN 01989715. https://doi.org/10.
tegrated demand-supply interaction. Transportation Re- 1016/j.compenvurbsys.2020.101483.
search Part C: Emerging Technologies, 97(November):216–
234, 2018. https://doi.org/10.1016/j.trc.2018.10. [29] Panagiotis Angeloudis, Jun Hu, and Michael G.H. Bell.
018. A strategic repositioning algorithm for bicycle-sharing
schemes. Transportmetrica A: Transport Science, 10(8):
[20] Yu Shen, Hongmou Zhang, and Jinhua Zhao. Integrat- 759–774, 2014. ISSN 23249943. https://doi.org/10.
ing shared autonomous vehicle in public transportation 1080/23249935.2014.884184.
12You can also read