Road safety in Canada - Transports Canada
←
→
Page content transcription
If your browser does not render page correctly, please read the page content below
Road
            safety
            in CANADA

TP 15145E
Prepared by Road Safety Canada Consulting, March 2011, with support from the Public Health Agency of Canada.
This publication was made possible through a financial contribution from the Public Health Agency of Canada and
with thechnical expertise and printing support from Transport Canada.

© Sa Majesté la Reine du chef du Canada, représentée par le ministre des Transports, 2011

    All rights reserved. Permission is granted to electronically copy and to print in hard copy for internal use only. No part of this information
    may be reproduced, modified or redistributed in any form or by any means, for any purposes other than those noted above (including sales),
    without the prior written permission of the Minister of Public Works and Government Services, Ottawa, Ontario, Canada K1A 0S5 or at
    copyright.droitdauteur@communication.gc.ca.

    ISBN: 978-1-100-18621-4
    Catalogue No.: T46-54/1-2011E

    TP: 15145E
    TC:-1004363
Table of
Contents
1.0 Introduction............................................................................................................................................................................2

                    1.1 Purpose.............................................................................................................................................................................2

                    1.2 Canadian Year of Road Safety 2011...........................................................................................................................3

                    1.3 Canada’s Road Safety Strategy (RSS) 2015...............................................................................................................3

                    1.4 United Nations’ Decade of Action for Road Safety...............................................................................................5

2.0 Current State of Road Safety in Canada.................................................................................................6

3.0 Major Road Safety Topics............................................................................................................................................9

                    3.1 Seat Belt and Child Restraint Usage...........................................................................................................................9

                    3.2 Aggressive Driving....................................................................................................................................................... 12

                    3.3 Young/Novice Drivers................................................................................................................................................ 16

                    3.4 Alcohol Impaired Driving........................................................................................................................................... 17

                    3.5 Impaired Driving by Other Drugs............................................................................................................................ 21

                    3.6 Distracted Driving....................................................................................................................................................... 22

                    3.7 Impaired Driving by Fatigue..................................................................................................................................... 25

                    3.8 Vulnerable Road Users............................................................................................................................................... 26

                    3.9 Medically-at-risk Drivers............................................................................................................................................ 27

                    3.10 Motor Carriers.......................................................................................................................................................... 29

                    3.11 Road Infrastructure and Traffic Engineering........................................................................................................ 31

                    3.12 Vehicle Engineering................................................................................................................................................... 32

                    3.13 General Population................................................................................................................................................... 34

4.0 Future Challenges........................................................................................................................................................... 36

5.0 References................................................................................................................................................................................. 38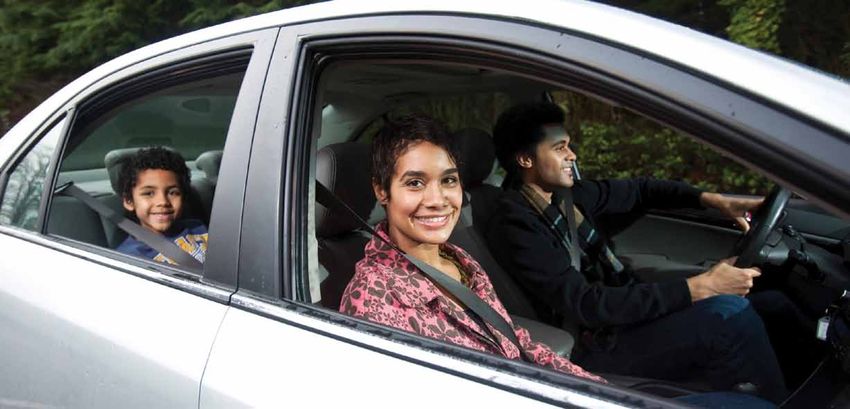
1.0 Introduction

    1.1 Purpose
    The purpose of this booklet is to provide information to road safety professionals to assist them in their efforts
    to promote road safety and to encourage the commitment of all Canadians to rethink road safety and to adopt
    safer behaviour. This booklet is being published at this time to publicize the Canadian Year of Road Safety which
    runs throughout 2011, the launch of Canada’s third national road safety program called Road Safety Strategy
    (RSS) 2015, and the launch of the United Nations’ Decade of Action for Road Safety (2011-2020). Each of these
    initiatives is described below.

    1.2 Canadian Year of Road Safety 2011
    The purpose of the Canadian Year of Road Safety 2011 is to raise awareness about road safety in Canada, given
    that traffic collisions are a major cause of death for those aged 5 to 34 and that the injuries sustained in collisions
    by all Canadians are a major burden on our health care system in terms of emergency treatment, chronic care,
    and rehabilitation (Ramage-Morin, 2008).

    This Year of Road Safety has been planned by the Canadian Global Road Safety Committee, a multi-stakeholder
    road safety coalition, in partnership with the Canadian Council of Motor Transport Administrators (CCMTA),
    federal, provincial, territorial governments, the Public Health Agency of Canada, and other partners. The year
    includes the launch of the RSS 2015 and the United Nations’ Decade of Action, the Canadian Multidisciplinary
    Road Safety Conference, and the 4th annual National Day of Remembrance for Road Crash Victims in November,
    as well as jurisdictionally and organizationally specific programs. Information regarding these activities can be
    found at the following website:

    www.tc.gc.ca/roadsafety2011

2
1.3 Canada’s Road Safety Strategy (RSS) 2015
RSS 2015 is the third in a series of national road safety programs, the first being Road Safety Vision 2001,
followed by Road Safety Vision 2010. Both of these programs were associated with reductions in the number
of fatalities and serious injuries resulting from road collisions in Canada.
The vision of RSS 2015 is as before in trying to make Canada’s roads the safest in the world. In 2008, Canada
was ranked 10th in terms of fatalities per billion vehicle kilometers traveled compared to other member countries
of the Organization for Economic Cooperation and Development, as shown in Figure 1.
Figure 1: Canada’s 2008 Road Safety Ranking Among OECD Member Countries
9.00
Fatality Rate / Billion VKM
8.22
7.74 7.91
8.00
7.18
6.90
7.00 6.50 6.50 6.65
5.99
6.00 5.66
5.14 5.25
4.99
5.00
4.00
3.00
2.00
1.00
0.00 A
da
ds
k
en
y
a
ce
d
d
d
ay
ain
an
ar
ali
US
lan
lan
lan
lan
na
an
ed
rw
nm
rit
str
rm
er
Fin
Ire
Fr
Ca
Sw
No
er
tB
Au
De
Ge
itz
th
ea
Sw
Ne
Gr
The major objectives of RSS 2015 are to raise public awareness, enhance enforcement of traffic laws, increase
communications, cooperation and collaboration among partners and increase information in support of research
and evaluation.
The key elements of RSS 2015 are as follows: a downward directional trend in fatality and serious injury rates
will be achieved over the 2011 to 2015 period; jurisdictions will adopt a holistic (Safer System) approach
addressing the vehicle, the road infrastructure, and road users based on the primary risk groups and key
contributing factors identified below; an evidence-based Best Practice Framework will be adopted in choosing
interventions; a fluid and flexible approach will allow jurisdictions to adopt best practices appropriate to their
situation; and jurisdictions will own their road safety plans.
The primary target/risk groups are young drivers (16 to 24), medically-at-risk drivers (e.g. those with heart disease or
cognitive disorders such as Alzheimer’s Disease), vulnerable road users (i.e. pedestrians, motorcyclists, bicyclists),
motor carriers (e.g. managers of carrier operations, truck and bus drivers), high risk drivers (e.g. those who don’t
wear seat belts or who speed, drive impaired, or drive without a valid licence), and the general population.
3
The key contributing factors are impaired driving (i.e. alcohol, drugs, distraction, and fatigue), speed and
    aggressive driving, and occupant protection. The environmental factors include road infrastructure and
    weather conditions.

    The road safety strategies will focus on best practices, a matrix of the key target groups and contributing factors
    and include communication and awareness, education/training, policy/legislation, enforcement, technology,
    road infrastructure, information/data for research and evaluation, and linkages. Ideally a combination of these
    strategies will be applied to a specific target group or factor.

    The RSS 2015 slogan is “Rethink Road Safety,” which represents a call to action for all road safety stakeholders.
    The logo for the campaign is presented below:

    The progress of RSS 2015 will be monitored using a number of indicators over five years (e.g. fatal and serious
    injury rates per distance traveled, and fatally injured drivers who had been drinking).

    More information about RSS 2015 can be found at www.ccmta.ca/crss-2015

4
1.4 United Nations’ Decade of Action for Road Safety
The United Nations’ groundbreaking report entitled World Report on Road Traffic Injury Prevention
(Peden et al., 2004) noted that:
    ..about   1.2 million people are killed in road crashes globally each year, and about 20 to 50 million
      are injured;
    ..forecasts  indicate that this global road toll will likely increase by as much as 50% in the next 20 years,
      particularly in low and middle income countries, if action is not taken;
    ..traffic collisions would become the third major cause of death;
    ..the major victims of these traffic collisions are people between 5 and 44 years of age;
    ..the cost of these collisions represents 2-3% of countries’ Gross Domestic Products.
The UN General Assembly passed a resolution in March 2010 to establish the Decade of Action for Road Safety
led by the World Health Organization (WHO) in order to “stabilize and then reduce the forecasted level of road
traffic fatalities around the world by increasing activities conducted at national, regional and global levels.” The
principles guiding the Decade of Action are to adopt a “Safe System Approach” to deal with traffic collisions,
have ownership for activities at the national and local level, and to include governments, the private sector, and
nongovernmental organizations.

The suggested national activities during the Decade of Action include setting ambitious road safety targets,
strengthening global architecture addressing road safety, increasing technical capacity in road safety within
countries, providing technical support to low and middle income countries, improving the quality of data
at national and global levels, and monitoring progress on performance indicators. The basic pillars for these
national activities are road safety management, safer road design, vehicles and road users, and post-crash care.

The Decade of Action will be launched by the WHO and participating countries worldwide on May 11, 2011,
starting in New Zealand. For more information about the Decade of Action, go to: www.decadeofaction.org

                                                                                                                       5
2.0 Current State of Road Safety in Canada

    The number of traffic fatalities and serious injuries occurring in Canada from 1996 to 2009 are shown in Figure 2.
    In 2009, there were 2,209 fatalities and 11,451serious injuries (requiring hospitalization over night), representing
    a decline of 25% in both measures compared to the period from 1996 to 2001.

    From 2004 to 2008, about three-quarters of fatalities and 70% of serious injuries have been drivers or passengers
    of vehicles. Although drivers aged between15 to 34 represent only about 30% of the driving population, they
    accounted for 40% of the fatalities and 45% of the serious injuries, indicating that younger drivers are at greater
    risk. About two-thirds of fatal collisions and 30% of injury crashes occur on rural roads, typically undivided with
    two lanes (Transport Canada and CCMTA, 2011). The annual social costs of the motor vehicle collisions in terms
    of loss of life, medical treatment, rehabilitation, lost productivity, and property damage are measured in tens of
    billions of dollars.

    Figure 2:   Fatalities and Serious Injuries 1996-2009*

                                                                                           Fatalities (Left)
                                 3,400                                                     Serious Injuries (Right)           19,000

                                 3,200                                                                                        18,000

                                 3,000                                                                                        17,000

                                 2,800
                    Fatalities

                                                                                                                              16,000

                                 2,600                                                                                        15,000

                                 2,400                                                                                        14,000

                                 2,200                                                                                        13,000

                                 2,000                                                                                        12,000

                                 1,800                                                                                        11,000
                                       96

                                              97

                                                      98

                                                      99

                                                           00

                                                                   01

                                                                          02

                                                                               03

                                                                                      4

                                                                                             05

                                                                                                    06

                                                                                                           07

                                                                                                                  08

                                                                                                                         09
                                                                                       0
                                     19

                                            19

                                                   19

                                                   19

                                                           20

                                                                20

                                                                        20

                                                                               20

                                                                                    20

                                                                                           20

                                                                                                  20

                                                                                                         20

                                                                                                                20

                                                                                                                       20

    * Canadian Motor Vehicle Traffic Collision Statistics 2009

6
The decrease in fatalities and serious injuries in 2008 and 2009 suggest that Canada is approaching its RSV 2010
target of a 30% reduction. It is recognized that some of this improvement may be due to the economic recession
of 2008 to 2009, which may have reduced the amount of travel. However, the vehicle kilometres traveled (VKT)
data from the Canadian Vehicle Survey (Statistics Canada, 2010) reveals that VKT fluctuated up and down over
the 2006 to 2009 period, actually increasing 2.4% from 2008 to 2009.

Figure 3 indicates that the fatality rate per billion VKT declined 30% from 2000 to 2009, while the serious injury
rate dropped 22% from 2000 to 2008, suggesting that the economic recession is not the only reason that fatalities
and serious injuries decreased.

Figure 3: Casualty     Rates / Billion Vehicle-KM 2000-2009

                                                Deaths (Left)
                                                Serious Injuries (Right)

                                         15.0
                                                                                                         60.0
                                         13.0
                                                                                                         50.0
                            Fatalities

                                         11.0

                                                                                                                SI
                                                                                                         40.0
                                          9.0
                                                                                                         30.0
                                          7.0
                                                                                                         20.0
                                          5.0
                                                00

                                                       01

                                                             02

                                                                   03

                                                                           04

                                                                                05

                                                                                     06

                                                                                                    09
                                                                                               08
                                                                                          07
                                                20

                                                     20

                                                            20

                                                                  20

                                                                        20

                                                                                20

                                                                                     20

                                                                                                    20
                                                                                               20
                                                                                          20

*Canadian Motor Vehicle Traffic Collision Statistics 2009

                                                                                                                     7
Figure 4 shows the fatality rates for each Canadian jurisdiction per billion kilometres traveled in 2008.

    Figure 4: Canadian      Fatalities per Billion Vehicle-km by Province/Territory*

                         Northwest Territories                                                       11.8
                                                                                                                  15.4
                                         Yukon
                              British Columbia                                                 9.9
                                                                                        8.6
                                       Alberta
                                 Saskatchewan                                                         12.2

                                      Manitoba                                    8.1

                                       Ontario                  5.0

                                       Quebec                                     8.1
                                                                                              9.6
                               New Brunswick
                                   Nova Scotia                                          8.6

                          Prince Edward Island                                                                14.9

                       Newfounland & Labrador                                     8.0

                                       Canada                               7.4
                                                 0         5                                  10             15          20

                                                                      Fatalities / Billion VKM

    *Canadian Motor Vehicle Traffic Collision Statistics 2008

    In summary, Canada has made significant progress in reducing the number and rate of fatalities and serious
    injuries over the past decade compared to the period from 1996 to 2001, in part due to the success of a wide
    variety of road safety measures that have been implemented over these years.

8
3.0 Major Road Safety Topics
The following is a summary of major road safety topics based on the key target groups and contributing factors
identified in RSS 2015, along with current and potential measures to improve safety related to these topics.
3.1 Seat Belt and Child Restraint Usage
Current Status: Seat belts worn correctly can reduce the chances of death in a collision by 47% and the
chances of serious injury by 52% (Stewart et al., 1997). All new vehicles sold in Canada today are equipped
with three-point seat belts in all positions. Many vehicles are also equipped with seat belt pretensioners, which
automatically remove the slack in the belt at the time of impact, and load limiters, which allow the belt to spool
out so that the occupants can ride down the impact without being injured by the belt itself. Seat belt use has
increased over the past 25 years so that now 95% of Canadian vehicle occupants in all seating positions wear
belts, and this includes those people in urban and rural areas based on surveys conducted in 2009 and 2010
(Transport Canada, 2011). As belt use has risen, occupant fatalities have declined.
As shown in Figure 5, four provinces have achieved a belt usage rate of over 95%, thereby reaching one of the
RSV2010 sub-targets. However, from 2004 to 2008, 36% of fatally injured drivers and 38% of fatally injured
passengers were not wearing their belts at the time of the collision. It is estimated that about 300 lives could
be saved every year if everyone wore belts.
Figure 5: Seat belt use by jurisdiction for 2009-2010*
Newfounland & Labrador 93.1
Prince Edward Island 89.7
Nova Scotia 90.1
New Brunswick 94.8
Quebec 96.0
Ontario 96.0
Manitoba 93.8
Saskatchewan 96.8
Alberta 92.0
British Columbia 96.9
Yukon 78.1
Northwest Territories 84.9
Canada 95.3
50 60 70 80 90 100
Percentage of Occupants Using Seat Belts
*Transport Canada’s Rural and Urban Surveys of Seat Belt Use in Canada 2009-2010, Fact Sheet TP 2436E,RS-2011-01
9Proper use of child restraints can reduce the likelihood of death by 71% and injury by 67% (Isaksson-Hellman et al., 1997). Yet according to a recent survey (Snowdon et al., 2011), only 90% of children under twelve months of age were placed in infant carriers, only 86% of toddlers 1 to 3 years old were in infant carriers or child seats, and only 40% of children aged 4 to 8 were in booster seats. These usage rates are considerably below the seat belt use rates for adults. Since 1991, all jurisdictions have had seat belt and child restraint use laws covering all seating positions. Some laws have exemptions for belt use (e.g. medical conditions, physical size, police officers, ambulance attendants, taxi drivers carrying passengers, drivers making frequent stops). The fines for non-use range from about $75 to about $250, and most jurisdictions have demerit points ranging from one to four. More information about seat belt and child restraint use laws can be found at: www.ccmta.ca/english/committees/rsrp/norp/pdf/norp_report09.pdf Periodic Selective Traffic Enforcement Programs (STEPs) combine heightened police enforcement and public awareness campaigns and have been important in increasing belt use across the country (Jonah et al., 1982). During the Canada Road Safety Week leading up to the May long weekend and Operation Impact during the Thanksgiving weekend in October, seat belt use is a major focus for enforcement campaigns by police services across the country. STEP campaigns are also conducted by individual communities throughout the year. Many communities across the country conduct child restraint clinics to show parents the proper way to use child restraints and/or to encourage them to obtain the appropriate restraint for their child based on weight and height. Most hospitals will not allow parents to take their newborn home unless they have an infant carrier. Educational campaigns have been conducted in many communities, including First Nations communities. Police also periodically conduct enforcement campaigns to increase usage. Further information about child restraints can be found at: www.tc.gc.ca/roadsafety/kids Potential Future Measures to Increase Seat Belt and Child Restraint Usage: Eliminating the remaining exemptions in seat belt and child restraint laws could increase usage and thereby reduce fatalities and injuries. Higher fines for non-use of seat belts and child restraints could motivate greater usage. Jurisdictions that do not assign demerit points for these offences could implement this measure, and those which already have demerits could raise them. U.S. surveys show that seat belt use is 5-10% lower at night (e.g. Chaudhary et al., 2005). Night-time police enforcement can detect occupants who are more likely to be unbelted but also detect impaired drivers who are often unbelted. Several waves of night-time enforcement education campaigns were conducted in three North Carolina communities in 2007 and night-time seat belt use increased by as much as 10% points (Solomon et al., 2009). In Washington State, where seat belt use is more similar to that in Canada, night-time enforcement resulted in seat belt use increasing from 95% to 97% during the campaign (Thomas et al, 2010). Night-time seat belt campaigns may be an effective method of increasing seat belt usage in Canada. 10
Enforcement programs could be combined with incentive programs that reward seat belt users with a small
gift (e.g. a voucher from restaurant) and/or enter them into a grand prize draw. Quebec adopted a combined
enforcement and incentive approach in the 1980’s and seat belt use was seen to increase significantly, although
it was difficult to assess the impact of the incentives separately from the penalties (Dussault, 1990). Generally,
the effects of incentives are greater when baseline seat belt use is lower and when the target population is more
confined (e.g. school programs, employer programs, colleges, small communities).
Feedback signs have also been posted at the roadside showing the observed seat belt use rate. Usage is measured
each day and the numbers are changed accordingly. Feedback signs have been used successfully in Ottawa and
in North Carolina. In the latter, driver seat belt use increased from 75 to 89% in Asheboro and from 80 to 86% in
Greensboro (Malenfant et al., 1996). These signs appear to plant the idea that most occupants are belted, putting
some social pressure on people to conform by wearing their seat belts. The changing numbers on the signs also
tell people that someone is observing seat belt use so that there is an increase in the perceived likelihood of
being stopped by the police, which results in increased seat belt use.
Employers could create policies stating that all their employees must wear seat belts when traveling in company
vehicles or on company business. There could also be educational programs combined with the use of incentives
and feedback signs in the workplace.
Vehicle technology can also be used to increase seat belt use. Vehicle seat belt reminders, currently used in
front seats, could be included for the rear seat, and they could be made longer than the current eight seconds
and made to become louder over time if the occupant remains unbelted. Technology could be installed in new
vehicles which would delay the driver’s ability to put the vehicle into gear if the driver is not belted. Vehicles
could be designed with haptic feedback to the accelerator such that unbelted drivers would have to press harder
on the accelerator in order to exceed a preset speed (e.g. 50 km/h). A pilot study showed that drivers who usually
were unbelted started wearing their seat belts when their company vehicle was fitted with this haptic technology
(VanHouten et al., 2011). Vehicles could be designed so that if the driver or other occupants are unbelted, the
headlights would flash on and off, thereby informing the police of unbelted occupants. Ultimately, ignition
interlocks could be installed to prevent vehicles from being moved if the driver or other occupants are unbelted.
Parents should be aware of the importance of using child restraints properly. Educational campaigns using all
forms of media (e.g. mass-radio, TV, Facebook, Twitter) could help to raise awareness. Family physicians could
provide information to parents about the importance of properly placing their children into occupant restraints
that are appropriate for their weight and height. Child restraint clinics could be conducted more frequently
to show caregivers how to properly install and use restraints. The police could conduct more frequent STEPs
(enforcement and public awareness) to increase child restraint use.
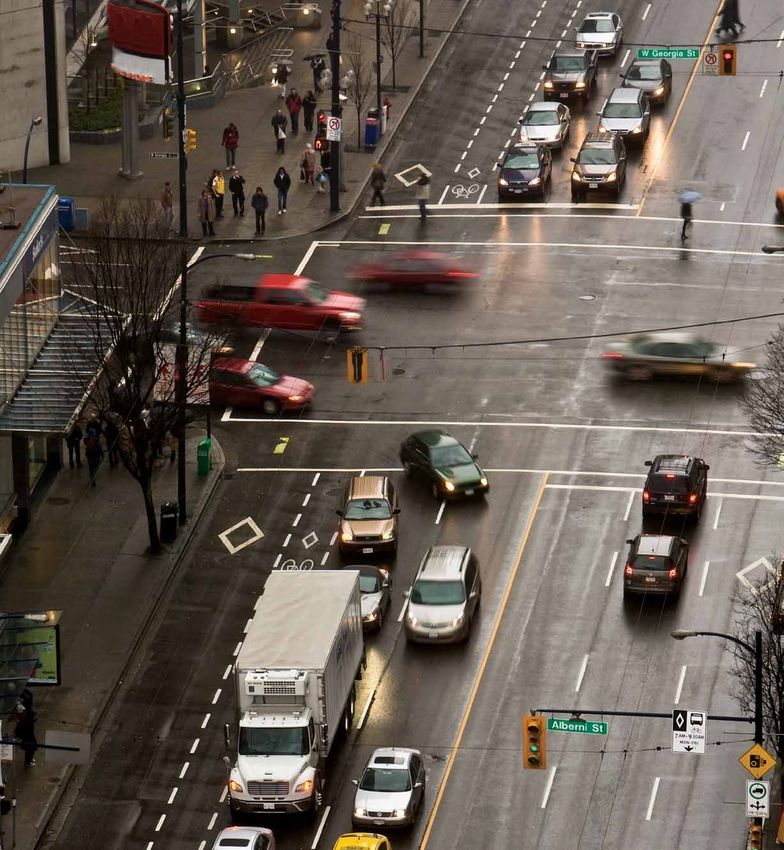
113.2 Aggressive Driving
Aggressive driving includes speeding, running red lights, tailgating, weaving in and out of traffic, and failing to
yield right of way, among other behaviours. Collision statistics reveal that 27% of fatalities and 19% of serious
injuries involve speeding. Figure 6 shows that in 2002 and 2003, there was not much change in the number of
speed-related fatalities and serious injuries compared to 1996-2001, but starting in 2004, speed-related serious
injuries increased, while speed-related fatalities increased in 2005. By 2007, both had leveled off but were still
higher than earlier in the decade.
Figure 6: RSV2010 Speed Sub-Target Fatalities / Serious Injuries in Speed-Related
Crashes: 2002-2007vs 1996-2001 Baseline
119.6 119.8
120
115 Speed Sub-Target Objective
113
110.8
110 106.5 107.7 108.5
Index (1996-2001)
104.2
105 102.3 101.5
100 100
98.7
100
95 92.6
90
85
80
75
70
1996-2001 2002 2003 2004 2005 2006 2007
Killed Seriously injured
CCMTA: SPEED AND INTERSECTION SAFETY MANAGEMENT, Annual Monitoring Report 2009.
Some characteristics of fatal collisions involving speeding are as follows:
..40% of speeding drivers involved in fatal crashes were 16 to 24 years of age;
..most drivers killed in speed-related crashes were the ones speeding;
..80% of young adult passengers who were killed in a speeding crash were in the vehicle with a
speeding driver of similar age;
..single-vehicle crashes accounted for more than 50% of speeding deaths and serious injuries;
..one in three speeding drivers involved in a fatal crash had been drinking;
..urban roads at night are the primary location for fatal crashes involving young adult drivers, speed, and
alcohol since urban areas have a high concentration of bars, restaurants and other places where alcohol
is served.
Further information about speed-related collisions can be found at:
www.tc.gc.ca/eng/roadsafety/tp-tp2436-rs200807-menu-158.htm
12Research indicates that a 1% reduction in speed results in reducing the likelihood of a fatal collision by 5%
(OECD, 2008). Therefore, a downward shift in the distribution of driving speeds for all drivers would be beneficial
not just for those speeding on highways. Though the police have used radar units to detect speeders for years,
this approach is very labour-intensive. Automated speed enforcement detects speeding drivers using radar and a
camera. The radar measures vehicle speeds, and for vehicles traveling over a preset threshold, the camera records
the licence plate number with vehicle owners receiving a summons in the mail.
Speed cameras have been found to be effective in reducing speeding and traffic casualties in Europe (e.g. France,
Sweden, the United Kingdom) as well as in Australia. The U.K. Department for Transport conducted an evaluation
of the impact of speed cameras in 38 areas that were employing cameras as part of a national program between
April 2000 and March 2004 (PA Consulting Group, 2005). Surveys showed that average speeds dropped at speed
camera sites by 6%, and there was a 31% reduction in drivers breaking the speed limit. Fatalities and serious
injuries were 42% lower at the camera sites, resulting in a benefit-cost ratio for speed cameras of 2.7 to 1. There
was also evidence suggesting that speeds were reduced not only where the cameras were located but on other
roads in the area as well.
Currently in Canada, there are only municipal speed camera programs such as those in Edmonton, Calgary
and Winnipeg. Quebec is currently conducting a pilot study using speed cameras in the Montreal, Montérégie
and Chaudière-Appalaches regions. Early results indicate that speeding has decreased by 44% and extreme
speeding (50 km/h over the limit) is down 94%. More information about this pilot program can be found at:
www.ecomodder.com/forum/showthread.php/cameras-success-quebec-speeding-red-lights-9711.html
Ontario introduced anti-racing legislation in 2007 to deal with high-speed driving (i.e. 50 km/h over the limit).
Driver’s licences can be automatically suspended, vehicles can be impounded for up to seven days, and there
are hefty fines (i.e. $10,000). The Ontario Provincial Police (OPP) reported that speed-related fatalities dropped
by about 50% from 2007 to 2009 on highways that they patrol. A similar law came into effect in British
Columbia in 2010. Quebec has also introduced new safety measures in March 2011.
Ontario and Quebec implemented legislation in 2009 to deal with speeding heavy trucks. All heavy trucks
must now have speed limiters activated so that the maximum speed that they can travel is 105 km/h. It remains
to be seen what impact that this will have on collisions.
A national survey conducted by Ekos Research (2007) for Transport Canada indicated that while 47% of the
respondents agreed that speeding was a main cause of traffic collisions, 70% admitted to exceeding the speed
limit at least sometimes, particularly on highways (81%). This suggests that there is a disconnect between how
people perceive the risk of speeding behaviour and how they actually drive. Two groups of speeders were
identified: risk takers who speed because they enjoy taking risks and defying authority, and pragmatic speeders
who speed in order to get to their destination more quickly. About three-quarters of survey respondents supported
electronic roadside signs or in-vehicle systems telling drivers that they are speeding, while 56% considered the
use of speed cameras a good idea.
13Aggressive driving also occurs at intersections. About 30% of fatalities and 40% of serious injuries occur at
intersections. Figure 7 shows the trend in the number of fatalities and serious injuries involving intersections
from 2002 to 2007 compared to the 1996-2001 baseline period. The rate of intersection fatalities and serious
injuries was generally lower in the later years than in the baseline period, particularly in 2007, suggesting that
intersections may be getting safer.
Figure 7: RSV2010 Intersections Sub-Target Fatalities / Major injuries in Intersection
Crashes: 2002-2007 versus 1996-2001 Baseline
102
100 100 Intersections Sub-Target Objective
100
Index (1996-2001 = 100)
98.5 98.6
98 96.7
96 95
94 92.1
92 90.4
90 88.8 89 89.1 88.9 89.1
88
86
84
82 81.3
80
78
1996-2001 2002 2003 2004 2005 2006 2007
Killed Major Injuries
CCMTA: SPEED AND INTERSECTION SAFETY MANAGEMENT, Annual Monitoring Report 2009.
The following are some characteristics of the 2002 to 2004 fatal collisions at intersections:
..urban intersection crashes account for over half of all fatalities and almost three-quarters of serious injuries;
..older drivers (65+) are much more likely to commit an infraction leading to an intersection crash than
most other drivers;
..fewer children under 16 are being killed or seriously injured in crashes at intersections compared
to 1996-2001;
..40% of all intersection fatalities involve a driver failing to yield the right of way or disobeying a traffic
sign or signal.
More information regarding intersection collisions can be found at:
www.tc.gc.ca/eng/roadsafety/tp-tp2436-rs200806-menu-839.htm
Some drivers run red lights at intersections knowing that there is an all-red light phase before the new green
light appears, and other drivers jump the green light or complete a left turn on the yellow light, resulting in
an intersection collision, often at high speed. In order to address such aggressive driving, several Canadian
14municipalities (e.g. Edmonton, Ottawa) have implemented red light cameras which detect vehicles entering the
intersection on a red light and take a picture of the vehicle’s plate. The Insurance Institute for Highway Safety in
the U.S. recently released a study (2011) that found that in 14 cities with red light cameras, fatal red light running
declined by 35% from 2004 to 2008, compared to the pre-camera period from 1992 to 1996, whereas in
48 cities without these cameras, there was a drop of only 14%.
Potential Future Measures to Reduce Speeding and Other Aggressive Driving: Fines for speeding could be
raised, as could demerit points. However, greater speed enforcement is key. Speed cameras and red light cameras
could be implemented more widely across the country and their usage publicized. “Speed on green” technology
is being used in Edmonton to identify red light runners and drivers that are speeding through the intersection on a
green light.
Other technological approaches to control speeding have been tried but not widely implemented. There are
on-board devices that drivers can plug into the vehicle’s OBDII port which will give the driver a visual and/
or auditory signal that he is speeding, or they could be used with haptic feedback so that the driver has to
press harder on the accelerator to keep the speed above a preset level. There are also on-board systems called
intelligent speed adaptation (ISA) which communicate with GPS satellites or land based beacons that can
automatically reduce the vehicle’s speed to the limit. An on-road trial in Sweden found a decrease in collisions
of 10-15% when informative systems were used, while a decrease on the order of 10-24% was observed for
active systems which automatically reduced vehicle speed (Biding & Lind, 2002). Another method is to use point-
to-point speed measurement on controlled-access highways using licence plate readers. If a driver entered the
highway at one time and exited at another time, it is fairly simple to know how fast the driver was driving and a
speeding ticket could be issued as is done for speed cameras.
Drivers could also be rewarded for traveling in a safe manner. A pilot study was conducted in Winnipeg where
drivers were rewarded for not exceeding the speed limit and maintaining a safe distance behind a vehicle in
front (Battista et al., 2010). These behaviours were measured using a Global Positioning System/Geographic
Information System (GPS/GIS) and forward-looking radar. Drivers accumulated points when both behaviours
were observed for each 15 second period, and these points could be redeemed to purchase rewards. It was
found that such a system is technically feasible and the rewards resulted in safer driving at least over a four
month period.
There continues to be a need to raise public awareness about the risks of speeding and running red lights.
153.3 Young/Novice Drivers
While only 13% of licensed drivers were aged 16-24, 24% of fatalities and 26% of those seriously injured were
16 to 24 years of age. Young drivers 16 to 24 years of age continue to be at higher risk of being killed in motor
vehicle collisions per distance traveled than all other age groups, as noted in Figure 8.
Figure 8: Young drivers are overrepresented as victims
35.0
Drivers Killed per Billion VKM
32.4
30.0
25.0
20.8
20.0
15.0
11.0
10.0
6.7
5.0 3.5 3.8
2.2 2.7
0.0
16-19 20-24 25-34 35-44 45-54 55-64 65-74 75+
Note: Includes drivers of light-duty vehicles killed in crashes during 2004.
That is why since 2005, all Canadian jurisdictions have had Graduated Driver Licensing (GDL) programs for all
novice drivers, who are generally young. The rationale for these GDL programs is that it is safer to ease novices
into the driving environment, gradually allowing them to gain driving experience under lower risk conditions.
Typically, there is a twelve month novice driver phase followed by another twelve month intermediate driver
phase, although some jurisdictions are extending this latter phase to two years (e.g. Ontario). During the novice
phase, there are a number of restrictions, such as a minimum driving age of 16, driving with an experienced
supervisor, seat belt use, no alcohol, no late night driving, no young passengers, and no expressway driving.
During the Intermediate phase, there are fewer restrictions (e.g. zero Blood Alcohol Concentration) although
some jurisdictions such as Ontario have extended the 0 BAC until age 21 even if the driver is no longer in the
GDL program.
More information about GDL programs in Canada can be found at:
www.tirf.ca/publications/project_show.php?pid=45
Mayhew et al. (2005) reviewed evaluations of GDL programs conducted in Nova Scotia, Ontario, and British
Columbia and found that collision reductions attributed to GDL were in the order of 15-30% depending on
the specific age group and the measure used.
16Potential Future Measures to Improve the Safety of Young Drivers: Awareness of the GDL restrictions
could be raised particularly among parents so that they can monitor their children’s driving. More hours of
practice driving (e.g. 120 hours) by novices that are certified by parents, as required in some countries (e.g.
Australia), would increase the experience level of novice drivers. Driver education and licensing tests could
be more focused on perceiving the dangers on the road and how to respond to them. Novices could be taught
what to do if the tires of their vehicle leave the pavement at high speed, since “loss of control” collisions in these
situations is common among young drivers. Parents could require their children to provide a “flight plan” before
they leave with the family car (i.e. where they are going, with whom, how they will get there, and when they will
be home).
Young drivers could be prohibited from using cell phones, PDAs, iPods, etc. while they are in the GDL program,
regardless of whether they are hand-held or hands-free as has been done in British Columbia and Saskatchewan.
Driver handbooks could include a section about the risks of driving while distracted, particularly by the use of
electronic equipment.
Websites could be established which provide information to children and their parents about being a safe road
user at various stages (i.e. walking, bicycling, riding a motorcycle, driving a car) as Alberta Infrastructure and
Transportation has done at: www.saferoads.com/safety/index.html
More educational DVDs and websites targeted at teens, such as iDRIVE (www.roadstories.org) and the Drive
Alive rap video in the Northwest Territories, could be developed and distributed to schools for use in assemblies
to raise youth awareness about the risks on the road.
3.4 Driving Impaired by Alcohol
Current Status: Drivers who are considered by the police to be impaired based on their driving behavior
or have more than 80mg of alcohol in 100 milliletres of blood (often referred to as the .08 or 80mg%) are
considered to have committed an offence under the Criminal Code of Canada. In 2008, coroners’ testing showed
that almost 40% of fatally injured drivers had been drinking some amount of alcohol (HBD) prior to the collision.
17Figure 9 shows the percentage of fatally injured drivers who had been drinking or were over the .08 limit for each
year from 1987 to 2008. While these percentages declined between 1987 and 1999, there has been virtually no
further decline in these numbers over past ten years, and in fact, they have increased somewhat over the past
four years. It has also been estimated using a measure based on single vehicle night-time collisions that in 2008,
about 20% of serious injury collisions involved a drinking driver.
Figure 9: Percentage of Fatally Injured Drivers Who Had Been Drinking or Over 80mg%*
60
50
40
%
30
20
10
0
1987
1988
1989
1990
1991
1992
1993
1994
1995
1996
1997
1998
1999
2000
2001
2002
2003
2004
2005
2006
2007
2008
Year
Over 80mg% Had Been Drinking
* Alcohol Crash Problem in Canada, CCMTA 2010
About 45% of the HBD drivers and those drivers over .08 were aged 20-35 even though only 27% of licensed
drivers were in this age group. Male drivers accounted for 85% of the HBD drivers and 87% of the drivers over
.08 but only 52% of the licensed drivers. About 60% of collisions involving a drinking driver were single vehicle
collisions, while almost 90% of those collisions involving drivers over .08 involved only one vehicle.
More information about impaired driving collisions can be found at: www.tc.gc.ca/roadsafety/impaireddriving
18On July 2, 2008, new Criminal Code provisions on impaired driving came into force in Canada, which gave
police better tools to detect and investigate alcohol- and drug-impaired driving. These changes increase the
maximum sentence to life if the driver causes death and to a maximum 10-year sentence if they cause bodily
harm; make it an offence if they refuse or fail to comply with a demand to provide for physical sobriety tests
or bodily fluid samples; make it more difficult to get off on such stories such as “I only had two beers”; and
toughen mandatory penalties ($1000 for a first offence, 30 days in jail for a second offence, 120 days in jail
for a third offence).
The Canadian Council of Motor Transport Administrators (CCMTA) has had a Strategy to Reduce Impaired
Driving (STRID) since the mid 1990s, which was an integral part of the Road Safety Vision and remains
a key component of RSS 2015. The STRID 2010 strategy can be found at:
www.ccmta.ca/english/committees/rsrp/strid/strid-strategy.cfm
Most jurisdictions have implemented the major STRID interventions to address Driving while impaired. All
jurisdictions have 90 day administrative licence suspension, and most have vehicle impoundment, alcohol
ignition interlock programs, short term licence suspensions, and assessment/rehabilitation programs. In addition,
police services conduct periodic roadside enforcement programs in their jurisdictions during the year, particularly
during the holiday season in December. For a summary of the various measures used in the jurisdictions, see
Transport Canada’s impaired driving publication Smashed/Impact.
Potential Future Measures to Reduce Impaired Driving: In Canada, police officers can stop drivers at
random, but they must have a suspicion that the driver has been drinking before requiring a roadside breath
test. Many countries have implemented random breath testing (RBT) laws whereby police officers can randomly
stop drivers and demand that they provide a breath test regardless whether they exhibit any signs of drinking.
Such laws in Australia and in many European countries have raised the perceived likelihood of being caught for
impaired driving and have therefore reduced impaired driving. The House of Commons Standing Committee
on Justice and Human Rights reported in 2009 that an evaluation of RBT in New South Wales in Australia found
a 36% reduction in the number of fatally injured drivers with Blood Alchohol Concentrations (BACs) over the
legal limit of 50mg%. Another evaluation cited concluded that there was a 23% reduction in fatalities as a result
of RBT legislation in Ireland. Publicizing RBT has been shown to make the law even more effective by raising
perceived likelihood of apprehension.
Studies have shown that many convicted impaired drivers continue to drive even though their licences are
suspended. For example, Malenfant et al. (2002) found that 57% of suspended impaired drivers in Moncton
continued to drive. Vehicle impoundment or even forfeiture would deter drivers from driving while suspended.
Some jurisdictions (e.g. British Columbia) are using the Automated Licence Plate Recognition (ALPR) System to
detect drivers without valid licences by reading licence plate numbers and linking these numbers to licences.
On the Lower Mainland of B.C. between February, 2007, and September, 2009, more than 3.6 million licence
plates were scanned, resulting in nearly 3,700 charges (Globe and Mail, 2009). The majority of charges were
for driving without a licence but other charges included possession of drugs or stolen property and breaching
probation conditions. This technology could be used more widely to get unlicensed drivers off the road.
19In most Canadian jurisdictions, convicted impaired drivers can choose to have an alcohol ignition interlock
placed on their vehicle in order to get their licence back before the end of the suspension period imposed by
the court. Many drivers refuse the ignition interlock, claiming that they will complete their suspension, but may
continue to drive anyway. Participating in an ignition interlock program for at least nine months after licence
suspension without any breath test failures could be made mandatory if a driver wants to get their licence back.
Mothers Against Drunk Driving (MADD) Canada and the Ontario Community Council on Impaired Driving
are working with a number of communities on Call 911 Impaired Driver Campaigns where drivers can phone
911 to report a suspected impaired driver to the police.
While most jurisdictions have legislation addressing driving with BACs between 50 and 80mg%, a number
of jurisdictions have increased the length of licence suspensions for violations of these administrative laws
(e.g. Ontario, British Columbia, Saskatchewan) to three days or more and even longer for repeat offences
(e.g. 30 days).
Additional measures to address impaired driving include:
..educating police, prosecutors, and judges about drunk driving so they understand the consequences
of such behaviour;
..streamlining procedures for processing drunk drivers;
..encouraging police to lay more criminal charges rather than administrative charges for lower BACs,
where appropriate;
..tracking administrative licence suspensions on driver records to identify repeaters;
..introducing escalating sanctions based on BAC level;
..widening the look-back window to ten years for determining repeat offences;
..promoting and strengthening links between the police, courts, injury prevention agencies,
and other groups with an interest in preventing impaired driving.
A possible long term solution to impaired driving is being sought by a U.S. Blue Ribbon Panel on the Driver
Alcohol Detection System for Safety (DADSS) that includes federal governments (U.S. and Canada), motor
vehicle manufacturers, alcohol testing companies, alcohol and road safety researchers, and non-governmental
organizations. The panel is seeking to develop an alcohol detection device which is transparent, highly accurate,
easy to use, and low in cost that can be installed in all new vehicles so that drivers with BACs over the legal limit
would not be able to move the vehicle. The technology being assessed includes infrared skin testing and breath
testing. More information about DADSS can be found at: www.dadss.org
203.5 Driving Impaired by Other Drugs
Drugs other than alcohol are also being found in about one-third of tested fatally injured drivers, similar to
the prevalence of alcohol. These drugs, which can be prescription (e.g. valium), over- the-counter (e.g. cold
remedies) or illegal (e.g. marijuana), can reduce drivers’ reaction times as well as their attention to the task of
driving. As shown in Figure 10, alcohol and other drug use is more common among young drivers 20 to 34 years
of age (Beirness and Beasley, 2011a). From 16 to 54 years of age, alcohol is more common than other drugs,
but for those 55 and over, other drugs are more common. The latter likely reflects the greater use of prescription
drugs by older people. Roadside surveys in British Columbia (Beirness and Beasley, 2011b) have shown that drug
use rivals alcohol use by drivers at night, with 10% of drivers having been drinking and 7% having been using
other drugs, although about 10% of drug users had been drinking as well. The most common drugs detected were
cannabis, cocaine, and benzodiazepines.
Figure 10: Percentage of drug and Alcohol Positive cases According to Age Group
50
40
% (Percentage)
30
20
10
0
16 to 19 20 to 24 25 to 34 35 to 44 45 to 54 55 to 64 65 to 74 75 +
Drugs Alcohol
Source: Beirness et al, Drug use Among Fatally Injured Drivers, 2010
Changes to the Criminal Code of Canada in July 2008 allow police officers to request a driver suspected of
impaired driving, to submit to physical (e.g. horizontal gaze nystagmus, walk and turn, one leg stand) tests called
the Standardized Field Sobriety Test (SFST). Drivers showing signs and symptoms of impairment not consistent
with their BAC can be required to take a series of other tests (e.g. physical assessment, eye exam, divided
attention tasks) performed by a trained Drug Recognition Evaluator (DRE) who can determine whether the driver
is impaired and by what class of drug. If appropriate, the officer can demand a bodily fluid sample, including
blood, urine, or oral fluid. If the class of drug detected is consistent with the DRE’s findings, the driver can be
charged under the Criminal Code and be subject to the same penalties as those for an impaired driving
by alcohol conviction.
21Potential Future Measures Dealing with Drugs Other than Alcohol: The public’s awareness about the
impairing effects of drugs on driving performance could be increased. While some drugs are illicit, others are
prescribed by physicians to treat various ailments. Doctors and pharmacists could provide more advice to
patients about the potential impairing effects of some prescription drugs. There is also a need for better labeling
of prescription medication so that people know what drugs may impair their driving performance. More police
officers could be trained in the use of SFST and additional DREs who can conduct behavioural tests on drivers
suspected of driving while impaired by drugs are needed.
3.6 Distracted Driving
According to the CCMTA’s Distracted Driving Subcommittee: “Distracted driving is the diversion of attention from
driving, as a result of the driver focusing on a non-driving object, activity, event or person. This diversion reduces
awareness, decision-making or performance leading to increased risk of driver error, near-crashes or crashes.
The diversion of attention is not attributable to a medical condition, alcohol/drug use and/or fatigue.” There are
various possible driver distractions, including:
..using electronic devices such as (global positioning system) GPS systems, CD and DVD players, radios, cell
phones, laptops, (personal digital assistant) PDAs and MP3 players;
..reading maps, directions or other material;
..grooming (e.g. combing hair, putting on make-up or shaving);
..eating or drinking;
..talking with passengers or tending to children or pets;
..visual distractions outside your vehicle, such as collisions, police activity, or looking at street signs
or billboards.
According to the U.S. National Highway Traffic Safety Administration (NHTSA, 2010), in 2009:
..16% of fatalities and 20% of injuries in the U.S. involved driver distraction;
..the highest proportion of distracted drivers involved in fatal crashes was in the under-20 age group
(16%) followed by those aged 20 to 29 (13%);
..light-truck drivers and motorcyclists were most often distracted (12% each);
..drivers aged 30 to 39 were most likely to have been distracted by cell phones (24%) prior to fatal crashes.
A 100-Car Naturalistic Driving Study in Virginia (Klauer et al., 2006) established direct relationships between
driver actions and crash or near-crash involvement through continuous driver monitoring by in-vehicle video
observation. The analysis of eye glance behaviour indicated that eyes-off-the-road durations of greater than two
seconds significantly increased the risk of crashes and near-crashes. Furthermore, the study found that secondary
task distractions (e.g. cell phones) contributed to over 22% of crashes and near-crashes. Although comparable
data for Canada are not available, the involvement of distracted driving in fatal and injury collisions is likely
very similar.
While many driver distractions have existed for decades, there is growing concern about the distraction caused
by cell phone use either for talking or texting and the use of PDAs or Blackberries to read and send e-mails.
Using such devices while driving reduces the driver’s awareness of their environment to the extent that they are
22not paying attention to what is happening around them. The use of such equipment has been shown to increase
the chances of a collision from 38 to 400% depending on the methodology used (Laberge-Nadeau et al., 2003;
Redelmeier and Tibshirani, 1997).
Vanlaar et al. (2006) conducted a survey of the Canadian public about distracted driving and found that two
thirds of respondents were concerned about cell phone use while driving. Cell phone use while driving in the
previous seven days was reported by 37%, but this was even higher for those aged 16-34 (55%).
Figure 11 shows the percentage of drivers observed to be using cell phones as part of recent seat belt surveys
in each Canadian jurisdiction (Transport Canada, 2011).
Figure 11: Rural and Urban Canada, Driver Cell Phone Use by
Province/Territory - 2009-2010
3.5
Newfounland & Labrador
3.5
Prince Edward Island
Nova Scotia 3.6
Province/Territory
New Brunswick 1.8
3.3
Quebec
Ontario 3.3
Manitoba 1.8
Saskatchewan 1.8
4.9
Alberta
3.3
British Columbia
Yukon 2.2
2.1
Northwest Territories
Canada 3.3
0 2 4 6 8 10
Percentage of Drivers Using Cell Phone
*Transport Canada’s Rural and Urban Surveys of Seat Belt Use in Canada 2009-2010, Fact Sheet TP 2436E,RS-2011-01,
which can be found at http//www.tc.gc.ca/eng/roadsafety/tp-tp2436-rs201101-1149.htm
Overall, about 3% of Canadian drivers were observed to be using cell phones, although this was lower than the
6% usage observed in the 2006-2007 surveys, which suggests that the laws prohibiting their use may be having
an effect.
The CCMTA’s strategy on distracted driving, which includes a number of measures to reduce distracted driving,
can be viewed at: www.ccmta.ca/english/committees/rsrp/strid-distraction/strid-distraction-strategy.cfm
23Most Canadian jurisdictions have introduced laws prohibiting the use of hand-held devices, and the others will likely have them soon. For more information about these laws, visit: www.tc.gc.ca/eng/roadsafety/safedrivers-major-distractions-1073.htm Police officers have been conducting periodic enforcement of these use laws combined with awareness campaigns to reduce the usage of these devices while driving. Potential Future Measures to Prevent Distracted Driving: The public’s awareness about the risks of distracted driving in general and the use of telecommunications/telematics equipment while driving in particular can be increased so that distracted driving is no longer acceptable. Even though the use of hands-free devices is not prohibited for most drivers, research shows that they can be just as distracting (Harbluk et al., 2006) as handheld devices so awareness of the risks of hands-free equipment needs to be increased. One approach to raising awareness is the use of the Insurance Bureau of Canada’s DUMB (Distractions Undermining Motorist Behaviour) driving simulator which allows drivers to experience the distracting effects of cell phone use. More information about the DUMB simulator can be found at: www.ibc.ca/en/BeSmartBeSafe/Road_Safety/dumb_struck_facts.asp Other educational material (e.g. iDrive DVD) can show young drivers how their driving performance is affected by distractions such as cell phone use. CCMTA, in partnership with the Canadian Global Road Safety Committee, has recently launched the Leave the Phone Alone pledge campaign at: www.leavethephonealone.ca/pledge.php. The aim of the campaign is to get drivers to pledge that they will not use their cell phones while driving. Insurance companies could offer discounts to drivers who make the pledge. Employers can also play a role by establishing policies which prohibit their employees from using cell phones, Blackberries, and other electronic devices while operating a company vehicle or operating their own vehicle while on company business. Many Canadian employers in the private (e.g. Esso Imperial Oil) and public sectors (e.g. Manitoba Public Insurance, Ministry of Transportation of Ontario, Transport Canada) have taken such positive steps. The following website indicates what other countries do regarding cell phone bans: www.cellular-news.com/car_bans/. Companies interested in developing a policy on cell phone use could review the following site: www.safetyxchange.org/tools/sample-company-cell-phone-policy-2 There are also concerns about distraction from on-board vehicle telematics (e.g. route guidance, infotainment) so there must be strict guidelines for manufacturers to follow in designing this on-board vehicle and aftermarket equipment to prevent driver distraction. The frequency of use of cell phones and other telecommunications equipment immediately prior to collisions could be determined and assessed (i.e. included in police reports) but it may be necessary to provide police with access to cell phone records to do so. 24
You can also read