Activity Output E-Micromobility Safety Assessment - EIT Urban Mobility - Mobility for more liveable urban spaces
←
→
Page content transcription
If your browser does not render page correctly, please read the page content below
Activity Output

E-Micromobility Safety Assessment

EIT Urban Mobility - Mobility for more liveable urban spaces

EIT Urban Mobility

Barcelona | 2020.12.18

eiturbanmobility.eu

                                         1
Reporting year   2020

Activity code    20034

Output No.       OUT06

Output title     E-Micromobility Safety Assessment

                                              2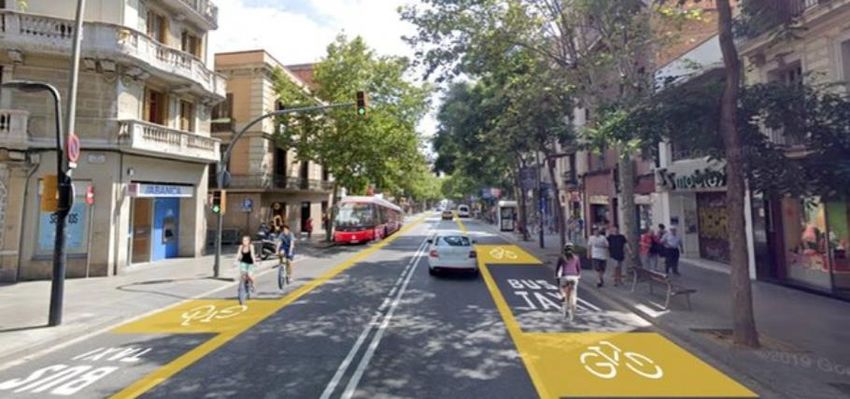
Document information
Author(s) and contributing partner(s) - if any

               Name                            Organisation                      Contribution

 A.Broquetas, J.Casademont, A.       Technical    University      of   Author
 Calveras,     I.    Stroumpou,      Catalonia (UPC)
 J.Guisado,           J.L.Larriba,
 D.Agustin, C.M. Espinar, S.Royo,
 J.Moreno. J.Romeu, M. El
 Khayati

 R.Nualart,           J.Contreras,   I2CAT Foundation                  Author
 B.Cordero

 V. Gitelman                         Technion – Israel Institute of    Author
                                     Technology

 C. Lemardelé                        Carnet – UPC Technology           Contributor
                                     Center

 F. Gómez, M. Ubogui                 SEAT SA                           Author

 V.Goebel                            City of Munich                    Contributor

 G. Henriksson, G.Gidofalvi          KTH Royal        Institute   of   Contributor
                                     Technology

 B. Kalkbrenner                      UnternehmerTUM                    Contributor

 D. Esztergár-Kiss                   Budapest   University of          Contributor
                                     Technology and Economics
                                     (BME)

                                                              3
Contents
    Document information ................................................................................................................................. 3
1      Introduction ....................................................................................................................................... 5
2      Analysis of safety data ........................................................................................................................ 6
    2.1      Present safety regulations ................................................................................................................. 6
    2.2      Micromobility official safety statistics .............................................................................................. 8
    2.3      Safety reports from sharing companies ......................................................................................... 12
    2.4      E-scooter accident injuries’ analysis ............................................................................................... 12
    2.5      Safety aspects of MOBY user survey ............................................................................................... 13
    2.6      Accident causes analysis .................................................................................................................. 16
    2.7      The Police survey ............................................................................................................................. 17
    2.8      The MOBY Workshop in European City Dialogue Safety Poll ........................................................ 18
    2.9      Accident hazards mitigation using Intelligent Transportation Systems (ITS) ............................... 19
3      Impact assessment of urban infrastructures on e-micromobility safety ............................................ 21
    3.1      Urban space design .......................................................................................................................... 21
       3.1.1                    Micromobility / Cyclable lane options ....................................................................... 21
       3.1.2                    Crossing designs .......................................................................................................... 22
       3.1.3                    Superblocks model ...................................................................................................... 23
       3.1.4                    Bicycle/Micromobility new structural designs........................................................... 24
       3.1.5                    Micromobility Charging stations ................................................................................ 24
    3.2      ITS based on Communications urban infrastructure ..................................................................... 25
4      Review and selection of technologies for safety enhancement......................................................... 27
    4.1      User protection and visibility equipment ....................................................................................... 27
    4.2      Vehicle integrity ............................................................................................................................... 27
    4.3      Vehicle stability ................................................................................................................................ 28
    4.4      Vehicle control ................................................................................................................................. 29
    4.5      Micromobility safety enhancement based on ITS .......................................................................... 31
    4.6      Side-walk sensors ............................................................................................................................. 32
    4.7      Traffic surveillance with optical sensors ......................................................................................... 33
    4.8      Radar Sensors ................................................................................................................................... 34
    4.9      Software applications for safety and traffic management ............................................................ 36
    4.10 Parking control ................................................................................................................................. 37
5      Conclusions and proposed safety enhancement measures ............................................................... 38
6      References ....................................................................................................................................... 40

                                                                                        4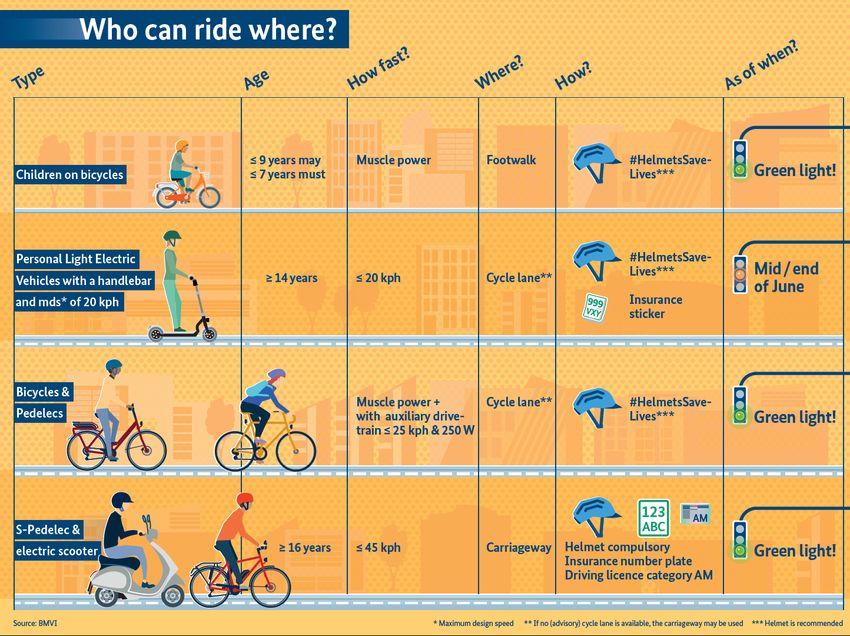
1 Introduction
The emergence of micromobility, a new transportation mode based on small personal mobility vehicles,
can contribute notably to urban transportation sustainability, by decreasing conventional traffic
congestion and associated pollution problems, providing a better access to public transportation and
allowing an energy efficient mobility. However, the sudden introduction of micromobiles in large cities,
notably electric kickscooters delivered by sharing service companies, has created some integration and
safety problems in the urban space. Safety is one of the micromobility concerns influencing its social
acceptance and long-term growth. For this reason, a micromobility safety analysis has been included
among MOBY project tasks. Although micromobility includes different types of vehicles such as bicycles,
small cargo and single wheel vehicles, the safety study has been focused on electric kickscooters, also
known as e-kickscooters or simply e-scooters, since it is the vehicle experiencing the fastest growth ever
seen in the urban scene [1]. Moreover, little knowledge on e-kickscooters safety is available in comparison
with more experienced vehicles such as bicycles. Micromobility safety depends on many aspects such as,
among others, regulations, vehicle design, users’ protection and urban infrastructure, including urban
road/lane design but also specialized telecommunications and signalling concepts known as Intelligent
Transportation Systems (ITS). In addition, several available techniques and technologies can be used to
offer additional safety protection.

For these reasons, the Safety Analysis Task has addressed three main objectives:

    •    Analyse and better understand the safety problems of micromobility, particularly those related
         to the e-kickscooters, with intrinsic safety problems compared to the case of more experienced
         vehicles such as bikes or mopeds.
    •    Assess the impacts of urban infrastructure on micromobility safety, considering both urban
         space such as road/lane design, including also Intelligent Transportation Systems (ITS) signalling
         and telecommunications infrastructures
    •    Assess the available technologies with high Technology Readiness Level (TRL) that can be used
         to effectively enhance the micromobility safety

The present output report contains the results of micromobility safety analysis, infrastructure assessment
and the review of the available technologies considering the safety main priorities, allowing the proposal
of effective safety measures.

A large number of documents has been compiled and reviewed in the micromobility safety analysis
resulting in the Safety Knowledge Data Base with more than 400 references. The basic sources of
micromobility safety information have been: specialised reports, scientific papers, news, official accident
statistics, regulations, norms and standards, e-scooter sharing companies reports and surveys. Additional
surveys have been prepared and distributed among mobility users, traffic accident investigation experts
and urban mobility experts, providing additional information and better hazard recognition and
understanding.

                                                          5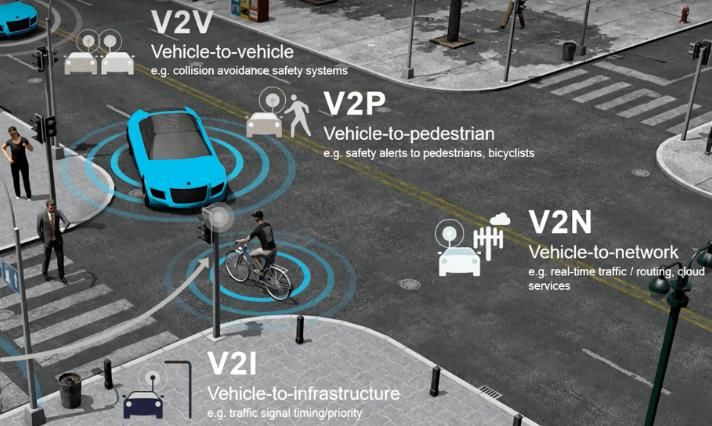
In addition, a group of experts on urban design, Intelligent Transportation Systems (ITS), vehicle design
and production, vehicle power plant control, optical and radar sensors and software applications have
contributed to the urban infrastructure assessment and the technologies review considering possible
applications to micromobility safety.

From the safety analysis priorities, a set of safety enhancement measures has been proposed, considering
the possibilities offered by recent technical advances.

2 Analysis of safety data
The analysis of safety data has been based on several sources of information. An extensive compilation
of published data about e-micromobility safety has been carried out, which resulted in the MOBY Safety
Knowledge Data-Base. The usual micromobility safety documents are: regulations at city or national
levels, accidents and injuries statistics, reports from different traffic related bodies, scientific papers from
transport researchers and news in newspapers and journals that pay special attention to micromobility,
due in part to its novelty in comparison to conventional transport modes

Statistical information often does not reflect minor accidents and light injuries not requiring the
involvement of Police or Medical treatment. For this reason, user surveys are valuable complementary
sources of information allowing to reflect the users’ safety perceptions with strong influence in the
evolution of micromobility. In the MOBY project a user survey has been carried out in Task 2002 which
contained several safety related questions proposed in the Safety Analysis Task. In addition, a police
survey was designed to better understand the main causes of accidents and severity of injuries. From this
information, the main accident types and related injuries have been categorized, identifying the main
causes and related factors. Finally, the participation in the European City Dialogue on Micromobility
Workshop allowed to present the main MOBY safety analysis results and obtain the opinions of
participants on several safety related aspects. The most relevant outcomes are presented in the following
sections.

2.1      Present safety regulations
From 2018 urban traffic regulations issued by national, regional and municipal authorities had to quickly
adapt to the challenges and conflicts created by the fast increase of micromobility, especially e-
kickscooters in urban areas. Without previous experience or guidelines and little time to evaluate pros
and cons, every country/city adopted very different strategies on micromobility regulations, from
tolerance with simple informal instructions based on existing bicycle rules to more formal regulations
including a strict control on vehicle characteristics and restrictions on the use of urban public space. The
safety impact of regulations is evident since many aspects are regulated with the purpose to increase the
safety of riders, pedestrians and users of other types of vehicles.

Regulations have special provisions for each type of vehicle. We will analyse the regulatory diversity of e-
kickscooters, since the vast majority of present micromobility vehicles belong to this class. Table 2.1 and
Table 2.2 show the comparison of basic safety regulations including Minimum age, Plate/Insurance
requirement, Maximum speed of vehicle (electronically limited), Vehicle Certification, Allowed lanes and

                                                             6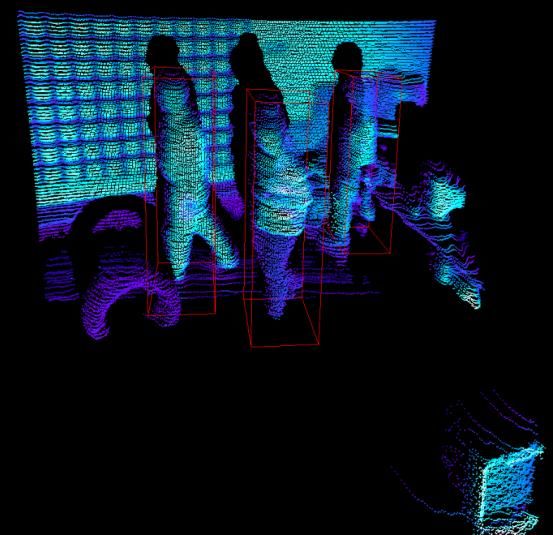
Helmet use. It has been observed that regulations are permanently under discussion and as a
consequence, they are frequently revised. Relevant examples of regulatory changes are the introduction
of compulsory use of helmets and insurance/plate in Tel Aviv along the year 2020, the authorization of
first e-kickscooter trials in UK from July 2020 [7] and the recent decision to exclude e-kickscooter services
and parking from Copenhagen city centre from January 2021 [8].

 Regulation              Germany (Munich)                                          Spain (Barcelona )

 Minimum Age       The minimum age for driving vehicles type        The minimum age for driving PMVs or cycles
                   A (scooter with handlebar and no seat) is 14    is 16 years in all cases.
                   years old.

 Plate/Insurance   An insurance is mandatory and a sticker         If the use of the vehicle is personal, the
                   with identification code must be visible in     insurance   is   not     mandatory     but
                   rear side of vehicle.                           recommended.

 Maximum           The maximum speed of type A and B VMPs           Type A and B maximum speed is 25 km / h
 speed             is 20 km/h in all cases.

 Vehicle           Vehicle types must be certified according to    Not specified. Recommended            reflective
 Certification     the German Personal Light Electric Vehicles     elements, lights and bell
                   Ordinance (eKFV), including stability,
                   braking, max. speed and other tests.

 Allowed lanes     Sidewalks and pedestrian areas not allowed      Type A No allowance on sidewalks except on
                                                                   painted bicycle lanes at max. 10 km/h. Use
                                                                   bicycle lanes on roads when available,
                                                                   pedestrian areas and parks allowed at max 10
                                                                   km/h, allowed on streets limited to 30 km/h.

 Helmet use        Helmet is recommended                           Helmet is recommended

         Table 2.1 Safety related regulations comparison between Munich [4] and Barcelona [3]

 Regulation             Denmark (Copenhagen)                                      Israel (Tel Aviv)

 Minimum Age       15 years old                                         16 years old

 Plate/Insurance   Recommended but not required                         Sharing companies must provide
                                                                        insurance and identification plates.

 Maximum           20 km/h                                              25 km/h maximum speed. In some areas
 speed                                                                  the maximum speed allowed is 15 km/h.

 Vehicle           CE Certified. Reflective elements, white and red     Reflective elements, lights and bell
 Certification     lights and reflectors on front/back parts sides.
                   Yellow or white reflector on vehicle sides.

 Allowed lanes     Bicycle rules apply in general. Use cycle paths if   Riding on sidewalk is not allowed. Riding
                   available. Riding on sidewalks, city centre,         is only permitted on the right side of the
                   footpaths and pedestrian areas is not allowed        road (if no bicycle lanes are available)

 Helmet use        Helmet is recommended                                Helmet is mandatory, reflective vest must
                                                                        be used in dark conditions

       Table 2.2 Safety related regulations comparison between Copenhagen [5] and Tel Aviv [6]

                                                               7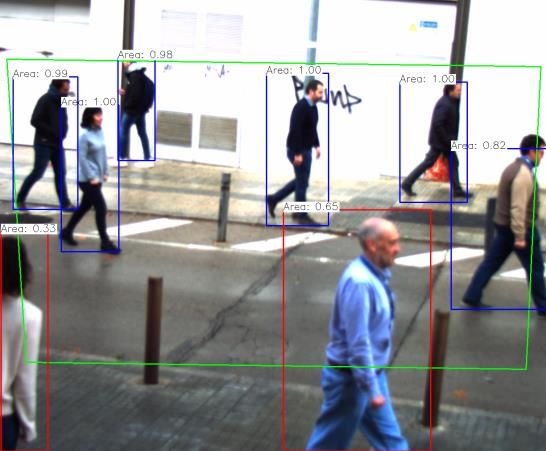
A very relevant regulatory step has been the publication of the Personal Light Electric Vehicle Ordinance
(eKFV or PLEV) from German Ministry of Transport (BMVI) which is available in English as an EC
Notification [4]. The Ordinance, besides basic use regulations, include a complete list of technical
requirements such as dimensions, weight, power, speed range, braking capability, lights, optical
reflectors, characteristics of insurance plate and a set of stability tests in front of surface alterations and
kerbs that the vehicle must pass to become certified for legal circulation in German public space. This
Ordinance has inspired other countries requirements for e-kickscooters technical requirements, like
recent e-scooter trials UK guidance [7] and may become the basis for a future European safety standard
for these vehicles.

One of the problems of micromobility regulations is to achieve appropriate diffusion and knowledge
among users. To achieve a better comprehension from public, some administrations have issued
infographic descriptions of the essential regulations [3], [9]. Fig. 2.1 reproduce infographic information of
essential micromobility regulation in Germany.

                           Fig. 2.1 Basic German regulation of micromobility [9].

2.2      Micromobility official safety statistics
The official accidents statistics are generally provided by national, regional or local mobility
administrations in format of annual tables and summary reports. Due to the recent introduction of e-
micromobility these vehicles are often classed in “Other Vehicles” categories, complicating the
interpretation of statistical data. Fortunately, from 2019 an explicit e-kickscooter class has been

                                                             8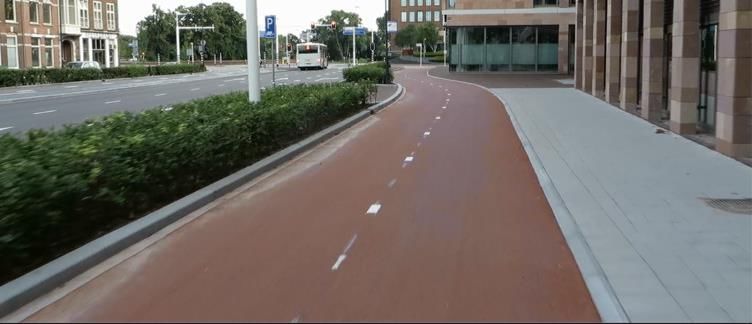
introduced in most statistics. However, the short history of data makes it difficult to make comparisons
between different locations, recognize trends and extracting conclusions.

The official figures usually report severe accidents with injuries and/or damages. A significant number of
minor accidents are not communicated to police and become under-reported.

Another problem with most safety statistics is the lack of information on the causes of accidents. This
information is crucial to improve regulations, such as use of helmets or vehicle certification and
inspection, deploy and maintain the city infrastructure and the proposal of new safety measures. The
accident statistics of several cities participating in the project have been considered in this study. Table
2.3 shows the number of reported accidents in 2018 and 2019 [10] in Barcelona. The statistics show a
large increase of e-micromobiles’ incidents. Accidents from 2018 to 2019 have multiplied by a factor of
380%. It is interesting to note that Barcelona authorities have not issued sharing licenses to interested
companies, prohibiting parking e-kickscooters in public space. Consequently, most vehicles are privately
owned with a continuous and progressive growth of the circulating fleet from 2018. The numbers of
vehicles and rides in 2018 and 2019 are not known which does not allow to estimate the evolution of
accident probabilities

        Vehicles implicated                        2018                                2019
               Cars                                7,710                               7,426
           Motorcycles                             6,091                               6,063
               Vans                                1,248                               1,228
              Moped                                 890                                951
                Taxi                                988                                637
              Bicycle                               786                                796
               Truck                                447                                417
          e-micromobiles                            129                                 490
    Non-powered kickscooters                       N/A                                  49
              Others                                803                                919
              TOTAL                               19,039                              18,975

 Table 2.3 Number of accidents reported to Barcelona police in 2018 and 2019 with the different types
                                       of vehicles implicated.

According to the Central Bureau of Statistics of Israel [11], in 2019 there were 569 road accidents with
casualties, involving electric scooters and reported to the police. 118 accidents were Expanded R.A. type
(with at least one serious injured person) and the rest "General with Slight Casualties" type. This is in
comparison to 220 accidents in 2018, of which 61 were Expanded R.A. type. In 2019, 598 people were
injured in these accidents, in comparison to the 237 casualties in 2018. Of all the casualties in 2019, 2
were killed, 41 were seriously injured and 555 were slightly injured (see Table 2.4).

                                                           9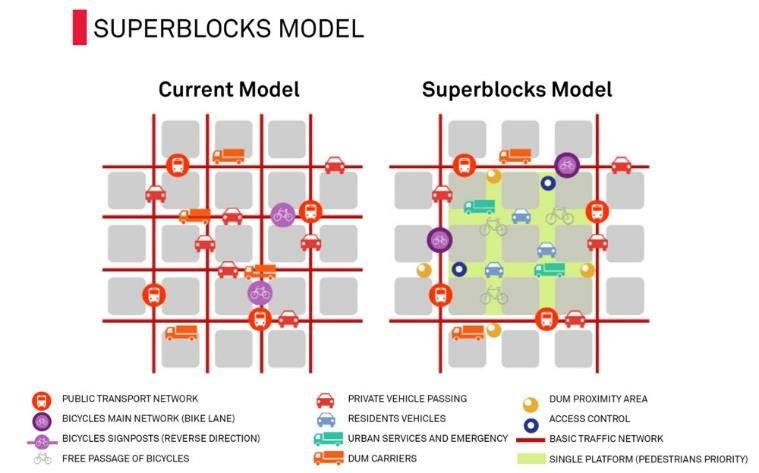
Severity of Injury                        2018       2019
             Casualties reported to the Police (2)                           237          598

             Killed                                                            1            2

             Seriously injured                                                21           41

             Slightly injured                                                215          555

             Casualties not reported to the Police (3)                        49          209

             Seriously injured                                                16           90

             Slightly injured                                                 33          118

             Unknown                                                           0            1

         (1) All of the casualties (including pedestrians) in all the vehicles that were involved in a road
              accident with electric scooters.
         (2) Expanded R.A. and “General with Slight Casualties”
         (3) Severity of injury according to MAIS index.
  Table 2.4 Injuries in Road Accidents in which e-scooters were involved, by severity of injury and year

In the Munich case the police reported a total of 103 traffic accidents involving e-scooters along
approximately 6 months period from 15th of June up to 31st of December 2019 [13]. In the case of e-
kickscooters there is no previous record of accidents to assess the safety evolution, nor estimation of the
number of rides or distances covered. In 31 (30%) accidents it was found that e-scooter drivers were
under the influence of alcohol. This high incidence contrasts with the percentage of bicycle accidents
influenced by alcohol consumption which for the same period was 3.4%.

               Accident severity                        Number

               Accidents with material damages                         36

               Accidents with injuries                                 67

               Isolated accidents (falls)                              50

               Slightly injured                                        60

               Seriously injured                                       8

               Alcohol related accidents                               31

               Total number of accidents                              103

     Table 2.5 Traffic accidents reported to Munich police involving e-scooters from 15.06.2019 to
                                              31.12.2019

                                                           10
Table 2.5 shows the incidence of accidents of different severity, there were no fatalities in the reported
period involving e-scooters, although 8 persons were seriously injured. It is remarkable the strong impact
of alcohol consumption in the 30% of the total of accidents. Also, the number of isolated falls is very high,
as it can be seen in Table 2.6, accounting for almost one half of the accidents. As a reference the
percentage of isolated falls with bicycles in the same period was 15.8% which indicates a poorer stability
of the vehicle, lack of training, alcohol abuse or a combination of these factors.
In 88 (85%) of the 103 traffic accidents involving e-scooters, the e-scooter drivers were found to be the
primary cause of the accidents. This is consistent with the main causes reported of accidents involving e-
kickscooters shown in Table 2.7
Collided vehicle Number (%)
Isolated fall 50 (48.5 %)
With cars 38 (36.9%)
With pedestrians 9 (8.7%)
With cyclists 6 (5.8%)
Table 2.6 Munich e-kickscooter collision table showing the percentages of other type of vehicles or
pedestrians involved
Accident Cause Number
Driver error 44
Influence of alcohol 31
Incorrect road use (sidewalk, 14
pedestrian zone)
Table 2.7 Most common causes of e-kickscooter accidents in Munich
The preliminary accident figures from the Danish Road Directorate for 2019 [14] show that the police has
registered 57 accidents with motorized scooters, of which 24 resulted in personal injury. For comparison,
the police has registered 2042 accidents with bicycles, of which 740 had personal injuries.
A calculation of the accident frequency per travelled distance shows that for bicycles and motorized
scooters there are respectively 0.01 and 0.07 accidents per 10,000 km. These results indicate that there
is about seven times higher risk of accidents using e-scooters compared to bicycles.
The diversity of accident data formats makes difficult to compare the statistical information between
cities. Accident numbers have increased notably from 2018 to 2019 which is to be expected due to fast
growth of e-kickscooter fleets. There are significant differences among the considered cities, since
Munich and Copenhagen e-kickscooters are mostly shared, whilst in Barcelona the vast majority of e-
scooters are privately own. Tel Aviv has a mixed fleet where both shared and privately owned
micromobiles coexist. A more standardised format to report micromobility accidents and an estimation
of vehicles fleets and number of rides and average distances travelled will make easier to compare among
cities and extract more relevant information.
112.3 Safety reports from sharing companies
E-kickscooter sharing companies have the most accurate micromobility data, thanks to widespread
deployment of fleets in many locations at continental or global scale. With GPS tracking of their vehicles
and records of different types, operators are able to study in detail urban mobility patterns, trends and
also safety. According to Bird data [15], e-scooters and bicycles have similar risks and vulnerabilities. Bird
riders reported 37.2 injuries per million rides which is compared to an estimated rate for cyclists of 58.9
Emergency Department (ED) visits per million miles. These figures cannot be directly compared since
sharing companies reports include minor injuries that do not require visiting EDs. On the other hand, US
injury rates for bicycles are significantly higher than in Europe, with an estimated factor of 4.68 times
injuries / million miles with respect to Germany [16]. Therefore, in Europe the safety risk of riding e-
scooters per million miles may be higher than for bicycles.
The International Transport Forum (ITF) has elaborated an e-scooter safety study [2], which presents a
one-year of reported e-scooter crashes’ evolution. This trend, obtained by combining data from Bird and
Tier e-kickscooter sharing companies is very positive with a remarkable reduction of crashes. After one
year the number of reported crashes reduced in a factor of 6, from 140 crashes per million rides in
September 2018, to 23 crashes per million rides on August 2019. This drastic reduction can be explained
by several factors: improvements in vehicles and urban infrastructure, better regulations and information
campaigns, as well as higher users’ experience and safety awareness.
2.4 E-scooter accident injuries’ analysis
Published studies on e-scooter-related injuries and accidents were examined to summarize accident
circumstances, injury characteristics and factors associated with accident occurrences. The studies were
retrieved through a detailed consideration of sources collected in the Moby Knowledge Data Base and
additional searches in Scopus and Science Direct. In total, 17 peer-reviewed papers were summarized
[17]-[33]. Further insights on e-scooter-related accidents and associated factors were learnt from a recent
international report [2].
The studies were conducted in the USA, Australia, New Zealand, Denmark and Finland. Most studies
analysed hospital data (ED visits; trauma registries), two studies examined media reports on e-scooter
involving accidents [2], [32]. The studies reported consistently an increase in the number of related
injuries following the introduction of e-scooter-sharing systems. Such increase stems from the increased
exposure and can also be related to the period of initial adaptation to the new means [2]. The majority
of reported injuries were minor and fatalities were rare but severe injuries did occur. The share of injuries
that needed a hospitalization ranged from 5% to 30% in general samples of ED visits but was substantially
higher in selected samples with head or facial trauma [29], [33], [28]. The latter actually showed a
potential severity of e-scooter-related injuries which should be a function of impact speed, e-scooter
configuration and lack of rider’s protection. Similarly, media reports mostly highlighted serious and fatal
injuries in e-scooter accidents, strengthening the need in separate and appropriate riding infrastructure
in the city, strict regulations and enforcement of rider behaviours (such as helmet wearing, non-
intoxication, safe speeds, respect of walking facilities).
Medical studies reported consistently that head, face and extremity injuries of e-scooter riders, with
fractures/dislocations were common, indicating a need in helmets and other protective equipment for e-
scooter users.
12The extent of non-rider injuries – primarily pedestrians, was low, in the range of 1%-8% among all e-
scooter-related injuries, except for a Danish study [21], which examined the total EMS records in the city
and found 14% of pedestrian injury. The extent of motor vehicle involvement was low, up to 10%, in the
general samples of e-scooter-related injuries (ED visits) but was substantially higher, 60% and over, in the
samples with more serious injuries (hospitalized, killed). Similarly, the order of leading accident
mechanisms was different dependent on the sample type: among general injuries (mostly minor), falls
presented 80% and over, followed by collisions with moving or stationary objects; among severe injuries
and fatalities, hit by a vehicle was the main cause followed by falls and striking an object (or another
vulnerable road user). Many studies reported on low helmet use by e-scooter riders; the extent of alcohol
(or drug) impairment among e-scooter users varied widely, from 4% to 91% (depending on country and
sample type).
Based on injuries analysis and insights from the [2] report, the factors contributing to e-scooter accidents
and injury can be summarized as follows:
- Motor-vehicle involvement in e-scooter accidents increases e-rider injury severity that is not surprising
due to the differences in mass and protection between these road users. Among media reports, high
shares of severe accidents were observed on arterial streets and intersections [32], i.e. at sites with higher
vehicle traffic. Clearly, separate road infrastructure is needed for safe e-scooter riding.
- Pedestrian injuries are not frequent in e-scooter accidents but can be underreported. Pedestrians hit by
e-scooters or tripped over parked scooters are commonly reported phenomena which indicate a need to
separate e-riding facilities from sidewalks and footpaths.
- Helmet use is rare among e-scooter riders but should be increased to prevent severe head and facial
injuries.
- Falls are frequent among e-scooter injuries which can be related to inappropriate road conditions and
presence of obstacles in the vicinity of riding paths. This suggests that road surface should be improved
by design and through maintenance.
- Additional reasons to falls may be in high riding speeds and insufficient experience of e-riders, the
factors that should be treated by appropriate training and enforcement.
- Vehicle failures were not reported by e-scooter accident studies. However, due to high frequency of
falls, e-scooter stability is considered as a design priority. The stability of e-scooters can be influenced
by a number of design factors such as wheel size, tyre design, frame geometry, weight distribution and
the presence of a seat and handlebar [2]. For example, greater wheel size can assist in negotiating poor
road conditions. Obstacle detection systems and stability control solutions can enhance e-rider safety.
- Medical studies suggest that e-scooter design – a stiff handlebar, a possibility of high speeds and lack
of rider’s connection to the device, leads to high-speed falls over the handlebar or on the road
pavement, with consequent head, face or extremity fractures and other injuries. The higher severity of
motorized scooter injuries (compared to non-motorized scooters) supports this assumption [25]. Thus,
a further improvement of e-scooter design is needed to diminish the risk of such scenarios.
2.5 Safety aspects of MOBY user survey
In Task 2002 of MOBY project, a detailed survey was prepared and managed by Budapest University of
Technology and Economics. In total, 790 survey responses were filled in, from the following participant
13cities (with indication of the percentage of participation): Stockholm (29.4%), Copenhagen (19.6%),
Munich (17.8%), Tel Aviv (17.0%), and Barcelona (16.2%).
In the context of this analysis the safety related survey results have been assessed. One of the aspects
surveyed was the awareness and knowledge of specific laws or regulations on micromobility, which in
fact in several countries and cities are in the process of development. Taking the cases of Munich and
Barcelona that have published official regulations, 32% of the participants in these cities answered that
they had no information on micromobility regulations. Since safety depends on the observation of
regulations, it is clear that better awareness and knowledge of regulations should be reinforced, for
example, by periodic information campaigns.
Another aspect asked was what were the users’ main concerns on micromobility. It is interesting to note
that the highest concern is conflicts with pedestrians (55% of respondents), which is probably related by
the second aspect of concern: illegal parking (54%). It is also remarkable that 48% of users considers
present micromobility unsafe.
The survey asked also about where the users would ride an e-micromobile. The first option is Protected
bike lanes (61%), second is Painted bike lanes (47%) and the third is Separate lanes (38%). Sidewalks (6%)
was the less preferred option, which indicates that sidewalk riding may be a consequence of the lack of
bike lanes combined with unsafe perception of riding on streets close to heavier vehicles.
The survey included a question on the aspects that should receive higher priorities in order to improve
safety. The results, presented in Fig. 2.2 show that according to survey participants the higher priorities
should be (in decreasing order): Avoiding riding on sidewalks, Avoiding riding too fast or not paying
attention and Avoiding e-micromobiles and bikes not properly parked or laying down.
14Most relevant aspects to improve safety
Improve e-micromobility/bicycle lanes physical
separation from other vehicles lanes and sidewalks.
Improve capacity of e-micromobility/bicycle lanes in
congested areas.
Increase the density of e-micromobility/bicycle
lanes to reduce usage of street lanes primarily used
by faster vehicles (e.g. cars, trucks, buses).
Avoid e-micromobility vehicles and bicycles not
properly parked or laying down.
Avoid other vehicle drivers (e.g. cars, buses,
bicycles) riding too fast or not paying attention.
Avoid e-micromobility drivers riding too fast or not
paying attention
Avoid invasion of e-micromobility lanes by cars,
delivery vans or pedestrians.
Avoid e-micromobility vehicles riding on sidewalks
or other pedestrian reserved areas.
Larger/better vehicle wheels more adapted to
pavement imperfections, transitions, or slippery
conditions.
Better braking capability and/or smoother
acceleration control of e-micromobility vehicles.
E-micromobility vehicles robustness (e.g. strong
stem, wheels, or platform).
0% 10% 20% 30% 40% 50% 60%
Fig. 2.2 Survey percentage of answers to the question “what are the most relevant aspects to improve
the safety of micromobility?”
152.6 Accident causes analysis
From publications, reports and news compiled in the MOBY data base an exhaustive taxonomy of e-
kickscooters accident causes has been carried out and presented in Table 2.8.
Primary
Safety
cause Code E-scooter Incident/Accident Causes
Impact
V1 Stem detachment/breakdown *
V2 Brakes failure or insufficient braking capability
Vehicle V3 Bad acceleration control *
V4 Wheel too small/rigid to cope with pavement imperfections/transitions *
V5 Lack of vehicle visibility: to weak lights and/or lack of optical reflectors **
V6 Battery fire or explosion
V7 Other vehicle failures
D1 Lack of experience (first rides) **
D2 Inappropriate driver age ***
D3 Inappropriate speed ***
Driver D4 Driving on sidewalk or other pedestrian reserved areas ***
D5 Driving on unsuitable lane: fast or dense car traffic **
D6 2 (or more) passengers on vehicle *
D7 Driving distracted or using mobile phone / headphones **
D8 Losing control or falling down from vehicle ***
D9 Vehicle not properly parked or laying down
D10 Driving under influence of drugs or alcohol **
D11 Insufficient separation from other e-scooters or bikes (shared lane)
D12 Traffic signs or crossing priority not respected ******
D13 Other driver related cause
R1 Bump, Hole or Obstacle on pavement **
Road R2 Confusing Signalling
R3 Frozen or Slippery pavement
R4 Insufficient lane separation from other vehicles or pedestrians **
R5 Other road related cause
O1 Pedestrian invasion of e-scooter lane *
Other O2 Other vehicle invasion of e-scooter lane
actors O3 Other vehicle not respecting traffic signs or crossing priority ***
O4 e-scooter not seen and run over by faster/larger vehicle (car, bus, ...) **
O5 Other actor cause
Table 2.8 E-scooter causes of accidents grouped in Vehicle, Driver, Road and Other actors classes,
including the estimated safety impact from police survey results (Section 2.7).
16Causes have been grouped into 4 main types according to primary accident cause: Vehicle, Driver, Road
and Other actors.
2.7 The Police survey
Based on the identified accident causes, a survey asking about accident frequency estimation for each
cause and severity of typical injuries was addressed to Traffic Police departments of Israel, Munich and
Barcelona.
Munich, Barcelona and Israel provided statistical information. In addition, 22 experts on traffic accidents
investigation filled a questionnaire to determine the most frequent causes of e-micromobility accidents
and its severity.
After data processing, first the percentages of accidents caused by the four basic causes types estimated
by accident investigators were determined showing that slightly over one half of e-kickscooter accidents
are caused by vehicle Driver (56%). Vehicle (15%), Other actors (15%) and Road (14%) have similar
secondary incidences.
Zooming into accident cause detail in each class, the main Driver cause of accidents is Traffic signs and
priorities not being respected (18%), with a large difference from lower incidence causes such as Losing
control and falling down from vehicle (11%), Inappropriate driver age (11%) and Driving on sidewalks and
other pedestrian areas (10%). The rest of causes have slightly lower weights with the exception of
Insufficient separation from other e-scooters and bikes (3%) which has a lower impact on accident number.
The analysis of detailed vehicle causes show the most problematic aspects are: vehicle visibility in dark
conditions (27%) and wheel size and characteristics to cope with pavement imperfections and transitions
(27%). In lower priority, the survey identifies the stem detachment or breakdown (17%) and bad
acceleration control (15%).
Regarding Road causes, the survey shows that insufficient lane separation from other vehicles or
pedestrians (51%) is estimated to cause around one half of the accidents related to road design and
condition. In second position pavement imperfections such as holes, bumps or obstacles (29%) is
estimated to cause almost one third of the road related accidents.
In the case of Other actors, the results show two causes with similar over 30% weight: Other vehicles not
respecting traffic signs or crossing priority (36%) and e-kickscooters overrun by faster/larger vehicles (33%).
Invasion of e-scooter lanes by pedestrians (20%) is also a relevant cause of accidents.
The safety impact of each identified cause category on micromobility safety has been estimated according
to the product Accident Frequency x Injures Severity. In this survey, Severity has been obtained as an
average of the Maximum Abbreviated Injury Scale (MAIS) [12], assigned to the typical injuries associated
to each accident cause. The Abbreviated Injury Scale is 0 : No injury, 1: Minor Injury, 2: Moderate Injury,
3: Serious Injury, 4: Severe Injury, 5: Critical Injury, 6: Unrecoverable/Death. The Maximum Abbreviated
Injury Scale, often used to express the severity of traffic accidents, refers to the worst injury suffered by
the accidented person.
The resulting impact index normalized to a maximum value of 6 has been indicated with a number of
stars in the right column of Table 2.8. The highest safety impact, well above the rest, corresponds to e-
kickscooters drivers not respecting traffic signals and priorities. In second position of Safety Impact we
17found several causes: Driving with inappropriate age or speed, Driving on sidewalks, Losing vehicle control
and Falling and Other vehicles not respecting traffic signs and priorities. In third position the survey
identified Lack of vehicle visibility, Lack of driver experience, Driving on unsuitable lane (fast or dense car
traffic), Driving distracted or using mobile/headphones or Driving under the influence of alcohol, Pavement
imperfections, Insufficient lane separation from other vehicles or pedestrians and Vehicle not seen and run
over by larger vehicles. These impact levels are important to prioritize safety improvement efforts
addressing risks and hazards with higher costs due to higher probability and injuries’ severity.
The survey included a question on the urban areas showing a higher accident frequency. Crossings
between micromobility lanes and conventional street car lanes (35%) was identified as the most frequent
location of accidents. In second position with similar safety incidence the survey identifies Sidewalks and
Crossings between micromobility lanes and pedestrians (23%) and Pedestrian reserved areas (23%) appear
to be also problematic. In lower positions appear Pedestrian zones (15%) and Conventional vehicles lanes
(4%).
Finally, the traffic investigation experts were asked to prioritise on different options proposed for
micromobility safety improvement. The results are consistent with the aforementioned causes and
estimated safety impacts bringing additional information. The first identified priority is the obligation of
wearing a helmet (12%), which is coherent with the high frequency of head/face injuries analysed in
Section 2.4. The second priority is Providing additional segregated lanes for e-micromobility (bicycles, e-
scooters, etc.) (10%) which is related to priority on improving separation and protection of these lanes
(7%). In fact, several high safety impact causes, such as, Riding on sidewalks or Driving on fast/dense traffic
roads, are in most cases a consequence of the lack of segregated/protected micromobility lanes.
Other high priority improvements are addressed to increase both Vehicle and Driver visibility in dark
conditions (9%), by using more intense lights, larger optical reflectors and using reflective clothing by
drivers (9%). Complementary aspects with moderate priority are: additional driver body protection
measures (8%), beginner drivers training (7%), vehicle insurance and identification plates (7%) and
better/larger vehicle wheels with improved tolerance to surface imperfections/transitions (6%). Additional
8 proposed improvements referring to vehicle, lanes and regulations were considered less relevant.
As additional safety improvements, which were not included in the questionnaire, the traffic accident
experts suggested: Enforcement of e-rider behaviours since frequently they do not follow traffic rules and
requiring passing traffic rules test for drivers without driving license.
2.8 The MOBY Workshop in European City Dialogue Safety Poll
On November 12th 2020, UnternhmerTUM and Roland Berger firms organised the European City Dialogue
Day on Micromobility in Mediatech Hub Conference Facilities in Potsdam (Germany). A general
micromobility presentation was followed by three workshops, one of them dedicated to present MOBY
Project outcomes on Safety, Intermodality, Accessibility, Environmental issues and Sustainability. Due to
COVID-19 restrictions, the conference participation was mostly on-line. The Micromobility plenary
session attracted a large attendance of professionals with 70 participants. The MOBY workshop achieved
the maximum capacity of 25 participants, which was limited to facilitate interaction and topic discussion.
Several safety aspects, which are often under discussion, were presented and the audience was invited
to vote among different options which are reproduced below. The discussed and voted topics involved
Helmet and reflective clothing usage, Lanes infrastructure, Insurance, Training and Regulations knowledge
and harmonisation.
18There is a strong consensus on the benefits of using helmets and other protection measures like reflective
clothing. However, there are arguments in favour or against making such use compulsory, considering
that it may limit the transition to micromobility from cars or motorcycles. The option of information
campaign is an alternative. Anyway, the most effective option to enhance urban safety may be culture
depending and also influenced by the balance between users of sharing services with respect to users
owning a vehicle. In the workshop most attendants voted for the Information Campaign (60%) option, the
other 3 options: Compulsory helmets, Compulsory helmets and reflective clothing and Other received the
remaining 40% of votes with equal share.
Several options of urban infrastructure were presented with examples, including segregated lanes with
different degrees of protection, reducing the maximum speed of cars, buses, etc., to allow to share road
lanes with bicycles and e-scooters, and creating additional lanes with superstructures and micromobility
highways. Most of attendants voted for the option of deploy More and improved bicycle lanes (73%).
Building micromobility highways (20%) was considered with substantial lower priority and the less
preferred option was Sharing the road with heavier traffic with reduced speed to 30 km/h maximum (7%).
E-scooters are electrically powered vehicles and the need of having an insurance to cover personal and
other vehicles’ and pedestrian injuries in case of accident is gaining acceptation, in spite that in most
regulations it is not required yet. Different insurance options were discussed and voted. The most
preferred option was to include the micromobility insurance as an extension supplement of existing
insurance policies such as house or conventional vehicle (53%), specific insurance obtained 27% votes and
20% voted that insurance should not be required.
Safety statistics shows that training of new users will reduce micromobility accidents. For this reason,
several training options were discussed. A majority of attendants favoured the provision of training
facilities by sharing companies (40%). However, this does not help users that own their vehicles. Including
e-scooter training at school age will make sense, if the mobility share of e-kickscooters increases in the
coming years, 33% of the participants opined that was the best option. The option of a Public offer of
training facilities received 13% of votes.
The final discussion addressed the evolution of present regulations which are not known by a large
percentage of users. In this context the existing regulatory diversity at country and city levels does not
help a more widespread regulatory knowledge. After discussing different options 47% of participants
voted for stablishing a Common European micromobility regulation, 40% voted for a Common European
regulatory framework allowing for certain flexibility in the implementation depending on every
city/country specific needs. The rest of participants (13%) preferred a Location-specific regulation.
2.9 Accident hazards mitigation using Intelligent
Transportation Systems (ITS)
Over the last decade, the automotive market has witnessed remarkable developments in the vehicle
safety domain. Vehicle safety systems have evolved from passive and active safety systems to Advanced
Driver Assistance Systems (ADAS), which either alert the driver or intervene in order to avoid imminent
collisions. These safety systems are, nowadays, evolving in two further directions. The first one is how
they can be applied to smaller and more vulnerable vehicles as bikes or scooters, both mechanical- and
electrical-powered, adding accelerometer sensors and micro-cameras to accurately perceive the
surrounding environment and position systems as GPS (Global Positioning System) or Galileo to locate
itself in the road. The second new evolution trend is introducing direct communications between vehicles
19(Vehicle to Vehicle - V2V) and between vehicles and computers deployed in the fixed infrastructure that
execute software to improve safety (Vehicle to Infrastructure - V2I), in general they will be able to perform
Vehicle to Everything (V2X) (Fig. 2.3). These V2X communications solutions also called Cooperative
Intelligent Transport Systems (C-ITS) will complement vehicle's perception sensors and play a significant
role in detecting and communicating information about potential hazards to pedestrians and vulnerable
road users, thereby mitigating the danger of imminent collisions.
Fig. 2.3 Types of V2X communications. Sources: Qualcom, U-blox.
The intention of the C-ITS community is, using the physical infrastructure plus these messages, to develop
new safety and management services whose complexity will evolve according to the network capabilities.
The information that devices interchange varies from very basic messages containing the position and
speed of the vehicle, to much more complex messages that can contain vehicle's trajectories and
coordinated actions between them. With these messages, it is possible to develop numerous safety and
traffic management applications and services as detection of collision trajectories, notification of road
events (roadworks, obstacles on the road, surface condition, etc.), advising the optimal speed to reach
traffic lights when they are in green.
To achieve communication interoperability among implementations of different manufacturers,
standardization has an important role. The European Telecommunications Standards Institute (ETSI)
Technical Committee (TC) on the ITS and its counterpart in the United States Society of Automotive
Engineers (SAE) have developed standards for C-ITS applications, focusing on protocols supporting
applications on the vehicle side. Moreover, they also have performed a thoughtful analysis on which are
the causes of e-micromobility accidents and how they could be avoided or mitigated by means of C-ITS
services using V2V and/or V2I communications. The approach comprises two phases, the first one is to
make the system aware of the hazard using V2X messages and the second is to apply actions to avoid or
mitigate the accident. Focussing on e-scooters, the actions that can be applied are also two. The most
basic is to warn the driver using sounds directly emitted from the e-scooter. It is possible to use different
sounds for different kind of situations or hazards. The second kind of actions are related with the main
controller board of the e-scooter which is in charge of managing the speed, lights and, possibly, the brake.
In this way, it would be possibly, to automatically modify the maximum speed, brake, accelerate and
switch lights on or off.
203 Impact assessment of urban
infrastructures on e-
micromobility safety
3.1 Urban space design
In an urban context, space and streets design must meet the needs of people walking, driving, cycling,
allowing vehicles transit. Encouraging micromobility as an efficient and attractive mode of transportation
requires the provision of safe and continuous transitable facilities. Since e-kickscooters and bicycles are
single user vehicles and have similar speeds, they can be accommodated in the same micromobility lane
designs [34]. Therefore, the wide experience that some countries like the Netherlands and Denmark have
in designing cyclable lanes and infrastructures can be applied to the design of micromobility lane
infrastructure in general. Cities that have invested in cycling lanes have seen congestion levels decline
and streets become safer for all users.
While cyclists and e-scooter riders can share the road with motor vehicles on quiet streets with low
speeds, navigating larger streets and intersections requires dedicated facilities. Urban design should
include safe and comprehensive cycle/micromobility networks for riders of all ages and abilities. High-
volume corridors should provide wider cycle facilities to carry larger volumes. The design of cycle
networks should consider safety, capacity, and connectivity for all riders. Design should consider future
capacity and mode share goals rather than present-day demands.
3.1.1 Micromobility / Cyclable lane options
A shared street is a low-speed, typically curbless roadway designed as a single surface shared among
pedestrians, bicyclists, and low-speed motor vehicles, see Fig. 3.1. Typically employed on low-vehicle-
volume and/or high-pedestrian-volume streets, vehicles are slowed to very low speeds through a reduced
speed limit, traffic calming, signage, and use of distinctive materials, furnishings, and other visual cues in
the roadway that encourage drivers to travel with increased caution.
A safer alternative for busy streets is the provision of a separated lane. There are several options to
provide micromobility lane separation from heavier vehicles traffic. The simple low-cost way consists on
an unprotected lane based on a painting marking of dividing line and in some cases based on a vivid colour
pavement in the micromobility lane usually dark red, blue or green, to make a clear distinction from the
usual grey/black asphalt surface. However, this lane offers no physical protection against heavier vehicles
invasion. Better options consist in adding some kind of barrier blocking more effectively against lane
invasion, resulting in a protected lane, several options of barrier include plastic posts, curbs, bollards,
planters, parked cars or elevated paths [35]. A representative example is shown in Fig. 3.2.
An alternative known as Cycle Boulevard are quiet streets that accommodate high cycle flows and are
accompanied by very low motorized traffic.
21Fig. 3.1 Shared road with 30 km/h limitation. Barcelona City Council. Sants Hostafrancs
Fig. 3.2 Protected bicycle lane in Koningsweg ’s-Hertogenbosch. From BicycleDutch
Protecting the micromobility lane from conventional motorized traffic has an important side-effect
benefitting safety. It has been stated that the number of micromobility riders using sidewalks decreases
drastically as a function of protection against heavier vehicles. According to a report from Portland,
Oregon (US) [36], the percentages of e-kickscooter invasion of sidewalks was 39% in the case of absence
of bike lanes, 21% in the case of unprotected bike lane, 8% in the case of protected bike lane and 0% in
the case of bicycle boulevard. Being the micromobility traffic on sidewalks one of the dominant factors
on both factual and perceived safety degradation, the benefit of using protected lane designs is double,
since it reduces accidents involving larger vehicles and accidents involving pedestrians.
3.1.2 Crossing designs
As seen in Section 2, crossings and intersections are accidents black spots. For this reason, it is advisable
to adopt designs that provide some degree of protection and physical separation between micromobiles,
larger vehicles and pedestrians. The protected intersection [35] continues the physical separation of
cycle facilities, positioning cyclists prominently ahead of right-turn conflicts and creating safe, simple
22cyclist movements through intersections. Conflict with motor vehicles are prevented by curb barriers and
corner refuge islands. The speed of cyclists is reduced and they are better seen by drivers of larger turning
vehicles. Pedestrians are also benefited from this design with more waiting space and protection. A
recognised example is the Dutch Protected Crossing [37] shown in Fig. 3.3.
Fig. 3.3 The Dutch protected intersection, from P.Rouzeau, “Protected Crossing” [37]
3.1.3 Superblocks model
The Superblock is a new model of mobility that restructures the typical urban road network. With its
implementation, Superblocks provide solutions to the main problems of urban mobility and improves
both the availability and quality of the public space for pedestrian traffic. In order to achieve these goals
for mobility, two fundamental changes must be made: modification to the basic road network and the
establishment of differentiated routes for each mode of transport.
In Barcelona, Superblocks are made up of a grid of basic roads forming a polygon (Fig. 3.4), some 400 by
400 meters, with both interior and exterior components. The interior (intervía) is closed to motorized
23vehicles and above ground parking, and gives preference to pedestrian traffic in the public space. Though
the inner streets are generally reserved for pedestrians, they can be used by residential traffic, services,
emergency vehicles, and loading/unloading vehicles under special circumstances. The perimeter, or
exterior, of Superblocks is where motorized traffic circulates, and makes up the basic roads.
Fig. 3.4 The Barcelona Superblock model
The Superblock is a new option to the use of public space, uniting urban planning with micromobility and
limiting the presence of private vehicles in order to return the public space to the citizen. In the structure
of the Superblock, each grid section has universal accessibility, there is increased safety due to a 10 km/hr
speed limit.
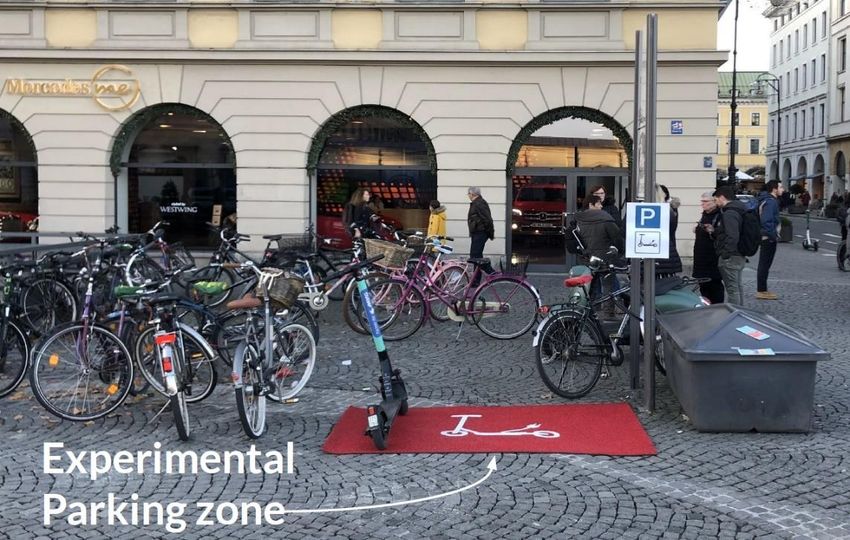
3.1.4 Bicycle/Micromobility new structural designs
Conventional designs for micromobility lanes are based on redistributing streets surface. This results in
decreasing either conventional vehicles o pedestrian areas or both. A new emerging option to provide
micromobility lanes is to use 3D space based on original structural designs. In terms of safety these
options are ideal since they provide complete separation from heavy vehicles and sidewalks. Fig. 3.5
shows a representative example from Copenhagen where cycling is a preferred mobility choice.
3.1.5 Micromobility Charging stations
Recharging of shared e-kickscooters was initially carried out by transporting the vehicles to charging
facilities, which created urban traffic and pollution overheads. To reduce cost and improve sustainability
and environmental impact, charging operations are evolving towards battery swap. A better option would
be installing charging stations, avoiding in this case transporting vehicles or batteries to charging facilities.
This does not mean necessarily move from present “dockless” services to a fully docked concept, since a
charge provides energy for tens of typical 1-kilometer rides. This concept is presently in pilot studies
stage. Bird e-scooter sharing operator, has installed charging stations in Tel Aviv [38]. The stations operate
in parallel to conventional vehicle transport to charging points, often provided by collaborator citizens. In
24You can also read