Longer Term Investments - Smart mobility - UBS
←
→
Page content transcription
If your browser does not render page correctly, please read the page content below
Longer Term Investments
Smart mobility
Chief Investment Office GWM | 11 March 2019 12:26 pm GMT
Rolf Ganter, CFA, Analyst; Carl Berrisford, Analyst; Kevin Dennean, CFA, Technology & Communication Services Analyst Americas, kevin.dennean@ubs.com;
Sally Dessloch, Consumer Staples Analyst Americas, sally.dessloch@ubs.com

  • Smart mobility is set for take-off. Regulatory changes and
    technological advances will lead to greater electrification
    of cars, autonomous driving and new car-sharing mobility
    concepts. This will reshape the way we experience and use
    individual mobility.
  • By 2025, we believe the annual addressable market of our
    theme will be around USD 400bn, or 8-9 times today's size.
  • We see opportunities in electronics and electric components
    related to electrification and autonomous driving. We think
    car-sharing concepts are best approached through private
    equity at this stage.
  • We recommend exposure through a broadly diversified stock
    selection to minimize company- and technology-specific risks.
    We also advise revisiting single automotive-related stock
    holdings as the way we look at them in a smart mobility world
    will change.

Our view
We define smart mobility as a combination of smart powertrains
(electrification), smart technology (autonomous driving) and smart car
use (car-sharing/car-hailing). Urbanization is the main driver and an
aging and growing population a supporting factor with higher safety,
better fuel efficiency and lower emissions playing to our theme.
Over the next decade, we expect smart mobility to grow significantly,
revolutionizing not only the car industry but also the way that
cars are used. More favorable regulation, which supports alternative
powertrains, and new smart use / mobility concepts, should help.
Rapid technological progress and a change in consumer behavior in
which the use of the asset is more important than ownership of the
asset support our smart mobility theme.
By 2025 we think the annual addressable market of our theme
will be around USD 400bn, or 8-9 times the size it is today,
offering substantial business opportunities. Electronics and electric
components related to electrification and autonomous driving are the
near-term drivers of our theme. Car-sharing concepts, including fleet
management will increase in importance. However, only the broad-
based adoption of robotaxis beyond 2025, leading to a peak in annual
car sales shortly thereafter, will ensure 100% of revenues end up in
the hands of the operators.

This report has been prepared by UBS Switzerland AG and UBS AG and UBS Financial Services Inc. (UBS FS). Please see important disclaimers and disclosures at the end of the
document.
Longer Term Investments

The combination of more favorable regulation, falling costs and                 Individual sub-chapters of this report
technological advances make smart mobility attractive for investors              •       Smart mobility drivers
with a long-term focus, as the theme is cyclical in nature. We expect
                                                                                 •       The smart mobility market
our theme to outperform the wider market and recommend exposure
                                                                                 •       Key messages of smart mobility
to smart mobility through a broadly diversified stock selection to
                                                                                 •       Electrification
minimize company- and technology-specific risks
                                                                                 •       Autonomous driving (ADAS)
                                                                                 •       Car-sharing concepts
Smart mobility drivers                                                           •       Earnings growth outlook
                                                                                 •       Link to sustainable investing
Modern society has long aspired to the individual freedom offered up             •       Link to impact investing and UN SDGs
by the car. But while that concept of freedom endures, structural,               •       Investment conclusion
technological changes based on electrification, autonomous driving,              •       Risks
and car-sharing concepts, which collectively make up our definition of           •       Comments regarding our reference list
smart mobility, will challenge how we “consume” mobility in the
                                                                                 •       Appendix 1: Car-sharing concepts – Frequently
future. Urbanization is the main long-term driver of our smart                           asked questions (FAQ)
mobility theme, with aging and population growth supporting
factors (see Figs. 1–3). A drive toward better safety, improved fuel
                                                                                 • Appendix 2: Smart Mobility: impact on
                                                                                         automotive suppliers, car dealers, repair shops
efficiency, lower emissions, the rise of millennials, and increasing
                                                                                         and other industries and sectors
mobile connectivity will all be supportive of this theme
                                                                                Fig. 1: World population (in billions, 1950–
Looking at the technological drivers of smart mobility, electrification is      2050)
increasingly gaining acceptance among governments and consumers
                                                                                Less-developed countries fuelling growth
alike. Costs, however, remain the biggest hurdle, though UBS’s recent
tear-down of a Tesla Model 3 proves the cost and technological                    12

progress the electric powertrain makes. In our view, regulatory change            10

and steeper cost reduction will trigger a faster rollout of electrified
                                                                                     8
powertrains than currently expected by the market. However, adequate
charging and power infrastructure is also needed. Autonomous                         6

driving with vehicles employing a wide range of electronics, sensors,
                                                                                     4
increased connectivity, and vehicle-to-vehicle (V2V) and vehicle-to-
infrastructure (V2I) communications will change the car and the way                  2

we drive forever. Finally, using a car does not mean owning it – car-                0

sharing concepts will change the way automobiles are “consumed.”                      1950     1960     1970     1980   1990       2000       2010      2020      2030        2040     2050

                                                                                                         World      More developed regions           Less developed regions

Whether car sharing will catalyze the migration to electric vehicles (EV)       Source: United Nations, Department of Economic and Social Affairs,
or new energy vehicles (NEV), or whether such vehicles will catalyze the        Population Division (2018 revision); Note: including long-term forecasts
migration to car sharing, is debatable. However, what is indisputable is
                                                                                Fig. 2: World urban and rural population (in
that the rise in car sharing – especially “robotaxis” if they are adopted
                                                                                billions, 1950–2050)
on a mass scale – could offer shorter investment payback periods
                                                                                By 2050, a majority of the world's population
through higher utilization. This makes car sharing an attractive option
                                                                                will live in urban areas
for consumers and an interesting business opportunity for companies.
                                                                                 8
Electrification, autonomous driving, and car sharing form our
                                                                                 7
smart mobility theme.
                                                                                 6
                                                                                                                                                                                     Urban-Rural
Urbanization supports car sharing and autonomous driving                         5                                                                                                   Population
                                                                                                                                                                                        Gap

Urbanization and the need to get around often leads to congestion in             4

existing infrastructure. Autonomous technology will help reduce                  3

congestion and the loss of both time and energy (such as gas and                 2

diesel; see Sustainable Investment aspects below). In many areas, roads          1

and parking spaces are stressed to the limit. While the need for                 0
mobility will not go away, the usage of vehicles – rather than their              1950       1960     1970   1980   1990    2000       2010     2020      2030      2040      2050

                                                                                                                               Rural      Urban
ownership – will come into focus. And while "sharing economy"
                                                                                Source: United Nations, Department of Economic and Social Affairs,
business models are often identified with millennials, they are attractive      Population Division (2018 revision); Note: including long-term forecasts
to other generations too. House-sharing (e.g. via AirBnB) is well
established; for cars, we believe it is still in its infancy. Cars in general

                                                                                                                                                                                                   2
Longer Term Investments

are an underutilized asset, with an average utilization of around 4% at
                                                                              Box 1: Definitions for car electrification:
any given time; this supports the case for car sharing (which is not the
same as sharing a trip in the same car). That said, autos are an              a) BEV (battery electric vehicle): Propelled
emotional and prestige product and rarely bought on economic                  purely via electric power stored in a battery and
grounds alone. Hence, a fundamental change in the current auto-               converted into mechanical power by means of an
usage model, including mass adoption of car sharing and so-called             electric motor. BEVs are charged externally (with a
robotaxis will happen – but only over time. But mobility needs will           power cord) and through regenerative braking,
continue to increase, and a slowly but surely growing fleet of robotaxis
                                                                              i.e. the electric engine serving as a generator
will gradually reduce the overall number of individual cars sold. As a
                                                                              during the braking phase, charging the battery.
result, we believe annual global car sales will peak around 2026-2028.
Furthermore, the concepts of autonomous driving and car sharing may           b) PHEV (plug-in hybrid vehicle): Can be driven
diverge greatly, not only by region, but also between urban and rural         on both purely electric power or fossil fuel power
areas. But change has begun and we expect mobility as a service               (gasoline or diesel). This vehicle's powertrain
(MaaS) to gain in importance.                                                 contains both an e-motor and a battery that can
                                                                              be externally charged, and an internal combustion
Aging society supports car sharing and autonomous driving                     engine (ICE) that burns fuel to propel the car.
In an aging society, autonomous or automated driving will allow the           PHEVs typically have a pure electric range of 30–
elderly to maintain their mobility. A key long-term driver that supports      50km, lower than the ranges for a BEV.
this trend is the higher purchasing power of this age cohort. That said,
car-sharing concepts also offer mobility for the less wealthy, as they        c) EV (BEV & PHEV): All plug-in electric cars.
allow people to pay for the usage of MaaS rather than the upfront cost        d) New energy vehicles (NEV): China’s
of owning a car.                                                              definition for battery electric and plug-in hybrid
                                                                              vehicles (equal to EV definition above).
Sustainable investment aspects: Improved safety, better fuel
efficiency, lower emissions, greater inclusion and more green                 e) FCV (fuel cell vehicle): Propelled by an
spaces                                                                        electric motor (like an EV), but uses power
There is an increasing awareness in both developing and developed             generated from hydrogen as fuel rather than
societies that changes in car usage are needed. This growing                  power stored in a battery. An FCV carries
awareness of environmental, health and safety concerns has been               compressed hydrogen gas in a tank and employs
around long before the Volkswagen diesel scandal broke in 2015.               a fuel cell to ultimately convert the hydrogen gas
                                                                              into electricity.
A broad-based adoption of autonomous features, including artificial
                                                                              f) HEV (full hybrid vehicle): Like a PHEV, it
intelligence, could make driving both safer and more environmentally
                                                                              carries two powertrains (electric, including battery
friendly. It may also lead to fewer and less deadly road-traffic accidents
                                                                              and e-motor, and ICE). In contrast to PHEVs, the
and a reduction in traffic-related deaths. According to the World
                                                                              battery cannot be charged externally. The battery
Health Organization, in 2016, more than 1.3 million people died in
                                                                              is recharged only through regenerative braking.
traffic accidents worldwide – i.e. more than 3,000 per day – and 20-50
                                                                              The pure electric range is lower than that for
million people were at least temporarily incapacitated. As objective
                                                                              BEVs/PHEVs. HEVs typically use electric power at
algorithms overrule individual egos, the flow of traffic would be more
fluid, potentially reducing traffic jams and improving fuel efficiency per    steady speeds and for acceleration to save fuel.
mile traveled.                                                                g) 12 & 48 Volt mild hybrid: Smaller electric
                                                                              engine used as a booster during the acceleration
We see an increasing trend toward electrification in cars (see Box 1 for      phase. The 48-Volt system contains an extra 48-
definitions and Fig. 4). We estimate that by 2025, around 25% of new          Volt battery. Both systems can also be used to
vehicles sold globally could be electrified, with at least 10% being          power e.g. an electric turbocharger, and are not
battery electric and the rest plug-in and full hybrids. This is certainly     externally charged, but recharged via regenerative
more demanding than the International Energy Agency's (IEA) base              braking.
case, which believes in a EV share of 13% by 2030 (pls see “Our
energy future: How will electric vehicles affect global energy demand”,       h) Internal combustion engine (ICE): Traditional
published 24 September 2018). A wide-ranging rollout of 12 & 48 volt          gasoline or diesel powered.
mild-hybrid vehicles is not factored into our figure, which could            Source: UBS
become standard for another 20-25% of all global new car sales, in
our view. All this means that local emissions will be reduced, even if
greenhouse gas (CO2) emissions remain dependent on the way
electricity is produced. In our view, health issues and deaths caused by
pollution (from nitrogen oxides and particulates, among others) should
fall rapidly over time.

                                                                                                                                     3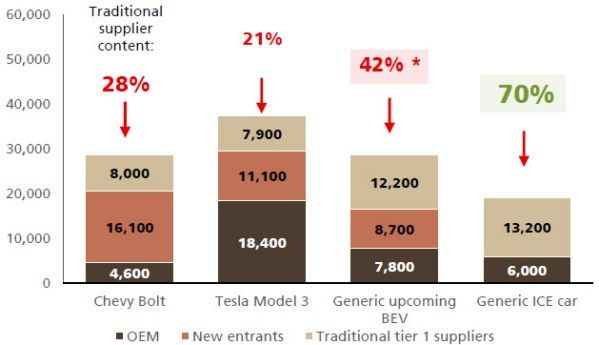
Longer Term Investments
Car-sharing concepts will also enable greater social inclusion by making Fig. 3: Aging (1955–2050)
mobility available to people who do not have, or cannot afford, their Average life expectancy at birth (in years)
own vehicles. And because roads and parking spaces use up 15–20%
of city space, car sharing should reduce congestion given fewer vehicles
on the road and consequently less parking and road space needed. This 90
should contribute to the greening of “smart” cities. 80
70
The smart mobility market 60
50
This year, we expect around 96 million vehicles to be sold globally, 40
representing a market in excess of USD 1.5 trillion a year. Assuming a
30
2% growth rate in car demand (below its 20-year historical average of
1955
1960
1965
1970
1975
1980
1985
1990
1995
2000
2005
2010
2015
2020 est.
2025 est.
2030 est.
2035 est.
2040 est.
2045 est.
2050 est.
3% to reflect slightly slower vehicle growth than previously assumed), World Africa Asia Europe Latin America and the Caribbean Northern America
unit sales could increase to 110 million in 2025, driven by demand from
Source: United Nations (UN) Population and Aging Database 2017,
emerging economies. Beyond 2026, we think we'll start to see the UBS; Note: including long-term forecasts
rollout of robotaxis, but even in 2030 around 90 million ex-robotaxi cars
will be sold (see Fig. 5). Note that at this stage our theme’s focus is on
vehicles that provide individual mobility; it excludes commercial vehicles
Fig. 4: Powertrain mix shift ahead
such as heavy trucks, buses and vans which would add another lucrative
Traditional gasoline and diesel down, 12 & 48
dimension to this theme.
Volt (mild) hybrids and electric vehicles up
110
Given this large addressable market for individual mobility, the long-term 100
90
success of our smart mobility theme depends on the regulatory 80
environment, the technology deployed and the costs these changes 70
60
entail. We are confident, however, that the trend toward smart mobility 50
is overwhelming and, based on technological advances, may advance 40
30
faster than currently assumed. The individual components and 20
technologies behind our smart mobility theme are strongly interlinked. 10
0
We estimate that by 2025 the overall annual addressable market of our 2012 2013 2014 2015 2016 2017 2018E 2019E 2020E 2021E 2022E 2023E 2024E 2025E
Gasoline 48V/mild hybrid (gas) Diesel HEV PHEV BEV FCV
theme could be around USD 400 billion (see Fig. 6), i.e. about 8-9
times larger than it is today. We also made the following assumptions for
market size, adjusted from our original October 2017 estimates, Source: UBS as of November 2018
Note: HEV = (Full) hybrid electric vehicles; PHEV = Plug-in hybrid
consistent with slower market growth: electric vehicles; BEV = Battery electric vehicles; FCV = Fuel cell
• Electrification – powertrain for suppliers: USD 70-100 billion (from vehicles; 48V/mild hybrid (gas) = gasoline engines combined with 12 &
48 Volt mild-hybrid systems
around USD 5 billion today), with the traditional supply chain at risk of
losing USD 65–130 billion. Electrification will cannibalize traditional
internal combustion engines (ICE). A faster rollout of battery electric at Fig. 5: Robotaxis impact car sales
the expense of plug-in hybrids would result in the higher end of the Traditional car sales will peak around 2026-2028
potential loss for traditional powertrain suppliers (see also Appendix 2 and likely to shrink thereafter (in million units)
for the impact). This is because plug-in hybrids still contain an ICE and,
hence, even more ICE would be replaced (see Fig. 6).
• Electrification – battery value chain: USD 80-175 billion (from
low-double-digit USD billions today), which includes not only the
battery cells, but the whole battery pack.
• Autonomous driving: USD 90 billion (increasing some fourfold
from current ADAS = advanced driver assistance system market
value).
• Car-sharing/car-hailing – fleet and platform: we estimate current gross
revenues of approximately USD 50-70 billion, of which 20–30% ends
up with the ride hailers (i.e. with the car-sharing, car-hailing Source: UBS, as of October 2018
Note: ADAS levels = advanced driver assistance systems = autonomous
businesses), translating into USD 10-15 billion currently. The driving levels, tiered from level 0 (no automation) to level 5 (full
remainder (70–80%) ends up in the hands of the drivers. Based on automation)
current growth rates, we believe the car-sharing, car-hailing
businesses will see an increasing share of revenues, or some USD 85–
105 billion by 2025. Only in a “robotaxi” world would 100% of
revenues end up in the hands of the car-sharing concepts. We expect
this from 2025 onwards.
4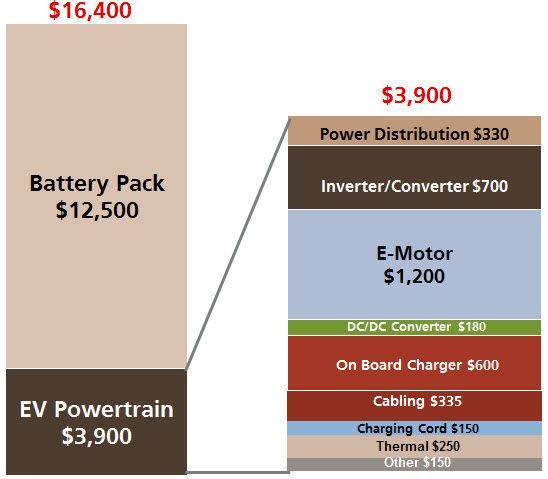
Longer Term Investments

While the value we see in the smart mobility market remains                    Fig. 6: Smart mobility addressable market
unchanged, at USD 400 billion by 2025, we have revised the value of            By 2025, smart mobility should be a USD 400
the individual sub-categories compared with our initial October 2017           billion annual market
publication. We reduced our estimate for the size of the global car                                                                          Slow battery-
                                                                                                                                             electric rollout,
                                                                                                                                                                       Faster battery-
                                                                                                                                                                       electric rollout,

market in 2025 from 120 million to 110 million vehicles. The lower             in USD bn in 2025
                                                                                                                                             high plug-in
                                                                                                                                             hybrid share
                                                                                                                                                                       low plug-in
                                                                                                                                                                       hybrid share

figures for Electrification are mainly due to a faster decline in costs,       Powertrain suppliers        Battery electric vehicles (BEV)                 30-35                     60-65
especially for batteries (see Fig. 7). However, this should be supportive                                  Plug-in hybrids (PHEV)                          25-30                        15
                                                                                                           Full hybrid (HEV)                                 6-7                       6-7
of sales volumes of electrified vehicles, which may lead to stronger                                       12 & 48 Volt mild-hybrid                        10-15                     10-15
                                                                                                           gaining                                         70-85                    90-100
growth rates than shown in Fig. 8. We show separately the market for                                       losing                                                -65                   -130

full hybrid (HEV) vehicles (see Fig. 6). We increased the Autonomous           Battery value chain         Battery electric vehicles (BEV)                 60-80                   120-160

Driving market from USD 70 billion to USD 90 billion, driven by our                                        Plug-in hybrids (PHEV)
                                                                                                           Full hybrid (HEV)
                                                                                                                                                           15-20
                                                                                                                                                               3
                                                                                                                                                                                       8-9
                                                                                                                                                                                         3
belief that Level 3 “conditional automation” will see strong demand                                        12 & 48 Volt mild-hybrid                          3-4                       3-4
                                                                                                           gaining                                        80-105                   130-175
from consumers. And we increased the minimum market size for car-
                                                                               Autonomous Driving          ADAS                                                  90                        90
sharing/car-hailing as we believe this concept will gain in stature, driven
by the growth rates displayed by the current market players.                   Car-sharing / Car-hailing   Fleet and platform                             85-105                    85-105

                                                                               Smart Mobilty total                                                      325-385                    395-470

                                                                               Source: UBS estimates November 2018; car-sharing/car-hailing
Key messages of smart mobility                                                 numbers based on Goldman Sachs, September 2017 and UBS
                                                                               estimates November 2018.
                                                                               Note 1: ADAS = advanced driver assistance systems
Electrification                                                                Note 2: Slow-battery rollout assumes 10% battery electric, 10% plug-
                                                                               in hybrid and 5% full hybrid vehicles by 2025. The faster battery
The rollout of electrification is underway. We expect growth to be             electric rollout assumes 20% battery electric and 5% full hybrid, but
exponential rather than linear from 2020 onwards. We think that by             only 5% plug-in hybrids by 2025
                                                                               Note 3: Our market estimates are rounded.
2025 around 25% of new cars could be electrified, of which at least
10% will be battery powered full-electric vehicles and the rest plug-in
and full hybrids. We also expect a further 20–25% of mild hybrids              Fig. 7: Electric cars – battery cost will be key
based on 12 & 48 volt technology. This creates long-term business              and might fall faster than expected
opportunities. (see Figs. 4 and 8)                                             Tesla Model 3 at USD 178 per kWh - a two year
                                                                               faster drop in battery prices, in USD per kWh
Autonomous driving (ADAS)
Autonomous driving is tiered from levels 0 (zero automation) to 5 (full
automation). We believe that over the next 10 years, most new cars
will reach level 2 to 3, with level 3 (“hands-off”) in particular
(conditional automation) offering profitable opportunities for
companies. To quote Daimler’s head of R&D, "horsepower is being
replaced by the speed of semiconductor chips." Semiconductors and
sensors are key for autonomous driving. As an aside, they collect a vast
amount of potentially lucrative data over time. (see Fig. 9)                   Source: UBS, as of 15. August 2018

Car-sharing concepts
The combination of electrification, autonomous driving, and
connectivity will play a major role in increasing shared mobility as a           Box 2: Car hailing vs car sharing definition:
service model (MaaS), with autonomous driving being the ultimate
                                                                                 Car hailing = Chauffeured services like Uber,
trigger. It is debatable if sharing catalyzes the migration to EV/NEV, or if
                                                                                               Lyft
EV/NEV catalyzes the migration to car sharing, but increased utilization
                                                                                 Car sharing = Sharing with other
of car-sharing concepts (car sharing and car hailing) and ultimately                           drivers/owners i.e. pooling cars
robotaxis should lead to lower costs to the consumer and generate a                            like Mobility in Switzerland, so
viable business model for providers. (see Fig. 5, and Box 2)                                   far car2go (Daimler) and
                                                                                               DriveNow/ ReachNow (BMW),
Our theme focuses on the whole smart mobility value chain, with a                              which combined now as SHARE
strong emphasis on electronics and electric components related to                              NOW
electrification and autonomous driving which will ultimately also power          Robotaxi = fully autonomous, driverless
car-sharing concepts (see Fig. 10). In the following chapters, we                              vehicle
address these individual sub-categories.
                                                                               Source: UBS

                                                                                                                                                                                                5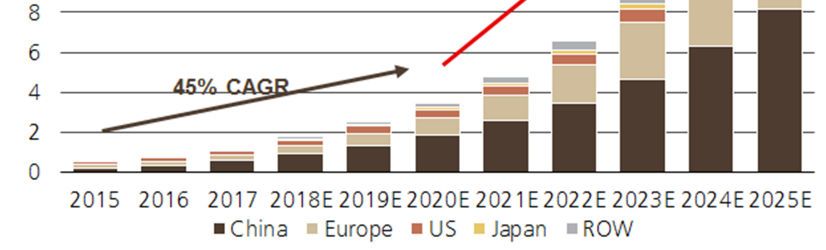
Longer Term Investments

Electrification
                                                                               Fig. 8: Electrified cars – strong growth
The rollout of electrification is underway. We expect growth to be
                                                                               driven by China and Europe
exponential rather than linear from 2020 onwards. We think that by
                                                                               Annual vehicle sales (in million units)
2025 around 25% of new cars could be electrified, of which at least
10% will be battery powered full-electric vehicles with the remainder
plug-in and full hybrids. We also expect a further 20–25% of mild
hybrids based on 12 & 48 volt technology. This creates long-term
business opportunities. (see Figs. 4 and 8)

Current stance
Since 2006, we have seen a 30–40% improvement in fuel economy.
However, current combustion engine technology has its limits, with
only around 2% further annual improvements possible, as the low-
hanging fruits of efficiency gains driven by direct injection,
turbocharging, downsizing, gear-box optimization, axle-drive ratio etc.
                                                                               Source: UBS, as of October 2018; Note: chart includes battery electric,
have been reached. In our view, tougher regulation to reduce CO2               plug-in hybrids and fuel-cell, but excludes full and mild hybrid vehicles
emissions and fuel consumption will lead to a significant increase in the
electrification of powertrains. These will take the form of full hybrid,
plug-in hybrid, and battery electric vehicles, be it battery or potentially
even fuel-cell powered (together, alternative powertrains).
                                                                               Fig. 9: Autonomous driving penetration
Based on the latest data from the European Automobile Manufacturers
                                                                               AV adoption curve by ADAS level – in % of
Association (ACEA), the overall market share of alternative powertrains        global new car sales
in Europe (EU + Norway + Switzerland) in 2018 was 2.5%, a 33% yoy              100%
increase compared with just 1.8% in 2017. This translates into                  90%

183,000 plug-in hybrids and 201,000 battery-electric vehicles, which            80%
                                                                                70%
supports our growth case, albeit these numbers are off a low base. In
                                                                                60%
addition, 606,000 full and mild hybrid vehicles were sold in Europe last        50%
year, again a 33% increase over the previous year. In spite of the              40%

strong yoy increase, government incentives, such as Germany’s EUR               30%
                                                                                20%
4,000 subsidy for full-electric cars and EUR 3,000 for plug-in hybrids,
                                                                                10%
have had only an incremental impact on consumer demand as the                    0%
selection of vehicles currently available is limited – but this will change.       2016 2017 2018 2019 2020 2021 2022 2023 2024 2025 2026 2027 2028 2029 2030

The market share of electrified vehicles worldwide (full-electric and                         Level 0   Level 1   Level 2   Level 3   Level 4   Level 5

plug-in hybrid) stands at just 1-2%.                                           Source: UBS, as of May 2018

Regulation
Regulation will encourage car manufacturers to build and roll out more         Fig. 10: Semiconductor content on the rise
models, and consumers to switch to electrification over time, at least in      Semiconductor content of a full-electric, level 2
China and Europe. China, with its NEV initiative of zero- and low-             autonomous car (Tesla Model 3) versus an
emission vehicles is at the forefront of global supply and demand. It is       average car , in USD
already the world's leading electric car market – Chinese consumers             1,600
                                                                                                                                          53
have the largest selection of electrified cars to choose from – and it is       1,400
accelerating its electrification efforts. Monthly sales figures of 96,000       1,200                                       468

NEV (+140% yoy) for January 2019 support our views. China is aiming             1,000

for a NEV quota of 10% and 12% by 2019 and 2020 respectively, and                800                                                                      1,516
                                                                                                            581
20-25% by 2025. The NEV formula is complicated and does not mirror               600

market share with credit granted to comply with the NEV quota                    400

dependent on vehicle range and efficiency. This should translate into            200         414

around 4% more, or one million new NEV vehicles sold in 2019 and                      0
                                                                                          Average Car        EV       Level 2 ADAS    Other           Model 3
2020. Our meetings with industry officials, including VW management,                        in 2017                      content   (higher-end
                                                                                                                                       mix)
suggest China’s NEV goal could translate into 600,000 NEVs a year by
2025 for VW alone.                                                             Source: UBS, as of September 2018
                                                                               Note: EV = electric vehicle related; ADAS = advanced driver assistance
                                                                               system; Other includes e.g. comfort related content like
In Europe, various countries are set to phase out traditional combustion       entertainment/navigation etc.
engines (diesel and gasoline). In the UK and France, this is slated for 2040
(Paris is aiming for 2030). In Asia, China is looking at ridding itself of

                                                                                                                                                                  6
Longer Term Investments
combustion engines by 2030. The ban on diesel engines from inner cities
(emission zones) or potentially a ban on all ICE-powered vehicles, as well
as mandatory EV quotas, has been widely discussed. In some German
Fig. 11: Diesel market share in Europe
cities, diesel bans are already in place.
European diesel-powered car sales under severe
Uncertainly surrounding diesel emissions and vehicular access driving pressure (market share in %)
65%
bans has caused considerable ambiguity among European consumers.
60%
This has led to a sharp fall in the market share of new diesel vehicles 55%
(see Fig. 11 and Box 3). The result: European consumers have switched 50%
to gasoline engines (as viable electrified products remain limited) 45%
leading to an increase in CO2 emissions. 40%
35%
30%
With CO2 emissions on the rise, ever more electrified vehicles will be
25%
needed to meet the upcoming European CO2 regulations, which are
Feb-16
Jun-16
Oct-16
Feb-17
Jun-17
Oct-17
Feb-18
Jun-18
Oct-18
Feb-19
due to tighten from the current 130g CO2/km to 95g CO2/km by
2020/21 (around 4 liter/100 km = 59 miles per gallon consumption) France Germany Spain UK Italy
and by a further 37.5% from the 2020/21 levels by 2030 (i.e. around Source: National Car Associations, February 2019
2.5 liter/100 km = 94 miles per gallon average fleet consumption). In
our view, non-compliance is not an option for manufactures, as this
could lead to hefty fines and reputational damage.
Box 3: A word on diesel
Clearly, the electrification of cars will help reduce local emissions i.e. in
The share of diesel-powered car sales has fallen
cities and urban areas. However, to really make a dent in overall
significantly in Europe, from above 53% pre the
environmental CO2 emissions, national grids need to move away from
diesel crisis to around 34% today. However,
carbon energy toward renewables (see our LTI: Renewables, published
digging deeper, this fall is not all down to the
9 January 2019 and our LTI: Clean air and carbon reduction, published
emissions scandal. Some small and mid-sized
18 May 2018). In our view, Smart Mobility, Renewables, and Clean air
vehicles no longer offer diesel technology as to
and carbon reduction will become increasingly important in the years
to come. New regulations are vital in driving this step-change in do so would render them unprofitable due to
mentality. the cost of complying with new emission
standards. The share of German premium
Growth diesel-powered cars has dropped as well.
We believe that when infrastructure improves, costs fall and more However, in the case of large sedans like the
attractive products hit the market, consumers will increasingly embrace BMW 7 Series or large SUVs, diesel still
electrified vehicles. We think that further cost reduction (mainly represents more than 70% of sales. But we are
batteries), and the rollout of attractive battery-electric vehicles from also seeing an increasing share of gasoline for
2020 onwards will lead to exponential smart mobility growth. From a plug-in hybrids.
total cost of ownership (TCO) perspective, cost parity exists in Europe
Source: UBS
between ICE and battery electric vehicles (BEV) and is not far behind
elsewhere (see Fig. 12.1.) with annual running costs for diesel cars e.g.
in Europe likely to rise while battery-electric costs fall (see Fig. 12.2). Fig. 12.1: Inflection points
Sustained or even increasing subsidies could bring the timeline Close to TCO parity for consumers and auto
forward. For car manufacturers, we expect decent profitability (i.e. a manufacturer margin to follow 3–5 years later
5% EBIT margin) to follow, but with a delay, potentially from 2023 in TCO parity
Europe, and later in other regions. In our discussions with Daimler at NO YES
the Frankfurt IAA Motorshow in September 2017 we were told that
5% OEM EBIT margin
US 2025
first-generation electric car margin contribution would be roughly half
NO
China 2023
that of traditional ICE vehicles. However, markets evolve rapidly. More Europe 2018
achieved
recent discussions with VW management suggest an increasing
confidence in scale benefits. Based on our findings following our tear-
2023
down of a Tesla Model 3 where we observed a faster drop in battery
YES
2026
prices, we feel increasingly confident that the stated inflection points 2028
are realistic. However, at this point, most automakers are not
Source: UBS, as of 18 May 2017
necessarily the winners in smart mobility as upfront investments remain Note: TCO = Total cost of ownership. TCO parity = the point when all-
high and payback will only come over time. in costs for battery electric vehicles equal internal combustion engine
vehicles
7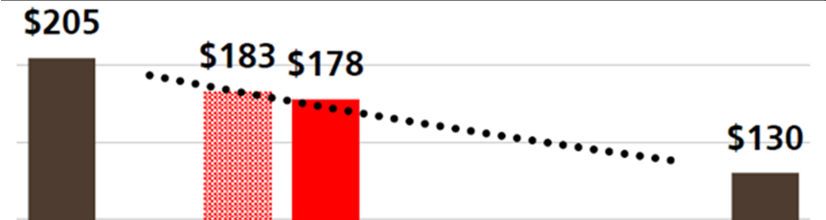
Longer Term Investments

While we expect growth rates will be strong, these will off a very low
base. Even with a projected drop by UBS of 35% in battery pack prices           Fig. 12.2: Cost of ownership of diesel cars
by 2025 from 2017 levels (see later chapter) we believe a battery-              Likely to turn into a disadvantage (annual costs
electric car will likely cost at least USD 15,000 (for 200km short-range        in EUR)
                                                                                 8,000
models) to USD 20,000 (for 400km long-range models). However, the
                                                                                 7,500
costs of improving internal combustion engine efficiency are on the
                                                                                 7,000
rise, and the gap versus battery-electric vehicles could shrink if battery
                                                                                 6,500
costs fall faster, which may lead to a faster rollout of battery-electric
                                                                                 6,000
vehicles. Nevertheless, we believe the growth in alternative powertrains
                                                                                 5,500
will take place in areas with higher incomes and purchasing power, or
                                                                                 5,000
geographies under greater regulatory pressure. We see the greatest
                                                                                 4,500
potential for growth in alternative powertrains in China and Europe
                                                                                 4,000
(which together we believe should account for 80% of the market by                             Diesel               Gasoline   BEV
2025), rather than emerging markets, while the US is likely to lag on                                        2016     2021E
the full-electric front (see Figs. 4 and 8).
                                                                                Source: UBS estimates, as of February 2019

We believe luxury and premium cars, equipped with alternative
powertrains, will be first to market as their buyers are less price
sensitive. These will be followed by the volume segment. The                      Box 4: Fuel-cell vehicles (FCV)
introduction of various premium SUVs in 2018, support this view.
                                                                                 Hydrogen propelled fuel cell electric vehicles
However, volume producers are fast on their heels. Offering cheaper
                                                                                 have been discussed as a viable long-term
mainstream vehicles at lower price points will clearly depend on battery
                                                                                 powertrain solution. For example, Audi
costs (see next section). The three German auto heavyweights currently
                                                                                 announced a partnership with Hyundai to
sell a combined 15 million vehicles annually. According to their
management teams, they target 15–25% electrification of their car                develop fuel-cell vehicles, which Hyundai has
divisions’ sales (full-electric plus plug-in hybrid) by 2025. This translates    already accomplished. Japan and several
into around four million electrified vehicles a year.                            Japanese auto companies are also heavily
                                                                                 engaged in this technology, while Daimler has
At this stage, we believe that by 2025 around 25% of new cars                    created an SUV as a technology base to gain
worldwide will be electrified, of which at least 10% will be battery-            broader experience. In May 2018, Toyota
powered full-electric vehicles with the remainder full and plug-in               announced the expansion of its fuel cell stacks
hybrids. This is not too far away from auto supplier Continental, which          and hydrogen tanks business as it anticipates
sees full-electric vehicles taking a 10% share of the market, plug-in            selling at least 30,000 vehicles per year (a 10-
hybrids at 5%, full hybrids at 7%, and 48V mild-hybrids at 14%.                  fold increase from current levels) from 2020
However, industry estimates vary widely, as faster progress in battery           onwards. But this would translate into just
technology and falling costs could speed up the rollout of battery               0.3% of its 10 million global vehicle sales,
electric cars at the expense of plug-in hybrids. While a lot has been            indicating the niche character of FCV. We
written about fuel-cell vehicles (FCV), we believe battery-powered               believe a near-term broad-based roll-out
vehicles (BEV) will be adopted first, while FCV may come at a later              appears unrealistic because: 1) the way battery
stage (see Box 4).                                                               costs are evolving; 2) the lack of hydrogen gas
                                                                                 station infrastructure in most countries, vis-a-vis
From a production perspective, UBS estimates the breakeven point for
                                                                                 the availability of electricity sockets; 3) efficiency
a battery electric compared with a plug-in hybrid (which still needs a
                                                                                 losses from the creation of hydrogen until it
combustion engine) to be at a battery pack cost of around USD
                                                                                 ends up at the wheel. However, fuel cell
140/KWh. This could potentially arrive by 2020–2021, some two years
                                                                                 technology may become viable for commercial
faster than we expected a year ago because battery costs have fallen
                                                                                 vehicles, such as buses and short-haul trucks, as
faster. Thus, the cheaper batteries become, the weaker the case for
                                                                                 they have a set starting point for their trips
plug-in hybrids. Nevertheless, we believe plug-in hybrid technology will
                                                                                 where a hydrogen gas station could be easily
be with us for some time to come. The next generation of plug-in
                                                                                 installed. Further out (beyond 2025), we see a
hybrids, available from around 2020 onwards, should offer 100km
electric range, or enough to meet 90% of road trips. As vehicle range            chance that more auto companies will diversify
improves, so too will consumers' willingness to buy into this                    their technology in order to manage the
technology, as long as battery costs for full-electric vehicles remain           dependency / access to commodities and certain
relatively high compared to today's levels. In the long run, however, we         geopolitically sensitive areas.
think plug-in hybrids will become obsolete.                                     Source: UBS

                                                                                                                                          8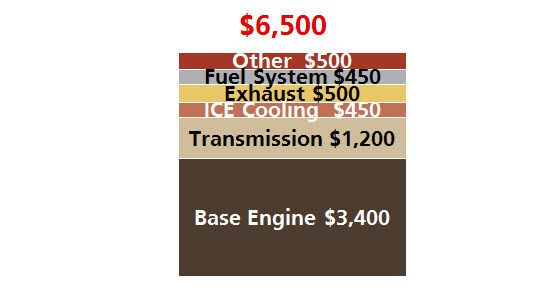
Longer Term Investments

Furthermore, we also assume that by 2025 pure ICE vehicles will no
longer be sold. Rather, we see pure ICE being accompanied by 12 and              Fig. 13: Electric engine powertrain
48 Volt mild hybrids, adding to the revenue opportunities for technology-        The battery is the biggest cost item (in USD)
focused suppliers (see also Appendix 2). In our view, the US will embrace
the change at a later date, phasing out pure ICE (without at least a mild-
hybrid system) by 2030. Hence, we expect at a minimum a further 20–
25% share for mild hybrids based on 12 or 48 Volt technology by 2025,
reducing emissions and replacing demand for new diesel vehicles at
reasonable cost.
Consequently, the value-added share of automakers and traditional auto
suppliers is likely to fall due to the disruptive forces in the industry, away
from mechanical parts toward electrical and electronic ones (see Fig. 13
and Appendix 2). In 2017 we expected suppliers that support powertrain
electronics to increase their content by up to 11x to around USD 600 per
electric vehicle compared to a traditional combustion engine vehicle.
Furthermore, battery cell and battery pack producers would likely take a
substantial share of the value.
                                                                                 Source: UBS, as of 18 May 2017
A word on batteries
Regulation aside, the rollout of electric cars depends to a large extent on
further advances in existing and new battery technology. Battery know-
                                                                                 Fig. 14.1: Electric cars – battery cost will be
how is both key, and a strategic asset. Increasing energy density and
                                                                                 key
reach, while substantially reducing costs and weight, will be crucial in
                                                                                 Battery pack cost to decline by around 35% by
increasing demand. Battery costs have already fallen significantly and are
                                                                                 2025 on existing chemistry, in USD per kWh
expected to drop still further. Up until the middle of last year we
                                                                                 3
assumed a 35% drop in battery pack prices from 2017 levels by 2025               250
(see Fig 14.1). However, the swifter fall in battery-cost reduction we saw       200
                                                                                                             25
                                                                                                                       30
in the Tesla Model 3, some two years faster than we forecast in 2017,                                                                10           10
                                                                                 150
may mean we are too conservative in our forecasts (see Fig. 7), which            100              205
should propel electric vehicle demand. While the environmental impact                50
                                                                                                                                                               130
of producing and recycling batteries is controversial, we believe the                 0
extended life of batteries and technological advances mean battery                              Pack cost (1) Cell (2) Energy (3) Energy (4) Scale Pack cost
                                                                                                  today chemistry density density            &      2025E
recycling may be less of an issue than feared (see Box 5).                                                           impact     impact learning
                                                                                                                     on cell on pack       curve
Currently, substantial investment in battery capacity is being made,             Source: UBS, as of 18 May 2017
which will more than double global battery capacity from 2017 levels in
2021. This includes some of the larger Asian players which already have,
or are in process of building, capacity in Eastern Europe. Cost reduction
also comes from scale, and we expect smaller companies to suffer from            Fig. 14.2: Battery pack cost development
high capital expenditure requirements and ongoing price erosion, which           Depending on cathode material mix, in USD per
would only be partly compensated by a strong increase in volume. In              kWh
                                                                                 300
addition, battery technology is advancing. So-called solid-state batteries,               263
                                                                                                    255
with superior characteristics, may be several years away. However, a             250
                                                                                                             240
                                                                                                                     225
faster break-through could speed-up the move to full-electric vehicles                    198
                                                                                 200                185
and change the competitive landscape of battery producers. Hence, we                                         174
                                                                                                                     164     159          154      150
would avoid smaller battery companies, which lack scale, research &              150                         166
                                                                                                                                                                   148

                                                                                                                     153
development capabilities and financial resources.                                         141                                 141          135         130
                                                                                                    133      128                                                   127
                                                                                 100                                 123     118          114      110             107
Implications for raw material demand
Production and demand of graphite, lithium, cobalt, manganese and                    50

copper is expected to rise and with it the cost of these raw materials –over          0
the past two years, raw material prices have soared, and now represent                2018E         2019E   2020E   2021E    2022E        2023E   2024E        2025E

around 50% of battery cell costs, or around one-third of the overall cost of                        NMC111          NMC622           NMC811                  NCA
a battery pack. In our view, this will nudge the auto and battery industry to
seek out alternative technologies and materials, not least due to supply
                                                                                 Source: UBS, September 2018
concerns (cobalt, for example, is mined in politically sensitive Democratic
Republic of Congo). Renault-Nissan has already committed around EUR
1bn to explore cobalt-free batteries.

                                                                                                                                                                         9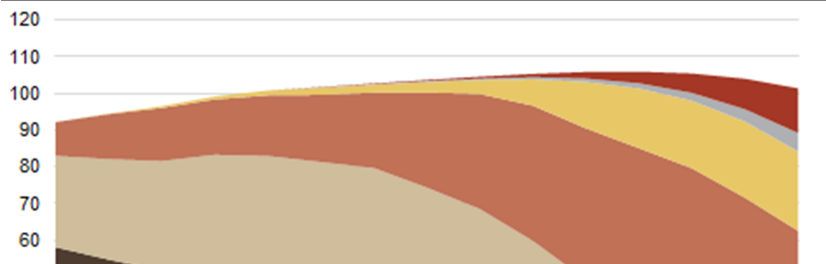
Longer Term Investments

While commodity costs will continue to drive prices, technological advances
in battery cell chemistry should help increase the energy density and reduce
the required size and costs of batteries. Cathode material is a major cost-
component of a battery. Looking at the latest announced changes in
cathode chemistry, the shift from so-called NMC 111 batteries (1 unit of           Box 5: Battery – three stages of life
nickel, 1 unit of manganese, 1 unit of cobalt) or NMC 622 batteries to
substantially cheaper NMC 811 batteries confirms that the auto and                 What is the impact on the environment of full-
battery industry is trying to bring costs down – as a result demand for            electric vehicle batteries?
nickel will increase at the expense of cobalt. In our view, costs for a battery    Much of the raw material used in making
pack based on an NMC 111 cathode could be USD 225 per kWh in 2021,                 batteries comes from geographically sensitive
whilst an NMC 811 might be less than USD 153 by the same time, i.e.                areas,    and  environmental,     social   and
30% cheaper. Assuming a 60 kWh battery, the resulting cost savings                 governance (ESG) issues are of utmost concern.
would be around USD 4,300 – and we believe costs can fall further (see
Fig. 14.2). As an aside, with battery pack costs falling, the share of             Talking to auto companies it looks like in the
commodities as a percentage of overall battery costs, even assuming stable         first stage of life, batteries can be used much
raw material costs, is likely to increase from around one-third to around          longer than originally projected i.e. they endure
one-half of the overall battery pack cost by 2025. But investing in                many more charging cycles than originally
commodities or commodity-related sectors may be the most volatile part of          projected and should last at least 10 years,
investing in our smart mobility theme due to the supply/demand dynamics            depending on their usage and the way they are
and the long lead-time they are facing. Various commodities have                   treated. When their performance drops, they
experienced high volatility and price setbacks, as the market has sometimes        may be used in the form of stationary energy
got ahead of itself, with initial investments in mining capacity only followed     storage. This is the second stage of life for a
by strong demand in the years to come. For example cobalt was at USD               battery. Companies such as Daimler and Renault
55,000 per ton in Q2 2017, peaked at above USD 90,000 in Q1 2018 and               are already running, or have announced plans
is now back at around USD 31,000 at the time of writing.                           to use, used batteries in battery storage centers.
                                                                                   The auto industry put this 'extra' life at 10 years.
Charging infrastructure
                                                                                   In those already existing and planned centers, a
While there has been a strong increase in the number of charging
                                                                                   few thousand batteries are being used to store
points in China (where investments in charging infrastructure have
                                                                                   energy from renewable energy sources, to
been in the low-double-digit USD billions), it remains in its infancy in
                                                                                   stabilize the grid, to power multiple households,
Europe. Estimates of the investment needed vary widely and start at
around USD 200 billion, while UBS projects that USD 300 billion of                 or to fast-charge vehicles on highways,
investments are needed globally to establish an adequate and broad-                supporting a more decentralized energy
based charging infrastructure. In our view, we face a chicken-egg                  distribution and storage system. It is only in
problem – consumers are unwilling to buy electric cars because of                  stage three that batteries will be torn-down in
'range anxiety' i.e. the fear of running out of charge with no charging            order to recycle their constituent valuable
facilities in sight. On the flip side, charging-infrastructure providers are       metals and other commodities. This will create
not investing fast enough, as there are too few electric vehicles to               new business opportunities (see our LTI: Waste
make it a lucrative business.                                                      Management and recycling, published 30 May
                                                                                   2018). We don't, however, see this happening
As an example, the German government is targeting 100,000 charging                 until 2030 and beyond when more and more of
points by 2020. We believe in Germany alone, substantially more than               the first generation of batteries reach stage
25,000 fast-charging points are needed to cater to increased                       three.
electrification. Reality is some way off. The current infrastructure, as of
                                                                                  Source: UBS
June 2018, included 13,500 charging points, of which only 13% are
fast chargers – up from 10,700 charging points in June 2017 (source:
bdev.de - Bundesverband der Energie-und Wasserwirtschaft). In
Norway, which has the highest EV penetration in Europe, press reports
illustrated bottlenecks in charging points; ongoing investment in
charging infrastructure has not been able to keep up with the demand.
For many countries, a broad-based coverage of (fast) charging stations
remains a long way off, representing a major near-term bottleneck for
the rollout of electric vehicles – but we believe this will be solved. This
will not only require additional investment by governments, but also
offer business opportunities in the long run, e.g. via exclusive licenses
to build up charging infrastructure for a decent return on investment.
Further opportunities may also lie in wireless (inductive) charging
infrastructure for private households over time.

                                                                                                                                          10
Longer Term Investments
Autonomous driving (ADAS)
Autonomous driving is tiered from levels 0 (zero automation) to 5 (full
automation). We believe that over the next 10 years, most new cars
will reach level 2 to 3, with level 3 (“hands-off”) in particular
(conditional automation) offering profitable opportunities for
companies. To quote Daimler’s head of R&D, "horsepower is being
replaced by the speed of semiconductor chips." Semiconductors and
sensors are key for autonomous driving. As an aside, they collect a vast
amount of potentially lucrative data over time. (see Fig. 9)
The trend toward electrification plays nicely into the trend toward
autonomous driving and connectivity. ADAS or "advanced driver
assistance systems," is tiered from levels 0 (no automation) to 5 (full
automation, i.e. no steering wheel needed). Currently, most cars are at
levels 0 and 1, some are at level 2, with a few at level 3 (but not all
functions are fully activated). In our view, the ability to automate
driving will occur slowly over the next 10 years, with most vehicles
reaching at least level 2 to 3, but we believe current estimates (see Fig.
9) could be too conservative. Increasingly applying connectivity and
vehicle-to-vehicle and vehicle-to-infrastructure communication will
change the way we use automobiles.
To increase road safety and reduce fatal accidents, we believe many
ADAS features will become mandatory and think that the adoption of
ADAS will exceed that of the overall growth of the car market by far.
We experienced autonomous technology in a real-driving environment
in 2017. Since then technology has advanced considerably. It is our
strongest belief that by 2020, around 50% of all new cars could be
equipped with some kind of basic autonomous equipment (Fig. 9).
Right now, level 3 autonomous developments (conditional automation)
appear the most promising. Our discussions with auto manufacturers
confirmed high-end consumers’ willingness to pay for such comfort
and safety features. We think Level 3 ADAS penetration, i.e. a
"highway pilot," will become reality from 2020 onwards, but it will
require the further development of expensive and sophisticated
sensors, such as front Lidar (light detection and ranging, a laser-based
radar system), and far-range front-view cameras – overall, around 25-
30 sensors are needed per car.
Manufactures appear willing to collaborate and meet the
technological, cost challenges and strong competitive positions thrown
up by some of the non-automotive technology companies.
Level 4 ADAS would allow some robotaxi services in so-called geo-
fenced areas from 2021–2025 based on the ongoing discussions with
auto manufacturers and suppliers. Those companies also highlight that
this "urban pilot" would require that vehicles carry some 40 sensors.
Current costs remain prohibitive for a large scale rollout to non-fleet
buyers. However, costs for autonomous technology will fall. But even
in 2030, UBS projects up to USD 15,000 of additional costs for level
4/5 vehicles, which limits this technology to robotaxi services and high-
end premium vehicles, in our view.
We see ADAS as a USD 35-40 billion (EUR 30-35 billion) annual
revenue market by 2020, more than doubling to USD 90 billion
(EUR 75 billion) by 2025, and quadruple that of 2017/2018 levels.
11Longer Term Investments
Clearly this market is attractive and technology players are heavily
engaged in the ADAS space. At the end of October 2018, CNBC
reported that the California Department of Motor Vehicles (DMV) has
granted the state's first permission to test level 5 autonomous vehicles
on public streets under all-weather conditions and without a safety
driver. In November 2018, San José, California will become the pilot
city for a level 4/5 automated on-demand ride-hailing service in 2H
2019. And in December 2018, an autonomous taxi service was
launched in Phoenix, Arizona. We think this launch will serve as an
important test case for eventual wide-spread commercial roll-out of
driverless ride-hailing services.
Together, we think electrification and autonomous driving will translate
into a multi-billion dollar business beyond the classic auto supplier
industry. Related industries such as electronics, software (algorithms),
artificial intelligence (AI) hardware, and semiconductors should
increasingly gain in importance. The same is true for sensors (see Fig.
15), which will play a major role in an autonomous and connected
world. The broad-based application of laser, radar, LIDAR (light
detection and ranging, a laser-based radar system), ultrasonic, and
cameras should also increase and, together with connectivity and
mapping, serve as the backbone for the development of autonomous
driving (see next section).
Linking things is complex and machine learning (artificial intelligence)
will be a game-changer in a future where sensors and AI work hand-in-
hand to ensure a smoother and safer ride. This ability will help make
car features, such as learning speedbumps and adjusting the shock
absorbers or automatically increasing the car’s height the next time it
approaches a hump, standard in a few years. Smooth deceleration to
avoid braking before roundabouts, recuperation to fully charge the
battery before the next hill, advance gear-shifting to optimize torque
management and many more features will ensure a smooth and
autonomous ride.
12Longer Term Investments
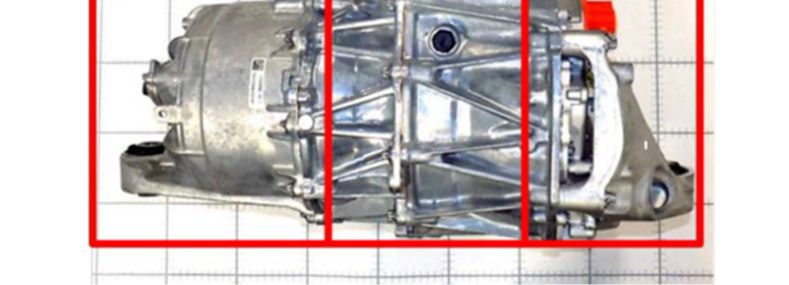
Fig. 15: Sensors will be key
The number of sensors i.e. cameras, laser, radar, LIDAR, ultrasonic will increase substantially
Source: Texas Instruments Inc.
Connectivity
The auto industry is working on linking cars with smart devices to cater
to the needs of the digital generation and beyond. When it comes to
connectivity, linking the music database of a smartphone to the car was
only the beginning. Integrating smartphones and watches for last-mile
navigation in order to provide multi-modal mobility services, be it by foot,
bicycle, or public transportation, is already developed. The vehicles'
interior and connectivity capabilities will come into focus, with the latest
voice control technology and intuitive handling coming to the fore. Cars
will serve as vessels for connectivity and entertainment in the not-too-
distant future. Furthermore, software updates via the internet (OTA =
over the air) rather than by visiting the car dealer will be a common
feature of new cars in the next five years, according to all the discussions
we have with automotive companies. We believe connectivity in new
vehicles will reach a penetration rate of 100% by 2022 at the latest,
corresponding to nearly 50% of the cars in use by then.
Mapping
Data is continuously collected and processed to add more safety and
comfort features to modern cars. This enables vehicle-to-vehicle
communication systems that warn other vehicles of accidents or slippery
roads, as well as smart routing and live-traffic information. In addition, it
enables intelligent traffic control, i.e. vehicle-to-infrastructure
communication, by interlinking cars with traffic lights and speed
restrictions. We experienced this technology in person in September
13Longer Term Investments
2017. An artificially-created incident (car breakdown with hazard lights
activated) was registered by the sensors, processed, sent to the cloud,
and distributed from the cloud to all connected cars in the area within
two seconds. Warning of potential hazards is a big improvement in
increasing road safety and more innovations are coming.
Looking at the combination of connectivity and mapping, we are arriving
at an important inflection point. The role-out of 5G technology globally
in 2019, with countries such as China, the US, Japan Korea and Australia
powering ahead, will be a driving factor for ADAS. Connected vehicles
will use 5G standards for vehicle-to-vehicle (V2V), vehicle-to-
infrastructure (V2I) and vehicle-to-pedestrian (V2P) communications that
will support the safety requirements of autonomous driving (see our LTI:
Enabling technologies, published 21. May 2018).
Data ownership as the basis for future commercial success
But connectivity goes well beyond that. Based on a current global
average car speeds of 40km per hour and 16 trillion km (10 trillion
miles) of car travel per year, owners spend an estimated 400 billion
hours in unconnected cars, and passengers an additional 200 billion
hours, according to a study by Morgan Stanley. Based on a range of
economic values per hour, time spent inside a private vehicle could
translate into an opportunity cost of several trillion US dollars.
Using more apps on the car’s display will generate more data that
could be of value to better understanding and “owning” the car
consumer. The auto industry is battling the IT giants which are
grabbing this opportunity, with its own alternative systems (as also
highlighted before with level 5 autonomous driving testing). Owning
the mapping and navigation data and, in general, all the data created
in the car, which will be collected over time through the sensors built
into the car, will become valuable. Hence, both the auto and IT-related
industries will try to own and commercialize the large amounts of
valuable big digital data created in the connectivity process for their
mobility services and beyond.
Embracing connectivity with the possibility of autonomous cars as "the
fourth screen" is driving a fast-rising trend in online/internet functions
in cars, which could be commercialized by providing media content and
advertising. UBS sees a USD 400bn in-car time monetization
opportunity by 2030, although we are not incorporating any value at
this stage as many commercialization strategies appear vague. We still
believe the proportion of such business to overall sales will be limited
this decade but could offer additional revenue streams at a later stage.
Security issues
Bringing connectivity and autonomous driving together, security and
liability concerns become a big issue. These will also affect the auto
insurance industry, among others. At 180kph (around 110mph) on a
German autobahn, a car travels 50 meters (164 feet) per second. At
this speed or slower, cyber-crime could become a serious threat. Any
interruption or manipulation of the car’s hardware or software could
have fatal consequences. The increasing trend to over-the-air (OTA)
software updates is adding to those risks. Hence, (cyber) security and
safety will play a crucial role as an indirect way to invest in the
autonomous driving trend. Please see our Longer Term Investments
series Security and Safety, dated 16 January 2019.
14You can also read