August 2018 - Smart Data Infrastructure for Wet Weather Control and Decision Support May 2017 - EPA
←
→
Page content transcription
If your browser does not render page correctly, please read the page content below

Smart Data Infrastructure for Wet Weather Control and Decision Support   May 2017

                                           August
                                               1 2018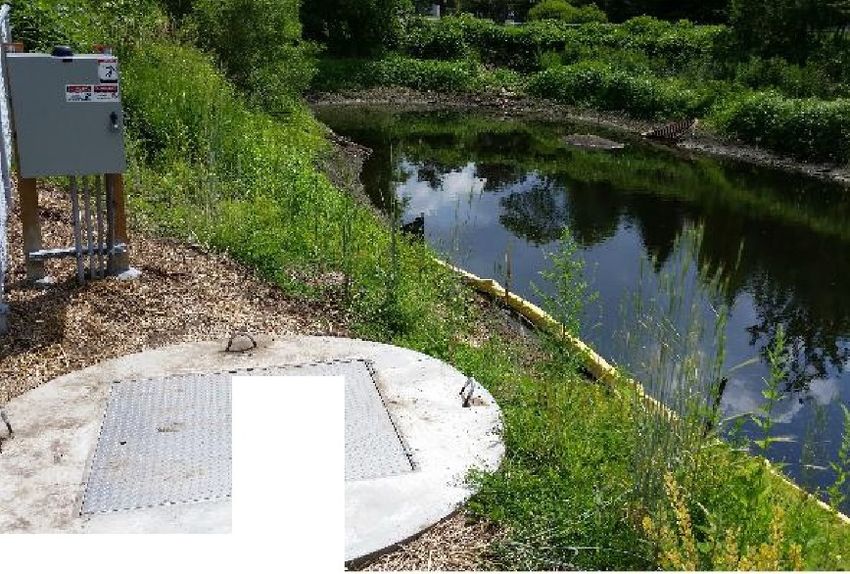
CONTENTS
Disclaimer ...................................................................................................................................................... iv
Acknowledgments .......................................................................................................................................... v
Acronyms and Abbreviations ........................................................................................................................ vi
Glossary ........................................................................................................................................................ vii
1.          Introduction ..................................................................................................................................... 1
2.          Smart Data Infrastructure ................................................................................................................ 2
3.          Smart Data Infrastructure and Technologies: Information Inputs .................................................. 4
            3.1          Continuous Monitoring ....................................................................................................... 4
            3.2          Level Monitoring ................................................................................................................. 5
            3.3          Flow Monitoring .................................................................................................................. 6
                         3.3.1         Physical Flow Monitoring...................................................................................... 6
                         3.3.2         Alternative Flow Monitoring Technologies .......................................................... 6
            3.4          Rainfall Monitoring .............................................................................................................. 7
4.          Collection System Optimization ....................................................................................................... 8
            4.1          Capacity Management Operation and Maintenance and I/I Control ............................... 10
5.          Real-Time Control Systems ............................................................................................................ 10
            5.1          Components of an RTC System ......................................................................................... 12
                         5.1.1         Supervisory Control and Data Acquisition Systems ............................................ 12
            5.2          Real-Time Decision Support Systems ................................................................................ 13
            5.3          Level of Control ................................................................................................................. 14
            5.4          Guidelines for Applying RTC .............................................................................................. 16
            5.5          Key Considerations for RTC Systems ................................................................................. 17
6.          Data Management and Sharing ..................................................................................................... 18
            6.1          Big Data Management ....................................................................................................... 18
            6.2          Data Sharing ...................................................................................................................... 18
            6.3          Real-Time Public Notification and Transparency .............................................................. 19
7.          Data Analytics ................................................................................................................................. 19
            7.1          Data Validation and Filtering ............................................................................................. 20
            7.2          Key Performance Indicators .............................................................................................. 21
8.          Data Visualization and Decision Support Systems ......................................................................... 22
9.          The Future of Data Gathering Technology for Wet Weather Control and Decision-Making......... 23
10.         References ...................................................................................................................................... 25

                                                                                 ii
APPENDIX A: CASE STUDIES
Buffalo, New York: Real Time Control of Inline Storage............................................................................. A-1
Falcon Heights, Minnesota: Predictive Flood Control System ................................................................... A-3
Hawthorne, California: Real-Time Monitoring to Prevent Sewer Overflows ............................................. A-5
Louisville, Kentucky: Real-Time Control for Integrated Overflow Abatement ........................................... A-6
Newburgh, New York: Real-Time Control to Monitor Discharges for Reporting/Public Notification ........ A-9
Philadelphia, Pennsylvania: Real-Time Control to Manage Retention Pond Discharge........................... A-10
San Antonio, Texas: Real-Time Control for Cleaning Optimization .......................................................... A-12
San Diego, California: Stormwater Harvesting Augmentation Analysis ................................................... A-14
South Bend, Indiana: Real-Time Control and Real-Time Decision Support.............................................. A-16
Washington, DC: Real Time Controls for Rainwater Harvesting and Combined Sewer Overflow
Control ...................................................................................................................................................... A-18
Wilmington, Delaware: Real-Time Control to Reduce Combined Sewer Overflow Discharges ............... A-20

                                                                                iii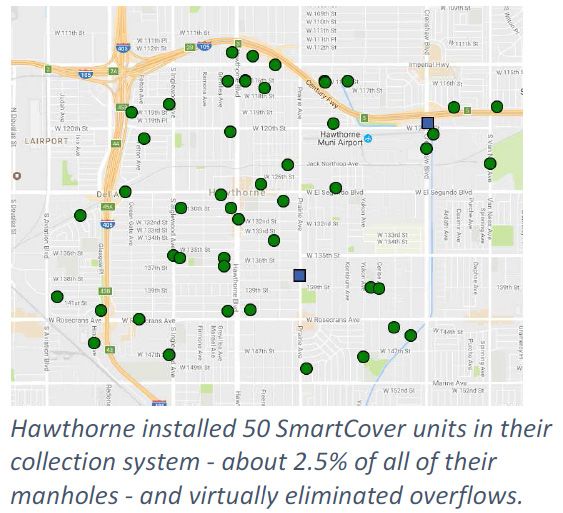
Smart Data Infrastructure for Wet Weather Control and Decision Support                        August 2018

Disclaimer
The material and case studies presented in this document are intended solely for informational
purposes. This document is not intended, nor can it be relied on, to create any rights enforceable by any
party in litigation with the United States. Case studies used in this document are unique and site-specific,
and they may not be as effective as demonstrated. This document may be revised or updated without
public notice to reflect changes in the technologies and to update and/or add case studies. The U.S.
Environmental Protection Agency (EPA) and its employees do not endorse any products, services, or
enterprises.

Mention of trade names or commercial products in this document does not constitute an endorsement
or recommendation for use.

                                                     iv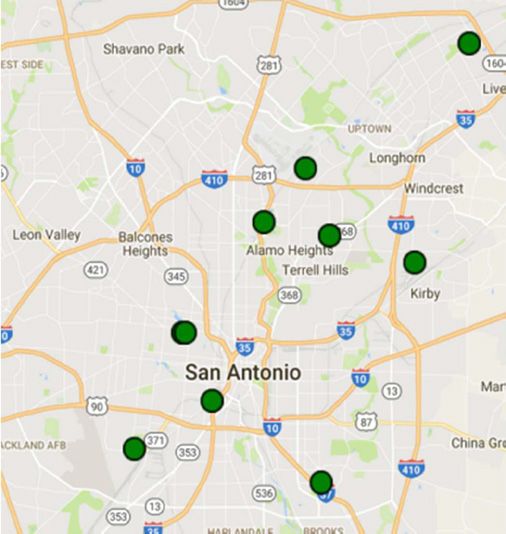
Smart Data Infrastructure for Wet Weather Control and Decision Support                  August 2018

Acknowledgments
Many stakeholders and subject matter experts contributed to this document, including:

•   Jeff Wennberg, City of Rutland, Vermont
•   Missy Gatterdam, Metropolitan Sewer District of Greater Cincinnati
•   Edward D. Speer, CDM Smith
•   Marcus Quigley, Opti
•   Hari Vasupuram, Opti
•   David Drake, SmartCover
•   Tim Braun, Emnet

The document was developed under EPA Contracts EP-C-11-009 and EP-C-16-003.

                                                   v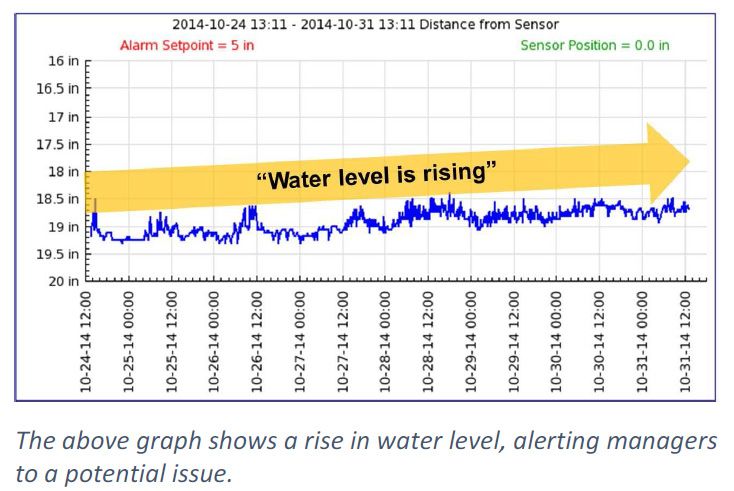
Smart Data Infrastructure for Wet Weather Control and Decision Support   August 2018

Acronyms and Abbreviations
CFR          Code of Federal Regulations
CMOM         Capacity Management Operation and Maintenance
CPU          Central Processing Unit
CSO          Combined Sewer Overflow
DSS          Decision Support System
EPA          U.S. Environmental Protection Agency
FOG          Fats, Oils, And Grease
GUI          Graphical User Interface
ICS          Industrial Control System
IoT          Internet of Things
I/I          Inflow and Infiltration
IT           Information Technology
KPI          Key Performance Indicator
LTCP         Long-Term Control Plan
MMSD         Milwaukee Metropolitan Sewerage District
MSD          Metropolitan Sewer District (Louisville)
MSDGC        Metropolitan Sewer District of Greater Cincinnati
O&M          Operation and Maintenance
PLC          Programmable Logic Controller
PWD          Philadelphia Water Department
RTC          Real-Time Control
RTDSS        Real-Time Decision Support System
SAWS         San Antonio Water System
SCADA        Supervisory Control and Data Acquisition
SSO          Sanitary Sewer Overflow
WWTP         Wastewater Treatment Plant

                                                 vi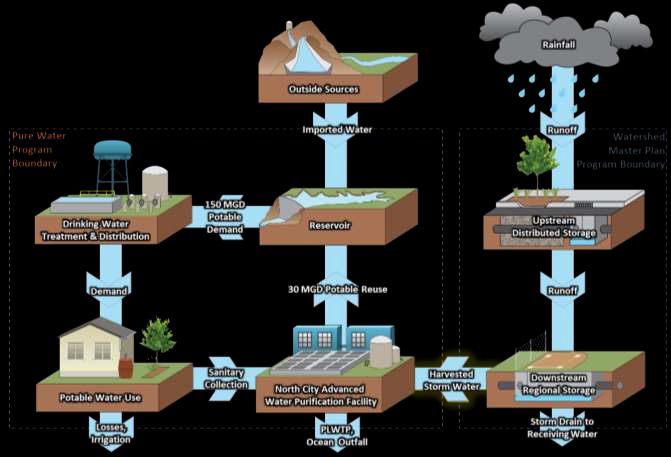
Smart Data Infrastructure for Wet Weather Control and Decision Support                         August 2018

Glossary
Agent-Based Control: System with locally interacting components that achieve a coherent global
behavior. Through the simple interaction of buying and selling among individual agents, a desirable
global effect is achieved, such as fair allocation of resources.

Big Data: Data sets that are so large or complex that traditional data processing application software is
inadequate to deal with them.

Cloud: Large-scale, offsite data storage facilities.

EPA SUSTAIN: Framework for the placement of best management practices in urban watersheds.

Gray Infrastructure: Engineering projects that use concrete and steel.

Green Infrastructure: Projects that depend on plants and ecosystem services.

Internet of Things: Process in which hardware is connected to a network (the internet) so that it can
better communicate with other systems.

Long-Term Control Plan: Written strategy required by the Clean Water Act for communities with
combined sewer systems to reduce and/or eliminate combined sewer overflow discharges in the long
term.

Machine Learning: Data analytic method used to devise complex models and algorithms that lend
themselves to prediction. This is also known as predictive analytics. There are many algorithms available.

Model Predictive Control: Model-based control strategy that predicts the system response to establish a
proper control action. This strategy explicitly uses a mathematical model of the process to generate a
sequence of future actions within a finite prediction horizon that minimizes a given cost function.

Real-Time Control: The ability of water infrastructure (valves, weirs, pumps, etc.) to be self-adjusting or
remotely adjusted in response to current weather conditions.

Smart Water and Smart Data Infrastructure: The ecosystem of technology tools and solutions focused
on the collection, storage, and/or analysis of water-related data.

                                                       vii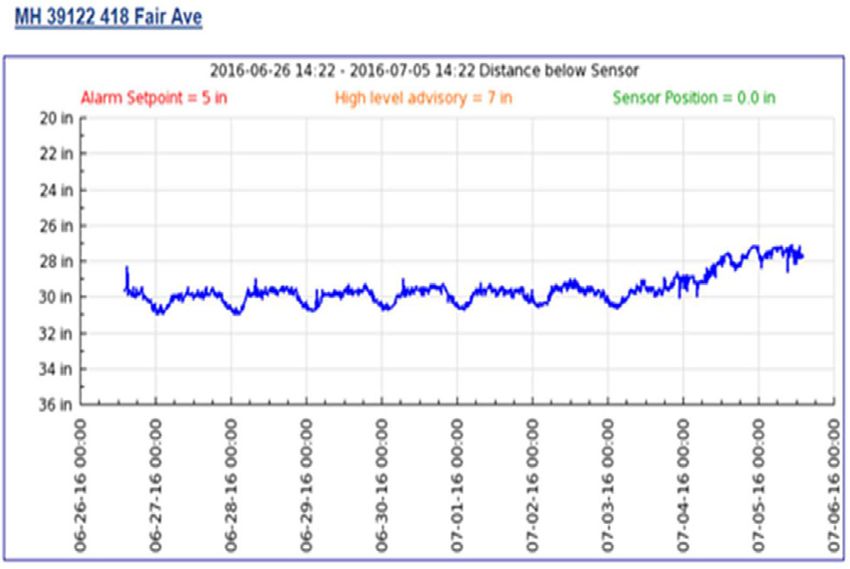
Smart Data Infrastructure for Wet Weather Control and Decision Support                        August 2018

1. Introduction
Rain and snowmelt (referred to as wet weather                        What Is in This Document?
conditions) can significantly increase flows at         This document summarizes key aspects of utility
                                                        operations where smart data systems can provide
wastewater treatment facilities, creating
                                                        significant benefits. It is organized as follows:
operational challenges and potentially affecting
treatment efficiency, reliability, and control of       Section 2 presents an overview of smart data
treatment units at these facilities.                    infrastructure, its relationship with green and gray
                                                        infrastructure, its benefits, and a general
Current approaches to wet weather control rely          “roadmap” for implementation.
primarily on gray or green infrastructure, or a
combination of the two. In recent years,                Section 3 describes technologies applied
                                                        specifically to wastewater collection and
however, municipalities and utilities have been
                                                        stormwater systems and key considerations for
considering how they can take advantage of
                                                        selection, design, implementation, and operations
technological advances to improve their                 and maintenance requirements.
operations and infrastructure. These advances
include:                                                Section 4 describes the use of smart data
                                                        infrastructure to promote collection system
•   Faster computer processing and network              optimization, as well as long-term control plan
    speeds, providing ready access to reliable          implementation, modification, and development.
    information for informed decisions.
                                                        Section 5 discusses the use of real-time control
•   Smaller, more accurate, and less expensive
                                                        systems to maintain and meet operational
    sensors.
                                                        objectives.
•   Low-cost storage of large quantities of data.
                                                        Section 6 discusses data management, data
•   The advent of the “internet of things” (IoT),       sharing, and public notification when using smart
    allowing sensors to be connected over large         data systems.
    geographic areas.
                                                        Section 7 describes data analysis in smart data
•   Smaller, higher-capacity batteries and
                                                        systems, including data validation/filtering and
    photovoltaics, reducing dependence on
                                                        the use of key performance indicators.
    permanent hard-wired power sources.
•   Wireless transmittal of acquired data,              Section 8 discusses data visualization and decision
    reducing the need for continuous or dial-up         support systems.
    hard-wired communications systems.
                                                        Section 9 discusses the future of data gathering
This document focuses on how municipalities,            technology for wet weather control and decision-
utilities, and related organizations can use            making.
advances in technology to implement “smart
                                                        Appendix A includes 11 case studies about
data infrastructure” for wet weather control—
                                                        communities across the country that have
that is, how they can use advanced monitoring
                                                        implemented smart data infrastructure
data to support wet weather control and                 technologies.
decision-making in real time or near real time.
Case studies about communities that have done
this across the country are included as
appendices and referenced where applicable
throughout the report.

                                                    1
Smart Data Infrastructure for Wet Weather Control and Decision Support                        August 2018

2. Smart Data Infrastructure
Smart data infrastructure is the integration of           •   Providing the ability to better optimize
emerging and advancing technology to enhance                  collection system storage capacity to reduce
the collection, storage, and/or analysis of water-            peak flows and the occurrence of overflows.
related data. These solutions can generally be            •   Enabling effective customer service and
grouped into a framework that consists of                     enhancing public notification.
hardware, communications, and management
                                                          Smart data infrastructure can be used to inform
systems.
                                                          operational decisions that ultimately improve
•   Hardware includes the devices that                    the efficiency,
    measure and collect water-related data,               reliability, and
    such as level meters, flow monitors, valve            lifespan of physical
    actuators, and pump-run monitors.                     assets (e.g., pipes,
•   Communications refers to networks,                    pumps, reservoirs,
    including wireless communications, that               valves). According to
    migrate data from the hardware to the                 Global Water
    systems that perform analysis.                        Intelligence
•   Management refers to the software tools               Magazine,
    and analytical solutions that perform                 implementing digital
    analysis and provide actionable information.          solutions by
    It also includes data visualization to give           consolidating
    managers real-time information for                    monitoring, data
    decision-making and to communicate with               analytics,
    the public.                                           automation, and
Smart data infrastructure leverages hardware,             control could
communication, and management analytics to                potentially generate
provide real and tangible benefits to utilities,          up to $320 billion in
including:                                                cost savings from
                                                          the total expected
•   Maximizing existing infrastructure and                capital expenditures
    optimizing operations and responses to be             and operating
    proactive, not reactive.
                                                          expenses for
•   Providing savings in capital and operational          different water and
    spending.                                             wastewater utilities over the five-year, 2016–
•   Improving asset management and                        2020 period (GWI 2016).
    understanding of collection and treatment
                                                          The potential cost savings and other factors,
    system performance.
                                                          such as regulations related to water quality, will
•   Improving long-term control plan (LTCP)               likely stimulate the water industry to invest in
    implementation, modification, and                     smart data infrastructure and increasingly adopt
    development.
                                                          the management of data-driven monitoring and
•   Meeting regulatory requirements.                      control systems in the operation of various
•   Prioritizing critical assets and future capital       combined sewer, separate sewer, and municipal
    planning.                                             separate storm sewer systems.

                                                      2
Smart Data Infrastructure for Wet Weather Control and Decision Support August 2018
In the future, data feeds and cognitive
computing could significantly assist system
managers by providing near-instantaneous
support information for many of the routine and
immediate response decisions that must be
made in both the municipal and industrial
sectors. Transformation may help water and
wastewater utilities take advantage of
innovations and opportunities in future
operation and maintenance (O&M)
(see Figure 1).
Figure 1. Better information and data can lead to
more effective O&M
Roadmap for Implementing Smart Data Infrastructure
There are few, if any, insurmountable technological barriers to implementing the various technologies described
in this document. Real-time control technology (Section 5), for example, has been around for nearly 30 years.
While its implementation in collection systems remains relatively limited, the effectiveness of real-time control
technology has been proven in many successful applications in wastewater treatment plants (U.S. EPA 2006).
When selecting technology and level of complexity, it is important to understand the utility’s priorities and needs
(e.g., O&M, information technology, security, data usage requirements). It is also important to remember that
smart data infrastructure is scalable. Utilities can start small, applying technology that is compatible with the
utility’s existing capacity to ensure full acceptance and utilization of that technology, then move toward a more
comprehensive approach with higher degrees of performance.
Regardless of the size or age of their infrastructure, utilities can benefit from this general roadmap for
implementing smart data infrastructure:
1. Vision for a utility of the future: Imagine how data, assets, and technology could be leveraged to benefit the
utility.
2. Schedule: Understand the capacity and timeframe for staff to accept change.
3. Technology evaluation: Validate data, prove benefits, and understand delivery.
4. Detailed planning: Seek funding and develop an implementation plan.
5. Phased implementation: Deploy the technology and associated platform.
6. Continuous improvement and innovation: Evaluate phase 1 performance and adapt the planning if
necessary.
Key considerations for developing and implementing the roadmap include the following:
• Ensure organizational commitment for staffing and budget needs. There will be initial investment, as well as
annual costs associated with the adoption of a technology.
• Communicate to ensure buy-in and support from all levels of management and foster strategic partnerships.
• Establish clear authority, roles, responsibilities, and communication channels.
• Define performance expectations.
• Educate and integrate team members early in the project.
• Provide continuous training and technical support to build the existing workforce’s capacity and attract a new
generation of workers.
3Smart Data Infrastructure for Wet Weather Control and Decision Support August 2018
3. Smart Data Infrastructure and Technologies:
Information Inputs
Smart data infrastructure can generate highly 3.1 Continuous Monitoring
informative data sets to support wastewater Continuous monitoring refers to permanent
and stormwater collection system decision- monitoring systems that report data back to a
making. These data sets help to answer critical central system for use. The physical quantities
questions that allow operators to maximize the to be monitored in a wastewater and
effectiveness and efficiency of system operation stormwater collection system for proper
(Figure 2); however, the usefulness of the data operation and control are relatively basic and
generated relies on accurate and relevant typically consist of flows, water levels, and
information inputs. rainfall conditions for dry and wet weather
operations. In addition, equipment (such as
The following sections describe specific
pumps, gates, and valves) status needs to be
strategies and technologies for generating
monitored to ensure safe O&M.
useful wastewater and stormwater collection
system data, including key considerations for Continuous monitoring when combined with
selection, design, implementation, and O&M. proper data analytics and effective visualization
These strategies and technologies include: can generate significant O&M savings by
providing real-time insight into system
• Continuous monitoring (Section 3.1)
conditions, which allows operators to prioritize
• Level monitoring (Section 3.2)
asset management with effective targeted
• Flow monitoring (Section 3.3)
maintenance. Some examples include level
• Rainfall monitoring (Section 3.4) trend detections that trigger alarms for
equipment maintenance (e.g., cleaning),
proactive inflow and infiltration (I/I) risk
assessment, and data-driven work scheduling
and asset management.
Continuous Monitoring in Practice
Milwaukee Metropolitan Sewerage District
(MMSD) is using continuous monitoring to
monitor the performance, value, and health
of green infrastructure throughout the city.
MMSD is monitoring 11 separate sites,
including installations in public rights of way,
allowing managers to see the combined and
Figure 2. Operational process supported by information inputs
individual performance of green roofs and
bioretention cells in real time. Every storm is
recorded, performance can be reported in
aggregate or by event, and the data can be
used to fine-tune maintenance intervals and
maximize performance.
4Smart Data Infrastructure for Wet Weather Control and Decision Support August 2018
Key considerations for continuous monitoring of Pressure transducers need to be submerged in
wastewater collection systems include the the water where the level must be monitored;
following: they are therefore convenient for applications
where sedimentation is not a significant issue.
• The nature of wastewater systems presents
They are typically used where water can be
a harsh and largely variable environment for
turbulent at the location of measurement.
monitoring equipment.
Stilling wells are usually recommended to install
• The selection and installation of equipment pressure probes away from potential debris in
needs to consider physical and hydraulic the water flow and for easier maintenance.
conditions, humidity, grit, sedimentation,
debris, and corrosion, as well as confined Ultrasonic level meters are also very common in
spaces and maintenance access. For wastewater applications and consist of installing
example, permanent monitoring equipment a probe mounted above the water surface. They
should meet explosive zone classifications. are usually preferred whenever space is
• The advertised measurement accuracy of available above the location where monitoring is
any sensor may not represent actual needed. Multiple makes and models are
performance; as such, it will need to be available on the market. Ultrasonic sensors are
calibrated/verified. recommended where minimal obstacles, FOG,
• Maintenance requirements, as well as or foam is present above the surface of the
hydraulic and physical conditions around water. The sensor must be mounted far enough
the monitoring equipment, should be from sidewalls to avoid bad readings due to
considered to balance out the increase in ultrasonic soundwave reflections.
cost and complexity to provide accurate
measurements. For example, forgoing some When monitoring space is small or when FOG
level of accuracy by selecting equipment can be found in the air above the water surface,
with easier maintenance needs can ensure Doppler radar microwave meters are
more reliable readings. recommended because they use a narrower
3.2 Level Monitoring signal beam that improves the reliability of the
Multiple technologies are used to monitor water measurement.
level in wastewater infrastructures. The most Capacitive probes are particularly suitable for
common types of sensors are pressure multi-point water level monitoring and are
transducers, ultrasonic level meters, microwave preferred when a high spatial resolution (of a
meters, and capacitive probes. Other discrete few millimeters) is necessary (e.g., for a reliable
devices for specific level detection, such as evaluation of stored volumes in big and flat
floating devices and vibrating level sensors, storage facilities). The main advantages of these
could be used in some cases. The most probes are that the sensors are easy to clean
important criteria for selecting a specific and can handle temperature and pressure
technology will depend on the environment and variations. However, these sensors can
infrastructure configuration where level must be significantly disturb the flow and should not be
monitored. More precisely, conditions such as used in small pipes.
the presence of turbulences and sedimentation
in the water or the presence of fats, oils, and In general, sensors located above the water
grease (FOG); foam; and obstacles in the air surface have less O&M, but are subject to
space above the monitoring location must be corrosion and may experience issues with ice in
considered to select appropriate technologies. cold environments.
5Smart Data Infrastructure for Wet Weather Control and Decision Support August 2018
For locations where monitoring the water level measurements with an accuracy from ±10
is critical, redundant sensors based on different percent to 20 percent. Non-submerged flow
technologies are recommended. This strategy meter technologies will provide flow
would consist of using, for example, an measurements with an accuracy typically
ultrasonic meter and a pressure sensor in a ranging from ±15 percent to 30 percent. The
storage facility to ensure water level monitoring cost for procurement, installation, and
in all conditions and to maximize the availability maintenance of “non-contacting” devices is
of measurements for safe infrastructure lower than submerged technologies. A
operation. permanent flow meter installation in sewers
typically ranges from $15,000 to $75,000, and
3.3 Flow Monitoring can be even higher if significant work is needed
Operators can use several technologies and for the infrastructures and the electrical utilities.
methods of flow monitoring to better Regular maintenance for cleaning, inspection,
understand the characteristics of their collection and calibration is recommended at least twice a
systems. year to keep monitoring reliable and accurate.
3.3.1 Physical Flow Monitoring 3.3.2 Alternative Flow Monitoring
Typical commercial flow meters available on the
Technologies
market include ultrasonic Doppler devices,
In some cases, where installing a physical flow
acoustic Doppler sensors, transit time effect
meter becomes too complex or expensive,
sensors, and newer technologies such as
indirect means of flow monitoring can be
Doppler radar sensors and laser Doppler meters.
developed depending on specific hydraulic
Flow meter technology has been developed to
conditions.
fit a variety of applications; submerged and
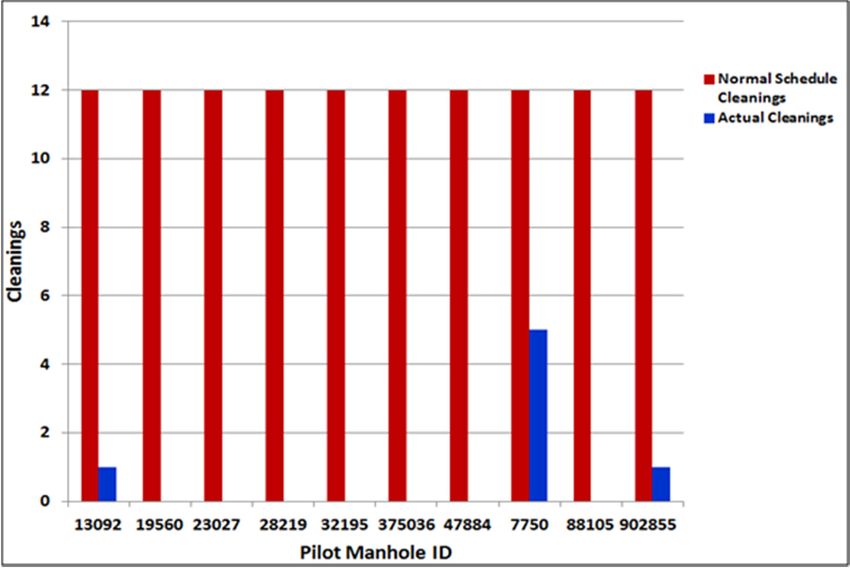
“non-contacting” devices (sensors located above Implementing Monitoring Technology to Improve
the water surface) are available. Transit time Operations
effect technologies consist exclusively of The San Antonio Water System (SAWS) recently
installing one or multiple pairs of probes (a pair participated in a study on the use of monitoring to
includes one transmitter and one receiver) in a inform cleaning maintenance programs. SAWS
crossing path within the water stream. These equipped 10 high frequency cleanout sites with
probes can measure water velocity at different remote field monitoring units and used analytical
software to monitor day-over-day level trend
layers in the conduit to compute flow values changes and receive messages for trend anomalies.
according to water level and pipe section. This analysis of the real-time monitoring data
Submerged technologies are generally detected small but potentially important changes in
recognized as being more accurate because they water levels. These data enabled users to consider
can measure the different velocities that can co- actions such as a site inspection or cleaning. Based
on the monitoring data, SAWS reduced cleaning
exist within a water flow section at the same
frequency by 94 percent in the study areas. Other
time, while non-contacting technologies can than a short period in May/June 2016 when nearly
only measure the velocity from the surface of 16 inches of rain overwhelmed the SAWS system,
the water stream. there were zero sanitary sewer overflows at the pilot
locations.
Practical experiences of wastewater flow
monitoring within sewer pipes ranging from 24
inches to 120 inches in diameter and above Level to flow relationship: When pipe flows
have shown that submerged flow meter remain under “free surface flow” conditions,
technologies will generally provide Manning equations can be used to estimate
6Smart Data Infrastructure for Wet Weather Control and Decision Support August 2018
flow (based on water level sensor data) and of the mechanical device. Flow can then be
physical attributes (pipe shape and dimensions, estimated using the corresponding flow and
slope, pipe material for the roughness factor) at weir angle relationship charts provided by the
the level sensor location. However, the flow manufacturer.
estimation is invalid when the flow experiences
Flap gate equations: Similar to bending weir
surcharged conditions or backwater effects are
relationships, mathematical functions can be
present.
developed for computing flows through flap
Equations of flow under the gate: When gates. These relationships will require installing
modulating gates are used for flow control, gate an inclinometer on the flap gate and a level
position and water level data upstream and meter upstream of the gate. A downstream
downstream from the gate can be used to level meter will also be required for situations
efficiently compute the flow regulated through where the flap gate can become submerged.
the gate. The mathematical formula would also Typically, a temporary flow meter calibrates and
consider the gate’s hydraulic conditions and validates the equation.
physical dimensions, the regulation chamber,
Model-based flow computations: Most utilities
and connection pipes. Optimal gate position
have developed a calibrated hydrological and
(i.e., amount of submergence) can vary
hydraulic model (e.g., EPA SWMM 5) to
depending on gate size and flow velocity and
adequately represent their wastewater system.
must be determined through hydraulic analysis.
These models are typically used to plan, design,
Based on several facilities’ operations using this
and produce engineering diagnostics. They can
method, the relative error is under 5 percent
be configured for real-time simulations, based
during dry flow conditions and around 15
on real-time rainfall and level data or forecasted
percent in wet weather conditions.
radar rainfall, to provide flow values virtually
Weir relationship: A common mathematical everywhere within the wastewater collection or
means of computing flow values uses level stormwater system. A well-calibrated hydraulic
monitoring data from a static weir upstream. model is recognized for providing flow values
Specific formulas must be used depending on within an accuracy range from -15 percent to
the shape of the weir, the physical dimensions +25 percent (WEF 2011).
of the weir (length, width), and the angle of the
flow stream according to the weir. This method 3.4 Rainfall Monitoring
can provide fairly accurate flow values for weirs A typical rainfall monitoring system deploys a
under 6 feet in length; weir relationship network of spatially located rain gauges that
calculations involve significant uncertainties for allow for representative measurement of
longer weirs. rainfall quantities over a region. As a general
rule for guidance, on average, one rain gauge is
Bending weir relationship: Bending weirs recommended for every 500 hectares (1,235
consist of mechanical flap gate devices with pre- acres) of coverage (Campisano et al. 2013),
determined weights that are designed to although coverage needs vary depending on
maintain a specified water level on the local climate and need for predictive accuracy.
upstream side of the equipment. When inflows
cause the upstream level rise, the bending weir Common rain gauges use tipping bucket
reacts by opening to evacuate excess flow. An systems—either optical or mechanical—that
inclinometer can be installed on the bending count the quantity of rain trapped in a
weir’s flap gate to monitor the angular opening calibrated cylinder. Each bucket tip will count a
7Smart Data Infrastructure for Wet Weather Control and Decision Support August 2018
specific quantity of rain (e.g., 0.005 inch) over a combined with radar reflectivity data and
specific time increment. rainfall predictions, flow forecasts can be
provided with a more accurate level over the
Such rainfall monitoring can be made available
entire territory. Generally, rainfall forecasting
in real time and can be used as inputs to a
windows and grid sizes should be proportional
hydraulic model to compute flow predictions in
to the hydrologic element’s longest time of
the sewer collection system. The flow
concentration in the tributary collection system
predictions can then be used to determine the
where control is desired—e.g., a large combined
time of concentration of the area tributary to
sewer overflow (CSO). Rainfall forecasts should
the monitoring location. In addition, when
cover at least two hours ahead.
4. Collection System Optimization
A key benefit of smart data infrastructure is its time, a process often referred to as “real-time
application in system optimization to maximize control” (RTC). RTC systems are discussed in
existing infrastructure investment and reduce greater detail in Section 5 of this document.
the need for future capital investment. It
Table 1 presents the data used in a smart data
provides the framework required to optimize
infrastructure approach, regardless of
the design and O&M of wastewater and
optimization type.
stormwater systems by collecting and analyzing
large data sets.
There are two types of system optimization.
One refers to system improvements that are Optimizing Collection System Capacity and
applied offline (Muleta and Boulos 2007). Some Performance
typical examples include raising weirs to reduce
The Philadelphia Water Department (PWD) has
overflow discharge, developing best efficiency
committed to reducing 7.9 billion gallons of
curves to minimize energy costs and reduce overflows in the city by 2036 through better
equipment breakdowns, or optimizing the stormwater runoff management. As part of this
placement of localized stormwater management effort, PWD, in collaboration with a private
and green infrastructure control. For example, corporation, implemented smart data
the EPA SUSTAIN modeling framework uses an technology to monitor and maximize the
performance of an existing stormwater
optimization approach to identify the least cost
retention basin. The existing basin was
and highest benefit solutions to achieve user- retrofitted with technology to monitor basin
defined objectives (U.S. EPA 2009). water level and precipitation, as well as to
provide real-time active control to selectively
The second type of system optimization is discharge from the basin during optimal times,
applied online to actively manage the operation effectively increasing the useful capacity of the
of wastewater networks and facilities in real asset.
8Smart Data Infrastructure for Wet Weather Control and Decision Support August 2018
Table 1. Data Required to Optimize the Design, Operation, and Maintenance of Wastewater and Stormwater
Systems
Data Required
Objective Cause of Problem Potential Intervention
for System Optimization
Eliminate • Rainfall-derived I/I • Pipe replacement • Level and flow measurements
sanitary sewer • Undersized pipes • I/I mitigation measures • Sewer and land characteristics
overflows
• Cost of potential interventions
• Grease, debris, and • Improved operating • Level, velocity, and flow
sedimentation procedures measurements
buildup • Pipe replacement • Camera inspection
• Cleaning (pipes streets) • Cost of potential interventions
• Flushing systems
• Pipe breaks • Repairs • Flow measurements
• Leaking manholes • Pipe replacement • Camera inspections
• Offset joints • Smoke testing
• Cost of potential interventions
Minimize • High electricity • Pump replacement • Time-of-use electricity tariffs
operating costs consumption for • Use of variable frequency • Level and flow measurements
pumps and gate drives • Critical elevation for basement
operation
• Improved set points and street flooding
• Improved controller • Gate, pumps, and actuator
parameters characteristics
• Cost of potential interventions
Minimize • High equipment and • Repairs • Level and flow measurements
maintenance sensor failure rate • Replacement • Equipment and sensor history
costs
• Re-localization • Equipment inventory and cost
• Preventive and predictive • Detailed alarms
maintenance • Maintenance and calibration
• Best efficiency point history
• Cost of potential interventions
• Sedimentation issues • Improved operating level • Level and velocity
• Sewer modification to measurements
increase velocities • Camera inspections
• Flushing devices • Cost of potential interventions
Minimize CSOs • Rainfall-derived • Upgrade of existing • Level and flow measurements
inflow facilities • Sewer and land characteristics
• Undersized facilities • Addition of green and • Operational and physical
(conveyance, storage grey infrastructure constraints
treatment) • RTC implementation • Cost of potential interventions
Reduce flooding • Rainfall-derived • Upgrade of existing • Level and flow measurements
risks inflow facilities • Sewer and land characteristics
• Undersized facilities • Addition of green and • Operational and physical
(conveyance, storage) grey infrastructure constraints
• RTC implementation • Critical elevation for basement
and street flooding
• Cost of potential interventions
9Smart Data Infrastructure for Wet Weather Control and Decision Support August 2018
4.1 Capacity Management Operation conditions. Such approaches help ensure that
and Maintenance and I/I Control the collection system capacity is maximized for
Optimizing the performance of the collection wastewater conveyance, which is a critical
system is the key component in capacity component of all CMOM programs. In addition
management operation and maintenance to direct monitoring, flow rate and level
(CMOM) programs. CMOM programs combine metering data can be used along with asset
standard O&M activities with an increased level management data to predict the “unmetered”
of data gathering and information management portions of a collection system and determine
to more effectively operate collection systems. other areas at risk of capacity-related issues,
Smart data infrastructure, equipped with the such as high I/I.
data input tools described in Section 3, can help Facilities can use smart data infrastructure
accomplish this. Successful CMOM programs are tools—such as real-time metering and
used to identify and mediate capacity-related information analysis—to understand the
issues in a system, reducing the risk of system different variables that impact collection system
failures such as sanitary sewer overflows (SSOs). capacity and performance. This knowledge
CMOM includes I/I control, the process by which would allow utilities to better plan for necessary
unintended clearwater sources (e.g., capital expenditures and optimize system
groundwater and excess stormwater) exceed performance for current and future needs.
the design capacity of a collection system,
typically due to antiquated, deteriorating, or
Using Smart Data Infrastructure and RTC to
inadequately maintained infrastructure. Long-
Reduce CSOs
term flow and level metering data can be
analyzed to determine performance trends over Louisville Metropolitan Sewer District (MSD)
a long period of time. Historical trends of I/I was an early adopter of RTC, applying inline
peak flow rates and volumes can be used to storage since the 1990s and pioneering the
application of global optimal and predictive RTC
identify areas with high rates of I/I, prioritize
that has been in operation since 2006. The RTC
removal efforts, and evaluate the costs/benefits system is key to maximizing the MSD’s
of those efforts. conveyance, storage, and treatment capacity to
reduce CSOs, with consistent operational results
Real-time flow rate and level data collection can capturing more than 1 billion gallons of CSO
be used to identify localized capacity limitations, volume annually. Incorporating RTC into MSD’s
blockages, and sediment accumulation. These LTCP has resulted in approximately $200 million
data can then inform more proactive in savings compared to traditional methods.
management approaches that can reduce
overflows in both dry and wet weather
5. Real-Time Control Systems
RTC can be broadly defined as a system that during both dry and wet weather conditions
dynamically adjusts facility operations in (U.S. EPA 2006).
response to online measurements in the field to
Wastewater systems are often purposefully
maintain and meet operational objectives
oversized to provide a factor of safety. This
10Smart Data Infrastructure for Wet Weather Control and Decision Support August 2018
extra capacity can provide short-term storage in
Using RTC to Maximize Capacity and
the conveyance and treatment system when Performance
rain falls unevenly across the collection system
and varying runoff lag times that introduce In 2008, the city of South Bend, Indiana, installed
and commissioned a real-time monitoring system
stormwater into the system. RTC presents
of more than 120 sensor locations throughout the
opportunities to optimize full system capacity city. In 2012, the city and its partners
for both existing and proposed facilities. commissioned and distributed a globally optimal
Potential benefits include receiving water RTC system to maximize the capacity and
quality protection, energy savings (Tan et al. performance of the city’s collection system. Since
2012, the city has added additional sensor
1988), flow equalization, reduced flooding,
locations and rain gauges, bringing the total
integrated operations, and better facility number to 152 sites. It also added automated
planning (Gonwa et al. 1993). Real-time or near gates at several stormwater retention basins to
real-time reporting can also help utilities meet better control when and at what rate stormwater
the public notification requirements for CSO and is released downstream into the combined
SSO discharges. system. In the period from 2008 through 2014,
South Bend eliminated illicit dry weather
A well-designed RTC system can address a overflows and reduced its total CSO volume by
number of different operational goals at roughly 70 percent, or about 1 billion gallons per
year.
different times. Examples of operational goals
include (U.S. EPA 2006):
conditions. If required, temperature, infiltration
• Reducing or eliminating sewer backups and rate, and water quality parameters (e.g., total
street flooding.
suspended solids, nitrogen) can be monitored in
• Reducing or eliminating SSOs. real time and integrated into the RTC
• Reducing or eliminating CSOs. management strategy. Associated benefits of
RTC application in stormwater management
• Managing/reducing energy consumption.
include:
• Avoiding excessive sediment deposition in
the sewers. • Optimizing the design and sizing of control
measures.
• Managing flows during a planned
(anticipated) system disturbance (e.g., • Reducing the frequency of flooding.
major construction). • Improving water quality with extended
• Managing flows during an unplanned (not residence time.
anticipated) system disturbance, such as • Increasing stormwater harvesting and reuse.
major equipment failure or security-related
incidents. • Adapting to evolving conditions through
operation change rather than new
• Managing the rate of flow arriving at the infrastructure.
wastewater treatment plant.
• Providing auditable performance and
The application of RTC in a stormwater system is supporting data from the monitoring system
similar to that of a wastewater system. It components without additional costs.
requires continuous monitoring (e.g., water
• Reducing O&M costs by issuing alerts in real
level, rainfall, weather forecast), control devices time.
(e.g., valves, gates), and data communication to
actively manage flows and adapt to changing
11Smart Data Infrastructure for Wet Weather Control and Decision Support August 2018
5.1 Components of an RTC System
Figure 3 presents a typical layout of the boxes, and the arrows that connect them
components that might be included within an indicate the communications and data that are
RTC system. Some components are essential for passed on between the components.
RTC (e.g., sensors, meters), while others may be
optional depending on the desired level of
control. The components are represented with
Figure 3. Components of an RTC system
An RTC system, at a minimum, includes sensors embedded (programmed) into the PLC. These
that measure the process, control elements that rules are feedback algorithms, where action is
adjust the process, and data communication based on the difference between a set point and
between them (Schilling 1989). Typical control the measured variable. For example, a PLC may
elements for a wastewater system are be programmed to maintain a certain level in
regulators, such as pumps (constant or variable the wet well and will reduce the flow through
speed drives), gates (sluice, radial, sliding, the pump if the level is too low or increase it if
inflatable), and adjustable weirs (bending weir, the level is too high. The PLC programs can
weir gates). include set points that are defined locally and
receive “remote” set points from a central
At each remote site, sensors are connected to
server.
the inputs of the local RTC device—in most
cases, a programmable logic controller (PLC) or 5.1.1 Supervisory Control and Data
remote terminal unit. The PLC provides outputs Acquisition Systems
(control set points and signals) to the control Supervisory control and data acquisition
elements (e.g., gates, pumps) based on the rules (SCADA) systems have become more prevalent
12Smart Data Infrastructure for Wet Weather Control and Decision Support August 2018
in the wastewater industry for collecting and standard graphical user interface (GUI) tools
managing monitoring data. SCADA is a control that operators can access, and it allows them to
system architecture that uses computers, manually override any remote site control
networked data communications, and graphic actions at any time. As the needs for real-time
user interfaces for high-level process or near real-time public notifications rise,
supervisory management. Large SCADA systems centralized data management can facilitate data
have evolved to be increasingly similar in sharing and enable greater transparency.
function to distributed control systems, which
RTC and CSO Control
are widely used for process control at the
treatment plants. SCADA system designs have The Metropolitan Sewer District of Greater
taken full advantage of advances in information Cincinnati (MSDGC) has one of the most challenging
collection systems in the country to manage during
technology (IT) to collect, archive, and process
wet weather, as it contains more than 200 CSO
large amounts of data. points. Together, these overflows discharge over 11
billion gallons of sewage into the Ohio River and its
A SCADA system’s fundamental purpose is to
tributaries annually. In 2014, MSDGC began
communicate data and control commands from installing sensors throughout its largest watershed.
a centrally located operator to geographically By early 2016, MSDGC had gained both real-time
dispersed remote locations in real time. The visibility and control of its wastewater system in this
communication technology options include watershed and transformed the wastewater
telephone-based transmission (used in early collection system into a “smart sewers” network. To
date, MSDGC’s smart sewer system covers over 150
SCADA systems due to low cost), fiber-optic square miles (approximately half) of its service area,
cable, radio system, cellular-based incorporating two major treatment plants, six wet
communication, wireless internet access, and weather storage and treatment facilities, four major
satellite-based systems. interceptor sewers, 164 overflow points, and 32 rain
gauges and river level sites. Remote monitoring has
Designing a SCADA system depends on a wide improved the maintenance of wet weather facilities
range of practical considerations, including but and enabled upstream facilities to account for
not limited to equipment enclosures, downstream interceptor conditions, increasing
overflow capture basin-wide during wet weather.
environmental conditioning, field interface
wiring, system documentation requirements, 5.2 Real-Time Decision Support
system testing requirements, IT requirements, Systems
and cybersecurity. A real-time decision support system (RTDSS)
generally overlays the SCADA system. It is
As utilities invest in continuous monitoring and
connected to the SCADA database to retrieve
SCADA, the generated data must be regarded as
system status information. An RTDSS can use a
an important investment to extract maximum
SCADA historian and GUI to program and display
values. According to the U.S. Geological Survey,
system status and trends (e.g., abnormal flow,
“poor data quality, redundant data, and lost
critical water level alarm) or provide additional
data can cost organizations 15 percent to 25
dashboards involving data analytics to support
percent of their operating budget” (USGS n.d.).
O&M decision-making. In an RTC system, an
Information captured in the field needs to be RTDSS performs complex calculations based on
communicated from the remote stations to the information inputs to inform operational
computers and systems that will process, store, decisions and help determine optimal system
and archive it. The SCADA system is considered set points (e.g., flow to be pumped, water level
the backbone of an RTC system. It includes to be maintained in a wet well or pipe length).
13Smart Data Infrastructure for Wet Weather Control and Decision Support August 2018
Typically, decision support uses advanced Local control, or a local reactive control system,
computing algorithms that are interactive and is the simplest form of automatic control. Local
multi-objective and often involve using an control is used to solve specific issues that only
online model for weather forecasting. require information collected near a regulator
and is usually implemented as single-input,
5.3 Level of Control single-output feedback loop designed to
The RTC system can be automated with a maintain prescribed set points (e.g., flow or
centralized or distributed control technology. level set points). It is a good solution only if the
The main difference is the control and the control objectives pursued can be reached
input/output subsystems. In distributed control without transferring any information between
architectures, the number and quality of central other remote sites.
processing units (CPUs) is determined by the
number of modules. Each module has a Regional control is similar to local control
controller, and the system usually features a except that a telemetry system is required to
central master PLC. The module PLCs automate exchange data with other remote sites. Regional
their respective areas and usually do not include control can be implemented as a distributed or
visualization features. centralized system built on a SCADA system.
Some municipalities design their own decision
A central architecture usually features a support system to control the collection system
computer, which deals with all tasks such as based on the specific constraints and
input/output connections, PLC, and control. opportunities of each control site. However, the
Computing capacity, therefore, must be control remains reactive, not predictive. Based
significantly higher than that of a distributed on a reactive process, there are limitations in
control technology system. There is only one the distances between the control structures
CPU, which means that only one such spare part and measurements; as such, the operation must
is needed. RTC system design criteria drive the remain conservative and suboptimal.
selection of a control system platform based on
the physical and logical components of the Global control is necessary when the control
system. objectives require strong coordination of the
control actions at numerous remote sites on a
Regardless of the control platform, RTC can be system-wide level. The set points are usually
implemented using different levels of control, computed and refreshed periodically (e.g., every
including local, regional, and global. The levels five to 15 minutes). The global strategy used to
of control are classified according to progressive determine the set points includes rule-based
increases in complexity, performance, and and optimization-based techniques (Figure 4).
benefits (Schütze et al. 2004). Rule-based control considers possible scenarios
These set points can be displayed to the that can occur during wastewater system
operator for manual control or be sent back to operation and determines appropriate control
the SCADA system in real time for automated actions based on experience. The rules are
control of remote sites. The algorithms used to generally easy for operators to implement and
determine control logics and set points vary in understand. However, the quality and the
complexity from simple operating rules to performance of those rules highly depend on
complex mathematical optimization techniques the available expert knowledge. For large and
(Garcia-Gutierrez et al. 2014). complex wastewater systems, the strategy may
demand many rules.
14Smart Data Infrastructure for Wet Weather Control and Decision Support August 2018
Figure 4. Control strategies for wastewater utilities
Optimization-based strategies involve an Optimizing the collection system requires
optimization problem that represents the continuous and strategic adjustment of control
desired behavior of the wastewater system. devices, as well as predictions of upcoming
Various algorithms can be used to solve the inflows and their spatial distribution (Cartensen
optimization problem (e.g., model predictive et al. 1998). With proper conditions being
control, agent-based optimization). More monitored, acknowledged, and controlled, a
detailed descriptions of optimization strategies global RTC system considers the distribution of
and mathematical models can be found in flow in the entire system, both in current
Papageorgiou (1988) and Garcia-Gutierrez et al. conditions and in the future. By using a global
(2014). RTC, a utility has the ability to control flow by
opening and closing gates or pumps allows for
In the last 20 years, model predictive control has
transfer flow and storage capacity between
been the most extensively used optimization-
sites, thus providing the temporary storage and
based strategy. This approach uses a
controlled release of significant volumes of
mathematical model of the wastewater system
wastewater.
to generate a sequence of future actions—
within a finite prediction horizon—that Table 2 summarizes which components of the
minimizes a cost function (Gelormino and Ricker overall system must work properly to support
1994). Interest in model predictive control is different control modes/levels (U.S. EPA 2006).
justified by its ability to explicitly express Notably, forecasting may be part of a rule-based
constraints in the system, anticipate future system, but it is not mandatory. A global RTC
system behavior, and consider non-ideal system often involves a mixture of lower levels
elements such as delays and disturbances. of RTC and static controls.
15You can also read