DEPARTMENT OF PUBLIC ENTERPRISES

     ANNUAL PERFORMANCE PLAN

                        2015/16
←
→
Page content transcription
If your browser does not render page correctly, please read the page content below
DEPARTMENT OF PUBLIC ENTERPRISES
ANNUAL PERFORMANCE PLAN
2015/16
2
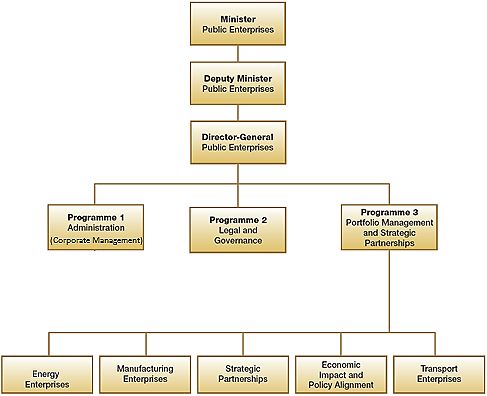
Table of Contents
FOREWORD BY THE MINISTER _________________________________________________________________________ 4
       Official sign-off .................................................................................................................................................................................................................... 6
       Glossary ............................................................................................................................................................................................................................... 7
PART A: STRATEGIC OVERVIEW ________________________________________________________________________ 11
  UPDATED SITUATIONAL ANALYSIS ......................................................................................................................................................................... 11
  REVISIONS TO LEGISLATIVE AND OTHER MANDATES .................................................................................................................................. 15
  OVERVIEW OF BUDGET AND MTEF ESTIMATES ................................................................................................................................................ 18
       3.1 Creating an efficient, competitive and responsive economic infrastructure network (Outcome 6) ............................................... 22
       3.2 Outcome 4: Decent employment through inclusive growth ..................................................................................................................... 26
       3.3 Outcome 5: A skilled and capable workforce to support an inclusive growth path ............................................................................ 27
       3.4 Outcome 7: Vibrant, equitable and sustainable rural communities with food security for all ........................................................... 29
PART B: PROGRAMME AND SUB-PROGRAMME PLANS ______________________________________________________ 30
  PROGRAMMES .................................................................................................................................................................................................................... 30
       4.1 PROGRAMME 1 – ADMINISTRATION AND CORPORATE MANAGEMENT .............................................................................. 30
       4.2 PROGRAMME 2 - LEGAL & GOVERNANCE .............................................................................................................................................. 37
       PROGRAMME 3 - PORTFOLIO MANAGEMENT AND STRATEGIC PARTNERSHIPS ...................................................................... 43
       4.1 ENERGY ENTERPRISES: ..................................................................................................................................................................................... 43
       4.2 MANUFACTURING ENTERPRISES ................................................................................................................................................................ 47
       4.3 TRANSPORT ENTERPRISES.............................................................................................................................................................................. 49
       4.4 ECONOMIC IMPACT AND POLICY ALIGNMENT ................................................................................................................................ 53
       4.5 STRATEGIC PARTNERSHIPS ............................................................................................................................................................................ 55
PART C: LINKS TO OTHER PLANS ______________________________________________________________________ 59
  5 LINKS TO THE LONG-TERM INFRASTRUCTURE AND OTHER CAPITAL PLANS ............................................................................ 59
  6 CONDITIONAL GRANTS ........................................................................................................................................................................................... 60
  7 STATE OWNED COMPANIES REPORTING TO THE DEPARTMENT ..................................................................................................... 60
       7.1 Alexkor ....................................................................................................................................................................................................................... 60
       7.2 Denel .......................................................................................................................................................................................................................... 62
       7.3 Eskom ......................................................................................................................................................................................................................... 63
       7.4 Pebble Bed Modular Reactor (PBMR) mention that PBMR is now with Eskom .................................................................................. 64
       7.5 South African Forestry Company ....................................................................................................................................................................... 64
       7.6 South African Express Airways............................................................................................................................................................................. 65
       7.7 Transnet ..................................................................................................................................................................................................................... 65

                                                                                                                     3
FOREWORD BY THE MINISTER
Ms Lynne Brown, MP
Over the past eight months, the Department of Public That is why I can announce that one critical milestone
Enterprises has commenced with putting in place the within sight is the commissioning of Medupi Power
building blocks to ensure that in the 2015/16 fiscal year Station‟s unit 6 towards the end of the first quarter of
there is an even greater working trajectory. the 2015/16 financial year. Although Medupi will add
800MW to the grid, this will relieve pressure on the
This includes a clear understanding of the Department‟s constrained grid. But we will not be out of the woods
role in relation to the Minister, as the Shareholder until the end of 2016.
Representative. In essence, the Department exists to
support me to obtain the best possible outcomes for I can confidently say that Eskom is expediting its build
the State, the fiscus and hence, all citizens of the programme for the construction of Medupi, Kusile and
country. Ingula power stations which are scheduled to supply an
additional 10 000 MW to the grid between June 2015
The Annual Performance Plan is critical as it once again and May 2020.
provides a detailed articulation of the Department‟s
activities and undertakings. With a portfolio of six SOCs eager to commence
revitalisation of effort towards the developmental
The Department has received an “in principle” objectives of the State, I am confident that the content
mandate to proceed with the development and submit of this APP does provide assurance in this regard to
the Government Shareholder Management Bill to me ensure that we leverage on SOCs. Transnet has
for consideration. The Bill will be aligned to the ambitions to lead increased volumes onto rail, giving a
recommendations of the Presidential Review life and relief to our roads with a target of 330 million
Commission (PRC) and Government‟s expectation of a tons shifted from road to rail by 2019 compared to the
coherent single piece of legislation for State Owned current 207 million tons. This is in spite of the coal
Companies (SOCs). business having under-achieved on its annual target of
95.151 million tons in 2014. The actual achievement
It would be naive to dispute that the current energy
for coal was 83,13 million tons in 2014, which
constraints are a major inconvenience and that the
represents a 12.6% under-achievement. Mitigation
disruptions caused by load shedding hinder economic
measures, lessons learned and renewed coordination
growth. Nevertheless the nation should rest assured
are some of the key signals for our renewed optimism.
that Government and its partners are doing all we can
during this trying time. Government has established National logistics and ease of business, by definition,
the War Room on Electricity to accelerate solutions should reap the rewards of this vision and safety factors
and this structure will continue as a mechanism to keep for our roads can be capitalised on.
the nation informed of our plans to ensure adequate
electricity supply and diversified energy mix.
4We can congratulate the national freight carrier on Whilst we are sure to highlight success, we remember
improving its performance by 24% in terms of on-time that there is much work to be done.
train departures compared to the previous year and by
5% compared to budget; this was due to diligent The Department and the SOCs must infuse renewed
monitoring and follow-up on the root causes for urgency in efforts to deliver on the delivery of the
deviations. infrastructure build programme, with Transnet
continuing with the Market Demand Strategy to drive
Overall, financial sustainability of our SOC is the order sustainability and inclusive growth.
of the day within this APP and is explicitly outlined in
the DPE Strategy. One of the significance shareholder functions is the
ability to identify strong board members for SOCs.
CAPEX programmes across Eskom and Transnet will Board membership requires active and decisive leaders
substantially increase and perhaps see an injection into who collectively possess the ability to steer the
the already large collective asset value of these 2 SOCs company towards creating sustainable shareholder
currently at R740 bn. value and long-term growth for the SOCs and the
country. The Boards needs to be composed of
Denel continues to demonstrate a solid fiscal path and credible and expert directors given the strategic and
the APP seeks to capitalise on its increased value. The critical nature of the SOCs to the economy. To this
company, by June 2013, reported a R21 billion order end, I will continue reviewing and strengthening the
book, which increased to R30 billion by December Boards of the SOCs as it is a critical part of our
2013. This has enabled Denel to meet its plan of shareholder oversight function.
doubling revenues to R8 billion by 2018/19. Critical
has been securing the R10 billion contract from the It gives me great pleasure to table the Annual
Department of Defence to produce 238 Hoefyster Performance Plan for the 2015/16 fiscal year for the
infantry fighting vehicles (IFV) for the South African Department of Public Enterprises.
Army. 2 000 jobs are to be created at Denel and in the
related South African defence industry through this
contract. This attests to the DPE‟s oversight capacity,
which continues to improve.
Alexkor has delivered on Government obligations to
the Richtersveld Community, with a R120 million
upgrade of the Alexander Bay Township infrastructure
(roads, electrical and water reticulation and waste Ms Lynne Brown, MP
water treatment) having been completed on 31 March Minister
2013 and the town‟s registration confirmed on 22
November 2013. The value of property in the town
that will be transferred to the Community is estimated
at R200 million. This will be a highlight in the upcoming
financial year.
SAFCOL spent R6.591 million on socio-economic
development initiatives. This represents 3.3% of the
Net Profit After Tax (NPAT) - a significant achievement
compared to the Shareholder Compact (SHC) target of
1%. This trajectory is set to continue for the upcoming
financial year.
5Official sign-off
It is hereby certified that this Annual Performance Plan was developed by the management of the Department of Public
Enterprises under the guidance of Ms Matsietsi Mokholo, Acting Director-General, and was prepared in line with the
current Strategic Plan of the Department of Public Enterprises.
It accurately reflects the performance targets which the Department of Public Enterprises will endeavor to achieve given
the resources made available in the budget for the 2015/2016 financial year.
Mr Gcina Hlabisa
Signature:
Date: 19/03/2015
Director: Strategy
Ms. Tintswalo Mofokeng
Signature:
Date: 19/03/2015
Acting Chief Financial Officer
Mr Mzwandile Radebe
Signature:
Date: 19/03/2015
Acting Deputy Director-General: Corporate Management
Ms Matsietsi Mokholo
Signature:
Date: 19/03/2015
Acting Director-General
Approved by:
Ms Lynne Brown, MP
Signature:
Date: 19/03/2015
Minister
6Glossary
Below is a glossary of acronyms used in the Department of Public Enterprises
ACSA Airports Company of South Africa
AFDB African Development Bank
AGM Annual General Meeting
APP Annual Performance Plan
BB-BEE Broad Based Black Economic Empowerment
CAPEX Capital Expenditure
CFO Chief Financial Officer
CS Corporate Services
CSDP Competitive Supplier Development Programme
DAFF Department of Agriculture, Forestry and Fisheries
DCT Durban Container Terminal
DEA Department of Environmental Affairs
DG Director-General
DDG Deputy Director-General
DHET Department of Higher Education and Training
DM Deputy Minister
DMR Department of Mineral Resources
DOC Department of Communications
DOD Department of Defence
DOE Department of Energy
DOT Department of Transport
DPE Department of Public Enterprises
DRDLR Department of Rural Development & Land Reform
DTI Department of Trade and Industry
DTPS Department of Telecommunications and Postal Services
EDI Electricity Distribution Industry
EE Economic Equity
EIA Environmental Impact Assessments
EMP Environmental Management Plan
7ExCo Executive Committee
FET Further Education and Training
FMCG Fast Moving Consumer Goods
FOSAD Foundations of Security Analysis and Design
FSN Full Services Network
GCH Gross Crane Move per hour
GFB General Freight Business
HR Human Resources
ICASA Independent Communications Authority of South Africa -
ICT Information and Communication Technology
IGR Inter-Governmental Relations
IP Intellectual Property
IPO Initial Public Offering
IPP Independent Power Producers
IRP Integrated Resource Plan
ISMO Independent System and Market Operator
EIPA Economic Impact Policy Alignment
JV Joint Venture
KLF Komatiland Forests
KPI Key Performance Indicator
LTTS Long Term Turnaround Strategy
MDS Market Demand Strategy
MISS Minimum Information Security Standards
MOU Memorandum of Understanding
MTEF Medium-Term Expenditure Framework
MTSF Medium Term Strategic Framework
MYPD Multi- Year Price Determination
NCPM National Corridor Performance Measurement
NDP National Development Plan
NEDLAC National Economic Development and Labour Council
NERSA National Energy Regulator
NGP National Growth Path
8NT National Treasury
PAIA Promotion of Access to Information Act
PBMR Pebble Bed Modula Reactor
PICC Presidential Infrastructure Coordination Commission
PFMA Public Finance Management Act
PPP Public-Private Partnerships
PRC Presidential Review Committee
PSJV Pooling and Sharing Joint Venture
PSP Private Sector Participation
R&D Research and development
RBCT Richard Bay Container Terminal
RMC Richtersveld Mining Company
SAA South African Airways
SAAT South African Airways Technical
SAFCOL South African Forestry Company Ltd
SAQA South African Qualification Authority
SAX South African Express Airways
SCM Supply Chain Management
SIP Strategic Integrated Projects
SLA Service Level Agreement
SOCs State Owned Companies
SSA State Security Agency
TEU Twenty-foot Equivalent Unit
TNPA Transnet National Ports Authority
TOR Terms of Reference
TFR Transnet Freight Rail
WACS West Coast Submarine Cable
9The table below lists the SOCs that report to the Minister:
Name of Entity Legislative Mandate Minister‟s Financial Nature of Operations
Relationship with the
SOCs
Alexkor Alexkor Limited Act 116 of Shareholder A diamond mining company that operates primarily
1992 Representative in Alexander Bay and the greater Namaqualand
area.
Denel None Shareholder A defence company and although it was established
Representative as a private company, in terms of the Companies
Act of 2008, Government exercises full control
over the company.
Eskom Eskom Conversion Act 13 of Shareholder Eskom generates, transmits and distributes
2001 Representative electricity to industrial, mining, commercial,
agriculture and residential customers and re-
distributors.
South African Forestry Management of State Forests Shareholder The South African Forestry Company Limited is the
Company Act 128 of 1992 Representative Government's forestry company. It conducts
timber harvesting, timber processing and related
activities, both domestically and regionally.
South African Express South African Express Act 34 Shareholder South African Express is the domestic and regional
of 2007 Representative air carrier with a mandate to be an African airline.
Transnet Legal Succession to the Shareholder Transnet is a freight and logistics company
South African Transport Representative responsible for pipelines, ports, and rail transport
Services Act 9 of 1989 infrastructure and operations in South Africa.
10PART A: STRATEGIC OVERVIEW
UPDATED SITUATIONAL ANALYSIS
Understanding the Environment
The National Development Plan (NDP) defined the structural challenges that the South African economy currently faces
to respond to these structural challenges, a series of actions have been proposed that need to be implemented within a
specified timeframe. These actions will require significant improvement in the capacity of the state. These also include the
further repositioning of the SOCs to strengthen their role in the economy. The NDP indicates that for the triple
challenges of poverty, unemployment and inequality, the state needs to play transformative and developmental role. This
requires well and effectively coordinated institutions.
Industrialisation and economic nationalisation are key drivers of the developmental state. A crucial aspect of the
industrialisation project is to grow the manufacturing sector and promote foreign direct investments. Economic
nationalism is about stimulating export led growth and increasing beneficiation. In the South African context, these two
elements appear starkly in the focus that the government places on economic development and how it enables this
development through its various policy measures (e.g. the NDP and the National Industrial Policy Framework), which
accomplish high level national objectives (e.g. Industrialisation)1.
Being a developmental state and driving industrialisation as well as economic nationalism imposes a number of
responsibilities on the South African government. Firstly, for South Africa to grow, its focus must be placed on the
following key drivers of growth, namely: investment in the economy, creating an enabling policy framework that will
support the growth of the productive sectors, facilitating private sector investments and raising exports. These have been
outlined in Chapter 4 of the NDP.
South Africa has historically not fared as well as it could within the context of these drivers of growth. Between 2002 and
2007, the South African economic growth accelerated but was negatively affected by the global financial crisis. As seen in
figure 1 below, the country has experienced weak economic growth since the 2008 global recession. The growth rate
has been insufficient to meet target levels of between 3% - 5%. Capital formation has itself experienced some challenges.
Gross Fixed Capital Formation (GFCF) has not been a priority leading up to 20052; this has resulted in slow growth and
had a negative impact on local industry and human capital. In addition, this poor investment performance has stifled the
country‟s manufacturing capabilities. In the period between 2009 and 2014 the government began to lay a foundation
for accelerated investment in the economy with the creation of the Presidential Infrastructure Coordination Commission
(PICC), the 20 Year Infrastructure Plan and the Infrastructure Development act, however, this has not been enough to
create an infrastructure network capacity to support the productive sectors of the economy. Finally, the country‟s
balance of payment has remained low over the past 10 years and this has been reflected in the weak economic
environment and a depreciating currency.
1 National Industrial Policy Framework, 2007
2 SARB Quarterly Bulletin, 2014
11Figure 1: Economic Trends
Amidst all of this, the importance of the role of the State has been reinforced. State intervention within the context of a
developmental state is crucial for economic development, particularly in light of the large scale of investment required
and the associated risks.
However, key levers have to be pulled by the State in order to place the country on the growth trajectory that will
enable the developmental state to realise outcomes defined in the National Development Plan.
These levers are:
Strategy
Develop national policy to steer and direct South Africa on a sustainable growth path;
Unite the public sector, business, labour and civil society in a partnership geared to implement this shared
programme;
Establish clear, measurable and time bound targets for common programmes, and for monitoring their
implementation; and
Inter-governmental and integrated planning across spheres of government and between different governmental
departments.
Financing
Ensuring prudent macroeconomic policy and counter cyclical fiscal management measures; and
Provision of guarantees to facilitate required investments where necessary to do so.
Technology
Systematically enhance South Africa‟s existing technological capacity;
Proactively respond rapidly to global technology developments and to partner with the private sector to access
new technologies; and
Translate broad objectives into programmes and projects and to ensure implementation.
12In summary, these three levers are required to be executed upon by the State, given the scale, complexity and
associated risks of the requirement to develop the economy. Furthermore, institutional innovations across all levels of
Government will be required to facilitate this growth. The NDP and other policy framework such as the New Growth
Path (NGP) and the Industrial Policy Framework provide the overarching framework required to change the structure of
the economy.
The Minister as shareholder representative acting on behalf of Government is supported by the Department in
execution of her shareholder responsibilities. As a Department, DPE seeks to maximise the overall financial and
operational benefits derived from Government continued ownership of the SOCs at the same time, to successfully
execute its mandate. We (DPE and its portfolio of SOCs) need to generate shareholder value and enjoy public
confidence.
Therefore, to protect State investments in the SOCs, the Department is required to explore alternative and innovative
funding mechanism to support SOCs needs.
Figure 1: Major Under-investment in South African Infrastructure
The 2015/16 Annual Performance Plan (APP) is targeted to implement the Strategic Plan of the Department for the
current administration period (2014-2019). The APP outlines the Key Performance Indicators that must be pursued by
the Department to realise its strategy and outcomes. The focus in the current financial year (2015/16) is to ensure that
SOCs within the Department‟s portfolio remain financially stable for them to be able to advance the developmental
mandate.
13Organisational Structure
14Overview of Programmes
PROGRAMME 1 - ADMINISTRATION AND CORPORATE MANAGEMENT
Ministry Minister
Deputy Minister
Management Director-General
Corporate Management
Corporate Services Security and Facilities Management
Information Management and Technology
Chief Financial Officer Chief Financial Officer
Human Resources Human Resources
Communications Communications
Strategic Planning, M and E Strategic Planning, Monitoring and Evaluation
Inter-Governmental and Inter-Governmental and Stakeholder Relations
Stakeholder Relations
Internal Audit Internal Audit
Office Accommodation Office Accommodation
PROGRAMME 2 - LEGAL AND GOVERNANCE
Management
Legal
Governance
Risk
PROGRAMME 3 - PORTFOLIO MANAGEMENT AND STRATEGIC PARTNERSHIPS
Energy Enterprises
Management
Eskom
Manufacturing Enterprises
Management
Denel
Alexkor
SAFCOL
Transport Enterprises
Management
Transnet
South African Express Airways
Economic Impact and Policy Alignment
Management
Environmental Policy Alignment
Economic Policy Alignment
Transformation, Skills and Youth Development
Strategic Partnerships
Management
Project oversight
Funding Mechanisms
Supplier Relationships
REVISIONS TO LEGISLATIVE AND OTHER MANDATES
As the shareholder Ministry, on behalf of Government, the Department‟s mandate continues to evolve to ensure that
SOCs within its portfolio are clearly directed towards the prioritised outcomes. This is essential to support the execution
of Government‟s policy priorities. An overarching shareholder management process aimed at providing enduring
strategic rationale for the SOCs underpins this evolution.
15Expansion of the role of the SOCs within the current economic management framework, has required the Department
to introduce measures to ensure that SOCs contribute to the following:
Promotion of economic growth by facilitating development of new industrial capabilities through supplier
development and expansion of local content particularly in the build programme;
Expansion of training and skills development programmes to support the Government to develop skills required by
the economy;
Achievement of minimum standards of universal service and affordability for key services such as rail and electricity;
and
The correction of past social injustice.
While there is alignment between the SOCs activities, there are still challenges in relation to the shareholder function and
how it interfaces with other functions of Government e.g. policy making and regulatory functions. This challenge partially
contributes to the current performance of SOCs and their weaknesses. The development of the overarching legislation
for SOCs will begin to address this challenge.
The February 2015 Cabinet Lekgotla took a number of resolutions to support the strengthening of SOCs through the
implementation of the Presidential Review Committee (PRC) on SOCs. Consequently, the Department will be
developing legislation on the SOCs. The purpose of the legislation will be to codify the shareholder function and ensure
that there is a clear legislative framework to support the management of SOCs, clear delineation of roles, and clarity on
the required level of private sector involvement in SOCs businesses.
PENDING COURT CASES
Litigation remains a significant and inherent shareholder risk as the Minister (Shareholder Representative) is often cited as
a defendant whenever SOCs are sued. The Department continues to manage this risk by working closely with the State
Attorney‟s Office to reasonably extricate the Minister wherever possible. There are pending court case(s) against
Alexkor, Eskom and Transnet, the details of which may not be disclosed as they are sub-judice.
KEY EVENTS IMPACTING THE PORTFOLIO
Over the past twelve months major events occurred in the policy and SOCs operational environment that significantly
altered the Department‟s portfolio as well as the execution of the oversight mandate. The occurrence of these events
has been informed by both the need to strengthen Government‟s shareholder oversight, optimize its shareholding in
some key sectors as well as directly improve operational and financial performance of SOCs.
During this period, two SOCs were transferred from the Department to other Government Departments. These
transfers were informed by the need to optimise Government‟s shareholding and drive performance in areas that had
lagged behind.
Post the 2014 national election, Government resolved that there was a need to consolidate SOCs within the
Information and Communication Technology (ICT) sector. This consolidation is intended to support the rapid execution
of the South Africa Connect Strategy (broadband rollout policy) to ensure that universal broadband access is achieved by
2020. This consolidation will create the capacity within the State to drive broadband rollout in partnership with the
private sector.
In December 2014, Cabinet resolved to shift the oversight of SAA from the Department to National Treasury. Since the
adoption of the Long Term Turnaround Strategy in 2012, major progress was made to improve the technical and
operational performance of the company. However, these improvements were not accompanied by strong financial
performance. The transfer of oversight responsibilities to National Treasury will ensure that the financial performance of
the SOC is improved without compromising progress made on the operational performance. To achieve this, the
collaboration between the Department and National Treasury is necessary for the full turnaround of the Airline.
The current challenges on the electricity supply prompted Cabinet to adopt the Five Point Plan in December 2014. The
Plan is intended to accelerate the implementation of interventions to improve electricity supply and reduce demand in
the short to medium term. The Plan also contained emergency measures to stabilise and improve the generation plant
performance of Eskom.
16The interventions contained in the Five Point Plan have been incorporated into this APP as well as the shareholder
compact concluded between the Minister and the Eskom Board of Directors and will be cascaded down to the senior
executives.
The Department has already begun to implement interventions to improve the maintenance practices at Eskom as well
as the overall financial sustainability of the company. The Department endorsed the maintenance strategy of Eskom that
will ensure that units that were scheduled for maintenance were indeed taken down for servicing. This is critical for
arresting the rapid drop in the energy availability factor that declined from 94% in the early 2000/01 financial year to just
less than 75% in 2014/15 financial year. In September 2014, Government also adopted the Eskom‟s Support Package to
strengthen the liquidity position of the company.
The past twelve months also saw the synchronization of the first Unit of Medupi in the new build programme. Despite
the delay and challenges in delivery of the Unit, this achievement is a great milestone and has confirmed that South Africa
still possesses the capacity to execute mega and complex infrastructure projects. This lays an important foundation to
stabilise the supply of electricity. The lessons learned on the current build programme on pre-planning, contracting,
financing and post transaction monitoring needs to be codified to ensure that delivery of mega projects is significantly
improved.
Denel is one of the SOCs that have been successfully turned around. This has given the company a solid launch pad to
advance its capabilities and create strategic partnerships that will deepen its manufacturing capabilities. Fuelled by South
African rocket science and satellite technology, Denel has launched Spaceteq as a newly formed space engineering
business unit. This follows the incorporation of satellite manufacturer SunSpace into the Denel Group in July 2013 in a
move, which optimises the highly advanced engineering and technology skills between the combined businesses.
This strengthens Denel‟s position as a leader in innovative and advanced aerospace systems and technology. Space has
been identified as one of South Africa‟s “five grand challenges.” The Departments of Science and Technology (DST) and
Trade and Industry (DTI) have identified satellite production as a high-technology manufacturing niche that South Africa
should be pursuing.
Therefore, the new strategy of the Department has been framed to support the reform of the SOCs to ensure that
Government‟s role in the economy is optmised and support the advancement of developmental state aspirations as
outlined in the NDP. The APP contains specific interventions to realise the objectives of the new strategy of the
Department.
17OVERVIEW OF BUDGET AND MTEF ESTIMATES
Table 1 Department of Public Enterprises
Audited Audited Audited Adjusted Revised Revised Revised Revised
outcome outcome outcome appropriation Estimate baseline baseline baseline
2017/1
2011/12 2012/13 2013/14 2014/15 2015/16 2016/17
R million 8
Programmes
115,367 156,859
108,635 133,295 156,859 158,587 155,485
Administration
164,05
8
23,477 24,311
Legal and Governance 19,518 23,158 24,311 23,829 26,235
27,558
1,225,450 138,368
Portfolio Management and Strategic
215,524 112,943 138,368 85,065 92,594
Partnerships
98,179
289,79
Total for programmes 343,677 1,364,294 269,396 319,538 319,538 267,481 274,314 5
Direct charge against the National
Revenue Fund - - - - - - - -
289,79
Departmental total 343,677 1,364,294 269,396 319,538 319,538 267,481 274,314 5
Change to 2014 Budget Estimate
(63,141)
Economic classification
285,77
Current payments 182,622 192,906 208,439 252,077 252,077 263,810 270,485 7
176,66
Compensation of employees 93,867 102,730 124,868 147,065 147,065 152,265 166,206 2
176,66
Salaries and wages 93,867 102,730 124,868 147,065 147,065 152,265 166,206 2
Social contributions - - - - - - - -
18Audited Audited Audited Adjusted Revised Revised Revised Revised
outcome outcome outcome appropriation Estimate baseline baseline baseline
2017/1
2011/12 2012/13 2013/14 2014/15 2015/16 2016/17
R million 8
109,11
Goods and services 88,755 90,176 83,571 105,012 105,012 111,545 104,279 5
Administrative fees 131 866 527 810 810 793 830 919
Advertising 1,778 1,962 4,705 2,515 2,515 2,667 2,517 2,515
Assets less than the capitalisation
threshold 362 444 357 1,055 1,055 1,053 1,031 1,139
Audit costs: External 4,117 1,908 2,087 2,200 2,200 2,213 2,204 2,261
Bursaries: Employees 629 393 463 1,400 1,400 1,007 1,054 1,111
Catering: Departmental activities 1,136 1,341 1,621 749 749 1,316 1,152 1,153
Communication (G&S) 3,260 3,741 3,741 3,645 3,615 4,641 4,393 4,913
Computer services 2,726 3,078 4,126 3,974 3,974 4,884 4,730 5,542
Consultants and professional
services: Business and advisory
services 26,668 22,837 12,741 35,349 35,529 38,083 32,682 37,924
Consultants and professional
services: Legal costs 2,396 430 1,878 3,059 3,059 3,282 3,402 3,698
Contractors 1,012 2,250 909 1,898 1,898 2,032 1,738 1,847
Agency and support/ outsourced
services 2,542 4,110 2,624 3,479 3,479 840 1,476 800
Entertainment 60 32 19 312 312 310 311 323
Fleet services (including government
motor transport) 765 805 1,190 1,108 1,108 1,538 1,175 1,587
Inventory: Clothing material and
accessories - - 29 - - - - -
Inventory: Food and food supplies 122 113 - - - - - -
Inventory: Fuel, oil and gas - 21 - - - - - -
19Audited Audited Audited Adjusted Revised Revised Revised Revised
outcome outcome outcome appropriation Estimate baseline baseline baseline
2017/1
2011/12 2012/13 2013/14 2014/15 2015/16 2016/17
R million 8
Inventory: Materials and supplies 85 64 2 - - 2 3 4
Inventory: Medical supplies 1 8 2 - - - - -
Inventory: Medicine - 2 - - - - - -
Inventory: Other supplies 24 25 - - - - - 21
Consumable supplies - 34 822 708 708 839 1,172 974
Consumable: Stationery, printing
and office supplies 2,028 2,693 2,375 1,361 1,361 1,572 1,507 1,536
Operating leases 1,720 1,814 1,297 1,790 1,790 3,412 3,248 2,086
Property payments 6,884 9,137 7,504 8,472 8,472 8,918 9,380 9,850
Travel and subsistence 24,329 23,499 24,017 24,919 24,769 25,855 24,967 23,075
Training and development 2,386 1,624 1,858 2,604 2,604 2,112 2,004 2,093
Operating payments 1,655 3,618 1,132 1,491 1,491 1,326 1,093 1,374
Venues and facilities 1,939 3,327 7,545 2,114 2,114 2,564 2,005 2,104
Rental and hiring - - - - - 286 205 266
Transfers and subsidies 156,978 118,638 57,612 63,392 63,392 105 111 117
Provinces and municipalities - - 2 - - - - -
Municipalities - - 2 - - - - -
Municipal bank accounts 2
Public corporations and private
enterprises 156,255 118,313 57,250 63,141 63,141 - - -
Public corporations 118,313 63,141 - -
20Audited Audited Audited Adjusted Revised Revised Revised Revised
outcome outcome outcome appropriation Estimate baseline baseline baseline
2017/1
2011/12 2012/13 2013/14 2014/15 2015/16 2016/17
R million 8
156,255 57,250 63,141 -
Other transfers to public
corporations 156,255 118,313 57,250 63,141 63,141
Households 723 325 360 251 251 105 111 117
Social benefits - - - 196 196 - - -
Other transfers to households 723 325 360 55 55 105 111 117
Payments for capital assets 4,071 2,742 3,250 4,069 4,069 3,566 3,718 3,901
Machinery and equipment 3,922 2,649 2,769 4,069 4,129 3,464 3,614 3,795
Transport equipment 1,411 - 563 3,356 3,056 2,853 3,005 -
Other machinery and equipment 2,511 2,649 2,206 713 1,073 611 609 3,795
Software and other intangible assets 149 93 481 - -60 102 104 106
Payments for financial assets 6 1,050,008 95 - - - - -
289,79
Total economic classification 343,677 1,364,294 269,396 319,538 319,538 267,481 274,314 5
Relating expenditure trends to strategic outcome oriented goal
The assets held by Government through SOCs oversight constitute essential part of South African national wealth (refer
to figure 2: SOCs Asset Value below) hence the need to manage these assets with extra care and accountability.
Therefore, constant monitoring and evaluation of the SOCs must be informed by the need to achieve the best possible
results (financial, operational and social) at any given time.
The Department‟s medium term focus will be on facilitating a conducive environment for repositioning SOCs to advance
their developmental mandate. It will also prioritise enhancing the efficiency of strategic transport corridors and the
implementation of Government‟s support package to Eskom. The focus will also be on improving internal efficiencies and
the functioning of the Department. Support for the achievement of the NDP goals will form the central part of the
oversight function. To this end, the personnel establishment is expected to remain constant at 223, excluding interns
and graduates. Currently, a large number of positions are Corporate Management and this must be reversed as the
Department intends to build its capacity and focus in the specialist fields.
21To carry out the Department‟s high level stakeholder interactions, intergovernmental and coordinating activities and
general oversight role of the Government‟s investment in SOCs, personnel travel extensively domestically and
internationally; and the Department relies on the services of consultants who conduct highly technical research in the
transport, manufacturing, and energy sectors. As a result of Cabinet budget reductions, travel and subsistence being the
largest spending items are expected to decrease over the medium term. The Department intends to rationalise the use
of consultants and draw on internal capacity where possible. Other reductions to the budget are the result of the transfer
of the shareholder oversight function of Broadband Infraco to the Department of Telecommunications and Postal
Services (DTPS).
Figure 2: DPE SOCs asset value
Breakdown of the SOCs overseen by the DPE
(Rbn)
Alexkor BBI Denel Eskom SAA SAFCOL SAX Transnet
Breakdown of SOCs overseen by the DPE by Revenue, Profit and Asset Value
(Rbn)
~96% of the total revenue
Name Sector Revenue Profit Asset Base generated by the DPE’s
Value SOCs can be attributed to
Eskom Energy 139.5 7.1 504.9 Transnet and Eskom
collectively (98% profits)
Transnet Transport 56.6 5.1 240.1
SAA Transport 30.0 -0.4 15.2
These sectors contribute
Denel Defence 4.6 0.2 8.0 significantly to the
SAX Transport 2.2 0.01 1.4 economy:
Transport: 9%
SAFCOL Agriculture 0.9 0.1
Energy: 2%
Alexkor Mining 0.15 0.04 0.9 Mining: 5%
Agriculture: 2%
BBI Communication 0.2 -0.2 1.6
Manufacturing: 15%
Total 203.95 11.9 755.4
Note: Assumption being made is that due to scale of Transnet and Eskom as collective, interventions
applied to theses two entities can ensure the success of MTSF
In relation to Government‟s 12 Source:
Outcomes, thefinancial
relevant SOC Department is primarily
statements; DPE.gov.za; contributing to creating an efficient, competitive
Team Analysis
and responsive economic infrastructure network (Outcome 6) of the Medium Term Strategic Framework (MTSF). The
Outcome 6 chapter the core of the performance agreement between the President and the Minister. Furthermore, the
Department, through the activities of its SOCs, contributes to other outcomes such as decent employment through
inclusive growth, skills and rural development.
The following is the Department‟s contribution towards achieving the outcomes that have been prioritised by
Government:
3.1 Creating an efficient, competitive and responsive economic infrastructure network (Outcome 6)
The past MTSF was adopted during the recession. One of the key objectives was to stabilise the economy and place it
on a different growth trajectory. At the centre of this objective was: implementation of the capital expenditure
programme that would address the capacity constraints experienced by the economy during high growth periods
between 2005 and 2007; to act as a stimulus to jump-start the economy.
In this regard, Eskom‟s build programme, as well as the Transnet capital expenditure programme, formed the core of
the Government‟s infrastructure investment strategy. This remains a priority in the current MTSF.
22The progress that has been made to accelerate infrastructure investment in the economy is highlighted below.
Eskom
Funding of the build programme up to 2018
Funding of the build programme emerged as one of the major challenges with roll-out of the build programme in the
electricity sector. This is as a result of tariffs not being sufficient to cover operational costs as well as provide a reasonable
return on investment to allow the utility to fund investment in additional generating capacity. Over the past five years, the
Department has supported Eskom to secure tariff adjustments that will support its financial sustainability as well as
provision of guarantees to keep the financing cost lower. As at 31 March 2014, R271.6 billion (90.5%) of the R300
billion borrowing programme had been secured. The R300 billion borrowing programme is based on the original
funding requirements as at April 2010 and covers the period 1 April 2010 to 31 March 2017.
It should be noted that additional funding requirements, including those resulting from the lower than expected MYPD 3
tariff determination, are not included in this borrowing programme. The drawdowns for the year ending 31 March
2014 against the R300 billion funding plan is R44.7 billion, bringing the cumulative amount that has been drawn to
execute the build programme to R188.7 billion.
Additional funding for the period until 31 March 2018, as a result of the MYPD3 decision amounts to R301 billion which
still needs to be secured.
Progress on delivery of build programme (Medupi, Kusile, Ingula, Transmission Lines and Renewable Projects)
Eskom spent R58.2 billion on capital expenditure in 2013/14, reflecting a sustained increase in the capital expenditure in
support of Government outcomes. The following are the key achievements of the build programme:
Eskom completed the return-to-service project during the reporting period. All three power stations (Camden,
Grootvlei and Komati) are fully operational. The last unit of this project – Komati Power Station‟s Unit 3 – was
commissioned in September 2013. This brought the total amount of generating capacity for return-to-service
added to the grid since 2005 to 3 731MW. This has been one of the factors that have played a crucial role in
averting the collapse of the national electricity grid.
The refurbishment projects have made good progress, despite the ongoing challenge of outage constraints. All the
Kriel units have now been refurbished, with the final unit (Unit 5) being synchronised on load on 15 March 2014.
Furthermore, three of the six Matla units have been refurbished, with the third unit (Unit 5) synchronised on load
on 25 March 2014. Delays were experienced at Duvha due to outage movements.
Medupi‟s first Unit (Unit 6) has been successfully synchronised.
Kusile achieved a day variance of 12.9 days (within the target of 30 days late variance). The station is scheduled for
synchronisation by the end of 2015. The key challenge is finding a solution for control systems to avoid a repetition
of the delays experienced at Medupi. Four medium term contracts have been signed for coal supply to Kusile
Power Station during the commissioning phase. The conclusion of long term coal and limestone supply
agreements for Kusile Power Station remains a focus area for the Department.
Work continues at Ingula, but the tragic incident that cost the lives of six contractors has affected the schedule. The
delay has been estimated at 18 months. At the end of the reporting period, Ingula had a day variance of 11.6 days
(within the target of 30 days late variance). Work to install turbines and generators will begin soon.
Sere Wind Farm has been completed within schedule and budget and is scheduled for the official launch in March
2015.
Approximately 811km of power lines and 3 790MVA of sub-station capacity were also commissioned during the
course of the year.
23IPP contracts that have been signed
The electricity industry is undergoing reforms targeted at: enhancing participation of the private sector; attracting
additional investment to address current capacity challenges; enhance the use of renewable energy. The first project
under the Department of Energy (DOE) renewable independent power producers (RE-IPP) programme was connected
to the grid on 27 September 2013 and the first IPP was commissioned on 15 November 2013. A total of 467.3MW is
currently available to the system from these Independent Power Producers (IPPs). The DOE approved an additional 1
457MW, pursuant to the third window submissions. No contracts have yet been signed for this capacity.
Further PPAs, totalling 1 005MW, for DOE Peaker Plants were entered into on
3 June 2013 and became effective on 29 August 2013 (DOE Peaker Programme). Commissioning of these plants is
expected during the 2015/6 financial year.
Transnet
TRANSNET CAPITAL INVESTMENT FIVE YEARS REVIEW
Division(s) 2009/10 2010/11 2011/12 2012/13 2013/14 TOTAL
TFR 9.7 12.5 14.8 18.3 25.1 80.4
TE 0.4 0.5 0.7 1.3 1.0 3.9
TNPA 3.2 2.0 1.7 1.7 1.2 9.8
TPT 2.4 0.7 1.5 2.2 1.6 8.4
TPL 3.1 6.1 4.5 2.8 3.4 19.9
Other (0.4) (0.3) (0.9) 1.1 0.2 (0.3)
Total capex 18.4 21.5 22.3 27.4 32.5 122.1
The 2014/15 financial year is the third year of Transnet‟s roll-out of the Market Demand Strategy (MDS) that is
underwritten by a rolling capital programme worth over R300bn. In the past five years, Transnet has invested over
R120bn in infrastructure and capital projects, most of which has been committed to the rail business. This is crucial to
enhance the efficiency of the logistics system and to reduce the cost to move goods, which will contribute to the overall
competitiveness of the economy.
Key projects executed by the company over the past five years included the following:
GFB locomotives
During the 2013/14 financial year, Transnet awarded a R50 billion contract for acquisition of 1 064 locomotives
(599 new dual-voltage electric locomotives and 465 diesel locomotives) – this makes it the largest locomotive
acquisition contract in the history of South Africa. Not only will this acquisition of locomotives enable Transnet
to increase its rail volume capacity, but the procurement process has been structured in such a way as to allow
for maximisation of localisation benefits. The transaction is expected to boost the country‟s manufacturing
capacity while also transforming the rail industry.
Nine of the 95 electric locomotives were delivered in the 2013/14 financial year. Local assembly of the
locomotives commenced on 4 February 2014 at Transnet Engineering in Koedoespoort. The remaining 23
of the 43 Class 43 diesel locomotives were received in the 2013/14 financial year.
Iron ore line expansion up to 60,0mt
The last 26 of the 32 locomotives needed to facilitate the increase in iron ore capacity to 60,0mt were tested
and accepted into operations during the 2013/14 financial year. The pre-feasibility study to expand capacity
from 61mt to 82,5mt has been completed. Phase 1D (being the addition of a 3rd tippler and associated rail
works) has been approved by the Transnet Board of Directors, at a cost of approximately R1,6 billion. The 3rd
tippler will ensure that 60mt can be exported on a sustainable basis, as the existing two tipplers currently do
not allow for any down time.
24 Coal line expansion up to 81,0mt
Infrastructure work required to expand the coal line from 68mt to 81mt commenced during the 2013/14
financial year. The work is expected to gain momentum during the 2014/15 financial year, with construction of
the consolidation yards at Saaiwater and Blackhill yards.
Durban Container Terminal (DCT)
Transnet has commenced with the reconstruction and deepening of seven steel sheet piled berths at Maydon
Wharf, in the Port of Durban. Construction of the first berth was successfully completed and is now fully
operational. The contract for the remaining six berths was awarded recently and on-site construction is
expected to commence in the near future.
Durban Dig-Out Port
The Durban International Airport (DIA) site acquisition from Airport Company of South Africa (ACSA) was
concluded during the 2012/13 financial year at a total cost of R1,85 billion. The DIA site is proposed to be
developed into a dig-out port to address demand requirements in the container, liquid bulk and automotive
sectors up to 2040.
Cape Town Container Terminal
Expansion of the Cape Town Container Terminal aims to increase capacity from 0.9 million TEUs to 1,4
million TEUs to address growth in demand for containers in the Western Cape region. The capital project to
deepen berths and increase container handling capacity to 900 000 TEUs has been completed. Consideration
is now being given to increasing the container handling capacity to 1, 4 million TEUs.
Ngqura Container Terminal
The Nqgura Container Terminal was launched in 2012. The port is positioned as a trans-shipment hub and a
gateway for container traffic into Southern Africa. The second phase A of the project, to expand capacity from
800 000 twenty-foot equivalent units (TEUs) to 1.5 million TEUs, has commenced and is expected to be
completed during the 7 year MDS period.
New Multi-Product Pipeline (NMPP)
Significant progress has been made on the NMPP with favourable weather conditions having enabled
accelerated construction work to take place. The project has, however, faced some challenges with regard to
industrial action and tank construction work. In spite of these challenges, the project is expected to be
completed during 2015 financial year.
Ports productivity
Durban
During the period under review, ship turnaround time was slightly below the target of 59, largely due to inclement
weather. The gross crane moves per hour (GCH) on Pier 1 and Pier 2 are below target, with Pier 1 at 24 moves
(target is 28) and Pier 2 at 25 moves (target is 30). Anchorage waiting time was also below target, at 57 hrs (target is 46).
Infrastructure upgrades are being implemented to improve functioning of the port.
Cape Town
The ship turn-around time was 29,6hrs better than the set target of 30hrs. The gross crane moves per hour were
better than target, at 34 moves against a target of 32. Anchorage waiting time was below target at 57 hrs (target was 46
hrs).
Volumes Transported by Rail
Transnet has continued to move volumes above 200 mt per annum, despite the lacklustre performance of the economy.
During the period under review, 210.43 mt were showing a 1.3% increase in volumes compared to the previous
financial year.
25The volume growth was attributable to the following:
General freight business (GFB) volumes of 88mt reflected a positive growth of 6% compared to the previous
year.
Export coal volumes of 68.2mt were 11% below budget and 1% below the previous year.
Export iron ore volumes of 54.3mt were 12% below budget and 3% below the previous year.
The 8.4% shortfall on the budgeted volume of 229.72mt was mainly due to export coal and export iron ore.
Key reasons for the deviation of a 19mt (88.4%) shortfall on total rail volumes were as follows:
A 7.3mt shortfall on export iron ore due to customer production problems and a decline in export iron prices
due to slow global economic growth.
The 8.8mt export coal volume shortfall was partly due to a decline in export coal prices, customer related
equipment failure, as well as internal and external operational constraints (such as locomotive failure and power
failure, including Richards Bay Container Terminal (RBCT) cable failure and cable theft).
The GFB sector accounted for the remaining shortfall of 3.2mt. A range of factors affected volume
performance, including slow domestic growth, industrial strikes, customer loading and offloading challenges and
wet weather conditions.
Migration of transportation of coal from road to rail
The coal business under-achieved on its annual target of 95.151mt. The actual achievement for coal was 83,13mt in
2014, which represents a 12.6% under-achievement.
Road to rail migration efforts are as follows:
Freight Rail‟s market development initiatives target retention and growth of traditional rail customers in the mining
and heavy manufacturing sectors (e.g. export coal and iron ore), including companies that beneficiate mining
commodities. Other major customers are in the fuel, chemicals, agricultural and timber sectors.
The business is targeting new customers in the Fast Moving Consumer Goods (FMCG), textile and light
manufacturing industries, where there are opportunities for „rail friendly‟ commodity types to be shifted from road
to rail.
The rail migration programme that focuses on Eskom coal is progressing well in support of the road to rail
programme.
GFB Productivity
On-time train departures improved by 24% compared to the previous year and by 5% compared to budget; this was
due to diligent monitoring and follow-up on the root causes of deviations. On-time arrivals also improved by 4.5%
compared to the previous year, but declined by 31% compared to budget, partly due to en-route system-failures.
Diligent monitoring and follow-up on the root causes of departure and arrival problems will continue.
The gradual delivery of 43 Class diesel locomotives for General Freight and focused attention on operational efficiency
and volume growth resulted in an 8% improvement in asset utilization, compared to both the prior year and budget.
3.2 Outcome 4: Decent employment through inclusive growth
The Department was identified as one of the contributors required to support implementation of the Outcome 4 which
in Department‟s is focused on enhancing Denel‟s manufacturing and technology capabilities and maximizing localization
on the capex. Infrastructure investment was identified as one of the job drivers in the NGP. The industrial capabilities that
exist within SOCs such as Denel are being leveraged to support the development of advanced manufacturing in the
South African economy, in line with IPAP.
26Denel
The turnaround of Denel has been crucial to preserve advanced industrial capabilities within the State‟s portfolio. The
company has continued to support the needs of the South African Defence Force, which has played a crucial role in
developing capability to secure other markets. In June 2013, the company reported a R21 billion order book, which
increased to R30 billion by December 2013. This will enable the business to meet its plan of doubling revenues to
R8 billion by 2018/19.
One significant order secured by the SOC in the 2013/14 financial year was a R10 billion contract by the South African
Department of Defence to produce 238 Hoefyster infantry fighting vehicles (IFV) for the South African Army. The
programme is critical in maintaining the country‟s advanced defence manufacturing capabilities. Importantly, 70% of the
components for the vehicles will be developed and manufactured in South Africa, with 2 000 jobs to be created at Denel
and in the related South African defence industry.
In 2013/14 Denel revived its space and satellite capabilities, after entering into a collaborative relationship with the South
African National Space Agency (SANSA). This will not only ensure that the country‟s space and satellite capabilities are
enhanced, but will provide local industry with the opportunity to tap into the growing and strategic global space and
satellite industry.
The SOC has delivered and supported the deployment of the Rooivalk combat support helicopter in combat operations
in the Democratic Republic of Congo (DRC). The deployments were done under the United Nations Organisation
Stabilisation Mission (MONUSCO) and have proven to be a game changer in peace enforcement operations.
Localisation and transformation (Eskom and Transnet)
The Department has continued to monitor implementation of the Supplier Development Plans of both Eskom and
Transnet. Furthermore, the Department has incorporated localization targets into the shareholder compacts of these
entities; to ensure that their procurement expenditures advance the industrialization programme of Government. The
proportion of both components and services sourced locally by these SOC has gradually increased since the introduction
of the Competitive Supplier Development Programme (CSDP).
In the 2013/14 financial year, Transnet achieved 92% local content procurement as a percentage of total spend. This is
an exceptionally good performance for the year, especially if you take into consideration that the local content target was
only 70% of total spend.
Transnet also exceeded the supplier development target by achieving 37% commitment of contract value to be invested
in the country: the target was only 35%. Transnet‟s performance in regard to supplier development would have been
significantly higher if the SOC was not bound by the Preferential Procurement Policy Framework Act, 2000 (PPPFA).
Engagement with National Treasury on the PPPFA is ongoing in order to find a solution that will allow SOC to maximize
their procurement spend.
BBBEE spend amounted to 94% of Total Measurable Procurement Spend (TMPS); this was against a target of 70%.
Spend on Black Women Owned and Black Youth Owned remains low. The Department is, however, continuing to
engage Transnet to find ways to improve spend on these two groups.
3.3 Outcome 5: A skilled and capable workforce to support an inclusive growth path
SOCs within the DPE portfolio committed to support the National Skills Agenda through implementation of various skills
initiatives, with a specific focus on scarce and critical skills. These initiatives include alignment of skills development
programmes to the National Skills Development Strategy (NSDS) and National Skills Accord in support of the NGP and
NDP. To ensure alignment to these interventions, the Department has established partnerships with the Department of
Higher Education and Training (DHET), the Economic Development Department (EDD) and the Department of Trade
and Industries (DTI). This is crucial to ensure that the skills development capacity of SOCs is leveraged to develop core
and critical skills to meet the economy‟s requirements.
27You can also read