Environmental Economics Research Hub Research Reports Adapting to climate change for water resource management: Issues for northern Australia ...
←
→
Page content transcription
If your browser does not render page correctly, please read the page content below
ISSN 1835-9728
Environmental Economics Research Hub
Research Reports
Adapting to climate change for water
resource management: Issues for northern
Australia
William Nikolakis, Aimee Nygaard and R. Quentin Grafton
Research Report No. 108
April 2011
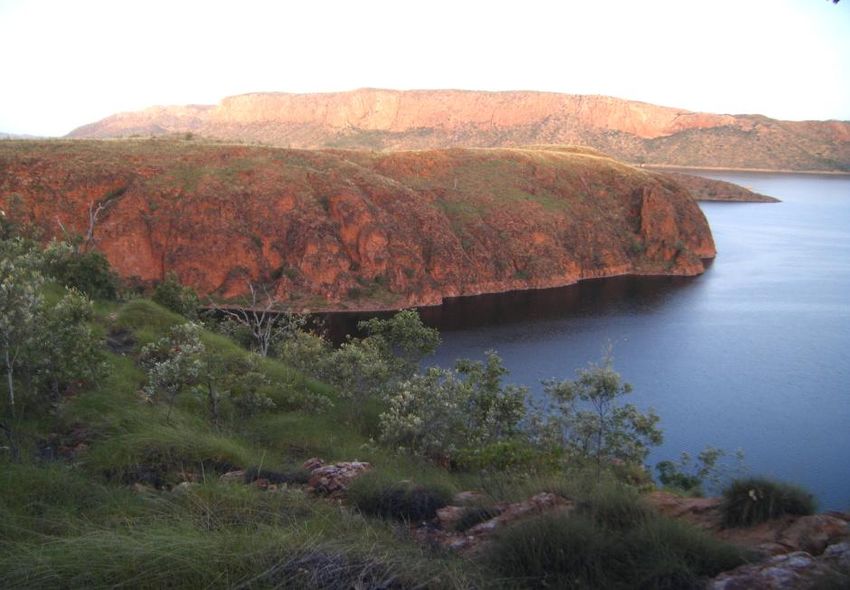
Lake Argyle Western Australia, (photo courtesy of Aimee Nygaard)
About the authors
William Nikolakis is a Postdoctoral Fellow, Environmental Management and Development
Programme at the Crawford School of Economics and Government, The Australian National
University
Aimee Nygaard is a Postdoctoral Research Associate at the Crawford School of Economics and
Government, The Australian National University
Quentin Grafton is a Professor of Economics and Director of the Centre for Water Economics,
Environment and Policy (CWEEP) at the Crawford School of Economics and Government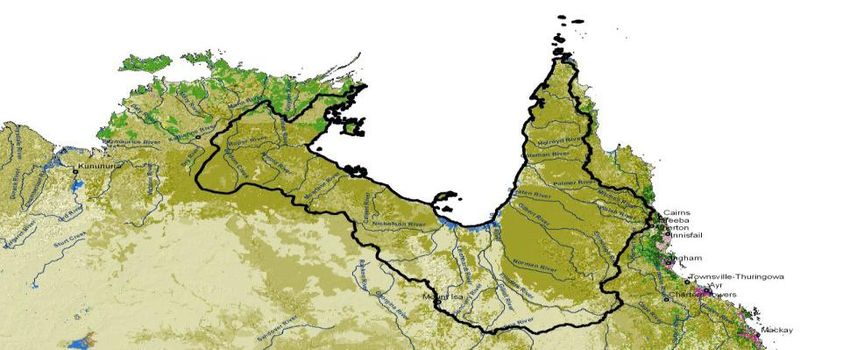
Environmental Economics Research Hub Research Reports are published by the
Crawford School of Economics and Government, Australian National University,
Canberra, 0200 Australia.

These Reports present work in progress being undertaken by project teams within the
Environmental Economics Research Hub (EERH). The EERH is funded by the
Department of Sustainability, Environment, Water, Population and Communities under
the Commonwealth Environment Research Facility.

The authors would like to thank the Namoi Catchment Management Authority and in
particular Anna Cronin for their assistance in conducting this study.
The views and interpretations expressed in these Reports are those of the author(s) and
should not be attributed to any organisation associated with the EERH.
Because these reports present the results of work in progress, they should not be
reproduced in part or in whole without the authorisation of the EERH Director, Professor
Jeff Bennett (jeff.bennett@anu.edu.au)

                Crawford School of Economics and Government
               THE AUSTRALIAN NATIONAL UNIVERSITY

                            http://www.crawford.anu.edu.au

                                                                                          ii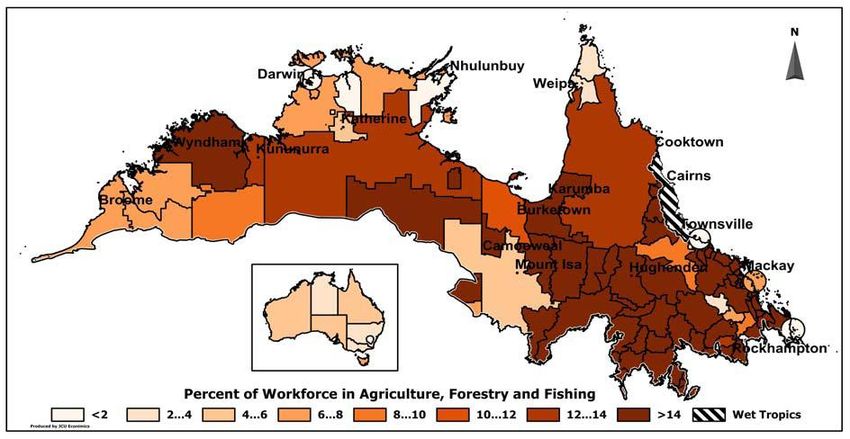
Contents
Executive Summary .......................................................................................................... vii
Acknowledgements ............................................................................................................ ix
List of Abbreviations and Acronyms .................................................................................. x
Glossary ............................................................................................................................. xi
1. Introduction ..................................................................................................................... 1
   1.1 Aims .......................................................................................................................... 1
   1.2 Background ............................................................................................................... 1
      1.2.1 Future Development........................................................................................... 5
   1.3 National Water Reform- the National Water Initiative............................................. 5
   1.4 Institutional Setting ................................................................................................... 6
2. Climate Change ............................................................................................................. 11
   Year and Scenario Projections ...................................................................................... 11
   Overall trends in Australia ............................................................................................ 12
   Overview of Environmental Impacts across North ....................................................... 15
   Overview of Socio-Economic Impacts across North .................................................... 17
3. Projected Regional Impacts .......................................................................................... 19
   3.1 Queensland Overview: The Gulf of Carpentaria and the Northern North East Coast
   Drainage Divisions........................................................................................................ 19
      3.1.1 Environmental Impacts .................................................................................... 20
      3.1.2 Socio-Economic Impacts ................................................................................. 23
   3.2. Northern Territory Overview: Top End (Katherine to Darwin) ............................ 25
      3.2.1 Environmental Impacts .................................................................................... 25
      3.2.2 Socio-Economic Impacts ................................................................................. 28
   3.3 Western Australia Overview, East and West Kimberley. ....................................... 30
      3.3.1 Environmental Impacts .................................................................................... 31
      3.3.2 Socio-Economic Impacts ................................................................................. 34
4. Adaptation ..................................................................................................................... 36
   4.1 Climate change adaptation ...................................................................................... 36
   4.2 Adaptation and water resource management across the north ................................ 38
   4.3 Adaptation and agriculture ...................................................................................... 45
   4.4 Adaptation and Pastoralism .................................................................................... 46
   4.5 Adaptation and Mining ........................................................................................... 47
   4.6 Social Aspects of Adaptation .................................................................................. 48
5. Conclusions ................................................................................................................... 49
References ......................................................................................................................... 51

                                                                                                                                      iii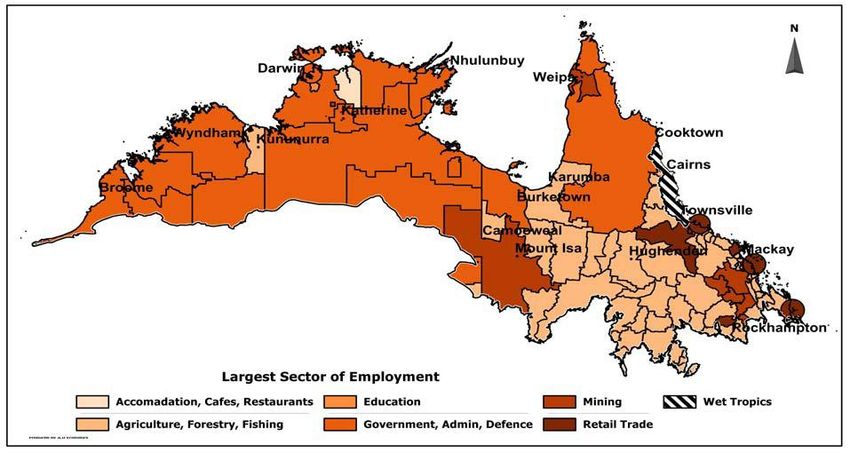
List of figures

Figure 1: Map of study region (TRaCK) ............................................................................ 1
Figure 2: Largest sector of employment in the region—by postcode (Stoeckl et al, 2007:
38) ....................................................................................................................................... 3
Figure 3: National annual temperature change 50th Percentile (CSIRO and BOM 2007a)
........................................................................................................................................... 13
Figure 4: National annual rainfall change 50th percentile. (CSIRO and BOM, 2007a) ... 13
Figure 5: Projected global sea-level rise for the 21st century. (CSIRO, 2010a). .............. 14
Figure 6: SRES A1B Projected Sea level Departures from the Global Mean (mm) 2070
(CSIRO, 2010b). ............................................................................................................... 15
Figure 7: Gulf of Carpentaria (CSIRO, BOM and BRS, 2010) ........................................ 19
Figure 8: Northern North East Coast Drainage Division (ERIN, 2008) ........................... 19
Figure 9: Queensland temperature changes (°C), 2030, 2050, and 2070 (annual, 50th
percentile) (CSIRO and BoM, 2007a). ............................................................................. 20
Figure 10: Queensland Rainfall Change (%), 2030, 2050, and 2070 (annual, 50th
percentile) (CSIRO and BOM, 2007a). ............................................................................ 21
Figure 11: Queensland potential evapotranspiration 2030, 2050 and 2070 (annual, 50th
percentile) (CSIRO and BOM 2007a). ............................................................................. 22
Figure 12: NT temperature changes (°C), 2030, 2050, and 2070 (annual, 50th percentile)
(CSIRO and BOM, 2007a). .............................................................................................. 26
Figure 13: Northern Territory Rainfall Change (%), 2030, 2050, and 2070. (annual, 50th
percentile) (CSIRO and BOM, 2007a). ............................................................................ 27
Figure 14: Low-lying coastal areas in the Kimberely‘s with areas below 5 meters in
elevation in red, and between 6 and 10 meters in yellow. (CSIRO MAR, 2006)............. 35
Figure 15: Percent of workforce in Agriculture—by postcode Data Source: ABS CDATA
2001 (Sourced from Stoeckl et al, 2007: 39) .................................................................... 45
Figure 16: Percent of workforce in mining—by postcode Data Source: ABS CDATA
2001 (Sourced from Stoeckl et al, 2007: 40). ................................................................... 48

                                                                                                                                           iv
List of tables

Table 1: Summary of TRaCK regional population projection results, 2006 to 2026.
(Carson et al, 2009: 27) ....................................................................................................... 2
Table 2: Drainage divisions and river basins across the north ............................................ 3
Table 3: Drainage division profile (collated from CSIRO, 2009a and CSIRO, BOM and
BRS, 2010a,b) ..................................................................................................................... 4
Table 4: Institutional Arrangements for water in jurisdictions ........................................... 7
Table 5: Climate Change impacts across Northern Australia (2030, 2050 and 2070)
(Annual, 50th percentile) (CSIRO and BOM 2007a; Hennessy et al 2010, in review). .... 16
Table 6: Number of +35°C Days per Year in Cairns, 2030, 2050 and 2070. (Sourced from
Hennessy et al, 2010, in review) ....................................................................................... 21
Table 7: Number of +35 °C Days per Year in Darwin, 2030, 2050 and 2070 (Hennessy et
al., 2010, in review). ......................................................................................................... 26
Table 8: Number of +35°C Days per Year in Broome: 2030, 2050 and 2070. (Hennessy et
al, 2010, in review) ........................................................................................................... 32
Table 9: Robust planning framework in each jurisdiction (adapted from Ward et al., 2009)
........................................................................................................................................... 41
Table 10: State Government Climate Change and Water Strategies: WA, NT and
Queensland. ....................................................................................................................... 44

                                                                                                                                          v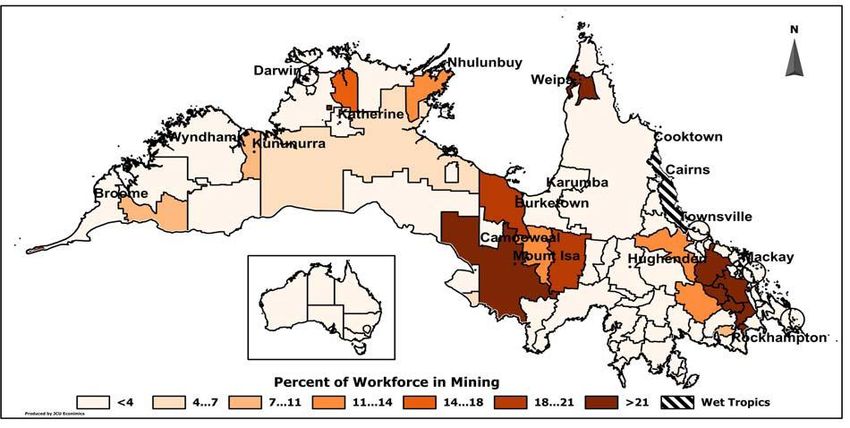
Executive Summary
There are two aims of this work focused across northern Australia (north of the tropic of
Capricorn). First is to identify adaptive strategies to deal with climate change in each
jurisdiction. Second the work identifies issues for adaptation in water resource
management across the region in light of potential impacts and local conditions. Over
half of Australia‘s annual runoff occurs in the north Australian region from November to
April. The region is relatively undeveloped and sparsely populated compared to southern
Australia. Almost 30% of the land base is owned under Indigenous tenure. Drought and
over-allocation of water resources in southern Australia has focused attention on the
potential for expanding irrigated agriculture in the north. With an outlook for increased
drought in southern Australia the pressure to look north is likely to increase. While
rainfall projections in northern Australia are identified as stable to increasing, our
research highlights that the outlook for water availability remains uncertain under climate
change scenarios across the north.

Work by CSIRO and BOM (2007a) and CSIRO (2009a) predict that to 2030 and 2070,
northern Australia is likely to experience hotter temperatures, more intense rainfall and
more intense cyclonic events. It must be stated that climate change impacts are likely to
vary across the region and impacts may be highly localized. There may be an increased
risk of saltwater inundation and erosion in coastal areas. While inland areas may
experience more extreme high temperatures, drought, flooding, dust storms and bushfires
(CSIRO, 2009a; Green, 2006). Although northern Australia produces over half of
Australia‘s runoff, it is considered to be water limited for two main reasons. First there is
high evaporation and evapotranspiration for most of the year (CSIRO, 2009a). Second the
potential for water storages is constrained (NAWLT, 2009; Petheram et al, 2008). There
may be consequences for water resources from climate change (as well as infrastructure)
which combined with increased population growth (especially in Darwin, NT) could
make water stress more acute, particularly during the dry season. As water stress
increases the need for a robust and adaptive framework to manage water becomes more
important. Climate models may allow policy makers to anticipate particular events in
setting design standards for water infrastructure (Hallegatte, 2009).

Reference has been made in water plans to climate change in each jurisdiction. There is
also recognition in climate adaptation strategies that water resources will be impacted by
climate change. Adaptation for water resource managers and policy makers is not new.
But the effects from climate change may impose new and perhaps unforeseen challenges
on water management regimes. This is particularly true across tropical northern Australia,
a region already difficult to manage and deliver services to because of its size, remoteness
and relatively poor infrastructure base. It is recommended in literature that adaptation for
water resources should consider basins in an integrated way and address issues such as
flood and drought protection, managing water demand, and maintaining and protecting
infrastructure. Water markets are a demand side strategy to adapt to climate change.
Markets have enabled irrigators in southern Australia the flexibility to cope with drought

                                                                                           vi
and maintain productivity during water shortages. Water markets may enable adaptation
to the effects of climate change by allowing re-allocation among users and flexibility to
users through trading. Markets can also encourage water use efficiency which is
important where climate change reduces water availability. The use of water markets are
at a formative stage across the north Australian region, with little to no trading at the time
of writing. Despite no trading, northern jurisdictions generally allow water trading to
occur in areas subject to a water plan (competition for water tends to be higher in these
areas and necessitates a plan).

Water plans seek to identify a sustainable level of consumptive extraction by using best
available science and community consultation to support economic, ecological and social
outcomes. It is acknowledged across the north that data relating to water resources and
climate is limited. This is particularly true for groundwater resources for which there is a
strong reliance across much of the north. There is considerable risk for the extraction on
groundwater resources on groundwater dependent ecosystems, and on the customary
values of Indigenous Australians. The Northern Territory has in place one water
allocation plan in the region, the Tindall aquifer plan. Queensland has the Gulf and
Mitchell resource operation plans. Western Australia has the Ord River water
management plan. The Tindall plan in the NT is the only groundwater plan completed in
the region. In Queensland and the NT plans are enshrined in statute and last 10 years
(though in the NT the plan is reviewed within 5 years). While in WA the Ord plan is for 3
years.

An important tool for adapting to climate change in water plans is the ability to reduce
water allocations to entitlement holders in line with reductions in water availability. This
is often done according to the level of security provided to an entitlement holder (high,
medium and low security). The economic value of entitlements is linked to its level of
security. In the Northern Territory, the Tindall aquifer water allocation plan provides that
all water licenses may have their allocation reduced to zero in serious drought
(commencing with low then up to high security). In times of critical water shortage the
Water Controller in the NT has the power to impose restrictions on stock and domestic
use as well. In the Ord there is greater security afforded to users because of the storage
capacity in Lake Argyle (101 GL). Allocations in the Ord are determined based on water
storage levels in the dam, and restrictions can be imposed on allocations if water reaches
‗critical levels‘. It is expected that in only 5 years out of every 100 will water reach
‗critical levels‘ and allocations be reduced. Hence entitlement holders will get their full
allocation 95% of the time. Plans are reviewed and new information may be integrated
and entitlements amended to reflect any changes in water availability.

Most work on climate change and hydrology research has been focused on metropolitan
centres in WA and Queensland. There has been relatively little work across the north to
understand the effect of climate change on water resources. Uncertainty and lack of
knowledge serve to constrain planning efforts. Adapting to climate change in water
resource management requires an integrated approach, coordinating efforts across
government and collaborating with stakeholders to be effective- it will be important to to
support socio-economic outcomes over the long term. The impacts from climate change
will not be distributed equitably and will have implications for Indigenous groups (who
are disadvantaged), with consequences for health, wellbeing and livelihoods (Green,

                                                                                           vii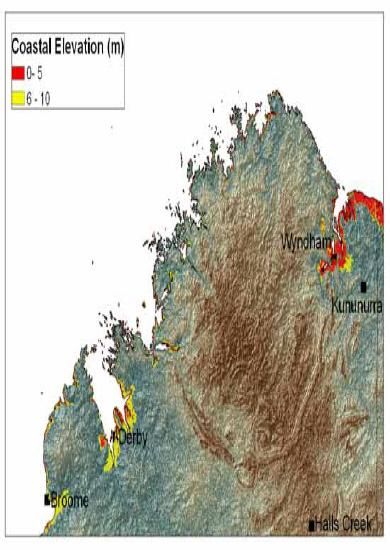
2006). Industry will be affected by the impacts of climate change in northern Australia.
For example, the pastoral industry which covers almost 90% of land use could be
negatively affected by reduced feed quality and water availability. These impacts can be
mitigated by proactive planning, as well as collaborative and stakeholder focused
planning activities. Planning will require particular effort to include and engage
Indigenous groups, where consultation efforts have in the past fallen short of expectations
in water management.

                                                                                       viii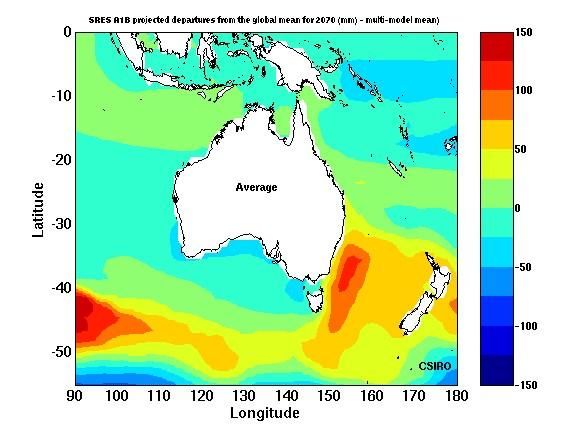
Acknowledgements
We acknowledge the support of the Environmental Economics Research Hub which
supported this research.

                                                                               ix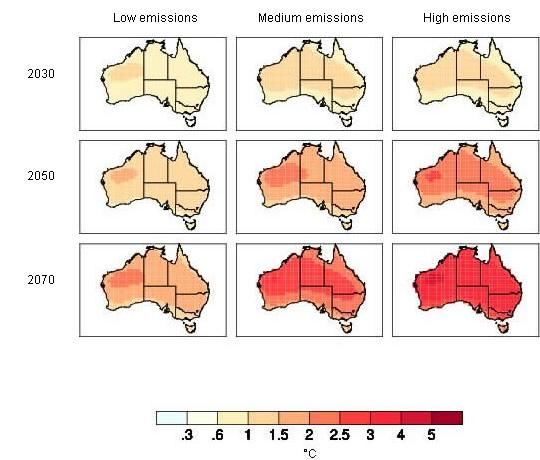
List of Abbreviations and Acronyms

COAG     Council of Australian Governments
CTH      Commonwealth
DERM     Dept. of Environment and Resource Management (QLD)
NRETAS   Dept. of Natural Resources, Environment, The Arts and Sport (NT)
NT       Northern Territory
NWC      National Water Commission
NWI      National Water Initiative
QLD      Queensland
ROP      Resource Operations Plan (QLD)
WA       Western Australia
WAP      Water Allocation Plan
WRMU     Water Resource Management Unit (WA)
WRP      Water Resources Plan (QLD)

                                                                            x
Glossary
Aquifer: An underground (geologic) formation which is capable of holding water and
through which water can percolate. Aquifers are capable of yielding quantities of
groundwater for consumptive use.
Cap: An upper limit for the volume of water available for use from a waterway,
catchment, basin or aquifer.
Consumptive pool: The volume of water resource that can be made available for
consumptive use in a given water system under the rules of the relevant water plan.
Consumptive Use: Use of water for consumptive purposes including irrigation, industry,
urban and stock and domestic use.
Regulated system: River system where the flow of the river is regulated through the
operation of large dams or weirs.
Supplemented water: Term used in Queensland to describe water provided through the
irrigation system, that is, water which is captured and then released on demand from the
irrigation system storages.
Unregulated system: River system where flows are not regulated by the operation of
structures such as major dams or weirs.
Unsupplemented supply: Term used in Queensland for natural stream flow that is not
reliant on water infrastructure.
Water access entitlement: A perpetual or ongoing entitlement to exclusive access to a
share of water from a specified consumptive pool as defined in the relevant water plan.
Water allocation: The specific volume of water allocated to water access entitlements in
a given season, defined according to rules established in the relevant water plan.
Water plan: A statutory plan for surface and for groundwater systems that is consistent
with the regional natural resource management plans, and that is developed in
consultation with all relevant stakeholders on the basis of the best scientific and socio-
economic assessment to provide secure ecological outcomes and resource security for
water users.
xi1. Introduction
1.1 Aims
The aim of this study is to identify the adaptive strategies present in water market
frameworks across northern Australia. After preliminary examination it was found that
agencies had planned for climate change to provide more water in the future, and in
jurisdictions the potential to reduce allocations exists if water availability is reduced in
the season. Research from CSIRO (2007a, 2007b, 2010a, 2010b) suggests that climate
change would increase temperatures and evapotranspiration to 2050 and 2070. This
combined with projected higher population projections suggests there would likely be an
increase in water stress at certain times of the year and the need for adaptive planning.
This is particularly important because of equity issues related to Indigenous rights and
interests and the environment. There is also the increased likelihood of storm surges and
cyclonic activity that will also have implications on water management. We present
adaptive approaches, informed by comparative literature.
1.2 Background
Northern Australia is made up of three jurisdictions: the two states of Queensland and
Western Australia (WA), and the Northern Territory (NT) (See Figure 1).
Figure 1: Map of study region (source: TRaCK)
As a region, northern Australia comprises a quarter of the Australian land estate, but
makes up only 2% of the population (about 310,000 people), with approximately a third
of the population identifying as Indigenous (Carson et al, 2009). Overall, the people in
this region are more likely to be male, indigenous and young than the broader Australian
population; people are also becoming more likely to live in urban centers such as Darwin,
Broome and Mt. Isa (Carson et al, 2009). It is predicted that the current trend of
1increasing population growth and urbanisation will continue in the future (Carson et al,
2009). Thirty percent of the north Australia‘s land base is owned by diverse Indigenous
peoples (Altman et al, 2009). This land is owned under a variety of tenures, much of it
communally in trust.
The table below illustrates the regional variations in population growth rates across the
north to 2026. It is anticipated that the current population growth rates will continue for at
least the next sixteen years, with a projected population of nearly half a million people by
2026.
Table 1: Summary of TRaCK regional population projection results, 2006 to 2026.
(Carson et al, 2009: 27)
Within this population, employment by sector shows a great deal of regional variation,
illustrated in Fig. 2. The largest sector in terms of employment across two thirds of the
geographic region is government, while major contributors to Gross Domestic Product
(GDP), such as mining, are less vital. Stoeckl et al, (2007) suggest that mining is more of
an enclave industry, acting as a significant employment source in certain areas, such as
Mt. Isa. The majority of non-government regions are dominated by agricultural
employment.
2Figure 2: Largest sector of employment in the region—by postcode (Stoeckl et al, 2007:
38)
About half of Australia‘s total stream-flow occurs in northern Australia (200,000 GL) but
often this is highly variable, with some 94% of northern Australia‘s rainfall occurring
between November to April (Creswell et al, 2009). Creswell et al, (2009) point out that
given the variability, the connection between groundwater and surface water is important
for dry season flows. There are three main drainage divisions for northern flowing rivers
(see Table 1) containing thirteen river basin regions. These include:
Table 2: Drainage divisions and river basins across the north
Drainage Division River Basin Region
Timor Sea: Fitzroy (WA), Kimberley, Ord-Bonaparte, Daly,
Van Diemen, and Arafura.
Gulf of Carpentaria: Roper, South-West Gulf, Flinders-Leichardt, South-
East Gulf, Mitchell, Western Cape.
Northern North-East Coast: Northern Coral.
The study region for this project encompasses a vast and diverse geographic area, from
Cairns in the east to the Kimberley in the west. The river flow is highly seasonal and
surface flow often ephemeral, where during the dry season many rivers do not flow at all
(CSIRO, 2009a). In many areas the coastal edge of Northern Australia is lush and
characterized by a tropical savannah climate, although Cape York exhibits both tropical
and monsoonal climates. Moving southward the tropical savannah gives way to
grasslands in most areas, and eventually to deserts in the far south (CSIRO, 2009a). The
landscape of the north is one of vast expanses of escarpments and tablelands in the west.
These relatively low lying lands rise sharply to meet the Arnhem Land plateau, a vast
sandstone tableland stretching to the Gulf of Carpentaria (CSIRO, 2009a).
3Within the 1 247 000 km2 of river drainage area, much of the native grasslands remain
intact, with intensive land use or clearing affecting less than 1% of the area (CSIRO,
2009a). The greatest land use in the North is pastoralism, although the greatest proportion
of GDP is from the mining industry, and to a lesser extent commercial fishing. There is a
significant area of the North conserved for aboriginal land use and conservation, Kakadu
National Park and the Wet Tropics being notable examples. Around 30% of land in
northern Australia is Aboriginal land owned under a variety of tenures (Altman et al,
2009). Landscape management for millennia was carried out by aboriginal peoples using
strategically set fires (Whitehead et al, 2009; Woinarski, 2001). This continues to some
extent, but there is a notable lack of sustainable fire management policy and coordination
which can increase fire intensity and destruction, especially when compounded by the
impact of introduced species such as buffel grass (CSIRO, 2009a). There are attempts to
abate carbon on Indigenous land in West Arnhem Land under the West Arnhem Land
Fire Abatement project, a private agreement between ConocoPhillips and Indigenous
groups (Whitehead et al, 2009). Table 3 below identifies water availability, water use,
population and land use across the region.
Table 3: Drainage division profile (collated from CSIRO, 2009a and CSIRO, BOM and
BRS, 2010a,b)
Timor Sea Gulf Northern North
East
Jurisdictions NT and WA NT and QLD QLD
Population** 164, 436 55, 788 N/A
Size (km2) 564,600 647,000 50,000*
Temperature 28 c 28c* 28c
average for year
Run off (GL)** 70, 609 75,058 N/A
Stream flow per 90,000 90,000 17,000
year (GL)
Precipitation (mm) 868 900mm 1338
(mean) 1687 in north 1800 mm in north
383 in south 300 mm in south
Historical mean 1979 Considered to be 1853
evapotranspiration higher than
(mm) precipitation.
Storage capacity >11,234,871 780,623 N/A
(ML) **
Water use (GL)** 270 250 N/A
Irrigated agriculture >216 136 N/A
use (GL) **
Irrigated land (km2) 291 179 N/A
**
Pasture (km2) ** 145,172 126,935 N/A
* Approximate average ** (CSIRO, BOM and BRS 2010a,b).
4In the Timor Sea and Gulf drainage division the area cleared is
Other commitments made under the NWI (2004) include:
The creation of statutory water plans that provide sufficient water for the
environment;
Overcome barriers to enable trade in water through the creation of entitlements
and a risk sharing framework for variability in water availability;
Develop standards on water accounting, entitlement registers and water meters;
and,
Encourage best practice pricing (actual cost of storage and delivery).
The creation of water markets are a central platform of the NWI;1 and the development of
water markets has been a success story in southern Australia where almost all water
transactions occur (NWC, 2008). Across northern Australia a lack of demand and
sufficient water availability have not created the conditions to encourage water trading to
date. However, the ability to trade exists in all jurisdictions in the north.
1.4 Institutional Setting
Each state and territory has vesting legislation which assigns rights to water to the Crown
(see Table 2). The institutional, regulatory and legislative framework for water resource
management in jurisdictions across northern Australia is complex (Stoeckl et al, 2006;
Hegarty et al, 2005). These systems have developed independently to meet the specific
needs of each jurisdiction and are influenced by physical features, economic
considerations, political climate, community attitudes, and the existing legal and
institutional framework. Each jurisdiction has its own arrangements and different
terminology, which can make comparison difficult. In this report we use NWI consistent
terminology but will refer to each jurisdictions terminology when analyzing that specific
jurisdiction. Queensland for example uses ‗supplemented‘ to identify whether a system
has infrastructure to store and/or distribute water to users; and ‗unsupplemented‘ where
users self supply (while NWI terminology and that used in NT and WA is
regulated/unregulated).
1
The potential to trade water has existed in certain states in Australia since the 1980‘s to encourage trading
(Brooks and Harris, 2008).
6Table 4: Institutional Arrangements for water in jurisdictions
Northern Territory Queensland Western Australia
Legislation Water Act (1992) Water Act (2000) Rights in Water and
(amended 2004) Irrigation Act
(1914) (RIWI Act)
Regulation Water Regulations Rights in Water
2002 Irrigation
Regulations 2000
(WA)
Policies for water 80-20 guideline which Operational policy
trading provides that 80 % of 5.13- provides for
a system be set aside water entitlement
for the environment transactions for WA
and 20% for
consumptive use
Institutions charged Department of Natural Department of Department of
with water Resources, Environment and Water
management Environment, the Arts Resource
(NRETA) Management (DERM)
Officials responsible Controller of Water At direction of its Minister for Water
for management and Resources advises and Minister and Chief Resources
allocation of water reports to the Executive Officer
responsible Minister,
and issues, transfers
and amends licenses
Northern Territory
The Water Act (1992) (amended in 2004), provides the legislative underpinning for water
management in the NT. The Water Act sets the rules for licensing of groundwater and
surface water extraction as well as provides for trading. The Department of Natural
Resources, Environment, the Arts (NRETA) is responsible for administering the Water
Act, and a Controller of Water Resources advises and reports to the responsible Minister,
and issues, transfers and amends licenses. Trading can only occur within a Water Control
District which is declared by a Minister when there is sufficient need to do so (i.e.
reaching full allocation). Currently there are six Water Control Districts in the NT and
three finalized Water Allocation Plans, which sets the general trading rules. There is one
finalized plan in place in the study region of northern Australia, the Tindall aquifer in
Katherine. There are also draft water plans to be prepared for the Oolloo aquifer and
Mataranka region. While trading can occur in all regions, there have been no transactions
to date.
The protection of natural and cultural values is acknowledged as important in NT water
resource management (Northern Territory Government, 2009). This is reflected in the
policy approach to allocations- an 80/20 guideline. This approach seeks to set aside 80%
7of a system for cultural and ecological (or non consumptive) uses; while 20% can be
allocated for consumptive use.
Queensland
The Water Act (2000) provides for the management of Queensland‘s water resources,
outlining the planning, risk sharing and trading framework. The Department of
Environment and Resource Management (DERM) undertakes water planning and
administers the licensing and entitlement regime. In supplemented schemes (or regulated
systems) DERM administers the resource operations licenses which allow Sunwater (a
government business enterprise) to operate infrastructure. Trade in unsupplemented areas
(like in much of northern Australia) requires DERM approval.
DERM has a two-tiered water planning framework in place. The first tier is the Water
Resources Plan (WRP) which is 10 years in length. The WRP identifies the volume of
water resources available for consumptive and non consumptive uses in the catchment.
Compensation is payable to entitlement holders if the plans are changed before 10 years
and the value is affected. The Resources Operations Plan (ROP) converts existing water
licenses and interim water allocations to tradable water allocations, and this process
involves unbundling land and water title and defines the trading rules for the scheme.
Allocations in supplemented schemes are accorded high, medium and low security status.
High priority water is generally for drinking supplies (and sometimes mines) and medium
security to irrigation. Information on allocations is recorded on a register. 2 Queensland
has more water storages than its counterparts in northern Australia. The amount of water
available to allocation holders in supplemented schemes is determined according to a
water sharing index. This index is the mean of the percentage of number of months in the
simulation period (a historic period) for each priority group that allocations are fully
supplied. In supplemented schemes there is a contractual relationship between allocation
holders and Sunwater (a government business enterprise) that is ongoing.
In 2007-8 there were 3.6 GL of water entitlements issued in Queensland, with 75, 968
ML of trade, a value of $57.7 M, of which 44.5% was part of a property sale (NWC,
2008). Little of this occurred in the tropical northern belt.
2
Water entitlements that are converted under the ROP are recorded on the Water Allocations
Register. This register records details such as the holder/s of the water allocation, tenancy
arrangements, location, purpose, conditions and nominal volume. For supplemented water
allocations it will also record the relevant resource operations license and the priority group.
For unsupplemented allocations it details the water management area, extraction rate, flow
conditions, volumetric limit and water allocation group.
8Western Australia
The Rights in Water and Irrigation Act (1914) (RIWI Act) provides the framework for
water management. The Rights in Water and Regulations 2000 (WA) supports this Act.
Operational policy 5.13 provides for water entitlement transactions. Before trade can
occur the seller must hold a valid, tradable license. To be eligible for a license, persons
must have access to land. Only volumetric licenses can be traded to another party who
holds land. Licenses may be traded temporarily or permanently in part or whole (this may
only occur through a land sale).
The Department of Water is responsible for administering the RIWI Act, and provides
approvals to trade. Trade must occur within water resource management units (WRMU)
that generally cover a basin or aquifer. In 2008 there are 45 groundwater and 51 surface
water management areas in the state (NWC, 2008). A category is applied to systems in
the north based on the level of allocation to consumptive uses. Commencing at C1, where
25% of the consumptive pool is allocated, trading is not likely to occur until allocation
reaches C3 (75%) to C4 (100%) which is full allocation of the consumptive pool. As the
level of allocation increases towards C4 there is more research conducted and allocation
limits may be adjusted accordingly.
Water planning occurs at a State, Regional and local area Management Plan level. The
Ord River Surface Water plan is the only operational plan in the study region. Lake Ord
has a capacity of 101 GL and allocations are determined on flow data, ecological water
requirements and storage capacity. A reliable supply is determined for irrigators with full
allocations in 95 years out of 100 years. A Kimberley-wide Regional Plan is being
developed, which identifies broad principles of development and water use across the
region.
In 2007-8 there were 2.5 GL of water licenses issued in WA, with trade of 486 ML
mostly concentrated in the south west of the state (with a value of about $1 M), and 57 %
of water trade was associated with a property sale (NWC, 2008). No water trading has
occurred in the north, though the potential exists through the Ord Irrigation Cooperative,
between members of the Cooperative. The amount of water available to members is
based on areas they own under irrigation (about 17 ML per hectare). The level of security
is high to members, with access to full allocation provided in 95 years out of 100 (95%
security).
National Water Commission
Under the NWI each jurisdiction has committed to reform water management to NWI
standards. The National Water Commission (NWC) was established to drive and assess
9the pace of reform. 3 The Biennial Assessment of Progress in Implementation of the
National Water Initiative (NWC, 2008; 2009a) provides analysis on jurisdiction
performance. Trading statistics are summarized in the Australian Water Markets Report,
2007-2008 (NWC, 2008). The NWC has identified concerns around Indigenous access to
water (NWC, 2009a) and the level of science informing water planning (NWC, 2008).
For instance, ―Outside the MDB, planning and entitlement reforms need to be pushed
along to develop new and expanded markets for water‖ (NWC, 2009a: x).
Water Markets
Over the last three decades water planners and policy makers have put more focus on
demand based strategies to deal with water scarcity. Part of this approach has been the
use of market based instruments to improve water use efficiency and productivity (Gleick,
2003). Water markets enable the lease, amalgamation or transfer of whole or part of
water access entitlements or allocations. The use of market based approaches to re-
allocate water among users has been successfully implemented in jurisdictions such as
Chile, Australia and southern US states where agricultural and urban water supplies are
constrained (Bauer, 2004; Bjornlund, 2004; Crase et al, 2004; Howe et al, 1986; NWC,
2009a; Pigram, 1993; Saliba, 1987). On a global scale, however, the use of water markets
remains insignificant (Hadjigeorgalis, 2009).
The Australian water market is composed of discrete areas of trade defined by
administrative or geographic boundaries. About 98% of trade occurs in the states of NSW,
Victoria and South Australia, with the level of trade in water growing by 95% from 2007-
8 to 2008-9 to $2.2 billion. Much of this value increase has been in terms of water access
entitlements (NWC, 2009b). During drought in southern Australia water markets were
seen to offer flexibility to water users and reduced the impact of structural adjustment
(Bjornlund, 2004; NWC, 2009). While markets may be efficient in allocating water
among users, there is also the potential for third party impacts and social, ecological and
political considerations must be recognized in trading rules and regulations (Chong and
Sunding, 2006; Pigram, 1993). McKay and Bjornlund (2001) suggest that markets create
sustainability and social justice challenges, and this issue becomes more acute across
north Australia where Indigenous Australians are subject to a chronic socioeconomic
disadvantage. There is limited awareness among the Indigenous population of water
markets and there has been minimal Indigenous involvement in water reform (Jackson
and Morrison, 2007).
For water markets to be effective there are significant knowledge gaps that must be filled
to support efficacy (particularly in terms of ecological and social outcomes). For example,
3
The enabling Act for the NWC is the National Water Commission Act 2004, which provides for the NWC
to advise COAG and the Commonwealth government on national water resource issues and of state
progress against the NWI.
10Grafton and Peterson (2007) identify the need required for greater understanding around
flow regime and ecological considerations, social impacts from trade, water pricing and
transaction costs. Across northern Australia groundwater is not well understood (despite
its importance), further work is required to assess the customary and ecological
implications of extractions (Stoeckl et al, 2006; Straton et al, 2009). However, the NWC
notes that considerable progress has been made in reform since the implementation of the
NWI, particularly in the development of plans and markets (NWC, 2009a).
2. Climate Change
Over the last century there has been a measurable increase in global warming due to
climate change, very likely brought about by human activity (Australian Academy of
Science, 2010; IPCC, 2007a). Elevated levels of atmospheric greenhouse gases are the
prime contributor to climate change, and climate models indicate reducing emissions will
concurrently slow down global warming and its related impacts (IPCC, 2007a). Broadly,
across Australia, climate change is expected to increase temperatures, reduce rainfall and
increase the intensity of weather events such as cyclones and drought- this may likely
reduce water availability (Newton, 2009). While there is wide variation in the regional
impacts of climate change across the world, and in Australia, adaptation to climate
change impacts is recognized as a fundamental aspect of current and future human
development (Garnaut, 2008).
Year and Scenario Projections
The climate change scenarios used in this report are derived from climate change
simulations for 2030, 2050 and 2070 produced by the Commonwealth Scientific and
Industrial Research Organization (CSIRO) and the Bureau of Meteorology (BOM)
(CSIRO and BOM, 2007a). This online information will be supplemented by the
Technical Report released by CSIRO and BOM (2007b). These Australia specific
projections are based upon 23 global circulation models developed by the
Intergovernmental Panel on Climate Change (IPCC, 2007d). While these projections
cannot provide exact knowledge about future climate change and its impacts, they do
allow best estimates within a measured range of uncertainty of possible futures. Low, mid
and high emissions scenarios will be used to allow comparison of potential climatic
situations across these time periods. Although variation from 10th to 90th percentiles are
also provided online, the 50th percentile projections will be used here as illustrative of the
best estimate. Also, annual projections will be used here, although seasonal variations are
also provided online. The intent is to illustrate what kinds of broad climate changes could
be possible in the future of northern Australia.
The time period up to 2030 will see little variation from predicted mid-range climate
impacts as atmospheric gases impacting the climate for the next twenty years have
already been released. The emphasis up to this point is on adaptation to impacts at the
projected mid-range emission level, so while low and high emissions scenarios are
11presented in this report, the mid emission scenario (IPCC‘s A1B) is the most likely in
2030. However, the range of possibilities expands further into an uncertain future that
will be determined by emissions not yet released. To encompass the range of possibilities
in 2050 and 2070 the focus will be on the low (IPCC‘s B1) and high (IPCC‘s A1Fl)
emissions scenarios, although mid range is presented as well. These low, mid and high
emission scenarios are in comparison to a baseline of the present average, accounting for
climate model consistency (1980-1999).
It should be kept in mind that there are strong indications that a high emissions scenario
may be the most likely in the future. The Director of the Fenner School of Environment
and Society at the Australia National University indicates such in the following quote:
‗Both observed temperature and sea-level rise are tracking at or near the top of the
envelope of model projections. With regard to sea level, the current trajectory,
should it be maintained, would lead to a sea-level rise of nearly one meter by
2100, well above the median of the AR4 )IPCC Fourth Assessment Report)
projections and slightly above its upper projection.‘ (Steffen, 2007: 2).
This analysis is reiterated by the United States of America National Academy of Sciences,
who point out that current greenhouse gas emissions are actually exceeding what has
been projected by the IPCC estimates (Raupauch et al., 2007; Canadell et al., 2007).
What this indicates is that although climate models do not provide absolute certainty of
outcomes, there may be an even greater likelihood of the more severe changes associated
with high emissions scenarios in the future.
Overall trends in Australia
While there is significant regional variation, Australia wide there has been an overall
increase of average temperature by 0.9°C from 1950 to 2006, and this is expected to
increase in the future (CSIRO and BOM 2007b). Relative to 1990, it is estimated that
Australia‘s average annual temperature will have increased by 1°C under a mid range
scenario by 2030, with a range of uncertainty between 0.6°C to 1.5°C. Further into the
future, a low emissions scenario will put the average temperature increase in Australia at
about 1.5°C in 2050 and 1.8°C in 2070, while under high emissions the temperature
increase will be about 2.5°C in 2050 and 3.4°C in 2070 (CSIRO and BOM, 2007a).
12Figure 3: National annual temperature change 50th Percentile (CSIRO and BOM 2007a)
In regards to rainfall there have been increases in north-west and central Australia, but
substantial declines in eastern and southwestern Australia over the last sixty years. By
2030, it is expected that the annual average rainfall will be between -10% to +5% in the
north and -10% to 0% in the south. By 2070 the low emissions scenario could result in
-20% to +10% in the center, east and north and -20% to 0 in the south. The 2070 high
emissions case could lead to -30% to +20% in the center, east and north, and -30% to
+5% in the south (CSIRO and BoM, 2007a).
Figure 4: National annual rainfall change 50th percentile. (CSIRO and BOM, 2007a)
Other impacts include up to 20% more drought months by 2030 and 40% by 2070
Australia wide, with a concurrent increase in the length of the fire season. Severe weather,
13including cyclones and hail storms, is also predicted to increase in intensity along with
storm surges and higher sea levels (CSIRO and BoM, 2007b). An interesting projection
over the next fifty years is that the occurrence of tropical cyclones will possibly decrease
by 50% and the duration may decrease by about 0.3 days (Abbs, 2009). However, the
tropical cyclones that do occur will likely be more intense, exhibiting deeper pressures
and a greater proportion exhibiting maximum wind speeds (exceeding 25m/s) in the 2070
models than occurred in 1980 or the 2030 models (Abbs, 2009).
Sea level rise is projected to reach up to a meter by 2100, with regional variation that in
most cases will add to the level of increase (CSIRO, 2110a). The figures presented below
illustrate first the projected global sea level rise up to 2100, followed by a diagram of
projected departures from the mean global sea level rise in 2070. This second map
illustrates that parts of Australia will likely experience higher than average sea levels,
particularly the south-east, as well as the entire north and north-east coastline discussed in
this report.
Figure 5: Projected global sea-level rise for the 21st century. (CSIRO, 2010a).
The graph above illustrates the projected range of global averaged sea-level rise from the
IPCC 2001 Assessment Report (Church et al., 2001) by the lines and shading. The central
dark shading is an average of models for the range of SRES greenhouse gas emission
scenarios. The light shading is the range for all models and all SRES scenarios and the
outer bold lines include an allowance for land-ice uncertainty (CSIRO, 2010a).
14Figure 6: SRES A1B Projected Sea level Departures from the Global Mean (mm) 2070
(CSIRO, 2010b).
Overall, climate change projections – including changes in rainfall, temperature, carbon
dioxide and other climatic variables – if realized, are likely to affect forage and animal
production, and ecosystem functioning. The major known uncertainties in quantifying
climate change impacts on ecosystems are: (i) carbon dioxide effects on forage
production, quality, nutrient cycling and competition between life forms (e.g. grass,
shrubs and trees); and (ii) the future role of woody plants including effects of fire,
climatic extremes and management for carbon storage (McKeon et al, 2009). Despite
inherent uncertainties in the projections of impacts, it is expected that climate change will
result in significant changes to environmental, institutional and social systems across
Australia.
Overview of Environmental Impacts across North
Northern Australia is likely to experience hotter temperatures, more intense rainfall and
more intense cyclone events, and rising sea level due to climate change. As a result,
coastal areas will be at greater risk of erosion and salt water inundation, while inland
areas are likely to experience greater extremes in temperature with more droughts and
flooding, dust storms and bushfires (CSIRO, 2009a; Green 2006). By 2030, northern
Australia will likely see increased temperatures and although some areas will receive
more rainfall, there will be less water available overall, with ecosystems under increased
pressure (Hyder Consulting, 2008). Cyclones and other severe weather will likely
increase in intensity, if not frequency, and this in conjunction with rising sea levels will
threaten low lying areas such as Kakadu National Park and sea ports in the Kimberley
and Cape York regions (Northern Australia Land and Water Taskforce, 2009).
The table below provides an overview of the climate change impacts in Northern
Australia related to changes in temperature, rainfall, evapotranspiration and days of
15+35°C. Although most climate change impacts across the north are largely similar
amongst the three regions, some slight variations can be appreciated, particularly within
the Kimberley. The north of Western Australia is more likely to experience greater
variability in future rainfall, evapotranspiration and hot days than the eastern regions of
north Australia. At the same time, northern Queensland may not experience the same
level of temperature increases as the western regions until after 2050 (high). This data is
described in more detail in the individual regional projections provided in the next
section.
Table 5: Climate Change impacts across Northern Australia (2030, 2050 and 2070)
(Annual, 50th percentile) (CSIRO and BOM 2007a; Hennessy et al 2010, in review).
Changes relative to Western Australia Northern Queensland
1990 in: (Northern Region) Territory (Northern Region)
(Northern Region)
Temperature °C
2030 (mid) 1.5 0.6 to 1.5 1
2050 (low) 1 to 1.5 1 to 1.5 0.6 to 1.5
2050 (high) 2 to 2.5 1.5 to 2 1.5 to 2.5
2070 (low) 1.5 to 2.5 1 to 2 1 to 2
2070 (high) 2.5 to 4 2.5 to 4 2.5 to 4
Rainfall (%)
2030 (mid) -2 to +2 -2 to +2 -2 to +2
2050 (low) -5 to +2 -2 to +2 -5 to +2
2050 (high) -10 to +2 -5 to +2 -5 to +2
2070 (low) -10 to +2 -5 to +2 -5 to +2
2070 (high) -20 to +2 -10 to +2 -10 to +2
Evapotranspiration
(%)
2030 (mid) 2 to 4 2 to 4 2 to 4
2050 (low) 4 to 8 2 to 4 2 to 4
2050 (high) 4 to 8 4 to 8 4 to 8
2070 (low) 4 to 8 4 to 8 4 to 8
2070 (high) 8 to 12 8 to 12 8 to 12
Days +35 °C (Broome) (Darwin) (Cairns)
Current 38 11 3.8
2030 (mid) 83 37 6
2050 (low) 93 49 7
2050 (high) 127 98 13
2070 (low) 110 74 9
2070 (high) 193 188 35
In northern Australia water availability may not seem to be a critical issue because of
current high levels of rainfall and predictions of minimal change for 2030. Although
highly variable, the average annual rainfall in Northern Australia is 1 077 000 GL, most
of which falls during the wet season, between November and April (CSIRO, 2009a).
16However, the area is described as ‗water-limited‘ despite the large amount of rainfall
because of the high rate of evaporation and plant transpiration (evapotranspiration)
during most of the year (CSIRO, 2009a). Another factor negatively impacting water
availability is a lack of suitable surface water storage options, and significant longer term
impacts from groundwater extraction, although current demands pose little threat. Overall,
the area is expected to experience similar levels of rainfall in 2030 to the historical
average, and slightly higher levels of evapotranspiration (CSIRO, 2009a). It is expected
that rainfall intensity will likely increase, along with severe weather events, as the air will
be both warmer and more moisture laden (McKeon et al, 2009). However, it is difficult to
project future rainfall patterns because unlike temperature, which directly correlates to
greenhouse gas concentrations, rainfall depends on general atmospheric circulation,
which often leads to discrepancies between models (CSIRO and BOM, 2007b). It should
also be kept in mind that climate models become less predictive at smaller scales and
while they can indicate general trends, future regional changes are less certain.
Northern Australia encompasses nineteen defined bioregions and a wide range of habitats,
including the world‘s largest intact tropical savannah and a vast network of tropical rivers
and wetlands (ATRG, 2004). Other ecosystems in the North include monsoon and rain
forests, coral reefs, mangrove systems, heathlands and mound springs (Hyder Consulting,
2008). Hyder Consulting (2008) provide an overview of the impact of climate change on
northern ecosystems over the next twenty years. They argue that coastal low lying
wetlands are at medium to high risk due to climate impacts such as rising sea levels, and
increased severe weather and sea water inundation, as well as expanding agricultural,
urban and industrial infrastructure. Coral reefs are also at high to medium risk, as are
tropical rainforests and tropical savannahs and small island environments. Tropical rivers
are said to be at low to medium risk chiefly because of rainfall variability. Biodiversity
across northern Australia is expected to be reduced significantly by 2020, particularly
because of impacts to the Great Barrier Reef, Kakadu wetlands and Queensland‘s tropical
north. In each case, it is argued that the physical impacts of climate change can be
seriously exacerbated by poor planning that weakens rather than strengthens ecosystem
responses (Hyder Consulting, 2008).
Overview of Socio-Economic Impacts across North
Climate change will most likely impact each of the dominant industries across the north,
namely agriculture, tourism and mining, as well as human infrastructure, health and
culture. However, the extent of negative consequences can be determined by both public
and institutional adaptive strategies (Hyder Consulting, 2008). Agriculture and
pastoralism will experience largely negative impacts from more intense climatic
conditions jeopardizing growing conditions and territory (McKeon et al, 2009; Gunaskera
et al, 2007; Department of Climate Change and Energy Efficiency, 2010). The mining
industry may experience declines in certain areas, as global demand for resources such as
coal and aluminum decreases because of responses to climate change (Queensland
Government, 2009). However, as with agriculture, climate change could deliver new
opportunities in the mining sector, with demands for carbon neutral energy sources such
17as uranium expected to grow (Queensland Government, 2009). The tourism sector across
the north is expected to be negatively impacted by climate changes that alter or destroy
important natural attractions such as the Great Barrier Reef and wetlands and rainforests
(Queensland Government, 2009; Department of Climate Change and Energy Efficiency,
2010). Rising temperatures and numbers of extremely hot days could also make the north
a less attractive tourist destination.
For residents of northern Australia, climate change will likely make living more difficult
through negative impacts on infrastructure, human health and cultural life. Increased
erosion, salt water inundation and extreme weather events will put transportation,
residential and commercial infrastructure at risk. Potable water supply could be
increasingly vulnerable without adequate adaptation, as ground and surface water
storages are depleted, especially in remote areas (CSIRO, 2009a; Hyder Consulting,
2008). Health problems such as heat related illnesses and deaths, and food and water
borne diseases may increase along with rising temperatures (Green, 2006). Mosquito
born diseases are also likely to increase in frequency and area. Remote communities in
particular, many of them aboriginal, will be at elevated risk of health impacts (Green,
2006). At the same time, aboriginal social and cultural vitality could be jeopardized by
the destruction of ecosystems central to cultural continuity and mental wellbeing (Green,
2006). Overall, the projected increased intensity of heat and extreme weather in the north
will likely make life more difficult for the majority, although many of the socio-economic
impacts highlighted here can be moderated by proactive planning.
18You can also read