THE CRITICAL DECADE: extreme weather
←
→
Page content transcription
If your browser does not render page correctly, please read the page content below
THE CRITICAL
                                                                                                                        DECADE:
                                                                                                                        extreme
                                                                                                                        weather

                                                                                                  THE CRITICAL DECADE
                                                                                                  EXTREME WEATHER
Written by Professor Will Steffen, Professor Lesley Hughes and Professor David Karoly.
Published by the Climate Commission Secretariat
(Department of Industry, Innovation, Climate Change, Science, Research and Tertiary Education).
www.climatecommission.gov.au
ISBN: 978-1-925006-06-3 (print)
       978-1-925006-07-0 (web)
©Commonwealth of Australia 2012.
This work is copyright the Commonwealth of Australia. All material contained in this work
is copyright the Commonwealth of Australia except where a third party source is indicated.
Commonwealth copyright material is licensed under the Creative Commons Attribution 3.0
Australia Licence. To view a copy of this licence visit http://creativecommons.org.au
You are free to copy, communicate and adapt the Commonwealth copyright material so long
as you attribute the Commonwealth of Australia and the authors in the following manner:
The Critical Decade: Extreme Weather by Professor Will Steffen, Professor Lesley Hughes
and Professor David Karoly (Climate Commission).

©Commonwealth of Australia (Department of Industry, Innovation, Climate Change, Science,
Research and Tertiary Education) 2012.
Permission to use third party copyright content in this publication can be sought from the
relevant third party copyright owner/s.
IMPORTANT NOTICE – PLEASE READ
This document is produced for general information only and does not represent a statement
of the policy of the Commonwealth of Australia. While reasonable efforts have been made to
ensure the accuracy, completeness and reliability of the material contained in this document,
the Commonwealth of Australia and all persons acting for the Commonwealth preparing
this report accept no liability for the accuracy of or inferences from the material contained
in this publication, or for any action as a result of any person’s or group’s interpretations,
deductions, conclusions or actions in relying on this material.                                                         April 2013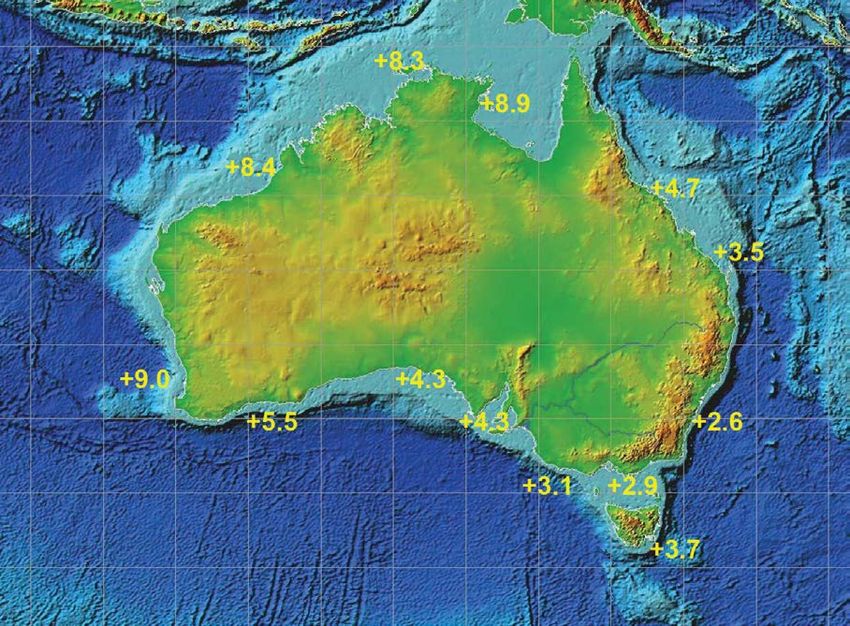
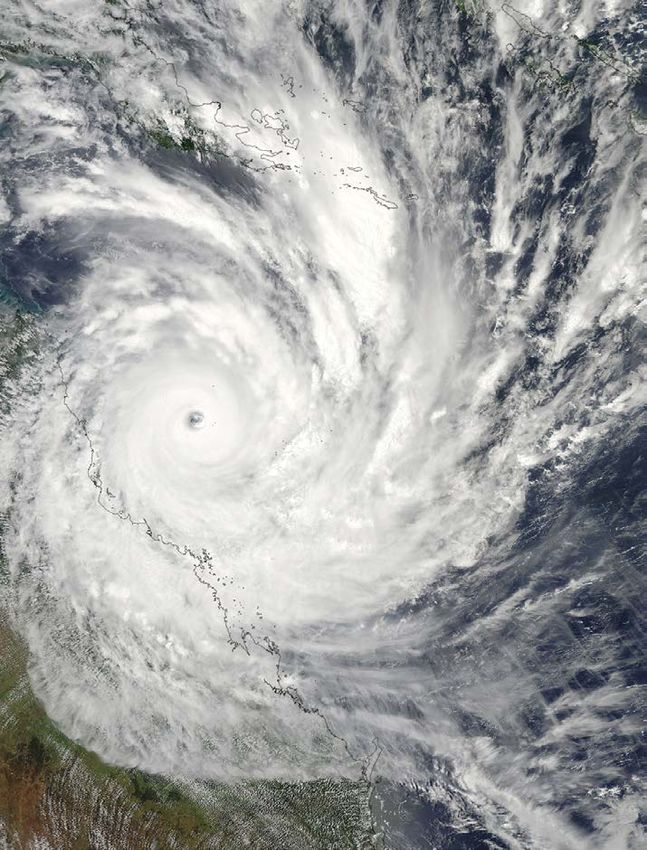
Extreme weather has                Heatwaves have become longer and hotter. The                                            A hotter, moister global climate provides
                                   number of record hot days in Australia has doubled
                                                                                                                           more energy for tropical cyclones.
always occurred.                   since the 1960s.
                                                                                                                           Cyclones are likely to become
                                   Australians will face extreme         heatwaves
But due to additional                                                                                                      more intense but less frequent.
                                   and hot    days far more often.
greenhouse gases
in the atmosphere, the
climate system                                                                                                                 Heavy rainfall events are increasing. Record
                                                                                                                               sea surface temperatures fuelled recent very
now contains                                                                                                                   heavy rainfall events on the east coast, with
significantly more                                                                                                             damaging flooding.
                                                                                                                               Across much of Australia, when rain comes
heat compared to                                                                                                               there is a higher risk of heavy rainfall.

50 years ago.
                               Global sea level has risen 0.2 m over the last
                               century. Coastal flooding happens more often
This means that                when storm surges occur on higher sea levels.

                               Further rises in sea level will drive
all extreme weather            major impacts to coastal cities.
events are

influenced                                                                                                                           Hotter and drier conditions have contributed to
                                                                                                                                     increased bushfire weather risk in southeast
                                  Southwest and southeast Australia have
                                                                                                                                     Australia.
by climate change.                become drier.
                                                                                                                                     Continued increases in hot and dry weather
                                  In these regions droughts are likely to
                                                                                                                                     will likely increase the frequency of
                                  happen even more        often.
                                                                                                                                     extreme fire danger days.
The severity
and frequency
of many extreme
                         Extreme events have major impacts
weather events are                                                     How quickly and deeply we reduce greenhouse gas emissions
                                  environmental                        will greatly influence the severity of extreme events our children
increasing due to                                                      and grandchildren experience.
                                  social

climate change.                   economic                             Find out more: www.climatecommission.gov.au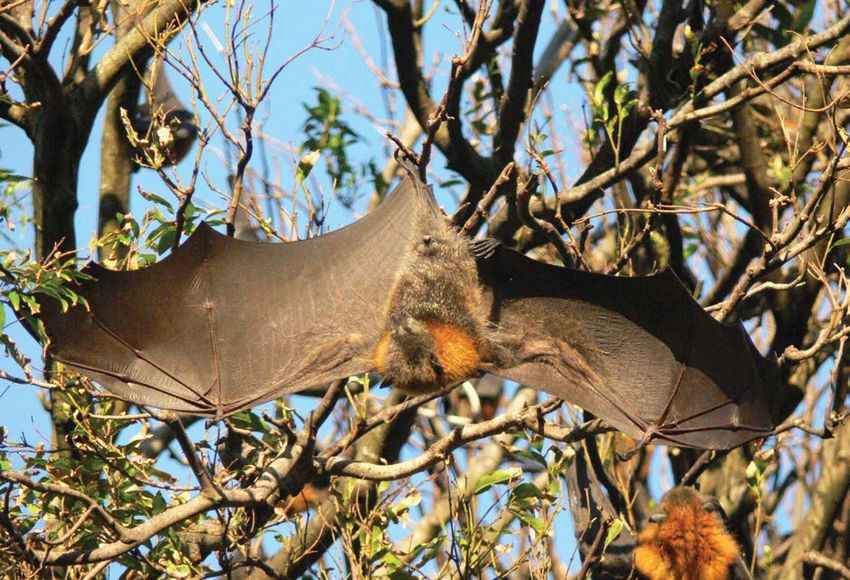
CONTENTS
     Preface / 3
     Key facts / 4
1.   Living in a land of extreme weather / 6
2. 	Temperature-related extreme events / 13
2.1 Heatwaves and hot weather / 14
2.2. Extreme cold weather events / 22
3. 	Rainfall and drought / 24
3.1 Heavy rainfall events / 25
3.2 Drought / 29
4.   Bushfires / 37
5. 	Sea-level rise and coastal flooding / 43
5.1 High sea-level events / 44
5.2 ‘Double whammy’ coastal flooding / 51
6. 	Tropical cyclones and storms / 52
6.1 Tropical cyclones / 53
6.2 Storms / 56
	References / 57

                                               Page 1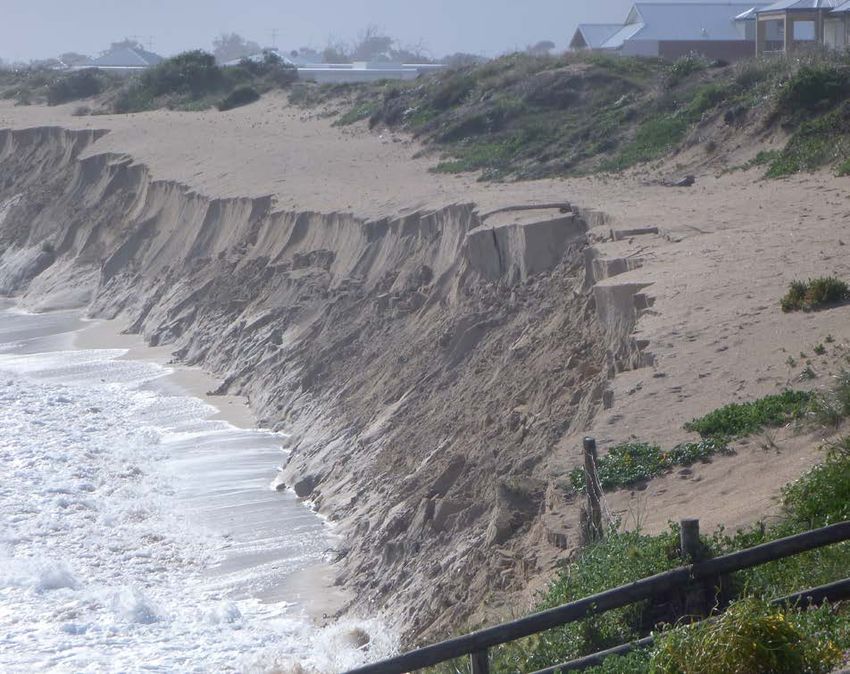
The Critical Decade:
Extreme Weather

Page 2
Preface

Preface
The Climate Commission brings together internationally renowned climate
scientists, as well as policy and business leaders, to provide an independent
and reliable source of information about climate change to the Australian public.

This is the Climate Commission’s 24th            We would like to thank our fellow
publication and follows a series of reports on   Commissioners and acknowledge the
the science and impacts of climate change,       reviewers who provided advice for this report,
the opportunities in Australia associated        including the Science Advisory Panel,
with taking action to reduce greenhouse          Dr Lisa Alexander (temperature-related
gas emissions and international action on        extreme events and rainfall), Dr Seth Westra
climate change.                                  (heavy rainfall events), Professor Ross
                                                 Bradstock (bushfires), Dr John Hunter (sea-
When extreme weather events occur the            level rise and coastal flooding) and Professor
Climate Commission is consistently asked         Kevin Walsh (tropical cyclones and storms).
questions about the link to climate change.
This report unpacks our current knowledge        The authors retain sole responsibility for the
about different types of extreme weather         content of the report.
events: extreme temperatures, rainfall,
drought, bushfires, storm surges, cyclones
and storms.
For each weather event the report considers:
››   the definition of the extreme event         Professor Will Steffen
››   their consequences for the things that      Climate Commissioner
     matter to us
››   observations of the event over the last
     several decades or longer
››   the influence of climate change
››   how the event is expected to change         Professor Lesley Hughes
     through the rest of this century.           Climate Commissioner
The introductory section of the report and
introductions to each extreme weather event
are written in accessible language. However,
the body of the report is somewhat more
technical as it provides much more scientific    Professor David Karoly
detail on the nature of the event and how it     Science Advisory Panellist
is changing.                                     Leader, Extremes Research Program,
                                                 ARC Centre of Excellence for Climate
The information in this report is compiled
                                                 System Science
from the most authoritative sources.
                                                 Professor of Climate Science,
A reference list is included at the end for
                                                 University of Melbourne
those who would like further information
on a particular subject.
                                                                                                   Page 3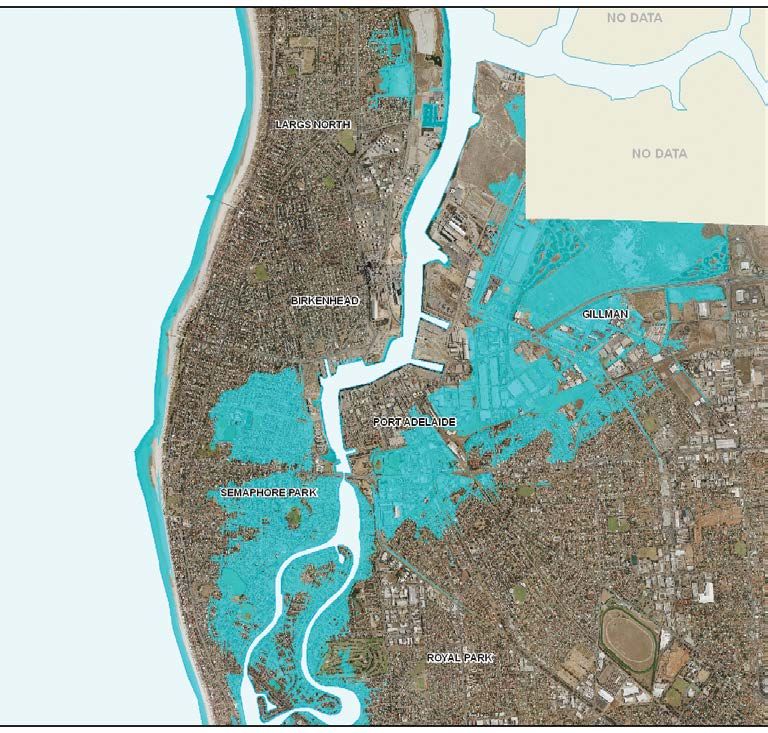
The Critical Decade:
Extreme Weather

               Key
               FACTS:
                       1. Climate change is already increasing                   ∙∙   Sea-level rise: Sea level has already
                          the intensity and frequency of many                         risen 20 cm. This means that storm
                          extreme weather events, adversely                           surges ride on sea levels that are
                          affecting Australians. Extreme                              higher than they were a century ago,
                          events occur naturally and weather                          increasing the risk of flooding along
                          records are broken from time to time.                       Australia’s socially, economically
                          However, climate change is influencing                      and environmentally important
                          these events and record-breaking                            coastlines.
                          weather is becoming more common                  2. Climate change is making many
                          around the world.                                   extreme events worse in terms of
                          ›› Some Australian examples include:                their impacts on people, property,
                              ∙∙ Heat: Extreme heat is increasing             communities and the environment.
                                 across Australia. There will still be        This highlights the need to take rapid,
                                 record cold events, but hot records          effective action on climate change.
                                 are now happening three times more           ›› It is crucial that communities,
                                 often than cold records.                        emergency services, health and medical
                              ∙∙ Bushfire weather: Extreme fire                  services and other authorities prepare for
                                 weather has increased in many parts             the increases that are already occurring
                                 of Australia, including southern NSW,           in the severity and frequency of many
                                 Victoria, Tasmania and parts of South           types of extreme weather.
                                 Australia, over the last 30 years.           ›› The southeast of Australia, including
                              ∙∙ Rainfall: Heavy rainfall has                    many of our largest population centres,
                                 increased globally. Over the last               stands out as being at increased risk
                                 three years Australia’s east coast              from many extreme weather events -
                                 has experienced several very heavy              heatwaves, bushfires, heavy rainfall and
                                 rainfall events, fuelled by record-high         sea-level rise.
                                 surface water temperatures in the            ›› Key food-growing regions across the
                                 adjacent seas.                                  southeast and the southwest are likely to
                              ∙∙ Drought: A long-term drying trend               experience more drought in the future.
                                 is affecting the southwest corner            ›› Some of Australia’s iconic ecosystems
                                 of Western Australia, which has                 are threatened by climate change. Over
                                 experienced a 15% drop in rainfall              the past three decades the Great Barrier
                                 since the mid-1970s.                            Reef has suffered repeated bleaching
                                                                                 events from underwater heatwaves. The
                                                                                 freshwater wetlands of Kakadu National
                                                                                 Park are at risk from saltwater intrusion
                                                                                 due to rising sea level.

Page 4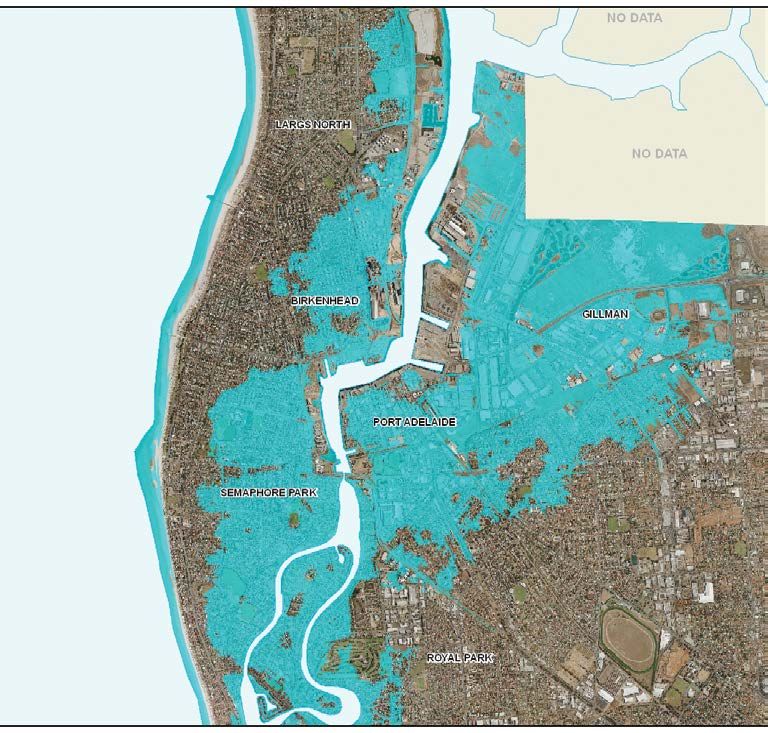
Key facts

3. The climate system has shifted, and                   greenhouse gases that have already been
   is continuing to shift, changing the                  emitted, and those that will be emitted
   conditions for all weather, including                 in future. This means that it is highly
   extreme weather events.                               likely that extreme weather events will
   ›› Levels of greenhouse gases from the                become even more severe in Australia
      combustion of fossil fuels have increased          over that period.
      by around 40% since the beginning of         5. Only strong preventive action now and
      the Industrial Revolution, causing the          in the coming years can stabilise the
      Earth’s surface to warm significantly.          climate and halt the trend of increasing
   ›› All weather events are now occurring            extreme weather for our children and
      in global climate system that is warmer         grandchildren.
      and moister than it was 50 years ago.           ›› Averting danger requires strong
      This has loaded the dice towards more              preventative action. How quickly and
      frequent and more severe extreme                   deeply we reduce greenhouse gas
      weather events.                                    emissions will greatly influence the
4. There is a high risk that extreme                     severity of extreme events in the future.
   weather events like heatwaves, heavy               ›› The world is already moving to tackle
   rainfall, bushfires and cyclones will                 climate change. Ninety countries,
   become even more intense in Australia                 representing 90% of global emissions,
   over the coming decades.                              are committed to reducing their
   ›› There is little doubt that over the next           emissions and have programs in place
      few decades changes in these extreme               to achieve this. As the 15th largest
      events will increase the risks of adverse          emitter in the world, Australia has an
      consequences to human health,                      important role to play.
      agriculture, infrastructure and the             ›› Much more substantial action will
      environment.                                       be required if we are to stabilise the
   ›› Stabilising the climate is like turning            climate by the second half of the century.
      around a battleship – it cannot be done            Globally emissions must be cut rapidly
      immediately given its momentum. When               and deeply to nearly zero by 2050, with
      danger is ahead you must start turning             Australia playing its part.
      the wheel now. Any delay means that             ›› The decisions we make this decade will
      it is more and more difficult to avert the         largely determine the severity of climate
      future danger.                                     change and its influence on extreme
   ›› The climate system has strong                      events that our grandchildren will
      momentum for further warming over                  experience. This is the critical decade
      the next few decades because of the                to get on with the job.

                                                                                                      Page 5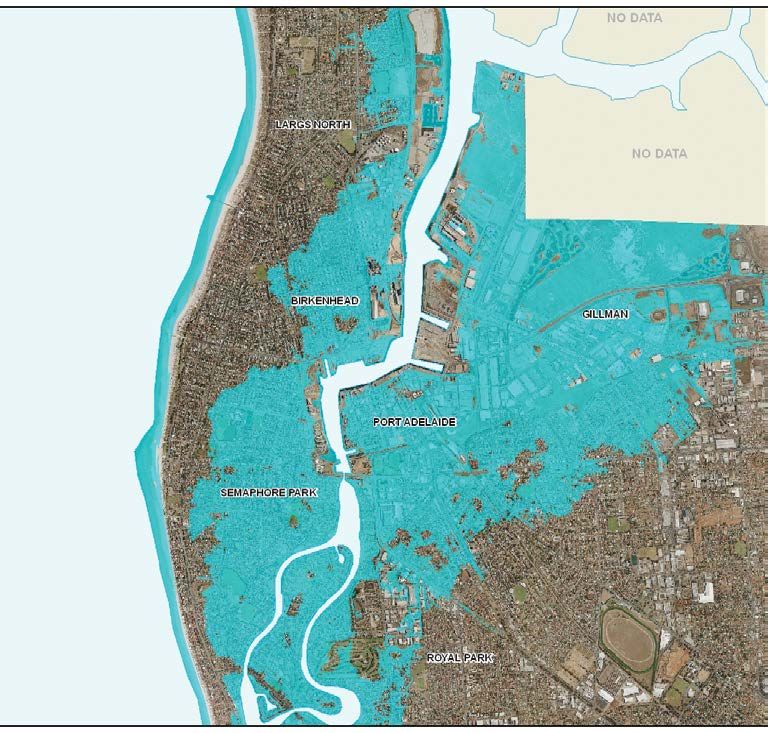
The Critical Decade:
Extreme Weather

                       1.
                       Living in a land
                       of extreme
                       weather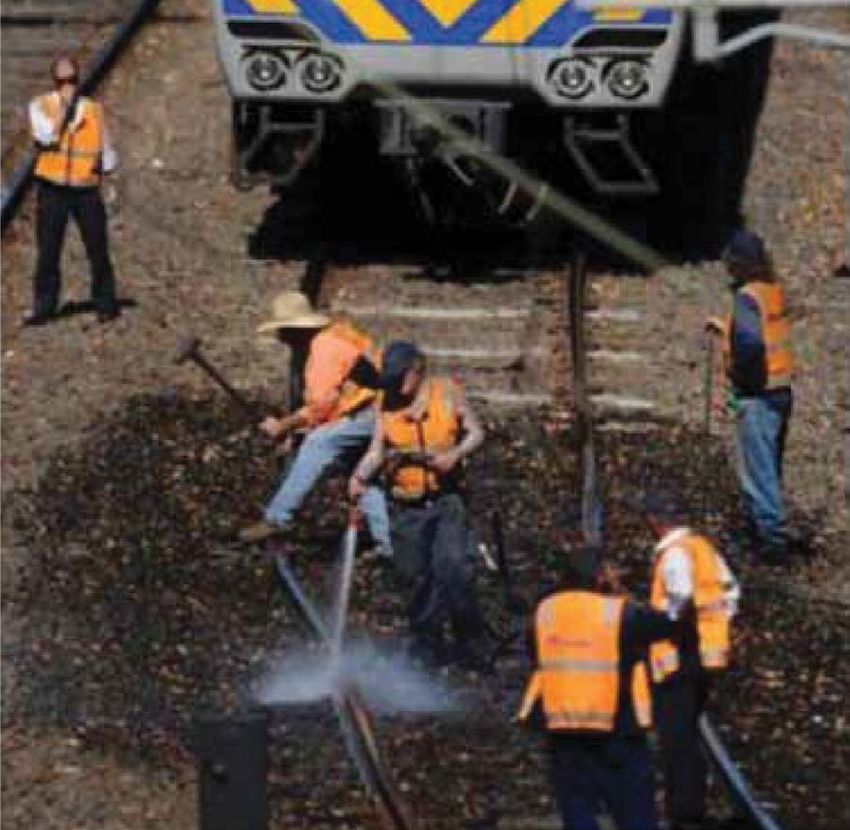
Living in a land of extreme weather
/01
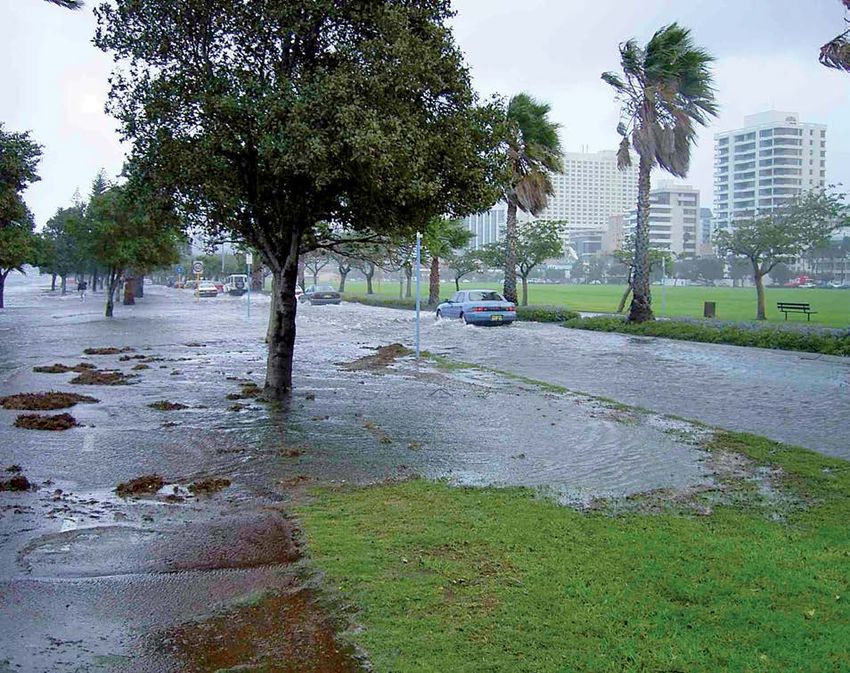
Figure 1: Some of the many examples of extreme weather events in Australia. Pictured are: the township of
Omen, Victoria, after the Black Friday bushfires (1939); Brisbane in flood (1974); Darwin after cyclone Tracy
(1974); damage to Naringal Primary School, east of Warrnambool, Victoria after Ash Wednesday bushfires
(1983); the Millennium Drought (1997-2009); fires approaching a home in Steels Creek, Victoria during the
Black Saturday bushfires (2009); and Eagle Street Pier, Brisbane being flooded in January 2011.
Sources (in order): Museum Victoria MM002905; National Archives of Australia: A6135, K19/2/74/13;
wikicommons/Billbeee; © State of Victoria, Department of Sustainability and Environment, 1983; Arthur
Mostead; wikicommons/Daniel Cleaveley; and Peter Wallis in the Courier Mail, 13 January 2011.
The occurrence of extreme weather events is Since federation, our experiences of extreme
not unusual in the Australian landscape or to weather have been described through a more
the Australian people. modern lens (Figure 1). Importantly, science
has played a role in both recording and
Extreme weather events (Box 1) have been understanding events such as the Federation
etched into Australian culture and history Drought (1895-1902), the Black Friday
over 40,000 years or more. Indigenous peoples bushfires (1939), the Brisbane floods of 1974,
have depicted their experience of extreme cyclone Tracy (1974), the Ash Wednesday
weather events in paintings and stories, while bushfires (1983), the Sydney hailstorm (1999),
colonial history is rich with descriptions of the Millennium Drought (1997-2009), the
the impact of climate on settlers. For many Black Saturday bushfires (2009), the Brisbane
Australians, this quintessential aspect of floods of 2011, and cyclone Yasi (2011).
our continent is best expressed in Dorothea
Mackellar’s poem My Country - ‘of droughts Our knowledge of Australian weather and
and flooding rains’. climate is now vastly greater than a century
ago, and it is with this knowledge that we
approach a new century, and new challenges.
Page 7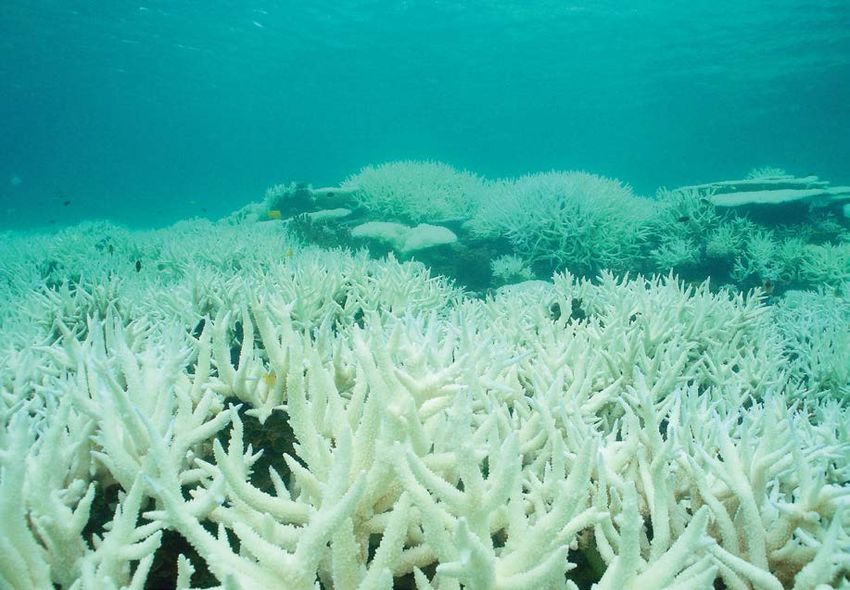
The Critical Decade:
Extreme Weather

                       Extreme events adversely affect Australians      the southeast and the southwest of Australia,
                       through significant impacts on health,           while northwest Australia has become wetter
                       property, infrastructure and ecosystems.         (see Figure 22). Warmer oceans around the
                       Extreme events take lives, cause injuries        continent contributed to the very heavy
                       and can lead to psychological trauma and         rainfall during the 2010-2011 period.
                       longer-term stress. Their economic costs can
                       often be very high. For example, the cost of     The changes observed in the nature of
                       the 2009 Black Saturday bushfires to Victoria    extreme events around Australia are part
                       was estimated to be about $4.4 billion (PoV,     of a global pattern. During the past decade
                       2010). Floods also cause significant economic    unusually severe heatwaves, which cost
                       damages, with the Queensland floods of           tens of thousands of lives, occurred in the
                       2010/2011 costing in excess of $5 billion        central regions of Western Europe, Greece,
                       (QFCI, 2012). The Sydney hailstorm of 14         Russia and the United States. On balance
                       April 1999 was Australia’s most costly storm     heavy rainfall is increasing around the world
                       in terms of insured losses, which totalled       (IPCC, 2012). Global average sea level has
                       $4.3 billion (normalised to 2011) (Insurance     risen by about 20 cm since the late 1800s and
                       Council of Australia, 2013; Crompton, 2011;      is currently rising at about 3 mm per year,
                       Crompton and McAneney, 2008).                    increasing the risk of coastal flooding in many
                                                                        low-lying areas around the world.
                       The basic features of the global climate
                       system have now shifted and are continuing       Extreme events often have adverse
                       to shift. The system is now warmer and           consequences for health, survival, property,
                       moister than it was 50 years ago, and this       infrastructure and ecosystems. Awareness of
                       is influencing all extreme weather events        the influence of climate change on extreme
                       (Trenberth, 2012). Greenhouse gases in the       weather is critical to enable communities,
                       atmosphere trap heat at the Earth’s surface      emergency services, health services and other
                       and in the lower atmosphere. Greenhouse          authorities to prepare for the future.
                       gases have increased by around 40% since         Just like turning around a battleship, we
                       the industrial revolution, which causes          cannot turn around the increase in the
                       substantially more heat to be trapped. There     severity and frequency of extreme events
                       is vastly more heat in the ocean and in the      immediately. Extreme heat is virtually certain
                       atmosphere, ice is melting at the poles and      to increase over coming decades. Bushfire
                       on high mountain ranges, and the circulation     weather also generally increases as the
                       of the air and seas is changing. This extra      atmosphere becomes hotter. Coastal flooding
                       heat means that the climate is now more          and beach erosion will happen more often as
                       energetic. This is making many extreme           the sea level continues to rise. The southeast
                       weather events more frequent and more            and southwest of the continent are likely
                       severe (Box 2).                                  to experience more droughts in the future.
                       Severe heat is increasing. The number of         Tropical cyclones are likely to occur less often
                       record hot days across Australia has doubled     but bring stronger winds and heavier rainfall.
                       since the 1960s, and there has also been a       There is little doubt that over the next several
                       significant increase in the frequency of days    decades changes in these extreme events will
                       over 35oC in the last 50 years (CSIRO and        increase the risks of adverse consequences.
                       BoM, 2012). Bushfire weather conditions
                       are being exacerbated by the increase in
                       extreme heat. Sea-level rise is increasing the
                       risk of coastal flooding and beach erosion.
                       Shifting atmospheric circulation patterns are
                       leading to increasing drought conditions in
Page 8
Living in a land of extreme weather
/01
To turn around the battleship you must start
turning the wheel now. Any delay in turning
the wheel just means that the battleship
gets closer to danger and it becomes more
and more difficult to avert the danger.
Strong preventative action now and in the
coming years can gradually slow and then
halt the long-term trend toward more severe
extreme events. How quickly and deeply
we reduce global greenhouse gas emissions
will greatly influence the severity of extreme
events that our children, and especially our
grandchildren, will experience. This is the
critical decade to get on with the job.
Strong preventative
action now and in
the coming years can
gradually slow and then
halt the long-term trend
toward more severe
extreme events ... This is
the critical decade to
get on with the job.
Page 9The Critical Decade:
Extreme Weather
Box 1: Extreme weather events: basics
Many different terms are used to describe extreme weather events and it is important to
clearly define the terms that are used in this report.
Extreme weather or climate events
The term extreme weather or climate event refers to “an occurrence of a value of a weather
or climate variable beyond a threshold that lies near the end of the range of observations for
the variable” (IPCC, 2012). It is a weather or climate event which is unusually intense or long,
occasionally beyond what has been experienced before. Examples include very high (and low)
temperatures, very heavy rainfall (and snowfall in cold climates), and very high wind speeds.
By definition, extreme events occur only rarely, and they are noticeable because they are so
different from the usual weather and climate, and because they are associated with adverse
impacts on humans, infrastructure and ecosystems.
Extreme weather events are often short-lived, abrupt events lasting only several hours up to
several days; they are ‘shocks’ within the climate system. Examples include extremely hot
days, very heavy rainfall, hail storms, and tropical cyclones. These are ‘acute’ extreme events.
A few extreme events can last for much longer periods of time and are usually termed extreme
climate events. These are ‘chronic’ extreme events. An example all Australians are familiar
with is drought, which is a significant lack of rainfall over a period of months to years.
While there are obvious and immediate effects of extreme weather events, changes in average
weather or climate conditions are also associated with impacts. Slow, ongoing changes in
the average state of the climate system occur over decades, centuries or even millennia. In
the context of human-driven climate change, the obvious example is the Earth’s rising ocean
and air average temperatures. Other examples are the increasing acidity of the ocean due
to the increasing absorption of carbon dioxide from the atmosphere and the rise of sea level.
Such slow changes have important longer-term consequences. In particular, shifts in the
average climate state can increase vulnerability, or undermine the resilience, of communities
and ecosystems to the shocks of extreme weather events. While these shifts are described as
‘slow’, human-driven climate change is exceedingly fast on geological timescales, around 100
times faster than the periodic natural climate shifts between ice ages and warm periods. Such
rapid change seriously threatens the resilience of natural ecosystems, and will increasingly
challenge the ability of our society to cope.
Combinations of extreme events
In many cases the most severe impacts are felt when several extreme events occur together.
Examples include: (i) the impacts on agriculture of a combination of drought and a heatwave;
(ii) high bushfire danger weather, which can be a combination of high temperature, low
humidity, high wind and drought.
Extreme weather and climate events can also combine with unrelated factors to drive impacts
on society, infrastructure or ecosystems. Examples include: (i) inland flooding, which is
associated with very heavy rainfall but also influenced by the condition of the catchment and
flood mitigation infrastructure such as dams; and (ii) coastal flooding (sometimes called ‘a
high sea-level event’), which is often driven by the combination of a high tide, a storm surge
and rising sea level.
Page 10Living in a land of extreme weather
/01
Consequences of extreme weather events
The consequences of an extreme weather event also depend on the exposure, vulnerability and
adaptive capacity of the people, infrastructure or ecosystem affected by the event.
Exposure refers to the degree that people place themselves, their property and our
infrastructure in places where they could be adversely affected by an extreme event. An
example is where settlements have been placed on the flood plain of a river.
Vulnerability refers to the propensity to suffer negative impacts from an extreme event. For
example, children and elderly people are more vulnerable to extreme heat events. Vulnerability
is sometimes described as a lack of resilience.
Adaptive capacity refers to the ability to adjust to actual or expected extreme events (or
climate in general) to reduce the adverse impacts and to take advantage of opportunities
(adapted from IPCC, 2012). For example, people with chronic health conditions have less
adaptive capacity than healthy people.
Box 2: Extreme weather and climate change: the science
Much of the discussion of extreme weather events and climate change is based on the wrong
question. The question is not whether climate change has ’caused’ an extreme weather event
or whether such an event can be ‘attributed’ to climate change. Extreme weather events are a
natural feature of the climate system and occur with or without human-driven climate change.
The real question is how climate change is influencing extreme weather events. All extreme
weather events are now influenced by climate change (Trenberth, 2012). Compared to 50 years
ago the climate system of today contains significantly more heat because of the additional
greenhouse gases in the atmosphere, and all extreme weather events are happening in this
more energetic climate.
The critical issue is the extent to which this more energetic climate is influencing extreme
weather events.
What is important is how extreme weather is changing:
1) in frequency
2) in intensity or severity
3) in geographical extent (for instance, whether drought-prone areas are increasing).
Ultimately, the most important question is how human-driven climate change is making
extreme weather events worse in terms of their adverse impacts on people, infrastructure
and ecosystems.
Page 11The Critical Decade:
Extreme Weather
How do we know if an extreme weather event has been influenced by climate
change?
Scientists use multiple lines of evidence to explore how climate change might influence
extreme weather events now and into the future.
›› Understanding the basic physical processes of the climate system – for example, that a
warmer atmosphere can hold more water vapour – provides important insights. Much of
what we understand about climate, and climate change, stems from fundamental physics
and chemistry.
›› Observations of what has already happened, especially since the mid-20th century, provide
additional evidence, although the observational record is often constrained by the time
span and geographical coverage of the data. For data records of two decades or less, an
underlying trend may be masked by natural climate variability.
›› Climate model simulations of past and future climate behaviour also contribute important
information, and provide our best understanding of how extreme weather events might
change through the rest of this century.
When all of these lines of evidence point in the same direction, we have more confidence in
understanding the influence of climate change on extreme weather events.
How do we know what extreme weather will do in the future?
Projections of future changes to extreme events are based on climate model simulations.
Climate models are mathematical representations of the climate system, based on the laws
of physics. They are driven by a large number of scenarios of future human emissions of
greenhouse gases. These range from worst-case ‘business-as-usual’ scenarios, in which
emissions continue to rise strongly through the rest of the century, to scenarios in which
effective climate policy leads to rapid and deep emission cuts over the next few decades
with very low or no emissions towards the end of the century. Because of momentum in the
climate system, the climate projections for the next two decades are largely independent of
the particular emissions scenario chosen, and thus the influence of climate change on extreme
events is likely to increase over that time period regardless of emission pathways. However,
over the longer term the level of emission reductions now and in the coming decades will have
a major influence on the degree of climate change that occurs and its influence on extreme
events.
All extreme weather
events are now influenced
by climate change.
Page 12Temperature-related extreme events
/02
2.
Temperature-
related
extreme
events
SUMMARY
The duration and frequency of heatwaves in
Australia have increased, and the hottest days
during a heatwave have become even hotter.
This section outlines how human-driven climate
change has influenced this increase in hot
weather and heatwaves. Extreme hot weather
has many adverse impacts on Australian society
and our environment, affecting human health,
infrastructure, agriculture and ecosystems. It is
virtually certain that extreme hot weather will
continue to become even more frequent and
severe around the globe, including Australia,
over the coming decades (IPCC, 2012). In
summary, climate change is making hot days
and heatwaves more frequent and more severe.
Page 13The Critical Decade:
Extreme Weather
2.1 Heatwaves and hot weather What are the consequences of heatwaves
and very hot days?
What are heatwaves and very hot days? Very hot days and heatwaves have a
significant impact on human health,
A heatwave in Australia is described as infrastructure, agriculture and natural
a period of at least three days where the ecosystems.
combined effect of high temperatures and
excess heat is unusual within the local Human health. Research at the Natural
climate (BoM, 2012a). Excess heat often Hazards Research Centre (NRHC) has shown
occurs when unusually high overnight that heatwaves are the most significant
temperatures prevent daytime heat natural hazard in Australia in terms of loss of
from being released (BoM, 2012a). Other life. There have been 4287 fatalities directly
descriptors of temperature extremes are given attributable to heatwaves during the period
in Box 3. 1803-1992 (Coates, 1996).
Humans can survive only when core body
temperature remains in a narrow range
around 37°C (Hanna et al., 2011). If the
Box 3: Descriptors of Australian body produces or absorbs more heat (for
extreme temperature example, from physical activity or high air
temperatures) than it can remove through
direct transfer to the surrounding air or
through sweating, core body temperature
will rise. If core body temperature exceeds
38°C for several hours, the body can suffer
Very hot days:
heat exhaustion and reduced mental and
Maximum temperature
physical capacity (Parsons, 2003; Berry et al.,
greater than 40°C 2010). Serious heatstroke and even death can
occur after a relatively short time if core body
Hot days: temperature goes above 42°C (Parsons, 2003).
Maximum temperature Children, the elderly, people with existing
greater than 35°C health issues and workers with heat-exposed
jobs are the most vulnerable to extreme heat.
Over the last decade, severe heatwaves
Cold days: around Australia have resulted in deaths and
Maximum temperature is less in increased hospital admissions for heart
than 15°C attacks, strokes, kidney disease and acute
renal failure. During the severe heatwaves in
Very cold days: Maximum southeastern Australia in 2009, Melbourne
temperature is less than 5°C experienced three consecutive days at or above
43°C in late January. There were 980 heat-
related deaths during this period, 374 more
than would have occurred on average for that
Source: BoM 2013a
time of year (DHS, 2009; Figure 2). During the
Brisbane heatwave of 7-26 February 2004 the
temperature ranged from 26° to 42°C.
Page 14Temperature-related extreme events
/02
250 50
44.3 45
43.4 45.1
200 40
36.4
35
33.8
150 30.5 30
Deaths
25.5 ˚C
25
100 20
15
50 10
2004–08 average deaths
2009 deaths 5
2009 Max temp (C)
26 Jan 27 Jan 28 Jan 29 Jan 30 Jan 31 Jan 1 Feb
Figure 2: Mortality and temperature during the 2009 Melbourne heatwave. This graph shows the relationship
between prolonged periods of higher temperatures and death rates over the same period.
Source: DHS, 2009
Overall deaths increased by 23% (excluding has been accompanied by a shift in the
injury and suicide) compared with the death seasonal distribution of deaths in Australia,
rate during the same period in 2001-2003, in both men and women. An increasing
when the temperature ranged from 22°C to proportion of annual deaths are now
34°C (Tong et al., 2010). occurring in the summer months (Bennett et
al., in press). Within-decade analyses indicate
Longer-term trends in the impacts of extreme that this is primarily an effect of temperature,
heat have also been observed. In Adelaide, not background trends in other seasonally-
from 1993 to 2006 an increase in total hospital associated health risk factors.
admissions of 7% was recorded during heatwave
periods compared with non-heatwave periods, Other species. Humans aren’t the only species
and the number of people requiring ambulance to suffer from extreme heat. Many other
transport during heatwaves increased by 4% species of animals are vulnerable to ill health
(Nitschke et al., 2007). and death when temperatures rise too high
and they can’t move to cooler environments
Hot weather is becoming a more serious risk fast enough (Box 4). Marine organisms, even
for health than cold weather in Australia. though they live in water, are also affected
The upward trend in recent decades in by the impacts of severe heat. Just as for air,
average annual temperatures and in the heatwaves can occur in the surface waters
annual frequency of very hot days, along with of the ocean, sometimes leading to dramatic
the decreased frequency of very cold periods, impacts on marine ecosystems (Box 5).
Page 15The Critical Decade:
Extreme Weather
Box 4 – Impacts of extreme heat on terrestrial ecosystems
Plants and animals, like humans, are susceptible to extreme heat events. In periods of
extreme heat, birds may lose up to 5% of their body mass per hour and rapidly reach their limit
of dehydration tolerance (McKechnie and Wolf, 2010). In January 2009, a heatwave where air
temperatures were above 45oC for several consecutive days caused the deaths of thousands
of birds in Western Australia, mostly zebra finches and budgerigars (McKechnie et al., 2012).
Another event in January 2010, where temperatures up to 48oC were combined with very
low humidity and a hot northerly wind, had similar impacts, with the deaths of over 200 of
the endangered Carnaby’s Black Cockatoo recorded near Hopetoun, Western Australia
(Saunders et al., 2011).
Flying foxes are also particularly susceptible to extreme heat events (Figure 3). Exposure to air
temperatures over 40°C can lead to heat stress and death from dehydration, especially when very
hot conditions are accompanied by dry weather. Lactating females and their young are the most
at risk.
Since 1994, more than 30,000 flying foxes have died in heatwaves at sites along the east
coast of Australia. On 12 January 2002, for example, over 3,500 flying foxes were killed in nine
colonies along the New South Wales coast when temperatures exceeded 42°C (Welbergen et
al., 2007). In January and February 2009, nearly 5,000 flying fox deaths were recorded at a
single site – Yarra Bend Park in Victoria (DSE, 2009).
Some of Australia’s most iconic marsupials could also be at risk during extended periods
of hot weather. The green ringtail possum (Figure 4), for example, which is restricted
to rainforests above 300 m in Queensland’s Wet Tropics, is unable to control its body
temperature if subjected to air temperatures greater than 30oC for 5 hours per day, over 4-6
days (Krockenberger et al., 2012). Hotter, drier conditions in the future are predicted to put
this and many other rainforest marsupials at increased risk of population decline and eventual
extinction (Williams, et al., 2003). Heatwaves, combined with extended droughts, have also
been observed to cause mass mortality in koalas (Gordon et al., 1988), and to affect forest
productivity (Ciais et al., 2005), frog reproduction (Neveu, 2009), cyanobacterial blooms in
lakes (Huber et al., 2012) and increase the success of invasive species (Daufresne et al., 2007).
Figure 3: Flying foxes are particularly susceptible Figure 4: The green ringtail possum is unable to
to extreme heat events. In warm temperatures control its body temperature when exposed to
flying foxes urinate on themselves and flap their temperatures above 30oC for long periods of time,
wings to cool down. making it at risk during extended periods of hot
weather.
Source: Daniel Vianna/Wikicommons
Source: Flickr/Algaedoc
Page 16Temperature-related extreme events
/02
Box 5 – Impacts of extreme heat on marine ecosystems
Heatwaves also affect marine ecosystems. When coral reefs are subject to sea surface
temperatures more than 1-2oC above average summer maximum temperatures, the corals can
bleach and die (Figure 5). Bleaching events on the Great Barrier Reef have occurred repeatedly
since the late 1970s, contributing to the decline in coral cover observed from 1985 to 2002
(De’ath et al., 2012). The 2011 marine heat wave in Western Australia (Figure 6) caused the
first-ever reported bleaching at Ningaloo Reef (Wernberg et al., 2013).The ability to recover
from bleaching events varies among coral species and among regions, but there is only limited
evidence so far that corals can adapt to rising temperatures and to ocean acidification (Hoegh-
Guldberg et al., 2007).
Corals are not the only marine systems to be affected by extreme heat. Mortality and reduced
reproduction have also been observed in intertidal and estuarine species during heatwaves
(e.g., Cardoso et al., 2008; Garrabou et al., 2009). In some ecosystems, the species composition
can be so dramatically affected by a single event, such as occurred in the 2003 European
heatwave, that these ecosystems appear to never fully return to their former state.
Figure 5: Coral bleaching in the Figure 6: Satellite image of an underwater
Great Barrier Reef. heatwave. The hottest areas are shown in pink.
Source: GBRMPA Source: NOAA
Page 17The Critical Decade:
Extreme Weather
Infrastructure. The prolonged extreme
heat in Melbourne in January 2009 caused
substantial damage to critical infrastructure
including energy transmission and rail
transportation. Increased demand for
electricity during the heatwave broke
previous records for Victoria by approximately
7% (QUT, 2010). In addition faults to the
transmission systems made the entire grid
vulnerable to collapse (QUT, 2010). During the
heatwave the Basslink electricity cable between
Tasmania and Victoria reached maximum
operating temperature and was automatically
shut down for safety reasons (QUT, 2010). The
shutdown of this transmission source combined
with faults at a number of transformers caused
widespread blackouts across Melbourne (QUT,
2010). On the evening of 30 January 2009 an Figure 7: Rail tracks in Melbourne buckled during
estimated 500,000 residents were without the 2009 heatwave.
power (QUT, 2010). Source: Herald Sun
Melbourne’s train and tram networks also
suffered widespread failures during the 2009 Agricultural production. Agricultural
heatwave, caused by faults to air conditioning productivity, which is already sensitive
systems and tracks buckling in the extreme to extremes of natural climate variability,
heat (QUT, 2010; Figure 7). On 30 January, is expected to suffer net decreases with
approximately one quarter of train services increasing temperatures. For example, dairy
did not run (QUT, 2010). Financial losses from cattle are likely to suffer heat stress more
the heatwave, estimated at $800 million, were frequently, which can reduce appetite and
mainly caused by the power outages and thus milk production, as well as decreasing
disruptions to the transport system (Chhetri milk quality (QFF, 2008; DEEDI, 2010). Rising
et al., 2010). temperatures will affect yield, quality and
the length of the growing season for crops
such as tomatoes and lettuces, although the
development of more heat-tolerant cultivars
may offset some of these impacts (Deuter et
al., 2011; Deuter et al., 2012).
Page 18Temperature-related extreme events
/02
What changes have been observed in (CSIRO and BoM, 2012; Figure 8). In fact, the
heatwaves and very hot days? frequency of record hot days has been more
than three times the frequency of record cold
Since 1950, it is very likely that there has days during the past ten years (Trewin and
been an overall increase in the number Smalley, 2012). The number of very hot days is
of warm days and nights on the global also increasing in many places. For example,
scale (IPCC, 2012), as well as an increase in Canberra the long-term average (1961-
in the frequency, intensity and duration of 1990) number of days per year above 35°C
heatwaves and warm spells at the global was 5.2, but during the decade 2000-2009 the
level (Perkins et al., 2012). In the last decade, average number of such days nearly doubled
a large number of extreme heatwaves have to 9.4 days (BoM, 2013b; Table 1).
occurred around the world, each causing
major societal impacts. Recent events include The nature of heatwaves has already changed
the European heatwave of 2003 (Stott et in many parts of Australia. Over the period
al., 2004); a major heatwave in Greece in 1971-2008, the duration and frequency of
2007 (Founda and Giannaopoulos, 2009); heatwaves has increased, and the hottest
the Russian heat wave of 2010 (Barriopedro days during a heatwave have become even
et al., 2011); a heatwave in Texas (USA) in hotter. This change has been likely driven
2011 (NOAA, 2011); and a more widespread by the increase in the frequency of hot days
heatwave in the USA in 2012 (NOAA, 2012). alone (Perkins and Alexander, 2013).
The annual number of record hot days across The Australian heatwave of the summer of
Australia has doubled since 1960 and the 2012/2013 was exceptional for its extent and
number of record cold days has decreased for its intensity (Box 6).
Number of record hot day maximums at Australian climate reference stations
Average number of record hot days per annum for each decade
60
50
Number in each year
40
30
20
10
1960 1970 1980 1990 2000 2010
Figure 8: Number of record hot day maximums at Australian climate reference stations.
Source: CSIRO and BoM, 2011
Page 19The Critical Decade:
Extreme Weather
Box 6: Extreme heat over the summer of 2012/2013
A severe heatwave, unusual in length, extent and severity, affected 70% of Australia in late
December 2012 and early January 2013 (Figure 9). Temperature records were set in every
state and territory and the national average daily temperature reached levels never previously
observed.
The summer of 2012/2013 was Australia’s hottest summer since records began in 1910.
New records that were set included:
›› The hottest ever area-averaged Australian maximum temperature, which occurred on
7 January reaching 40.30°C (BoM, 2013c);
›› The hottest month on record for Australia – January 2013 (BoM, 2013c);
›› All-time high maximum temperatures at 44 weather stations, including Sydney
(45.8°C), Hobart (41.8°C) and Newcastle (42.5°C) (BoM, 2013c);
›› The average daily maximum temperature for the whole of Australia was over 39°C for
seven consecutive days (2-8 January 2013), easily breaking the previous record of four
consecutive days over 39°C (BoM, 2013c); and
›› The hottest sea-surface temperatures on record for the Australian region for January
and February 2013, and the entire summer period. The average temperature of the
waters around Australia during February was 23.9°C, 0.6°C above the long-term average
and 0.13°C above the previous record (BoM, 2013d).
There have only been 21 days in 102 years of records where the average maximum
temperature across Australia has exceeded 39°C; eight of these days happened in the summer
of 2012/2013 (2-8 January and 11 January
2013) (BoM, 2013c).
Based on the network of long-term,
climate monitoring stations, no
previous event has resulted in so many
temperature records (BoM, 2013c).
The impacts of the heatwave are yet
to be fully determined; nonetheless,
the number of records set clearly
demonstrates the extreme nature of
this event.
Figure 9: Highest maximum temperature between
1 and 18 January 2013.
Source: BoM, 2013c
Page 20Temperature-related extreme events
/02
Figure 10: Relationship
INCREASE IN AVERAGE TEMPERATURE
between average and
extremes, showing the
connection between a shifting
average and the proportion of
PREVIOUS NEW extreme events.
PROBABILITY OF OCCURENCE
CLIMATE CLIMATE
Source: Modified from
IPCC, 2007
More hot weather
Less cold weather
More record
hot weather
Although records
have always been
broken from time
to time, records
COLD Average HOT
are now being
broken much more
PREVIOUS RECORD
frequently.
NEW RECORD
How does climate change influence extremely rare in the previous climate are
heatwaves and very hot days? becoming more common. Although records
have always been broken from time to time,
While hot weather has always been common records are now being broken much more
in Australia, it has become more common and frequently.
severe over the past few decades. Australia’s
average air temperature has risen by 0.9°C It is likely that human influences have
since 1910, with most of that rise occurring in already led to warming of extreme daily
the post-1950 period (CSIRO and BoM, 2012). minimum and maximum temperatures at the
This means that there is much more heat in global scale (IPCC, 2012). Although Australia
the atmosphere and so hot weather becomes has always had heatwaves and hot days,
more likely. This is consistent with the global climate change has increased the risk of more
trend of increasing average temperature and intense heatwaves and hot days (Figure 10).
the increase in hot weather globally. In summary, climate change is making hot
days and heatwaves more frequent and more
A small increase of 0.9°C in average severe.
temperature can have a disproportionately
large effect on the number of hot days
What are the projections for heatwaves
and record hot days. When the average
and hot days in a changing climate?
temperature increases, the temperatures
at the hot and cold ends (tails) of the It is virtually certain that increases in the
temperature range shift to create a much frequency and magnitude of warm daily
greater likelihood of very hot weather and a temperature extremes and decreases in
much lower likelihood of very cold weather cold extremes will occur at the global scale
(Figure 10). The heavy shaded area at the in the 21st century (IPCC, 2012). As climate
extreme right shows the record hot weather change continues, it is virtually certain
that occurs only after the shift to the warmer that Australians will face extreme hot
background climate. This means that we are weather much more often (see Table 1) and
beginning to see weather events that have the impacts will become more severe. It is
never been observed since instrumental highly likely that there will be an increased
records were begun, and events that were frequency of hot days, hot nights and Page 21The Critical Decade:
Extreme Weather
heatwaves at the global level (IPCC, 2012). The 2.2 Extreme cold weather events
number of heatwaves across Australia is also
projected to increase significantly by the end of The definition of a cold spell is a prolonged
the century (Alexander and Arblaster, 2009). period of time with cold temperatures relative
If climate change continues on its current to local conditions. In Australia, a cold spell
path, extreme heat will become a much more is defined as at least four nights where
common occurrence in most of Australia’s minimum temperatures fall within the coldest
capital cities (Table 1). The annual number 10% of recorded temperatures for a local
of hot days (over 35°C) averaged over the climate (BoM, 2013a).
2000-2009 decade has already risen compared Extreme cold events can have serious
to the 1961-1990 baseline in most capital consequences for human health. However,
cities. In fact, for Adelaide, Melbourne and they are relatively rare in Australia compared
Canberra the observed annual number of to many other parts of the world. Heat-
hot days is increasing more quickly than the related health impacts will increasingly be
climate models projected. In these cities the of more concern than cold-related ones as
annual number of hot days occurring now the climate continues to warm. Cold weather
is at the level projected for around 2030, also affects agriculture, as frost nights can
although the increase in this decade may in damage newly planted crops. On the other
part be due to natural variability. If rapid and hand, many species of stone fruit have a
deep cuts in greenhouse gas emissions are chilling requirement to set the fruit, and so
not achieved, the number of hot days will a decrease in cold weather can negatively
very likely rise even further in all major cities affect production of fruit (Hennessy and
by the end of the century (CSIRO and BoM, Clayton-Greene, 1995).
2007). However, with lower emissions the
projected increases in hot days for 2070 are On a global scale it is very likely that there
much less (Table 1). has been an overall decrease in the number of
cold days and nights since 1950 (IPCC, 2012).
LONG-TERM 2000 - 2009 2030 2070 2070
AVERAGE AVERAGE PROJECTED PROJECTED projected
(1961-1990) (low emissions (high emissions
scenario) scenario)
MELBOURNE 9.9 12.6 12 (11-13) 14 (12-17) 20 (15-26)
SYDNEY 3.4 3.3 4.4 (4.1-5.1) 5.3 (4.5-6.6) 8 (6-12)
ADELAIDE 17.5 25.1 23 (21-26) 26 (24-31) 36 (29-47)
CANBERRA 5.2 9.4 8 (7-10) 10 (8-14) 18 (12-26)
DARWIN 8.5 15.7 44 (28-69) 89 (49-153) 227 (141-308)
HOBART 1.2 1.4 1.7 (1.6-1.8) 1.8 (1.7-2.0) 2.4 (2.0-3.4)
Table 1: The long-term average number of hot days (above 35°C) compared to the 2000 – 2009 average and the
projected number for 2030 and 2070 for some Australian capital cities. Both 2030 and 2070 projections show the
median and, in brackets, the range of projections for the number of hot days. The lowest number in the range
is the 10th percentile and the highest number is the 90th percentile of the various model projections. The median
is the 50th percentile. The 2070 projections are divided into low and high emissions scenarios. Brisbane and
Perth are not included because the locations of observations for these cities differ from the locations on which
projections are based.
Source: BoM, 2013b; CSIRO and BoM, 2007
Page 22Temperature-related extreme events
/02
A decrease in cold days and cold nights has Climate change is decreasing the likelihood
also been observed in Australia (Nicholls of very cold weather events. It is virtually
and Collins, 2006; Alexander et al., 2007). certain that the frequency and magnitude
The number of frost nights has also generally of cold extremes will decrease over the
decreased across the country since 1970, coming decades at a global scale, and across
although there are some significant regional Australia (IPCC, 2012).
variations (Box 7).
Box 7: Frost nights in Australia
Frost occurs frequently in southern parts of the country when the temperature falls below
freezing. Frost formation is affected by a number of variables, including cloud cover, humidity,
wind and the aspect of the location. Frost is more likely to form under a clear sky, with low
humidity and light winds (BoM, 2013e).
There has been a decrease in the number of frost nights in many areas across Australia, such
as Canberra, which has experienced a reduction of 5 days per decade in frost nights between
1970 and 2011 (Figure 11). However, there have also been increases in frost nights in some
areas. This is most likely due to reduced cloud cover associated with a decrease in rainfall,
leading to clear night time skies and lower temperatures.
In the future, it is likely that Australia will continue to experience less frost events, depending
on the magnitude of warming and the location (Tebaldi et al., 2006).
Figure 11: Trend in the number of frost nights in Australia between 1970 and 2012.
Source: Prepared by the Bureau of Meteorology for the report
Page 23The Critical Decade:
Extreme Weather
3.
Rainfall
1.0
AND DROUGHT
INTRODUCTION
SUMMARY
Australia has long had a highly variable climate of
droughts and heavy rains, and this pattern is likely
to continue into the future. However, climate change
is likely to increase the severity of these extreme
weather events. Over the last three years Australia’s
east coast has experienced several very heavy
rainfall events, fuelled by record-high sea surface
temperatures. These events led to very damaging
flooding in Queensland and parts of New South Wales
and Victoria. In the future the changes in rainfall
patterns for much of the continent are difficult to
predict, but we can expect a higher risk of heavy
rainfall events in general.
Since the 1970s the southwest of Australia has
become drier and since the mid-1990s the southeast
has become drier, especially in the cooler months of
the year. The Millennium Drought of 1997-2009 was
one of Australia’s most severe droughts, with far-
reaching impacts on agricultural production, urban
water supplies and natural ecosystems. A return to
the earlier, wetter climate is unlikely, and such dry
conditions and droughts are likely in the southwest
and southeast to become more common and intense.Rainfall
/03
3.1 Heavy rainfall events to as rainfall intensity. An extreme rainfall
event may also be defined by its ‘return
period’. A 1-in-20 year event at a site is the
What is a heavy rainfall event? daily rainfall total that would be on average
expected to occur once in 20 years. The
A heavy rainfall event is a deluge of rain that magnitude of such an event would vary from
is much longer and/or more intense than the site to site.
average conditions experienced at a particular
location. The Bureau of Meteorology uses a What are the consequences of heavy
number of extreme precipitation (rain, hail or rainfall events?
snow) indices (BoM, 2013a):
Flooding is the most prominent impact of very
›› Heavy precipitation days: days with daily heavy rainfall events. However, the severity
precipitation greater than or equal to 10 mm of floods is also influenced by several other
›› Very heavy precipitation days: days with daily factors in addition to rainfall, including the
precipitation greater than or equal to 30 mm condition of catchments, the effectiveness
›› Very wet day precipitation: daily precipitation of dams to manage flooding, and the
greater than 95th percentile vulnerability of people and infrastructure.
Floods cause significant societal disruption
›› Extremely wet day precipitation: daily
including damage to human health,
precipitation greater than 99th percentile.
buildings, infrastructure, ecosystems and
The amount of rainfall in a day is also referred agricultural land (Box 8).
Box 8: Damage from the Queensland 2010/2011 floods
Extreme and extended rainfall over large areas of Queensland led to record-breaking and very
damaging flooding in Queensland in December 2010 and January 2011. December 2010 was
Queensland’s wettest December on record. The floods also broke river height records at over
100 observation stations.
Thirty-three people died with three remaining missing, and 78% of the state (an area larger
than France and Germany combined) was declared a disaster zone. The floods created major
health risks, including contamination of drinking water and food and difficulties in accessing
health services and treatments.
Approximately 2.5 million people were affected and 29,000 homes and businesses experienced
some form of flooding (Figure 12). The economic cost of the flooding was estimated to be in
excess of $5 billion.
Major damage occurred to infrastructure, including thousands of kilometres of road and rail,
as well as to electricity generation and distribution and to other essential infrastructure.
Over 3000 km of Queensland Rail track were affected, much of the electrical infrastructure in
the Lockyer Valley was destroyed, and around 300,000 homes and businesses lost power in
Brisbane and Ipswich at some stage during the floods.
Source: QFCI, 2012
Figure 12: Heavy rainfall caused
widespread flooding across many
areas of Brisbane including the
CBD. The corner of Margaret and
Albert Streets in Brisbane
is pictured.
Source: Flickr/David Peddler
Page 25The Critical Decade:
Extreme Weather
(a) the number of heavy precipitation days
5.0
4.0
3.0
2.0
1.0
0.0
-1.0
-2.0
1900 1920 1940 1960 1980 2000
(b) the contribution from very wet days to the total rainfall, in percentage
4.0
2.0
0.0
-2.0
1900 1920 1940 1960 1980 2000
(c) a simple rainfall intensity index in mm per day (index defined in Donat et al. 2013).
1.2
0.9
0.6
0.3
0.0
-0.3
1900 1920 1940 1960 1980 2000
Figure 13: Globally averaged time series from 1901 to 2010 in (a) the number of heavy precipitation days;
(b) the contribution from very wet days to the total rainfall, in percentage; and (c) a simple daily rainfall
intensity index in mm per day.
Source: Donat et al., 2013a
Page 26Rainfall
/03
What changes have been observed in
heavy rainfall events?
Heavy rainfall is increasing. There have
been statistically significant increases in
the number of heavy precipitation events in
most regions of the world (IPCC, 2012). A
recent global analysis showed that there are
more areas around the globe with significant
increases in heavy precipitation events than
with decreases (Donat et al., 2013a; Figure 13).
Furthermore, independent measurements
show an increase of water vapour in the
atmosphere from 1988 to 2004, the period over
which reliable measurements are available
(IPCC, 2007). Increased water vapour in the
atmosphere increases the availability of water Figure 14: Map of Australia showing rainfall for
to fall as precipitation. 1 January 2010 through 31 December 2011
There is considerable variability in rainfall Source: BoM, 2012b
and rainfall extremes across Australia.
Northwest Australia has experienced a
How is climate change influencing heavy
significant increase in the frequency of
rainfall events?
heavy rainfall events (Donat et. al, 2013b;
IPCC, 2012). In comparison, there is a slight The physical connection between a warming
decrease (not statistically significant) in the climate and more rainfall is well understood
number of heavy rainfall events in southeast (Figure 15), especially for rainfall that is
and southwest Australia (Donat et. al., 2013b). derived from an oceanic source and thus
These findings are consistent with the not limited by the amount of water that can
changing pattern of average rainfall across be evaporated from the surface (Hardwick-
Australia, where southeast and southwest Jones et al., 2010). Higher temperatures
Australia are experiencing a decrease and the in the surface ocean waters lead to more
northwest is experiencing an increase in total evaporation, and, because the atmosphere
annual rainfall (BoM, 2013f). An increasing is warmer, it can hold more water vapour.
trend in short duration (sub-daily) rainfall This leads to a higher water vapour content
extremes in Australia is stronger than for in the atmosphere. As a result, precipitation
longer duration events (Westra and Sisson, increases in many locations, with a higher
2011; Jakob et al., 2011). proportion of the precipitation coming as
heavy falls. The observations described
The period from 1 January 2010 to 31
above are consistent with this physical
December 2011 was exceptional in terms of
understanding, including the heavy rainfall
the heavy rainfall that occurred over much of
over from January 2010 to December 2011.
the continent (Figure 14). The total of 1409 mm
The statistical evidence for this connection is
of rain averaged over the entire continent was
beginning to emerge; the Intergovernmental
a record, eclipsing the previous record set in
Panel on Climate Change (IPCC) noted
the 1973-1974 two-year period. The 2010-2011
that ‘there is medium confidence that
period was also remarkable in the widespread
human influences have contributed to the
nature of the heavy rainfall. Every state and
intensification of extreme precipitation at the
territory had sites that either set all-time
global scale’ (IPCC, 2012).
rainfall records for a two-year period or had
rainfall that was very much above average.
Page 27You can also read