Investing in Melbourne's National Employment Clusters - Advice to Infrastructure Victoria by Professor John Stanley and Dr Peter Brain
←
→
Page content transcription
If your browser does not render page correctly, please read the page content below
Investing in Melbourne’s National
      Employment Clusters

     Advice to Infrastructure Victoria by
  Professor John Stanley and Dr Peter Brain

                  Final Report

                September 2016.

                       1
Contents
Executive Summary ....................................................................................................................................... 4

     Scope ......................................................................................................................................................... 4

     Focus ......................................................................................................................................................... 4

     NEC Benchmarking .................................................................................................................................... 5

     Investment Scenarios ................................................................................................................................ 6

     Governance ............................................................................................................................................... 7

     Some strategic considerations .................................................................................................................. 7

     Conclusions ............................................................................................................................................... 8

1.      Context of NECs and this report ......................................................................................................... 10

2.      Infrastructure Evaluation Criteria ....................................................................................................... 14

3.      Options for meeting needs ................................................................................................................. 16

4.      Urban innovation districts .................................................................................................................. 18

5.      NEC productivity performance: initial assessment ............................................................................. 22

6.      Travel time reduction: initial assessment ........................................................................................... 27

7.      Assessment of broad infrastructure options for developing NECs ..................................................... 31

     7.1        Re‐estimated NEC catchments.................................................................................................... 31

     7.2        Types of ‘infrastructure’ options assessed in this report............................................................ 36

     7.2.1          Base case ................................................................................................................................. 36

     7.2.2          Options assessed ..................................................................................................................... 38

     7.3        Accessibility improvements through reducing travel times ....................................................... 39

     7.4        Increased residential and employment densities ....................................................................... 40

        7.4.1           Density (scale) increases ..................................................................................................... 40

        7.4.2           Improved bus services to NECs, building on increased densities ....................................... 42

     7.5        Community and cultural infrastructure ...................................................................................... 47

                                                                                  2
8.      NEC governance .................................................................................................................................. 50

9.      Some strategic considerations in prioritising infrastructure investment in NECs .............................. 52

10.         Conclusions ..................................................................................................................................... 55

References .................................................................................................................................................. 58

Appendix A: NEC Competitive strengths and weaknesses and supporting infrastructure development
(Authors’ assessments) ............................................................................................................................... 60

Appendix B: Data used in initial NIEIR modelling ....................................................................................... 64

Appendix C: A note on methodology .......................................................................................................... 65

     Background ............................................................................................................................................. 65

     The data base .......................................................................................................................................... 65

     The modelling framework ....................................................................................................................... 66

                                                                               3
Executive Summary
Scope
Infrastructure Victoria (IV) is charged with advising the Victorian Government on a 30 year infrastructure
strategy for the State and, as part of that work, is seeking an indication of the way that investment in
National Employment Cluster (NEC) development in Melbourne might be prioritised in coming years. We
have been asked to provide advice to IV to inform infrastructure prioritisation in their 30 year strategy,
particularly for infrastructure options that could address the strategy's Need 11 "Improve access to
middle and outer metropolitan major employment centres".

This advice is to be subject to IV’s objectives and needs identification. The advice would be based on
research that should focus on analyzing:

    1. how the current NECs benchmark against key criteria that underpin designation of NECs in Plan
       Melbourne and key IV criteria
    2. the projected impact of improving the accessibility on NEC performance on key criteria
    3. projected impacts of increased activity density on NEC performance on these criteria
    4. projected impacts of increased investment in the capital stock of a NEC’s catchment, illustrated
       by investment in cultural and community infrastructure, on NEC performance on these criteria.

Focus
Recognising IVs ten objectives for infrastructure development (section 2) and the purposes for which the
NECs have been designated in Plan Melbourne, the major focus for this evaluation is on how investment
in the NECs might stimulate productivity growth and an equitable sharing of the benefits from such
growth.

Under Infrastructure Victoria’s Needs Item 11: Improve access to middle and outer metropolitan major
employment centres, with a particular focus on the NECs, the main generic options for helping to meet
the need, as identified by IV (2016a), are (section 3): road space allocation changes (RSA); growth area
bus services (LBS); public transport train timetabling (PTT); residential and commercial property
densification (RCP) ; SmartBus service provision increase (SSP); strategic transit‐oriented development
corridors (STO); arterial road network employment centre enhancements (ARN); employment centre
mass transit network (MTN); growth area train station upgrades (GAT); outer metropolitan ring road
(OMR). In terms of analysis in this report, the two sets of bus initiatives (LBS and SSP), two arterial road
options (RSA and ARN) and two density options (RCP and STO, which IV has now linked) are our main
focus for analysis. These have all been well rated by the IV Metropolitan Citizens’ Jury, particularly LBS,
SSP, RCP and STO. Our analysis also goes wider and considers the potential impacts of increased
investment in cultural and community infrastructure, as a key element in attracting the talent that NECs
will need to flourish.

We introduce the concept of innovation districts (section 4), from Brookings Institution, because of their
alignment with the intent of NECs. If an urban economic development and land use strategy of the kind
proposed for Melbourne is to succeed, framed around a polycentric city model based on NECs, then the
Brookings work suggests that these will require a place‐specific combination of economic assets,
physical assets and networking assets. Weaknesses in any of these areas pose risks to the whole.

                                                     4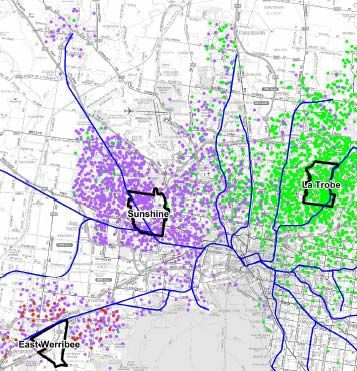
Integrated thinking is thus crucial for success. Networking assets are perhaps the most under‐done in
terms of Melbourne’s NECs at present.

NEC Benchmarking
NECs were benchmarked (section 5) using SA2 level data. Productivity levels were assessed, both for the
SA2(s) that comprise each NEC and for the wider NEC catchment. The catchment analysis in Sections 5
and 6 used the same general approach as NIEIR used in its research on which NEC designation was based
and was then re‐assessed in Section 7, using refined travel information provided through IV. Parkville,
Sunshine and La Trobe have the highest productivity levels (GRP/hr worked), about ten percentage
points higher than catchment productivity of Monash and East Werribee and twenty percent above
Dandenong South. However, Dandenong South has large absolute scale, whereas East Werribee is small.

Our initial productivity analysis (section 6) assumed travel time improvements of 6% achieved over two
decades, using NEC catchments defined by assumed travel times that were broadly similar to those used
in the initial NIEIR work on the NECs for Plan Melbourne. The present value of the estimated gains in
NEC Gross Regional Product summed to $22b at a 7% real discount rate and $43b at 3%. This analysis led
to the conclusion that to maximise total urban productivity growth it is best to invest in those NECs that
already have relatively higher productivity levels. Equity, however, suggests spreading the largesse more
broadly. A complete assessment of initiatives to achieve such travel time savings and associated
productivity gains would also need to consider, inter alia, other relevant transport benefits (e.g. user
private time savings, emissions reductions, increased social inclusion) and the costs of achieving the
relevant time savings.

Using travel time data and trip matrices provided courtesy of IV, a more refined analysis of NEC
catchments and catchment productivity was derived. The travel time data showed public transport AM
peak travel times being typically much longer than those for car to each NEC, with Monash and La Trobe
having the longest PT travel times, in relative terms. The Parkville NEC catchment emerges as both
substantial in scale and extensive, its proximity to the CBD supporting a strong PT mode share for AM
peak trips (50%). The Sunshine, Dandenong South and Werribee East catchments are more localised,
with very high reliance on car for AM peak access, although Dandenong South is almost as large as
Parkville in terms of the absolute number of AM peak trips. Monash and La Trobe have wider labour
catchments than Sunshine, Dandenong South and Werribee East, although the absolute numbers of AM
peak trips to Monash and Sunshine are similar. PT plays a relatively larger role in catering for peak trips
to Monash and La Trobe than to Sunshine, Dandenong South and Werribee East but all are less than
10%. Modelling undertaken for this analysis (see Appendix C) showed that public transport is a
significant influence on NEC catchment productivity, suggesting that it should be a more significant focus
for future investment, particularly in NEC catchments other than Parkville (which is already a substantial
beneficiary of PT investment).

An inescapable conclusion is that public transport planning in Melbourne has concentrated very heavily
on access to/from the CBD and surrounds, with relatively little attention paid to the need for public
transport services to support development of middle urban activity centres, which form the basis for a
polycentric city. PT journey to work mode shares need to grow substantially if the NECs are to accelerate
their growth rates as key activity centres within middle Melbourne. Meeting their PT access needs
requires attention to both radial and circumferential movement demands.

                                                    5
The major role played by cars in serving access needs to NECs underlines the importance of good arterial
road access being ensured in coming years, including for the support that will be required for improved
on‐road operation of road‐based public transport. However, this support for improved road access
should be accomplished in such a way that it does not drive further urban sprawl or generate substantial
additional vehicle kilometres of car travel, the external costs of which are widely recognised.

Investment Scenarios
The modelling undertaken in this study has shown that increases in catchment scale between 2001 and
2031, in an Infrastructure Victoria ‘base case’ scenario, will support increases in NEC catchment GRP
levels of between 40‐80% but that increasing travel times will reduce GRP growth somewhat, in every
catchment except Parkville. After East Werribee, which is growing from a small base, the largest relative
increases in trip numbers are projected for Monash (58.2%) and La Trobe (50.2%). These projections are
relatively modest in terms of NEC growth potential.

Our first improvement option (Section 7) assumed travel time improvements across each NEC
catchment of 6% over 2 decades, compared to the IV base case future outlook. Such travel time
improvements could come from arterial road upgrades and/or public transport prioritisation, with the
productivity benefits from PT upgrades that have been apparent in the study’s modelling suggesting the
importance of a strong PT focus. Parkville gains the smallest relative benefit but largest increase in
catchment GRP from such an improvement, because of its scale. Monash and La Trobe are significant
beneficiaries. East Werribee is a very big winner in relative terms, given the adverse travel time impacts
it confronts in the base case, but is less significant in absolute terms.

A second analysis increased densities in the main transit corridors leading to/from the Monash NEC, to
give a sense of the way this might impact productivity outcomes. NIEIR estimated that a 20% increase in
Monash NEC scale, compared to the base case, would increase productivity (GRP/hr worked) in the
NEC’s catchment by about 2.4% by 2031, a solid result.

This analysis was further developed by improving PT travel times to/from the Monash NEC, as would
follow (for example) from SmartBus upgrades to headways and operating speeds, including transfer
times, and improvements to feeder local bus services. A 20% improvement in peak PT travel times
to/from the Monash NEC was assessed, incremental to the second analysis of catchment density
increases, particularly in strategic transit corridors. This analysis suggested annual benefits in 2031 of
$2.7b to $4b (in undiscounted 2014 prices), depending on the elasticity of PT travel demand that is used.
This implies a very substantial present value of benefits, allowing for the growth in annual benefit value
over time. The scale of productivity benefits from this assumed 20% improvement in PT travel times is
projected to be larger than that from an assumed 20% increase in catchment scale/density, because of
the link between GRP and public transport travel time (Appendix C).

A final analysis showed the prospective positive impact of increased investment in community and
cultural services on catchment GRP, using local government area data from the original NIEIR work on
Plan Melbourne. It suggested that, if NEC catchment productivity is to be increased, this will be
associated with an increase in the availability of skilled labour and increased levels of community and
cultural services. The inference is that all elements are needed for a successful strategy to raise
productivity.

                                                    6
If equity, understood here as the sharing of available work hours relative to workforce size, is an
important factor influencing NEC prioritisation, our analysis suggests that East Werribee would rate
highest for attention, followed by Monash, Parkville, Dandenong South, Sunshine and La Trobe. Using
NEC catchment, rather than just the core of the NEC, as the basis for weighting, changes relativities from
what might be expected a priori. Monash, Sunshine and La Trobe appear as the three most significant
NECs for meeting both efficiency and equity objectives across a range of combinations of efficiency
(productivity)/equity weights, with East Werribee having a strong equity case and a nascent productivity
case.
Governance
The main planning focus on NECs within the State Government at present appears to reflect a structure
planning orientation. This has an important role to play but, based on the research reported on
innovation districts, we believe that an increased governance focus should be on building cluster
networking capacities among various public, private, university and civil society stakeholders. Some
NECs are moving in this direction.
Some strategic considerations
Factors to consider in setting priorities for timing and focus of investments in NECs, assuming expected
benefits warrant implementation of such initiatives, include the following:
early evidence of successful outcomes (speed/ease of implementation)
scale of initiative (cost, and time to plan and deliver)
scale of applicable needs gap (prospective benefits). The preceding analysis of travel time
productivity benefits is an example here.
window of opportunity
criticality to innovation development in the cluster (e.g. attracts skilled people)
focus on core of cluster (versus more widely dispersed across the cluster – this links back to the
first dot point)).
The substantial and important investment that is currently being devoted to vital rail upgrades in
Melbourne, over $20b when Regional Rail, Melbourne Metro and Level Crossing Removals are
considered, has been vital in positioning the city for productivity growth. A major focus should now be
densification and place‐making around stations and along rail lines, linked to value capture to help fund
the upgrades. This is particularly important for those rail‐based NECs that lack a strong ‘town centre’.
The scale of the current rail investment program suggests, however, that the marginal productivity of
further additional investment in heavy rail may be of less value than other opportunities for accessibility
improvements over the next 10‐15 years, particularly SmartBus and linked local bus services.
NEC development more broadly will be helped by densification along key feeder strategic transit
corridors, which will be around rail stations and along some rail lines, tram lines and some SmartBus
routes. This needs to be supported by investment in place‐making (including community and cultural
infrastructure) and active travel, to attract talented people who are needed for thriving NECs and to
ease pressures from density increases.
In terms of NEC development, our preference is to focus most new facilities and place‐making resources
in the core of the NEC across a number of investment platforms and then work out from there, including
7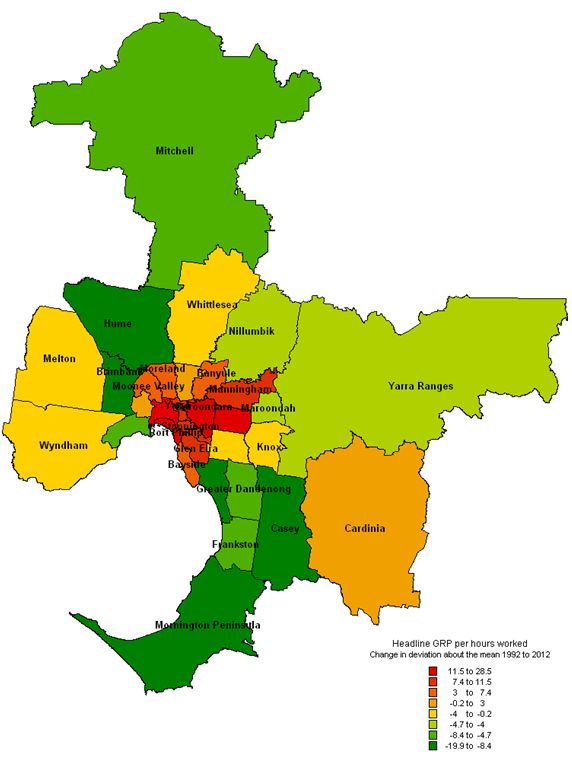
accessibility improvements, to maximise prospects of achieving significant and noticeable change at an
early stage.
Conclusions
Our analysis suggests that the NECs can probably be considered in five categories:
Parkville is dominant in terms of scale, has the highest productivity when judged at cluster SA2
level and is around equal highest at NEC catchment productivity level. It will benefit
considerably from transport improvements embedded in the base case, relative to other NECs,
and its scale means that it can benefit from further improvements
Monash and La Trobe have emerged from this analysis as probably having the most pressing
needs in a transport sense, with potential for significant GRP and productivity gains from
lowering travel times, particularly public transport travel times within these NEC catchments
Sunshine does relatively well in coming years from the base case. There are opportunities to lift
GRP and productivity from further transport improvements in this NEC catchment
South Dandenong has relatively low productivity, compared to the other NECs, given its scale,
but has opportunities to improve its level of economic activity and productivity if well planned
travel time improvements are delivered. The large scale of this NEC is its strongest argument,
together with its location close to growth suburbs, for whom it provides some important job
opportunities
East Werribee, as the newest kid on the block, is small and faces large travel time challenges.
Improving its transport infrastructure can deliver relatively large gains in GRP in a corridor
experiencing rapid growth. Public transport should be expected to play a much bigger role than
is implied in the base case projections for this catchment in particular, but a similar comment
applies to all NEC catchments except perhaps Parkville.
Our analysis suggests that there are a number of priorities that the State Government, and other levels
of government, should consider closely for investing in NEC infrastructure, to support cluster
development and encourage further private sector involvement. Examples are in Appendix A. These
infrastructure initiatives need to be complemented by initiatives in areas such as the development of
core cluster functional strengths (e.g. biotechnology, allied health, logistics, etc), industry facilitation,
transport pricing reform, regulatory reform (e.g. to manage future growth of autonomous vehicles) and
such like. Monash, La Trobe and Sunshine rate as the highest early priorities, with public transport
improvements a priority for these are other NECs, to substantially lift mode shares in coming years and
realise the productivity benefits that our analysis has suggested will be associated therewith. All NECs
should participate in development at a sufficient scale to demonstrate identifiable and encouraging
progress. East Werribee has a strong equity case.
Areas that should receive particular attention are:
Development of a strong core in each NEC – for Monash, La Trobe and Dandenong South, designation
of a ‘town centre’ should be an early priority, with medium to longer term development invested in
supporting growth in this location and, from day 1, connecting the core to the remainder of the cluster,
by active transport and local PT, and strengthening regional trunk PT connections.
Investment in place‐making initiatives in each NEC from day 1, to help attract the talent on which NECs
will rely. These place‐making initiatives should include community and cultural infrastructure and active
8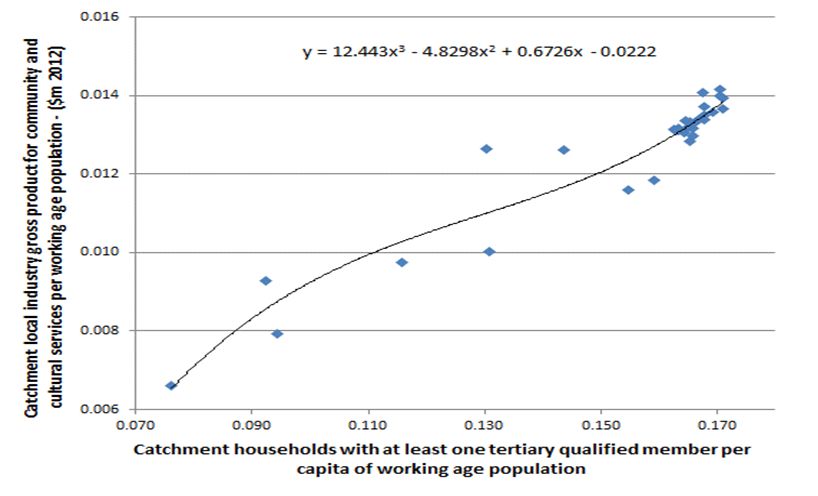
transport opportunities. The core of the cluster, and connections thereto, should be starting points for
investment, extending outwards over the coming years. Place‐making initiatives should include the
development of a few notable boulevards, with all clusters represented, and a focus on greening, which
helps to raise the image of clusters.

Improve trunk accessibility of the NEC, particularly by complementing the current major investment
program in heavy rail with a short to medium term investment in SmartBus and supporting local bus
services upgrades, to better cater for cross‐town movement and help achieve the intended NEC purpose
of spreading the productivity benefits from NEC development. Some light rail upgrades should be
implemented, to improve on‐road operation around Parkville and extend the Plenty Rd route through La
Trobe University, should a town centre project be implemented. Running the rail line at Werribee
through the proposed AEC site, to help densify the town centre and service the growth of ‘eds and
meds’ in the cluster, would potentially be an important stimulus for that NEC.

Upgrade arterial roads serving the NECs, with priority being given in the short to medium term to active
transport, public transport and freight, consistent with the development of more compact settlement
patterns. However, most NECs are projected to have significant growth in car traffic levels, with growth
in the East Werribee catchment striking. Such growth needs to be catered for in a way that does not
encourage additional urban sprawl, since Melbourne needs to be slowing its rate of fringe growth. The
NE Link seems likely to be important for middle urban development in the east/north and then, if
needed, an Outer Metropolitan Ring Road. Boulevard development should form part of the arterial
upgrade program, to raise the quality of place in the NECs

Development of a number of strategic transit corridors on key access routes to/from NECs, along
which mixed‐use densities will be increased. PT service levels and active travel opportunities need to be
good along these routes and place‐making initiatives should be prominent. Some of these corridors may
be developed as green boulevards

Ensuring that NBN connectivity is available as soon as possible – anything less makes a mockery of the
idea of innovation on which the clusters are founded.

Encouragement of a wide range of lifestyle choices in/close to each NEC core ‐ such as a choice of
schooling opportunities, to increase the prospects of attracting businesses and talent to the
cluster/vicinity.

                                                    9
1. Context of NECs and this report
Australia’s capital cities are pursuing broadly similar land use development directions, to promote
economic productivity and social inclusion, together with a smaller environmental footprint. To a
greater of lesser extent, mainly related to city size, all are doing this by pursuing more compact urban
settlement patterns, in Melbourne’s case anchored by:
the CBD and close surrounds, because of the wider economic benefits (in production and
consumption) that flow there‐from
a small number of high tech/knowledge‐based inner/middle urban activity clusters, which form
the basis for a polycentric city and focal points for inner/middle urban area growth. These
clusters, called National Employment Clusters (NECs), were a new innovation in Plan Melbourne
(DTPLI 2014)
major urban renewal opportunity areas (e.g. in areas that have lost large numbers of
manufacturing jobs)
supportive mixed use activity centres, that mainly provide a sub‐regional population‐serving role
a series of constituent 20 minute cities/neighbourhoods (both major political parties adopted
this Plan Melbourne idea as 30 minute cities in the recent federal election).
This land use development direction is similar to that being pursued by many cities globally, although
the Melbourne focus on high tech/knowledge‐based inner/middle urban clusters is unusual, its origins
being outlined later in this section of the report. The addition of strategic transit corridors to this set of
land use anchors has been proposed for the Plan Melbourne Refresh by the Ministerial Advisory
Committee (MAC) that has been assisting with that Refresh (one of us is a member of that MAC).
Supportive transport development directions are an essential part of delivering on these land use
directions, broadly along the following lines:1
ensuring strong radial public transport to the central areas of our cities, to support their
agglomeration economies
good arterial roads across the entire city
fast and frequent trunk public transport services to support inner/middle urban
nodes/corridors. In larger cities, this direction includes circumferential movement, such as
Melbourne’s SmartBus and Sydney’s Metrobus networks, linked to the cluster (node)
development focus
better public transport connections from outer suburbs to areas of employment/activity
concentration (recognising that job creation in outer suburbs is very difficult to accomplish at
anything greater than about 300 jobs per 1000 population, much less than is needed to provide
local jobs for all who want them)
supportive local public transport opportunities, which is hardest in the lowest density settings
high priority to walking and cycling throughout the whole city.
1
The land use transport development directions summarized herein have been elaborated in greater detail by
Stanley and Brain (2015), in a report written for the Australian Council of Learned Academies, as input to an ACOLA
report to Australia’s Chief Scientist on sustainable mobility (ACOLA 2015).
10Governance arrangements for delivery in Australian cities are still in development, lagging somewhat
the evolution of the land use transport development directions, particularly with respect to NECs and 20
minute neighbourhoods. The federal government’s Cities Deal, picking up on the UK concept, is an
interesting addition in this space and has the potential to support more integrated delivery of these land
use/transport development directions across all levels of government (vertical integration).
As noted, in line with these general development directions Plan Melbourne (DTPLI 2014) has
introduced the concept of National Employment Clusters (NECs) to Melbourne’s land use planning
framework, as key elements of a future polycentric Melbourne. Six NECs were nominated in Plan
Melbourne: Parkville; Monash; Dandenong South; Sunshine; East Werribee; and La Trobe. The first three
of these clusters are existing NECs and the latter three are regarded as emerging NECs.
The basis for the NECs was established in research undertaken by Dr Peter Brain at the National Institute
for Economic and Industry Research (NIEIR) for the Ministerial Advisory Committee for Plan Melbourne
(MAC), as a way to (1) promote growth in the productivity of the greater metropolitan area and (2)
enable the benefits of this growth to be shared more widely among residents, including residents in the
fast growing outer suburbs. In brief, high‐tech/knowledge economy jobs have been centralising while
residential growth has remained strong, but jobs scarce, on the city’s fringe. The productivity differential
between the inner city and fringe is wide and has widened over the past two decades, as shown in
Figure 1.1. The productivity focus of the NECs is an economic efficiency orientation, while the
accessibility component is about equity or fairness. Prioritisation of NEC development opportunities
then depends, in part, on the relative weight attached to efficiency (productivity) and equity (sharing
the benefits from the productivity).
The idea of the polycentric city as a model for urban development has been around for some time, being
recognized (for example) in Sydney’s City of Cities approach. Australian delivery, however, has not been
strong and the basis of the case for an Australian polycentric model, thus far, has not been explicitly
linked to non‐CBD growth in high tech/knowledge‐based clusters but rather to developing and providing
more general higher order commercial/retail activity centres. Plan Melbourne has shifted the focus to
the role of urban structure in promoting productivity growth and better sharing its benefits. The
productivity based argument in Plan Melbourne thus adds an important dimension to the case for
polycentric development.
Connecting high tech/knowledge‐based urban employment clusters by frequent public transport, to
help extend productivity benefits to residents more broadly across a city (an equity perspective), brings
in the important idea of increasing densities along those frequent transit corridors. This will help to
increase the numbers of residents with good access to the major clusters, boost public transport use and
lower the external costs of car use. This thinking has underpinned the MAC’s support for such transit
corridors. Important research by Levine et al. (2014) has shown that denser metropolitan areas have
slower travel speeds but greater origin‐destination proximity. Lower travel speeds reduce accessibility
but proximity increases it. Very importantly, they conclude that the proximity effect dominates, such
that denser urban areas are more accessible.
Plan Melbourne is currently being updated by the State Government, the update being due for
completion shortly. It may revert to the name for the NECs that was originally proposed by the MAC,
this being National Employment and Innovation Clusters (NEICs). This wording is preferred because of
the emphasis that it gives to the key role of innovation in cluster formation and development. However,
given that this matter of nomenclature is still to be settled, we use NEC in this report.
11Figure 1.1: Melbourne: Change in deviation about the mean growth in headline GRP per hour
worked: 1992 to 2012 (Source: NIEIR)
Infrastructure Victoria (IV) is charged with advising the Victorian Government on a 30 year infrastructure
strategy for the State and, as part of that work, is seeking an indication of the way that investment in
National Employment Cluster (NEC) development in Melbourne might be prioritised in coming years. We
have been asked to provide advice to IV to inform infrastructure prioritisation in their 30 year strategy,
particularly for infrastructure options that could address the strategy's Need 11 "Improve access to
middle and outer metropolitan major employment centres".
This advice is to be subject to IV’s objectives and needs identification. The advice would be based on
research that should focus on analyzing:
1. how the current NECs benchmark against key criteria that underpin designation of NECs in Plan
Melbourne and key IV criteria
2. the projected impact of improving the accessibility on NEC performance on key criteria
123. projected impacts of increased activity density on NEC performance on these criteria
4. projected impacts of increased investment in the capital stock of a NEC’s catchment, illustrated
by investment in cultural and community infrastructure, on NEC performance on these criteria.
These particular areas have been chosen because they emerged as significant in the NIEIR original
econometric work on which NEC designation was based in Plan Melbourne, as elaborated in Stanley and
Brain 2015, which also reports findings for Sydney that are supportive of the Melbourne research.
Following this introduction, Section 2 discusses a number of criteria that are relevant to evaluation of
NEC development in Melbourne, drawing on IV’s criteria (as set out in IV 2016a) and on criteria that led
to Plan Melbourne designating National Employment Clusters. Section 3 lists the main spatial option
types that have been identified by IV (in IV 2016b) that are likely to assist NEC development. Innovation
districts are introduced in section 4, since these strongly reflect the intent of the NECs. A brief overview
of that topic is a useful way of identifying some relevant policy opportunities for NEC development.
Section 5 provides some important benchmark indicators of the performance of the six NECs, focusing
particularly on productivity, because of the significance of this measure to NEC designation and intent.
Section 6 presents the first analysis of NEC development options undertaken for this report,
encompassing travel time improvements and based closely on the initial NIEIR work that underpinned
NEC designation. Section 7, perhaps the most important part of the report, draws on more refined data
made available through IV for the purposes of the present study, to assess potential implications for
future NEC development of accessibility improvements, density increases and increases in other forms
of investment in NEIC catchments, particularly in community and cultural infrastructure. Section 8 sets
out some thoughts about NEC governance, while Section 9 discusses some strategic considerations in
terms of NEC prioritization. Our conclusions are summarised in section 10. Appendix A summarises our
thoughts on the competitive strengths and weaknesses of the respective NECs and suggests some
possible improvement projects, to enhance key strengths or mitigate perceived significant weaknesses.
Appendix B briefly explains how we have treated travel time in the determination of NEC catchment size
in Section 6. Appendix C provides details of the modelling approach taken to estimate catchment
economic performance for the analysis reported in section 7.
132. Infrastructure Evaluation Criteria
As noted above, the performance criteria for assessing NECs in this report encompass both criteria on
which NEC designation was originally based in the underpinning work for Plan Melbourne and also on IV
criteria, as elaborated for example in Infrastructure Victoria (2016a, b). There is considerable
commonality between the respective sets of criteria, as illustrated below.
Drawing on the underpinning research by NIEIR for the Plan Melbourne MAC, the two key Plan
Melbourne criteria for assessing NECs are:
1. productivity – where we use Gross Regional Product per hour worked (GRP/hr) as the main
indicator
2. equity or fairness – we use hours of work available per person of working age as our indicator
here, particularly for the analysis in sections 6 and 7.
Based on the initial NIEIR research on NECs undertaken for the Plan Melbourne MAC, and other
research on urban productivity, including more recent NIEIR research in Sydney and Brisbane, key
performance drivers of NEC productivity are:
1. industry mix, particularly the catchment presence of high‐tech/knowledge‐based economic
activities ‐ where catchment is defined by travel times
2. occupational mix, particularly the presence of skilled occupations
3. availability of community and cultural infrastructure ‐ this affects an area’s attractiveness for
skilled labour
4. accessibility of the NEC‐ including distance from the CBD
5. scale and density of the NEC catchment (reflecting agglomeration economies).
These elements could be evaluation criteria in their own right. However, because of their roles in driving
productivity and equity outcomes, we have used them to frame NEC development options. Items 3 to 5
in this list, in particular, form the basis for the generic investment options considered in sections 6 and 7
and will, inter alia, influence outcomes on 1 and 2.
Infrastructure Victoria (2016a) lists 10 objectives towards which its work is directed. These are:
1. Prepare for population change
2. Foster healthy, safe and inclusive communities
3. Reduce disadvantage
4. Enable workforce participation
5. Lift productivity
6. Drive Victoria’s changing globally integrated economy
7. Promote sustainable production and consumption
8. Protect and enhance natural environments
9. Advance climate change mitigation and adaptation
10. Build resilience to shocks.
Aligning the numbering of these objectives with the Plan Melbourne‐based NEC criteria indicates that IV
objectives 3, 4, 5 and 6, in particular, are covered in some way:
IV criterion 3 is in accord with an equity criterion for NEC catchments
14 IV criterion 4 will be supported by achievement of increased urban productivity, which is the
main Plan Melbourne rationale for NECs
IV criterion 5 is the same as Plan Melbourne’s primary intention for NECs
IV criterion 6 is in line with the intent of the NECs, where innovation is central.
153. Options for meeting needs
Infrastructure Victoria (2016a) identifies 19 needs to be met in the process of pursuing the 10 objectives
it espoused (as set out in section 2 above). IV’s need 11 is particularly relevant to development of the
NECs. A spatial outline of the options under review by Infrastructure Victoria to meet its identified needs
links Plan Melbourne’s strategic land use development directions (DTPLI 2014) and IV’s needs
assessment, as summarily shown in Table 3.1 (Infrastructure Victoria 2016a). The top content row in the
table is relevant to the NECs, which form key anchors for the future development of polycentric
Melbourne. Infrastructure Victoria (2016b) then sets out details of the wide range of options being
assessed by IV.
Table 3.1: Linking Plan Melbourne land use directions and Infrastructure Victoria’s identified needs
and options
PLAN MELBOURNE INFRASTRUCTURE
NEEDS AND OPTIONS
Proposes a polycentric city model to provide more Options to support a polycentric model are under
jobs in the suburbs, such as employment clusters. Meet growing demand for access to economic
activity in central Melbourne (10) and Improve
access to middle and outer metropolitan major
employment centres (11).
The ability to meet everyday, non‐work needs Options are explored under Enable physical
locally, primarily within a 20‐minute walk. activity and participation (4).
Implement an expanded central city. Options that support an expanded central city are
explored under Address infrastructure demands in
areas with high population growth.
Source: Infrastructure Victoria 2016a, p. 30.
We note that few of the options detailed in Infrastructure Victoria (2016b), and linked to needs in
Infrastructure Victoria (2016a), are sufficiently detailed to permit a conventional cost benefit
assessment of their performance. As a result, only generic assessments of merit are feasible at this
stage, as reflected in the IV option performance assessment methodology and associated ratings
(Infrastructure Victoria 2016 a, b). These ratings can only really indicate whether the options under
consideration are sufficiently robust to pass to a detailed analysis stage, which is yet to be
undertaken. That major caveat applies similarly to the analysis undertaken in the current report. Thus,
for example we have been able to indicate the broad impacts on NEC productivity of generic
improvements in NEC accessibility but we do not have evidence on the costs of particular initiatives that
might deliver such improved accessibility. We are thus able to present quantitative measures of a major
benefit category from generic option implementation, and provide examples of the kinds of initiatives
that might deliver this outcome, but not of the applicable cost for achievement. We do, however,
provide some cost estimates for upgraded SmartBus services, which will need to be one key element in
enhancing NEC performance and in which we have some experience. More broadly, however, project
specification and costing needs to be considerably enhanced for detailed project appraisals to be
undertaken.
16Under Infrastructure Victoria’s Needs Item 11: Improve access to middle and outer metropolitan major
employment centres, with a particular focus on the NECs, the main generic options for helping to meet
the need, as identified by IV (2016a), are:
Road space allocation changes (RSA) – the impact here (benefits and costs) will depend, for
example, on the specific initiatives that are implemented and the nature and scale of the Public
Transport (PT) and active transport priority that is given to the NECs
Growth area bus services (LBS) – these are framed by IV as local services aimed at supporting a
city of 20 minute neighbourhoods. Linking with strong trunk services connecting to the NECs is
needed for this option to be of most value to the NECs and the option focus would then need to
be on the neighbourhoods served by particular NECs. We note that the IV Metropolitan Citizen’s
Jury rated this category of initiative (LBS) as Strong Endorsement and High Priority (IV 2016c)
Public transport train timetabling (PTT) – particularly in rail corridors serving NECs
Residential and commercial property densification (RCP) – with a particular focus on the NECs.
Rated as Strong Endorsement and High Priority by the IV Citizen’s Jury
SmartBus service provision increase (SSP) – particularly on routes serving the NECs. This option
was also rated as Strong Endorsement and High Priority by the IV Citizen’s Jury
Strategic transit‐oriented development corridors (STO) – now linked to option RCP by IV. This
option too was rated as Strong Endorsement and High Priority by the IV Citizen’s Jury.
Arterial road network employment centre enhancements (ARN) – particularly for routes serving
the NECs. This option was rated as Moderate Endorsement and Medium Priority by the IV
Citizen’s Jury, although it is difficult to see how SmartBus improvements can be delivered at high
priority without a significant focus on this option
Employment centre mass transit network (MTN) – this option is hard to differentiate from SSOP
plus LBS, if the focus is on NECs
Growth area train station upgrades (GAT) – for stations on routes serving the NECs
Outer metropolitan ring road (OMR) – arguably this project is a necessary long term
accompaniment to arterial road upgrades and PT service upgrades for the NECs
In terms of subsequent analysis in this report, the two sets of bus initiatives (LBS and SSP) and two
arterial road options (RSA and ARN) are central to the accessibility analyses we discuss in sections 6 and
7. The analysis of density increases in section 7 is based on assessing the potential productivity benefits
of initiatives RCP and STO. These are all important options in terms of the IV metropolitan Citizen’s Jury
assessments of priorities, as noted above, particularly LBS, SSP, RCP and STO. The section 7 analysis also
goes wider and considers the potential impacts of increased investment in cultural and community
infrastructure and in increasing the capital stock (infrastructure) more broadly.
174. Urban innovation districts
The focus on urban productivity and agglomeration economies, which underpins the conception of NECs
for Melbourne as a spatial focus for innovation, links closely with emerging research on innovation
districts by Katz and colleagues at the Brookings Institution (see, for example, Katz and Bradley 2013;
Katz and Wagner 2014) and KPMG’s work on Magnet Cities (KPMG 2014). We briefly summarise some
of the main findings from this research, since it is helpful in terms of identifying the kinds of initiatives
that have been shown to support growth of innovation districts elsewhere. This section draws partly on
some material from a forthcoming book by one of us, co‐authored with two colleagues who were also
involved in Plan Melbourne, one as Chair of the MAC (Stanley et al forthcoming).
KPMG (2014) looks at how a number of second tier cities have confronted severe adverse structural
economic and/or other major change (e.g. an earthquake in Christchurch’s case; loss of the major
employer at Malmö; flooding in Bilbao) and reinvented themselves in the process, particularly through a
focus on attracting young wealth creators and a related emphasis on building city magnetism (central to
attracting creative young talent, as well as benefiting the wider community). KPMG identifies a number
of key characteristics of what they call magnet cities, such as the importance of having
a definable and authentic city identity (where cities like Malmö show that reinvention is possible
in a short time frame, particularly if it builds on past/current strengths)
a strong and vibrant urban core, that appeals to the interests of young wealth creators
openness to, and active encouragement of, new ideas (e.g. some cities offering themselves as
laboratories for new ideas; universities can play a key role)
strong local leaders (mayors) with a clear apolitical vision for the future, the capacity to stick to
this vision and to collaboratively engage residents, universities, investors and businesses around
pursuit of the vision, together with a willingness to commit financial and other support to
delivering on the vision
targeting specific categories of young wealth creators linked to the nature of the vision for the
future.
KPMG’s case study locations include cities of a range of sizes but some are small cities (e.g. 300,000
population) where the focus of innovation has been a district, which suggests possible application to
segments of a larger city, such as a NEC.
There is a lot of crossover between the elements of magnet cities and the Brookings Institution research
on innovation districts (Katz and Wagner 2014). Katz and Wagner suggest that
…. three shifts – a converging knowledge economy, more open innovation ecosystems, and
changing demographics – are stirring new demands for density, proximity, collaboration, and
walkability, and in so doing are re‐working the spatial geography of innovation (Katz and
Wagner 2014, p. 10).
These shifts have underpinned the growth in innovation districts, which they define as
... geographic areas where leading‐edge anchor institutions and companies cluster and connect
with start‐ups, business incubators, and accelerators. They are also physically compact, transit‐
accessible and technically‐wired and offer mixed‐use housing, office and retail (Katz and Wagner
2014, p.1).
18The proximity and open collaborative networks (across sectors) of these clusters promote knowledge
spillovers and labour market pooling, driving agglomeration economies. These are the kinds of places
that attract the young wealth creators who are the focus of the KPMG (2014) Magnet Cities research.
Macro scale research support for innovation districts comes from sources such as Abel et al. (2012), who
find that density and human capital work together to shape agglomeration outcomes. Professional
services, arts and entertainment, information and finance were found to receive a relatively large
productivity boost from density in their US research, consistent with knowledge spill‐over effects. They
observe that
... the sectors that appear to benefit most from density of human capital are creative,
knowledge‐based industries where the exchange of information and sharing of ideas are
important to the production process. This finding suggests that an important source of the
aggregate productivity effect we measure arises from the benefits that physical proximity
provides in the transmission of knowledge and ideas among people (Abel et al. 2012, pp. 581‐2).
Illustrating such proximity effects, Clare (2013), for example, in an analysis of the place‐boundedness of
advertising in London, finds that
Despite how easy and effortless it is for individuals to communicate across the globe ...
individuals and companies cluster in particular cities and neighbourhoods for ideas, inspiration
and face‐to‐face communication (Clare 2013, p. 56).
Three main types of innovation district are identified by Katz and Wagner (2014):
1. the anchor‐plus model, found in downtowns and mid‐towns of larger cities. They cite many
examples including Kendall Square in Cambridge around MIT. The Parkville NEC in inner
Melbourne is a local example
2. the re‐imagined urban areas model, based on re‐generation/transformation of old sites such as
waterfronts or old industrial areas (e.g. they use the example of South Boston Waterfront;
London has its Canary Wharf; Docklands has elements of this model)
3. urbanized science parks, where (for example) car oriented campus‐type developments are
redesigned for higher densities with more mixed use (e.g. North Carolina’s Research Triangle
Park; Melbourne’s Monash Precinct).
Katz and Wagner (2014 p. 10) note how
economic assets, which they describe as ‘firms, institutions and organizations that drive,
cultivate or support an innovation rich environment’ ‐ examples include educational, research
and medical institutions, entrepreneurs and neighbourhood‐building amenities, such as
restaurants, coffee shops, medical facilities, grocery stores and local retail
physical assets, ‘the public and privately‐owned spaces – buildings, open spaces, streets and
other infrastructure – designed and organized to stimulate new and higher levels of
connectivity, collaboration, and innovation’ ‐ examples include housing, bike paths, pedestrian‐
oriented laneways and walkable streets, public transport services. In terms of the accessibility
role performed by physical assets, the integration of regional scale accessibility and high quality
local walkability (and place‐making) is important for development of innovation districts and
19 networking assets , ‘ the relationships between actors – such as between individuals, firms, and
institutions – that have the potential to generate, sharpen, and/or accelerate the advancement
of ideas’‐ these support collaboration and relationship building,
combined with a supportive risk‐taking culture, can create an innovation ecosystem that enables
innovation districts to flourish.
Like KPMG (2014), Katz and Wagner emphasize the importance for successful innovation districts of,
inter alia, building a collaborative leadership network, establishing a vision for growth that is founded on
local competitive advantage, the pursuit of talent and technology and of local capital. The significant
role that can be played by comprehensive neighbourhood revitalization as a means of promoting
inclusive growth is also noted, recognising the flow‐on opportunities created by successful innovation
districts. This was an important common element in many of the KPMG (2014) Magnet Cities case study
cities.
In discussing district visioning, Katz and Wagner note the importance of re‐imagining the physical
landscape and the challenges commonly posed by a legacy of land use planning that has traditionally
separated land uses. This is a challenge for a number of the Melbourne NECs, such as:
Monash, which has separation between the Clayton university site/CSIRO and the Monash
Medical Centre, with congested Clayton Rd the main means of linkage
La Trobe, where the University is separated from the Austin/Mercy Medical hub at Heidelberg,
with some intervening commercial and residential land uses and poor access between
Sunshine, where the Sunshine St Albans Health Precinct is separated from Sunshine
Metropolitan Activity Centre
South Dandenong, where the industrial area is separated from Dandenong CAD, with poor
access between.
NEC development strategies need to confront the challenges posed by such separation, which raise the
question: Should NEC development seek to advance each component part of each NEC at a broadly
similar rate, or should efforts be more concentrated spatially within ‘separated NECs’, to achieve more
rapid and demonstrable progress on part of the cluster? We favour the latter approach, with the
primary focus being on supporting development of the strongest identified competitive strength of each
NEC, with that support being provided to/through enhancing the mix of economic assets, physical assets
and networking assets best geared to that purpose, including investing to improve integration within the
NEC (access between the component parts). Successful development of the core competitive strengths
and core component of a NEC will, we believe, help to deliver the largest multiplier impact to the NEC
catchment, with population‐serving activity being drawn in to support this development. The
development experience of Docklands supports this approach, with the extensive development
approach pursued in that location being partly responsible, in our view, for relatively poor public realm
development, until recent times. Evidence of successful place‐based development in the core of the NEC
will, we believe be more likely to encourage other actors to become part of the activities that comprise
the NEC. Longer term, other parts of the NECs should then receive focus, while becoming more strongly
integrated within the NEC in the shorter term.
If an urban economic development and land use strategy of the kind proposed for Melbourne is to
succeed, framed around a polycentric city model based on NECs, then the small number of selected non‐
central nodes or clusters require a place‐specific combination of the economic assets, physical assets
20and networking assets discussed by Katz and Wagner (2014). Weaknesses in any of these areas pose
risks to the whole. Integrated thinking is thus crucial for success, with the Brookings research identifying
many opportunities to enhance the likelihood of success. The range of influences identified in this mix
shows the importance of a comprehensive and integrated approach to development of innovation
districts or, in Melbourne’s case, NECs.
The Metropolitan Planning Authority (MPA), which has been undertaking initial planning for the NECs,
has identified that they ‘need to offer high‐value business opportunities with:
a sizeable, flexible and growing skilled worker pool
high levels of transport accessibility
sufficient size to offer agglomeration benefits
strong links to existing centres of innovation, research , health, specialist industry, education
excellent urban design and business/worker/resident amenity
catalyst infrastructure projects to support job development and attract higher skilled jobs in the
suburbs
refocused NEC‐centric transport systems’. (Source: MPA notes provided to the consultants)
MPA also identify a number of key requirements in ‘getting from here to there’, including the
importance of focussing on current and future strengths of each cluster and of a concentrated and
committed long term effort and investment program, singling out transport investment that supports
NECs as destinations, together with investment in strong specialist areas, such as education, health and
research. MPA also recognises the importance of an on‐going focus on NECs by state and local
governments, since this underpins many of the other foundational requirements. The qualities
highlighted by MPA recognise the importance of the economic and physical asset space identified by the
Brookings Institution research. That research also emphasises the importance of networking assets,
which draws attention to questions of NEC governance. We return to this matter in section 9.
As a final point on NECs as innovation ecosystems, we note that tertiary educational institutions and
medical research facilities (sometimes known as ‘eds and meds’) are seen as key economic assets for
most of the designated Melbourne NECs. Florida (2012), however, has cautioned against a city relying on
‘eds and meds’ for regional economic growth. It is striking, however, that Greater Melbourne currently
has three high end knowledge clusters based on ‘eds and meds’ which are operating successfully. One is
based around University of Melbourne and associated medical research facilities at the northern central
city fringe, another around Monash University/Monash Medical Centre and the Commonwealth
Scientific and Industrial Research Organisation, about 20 kilometres to the south‐east of the CAD, and
the third is in Melbourne’s north, with La Trobe University and the Austin/Mercy Medical complex and
related services. Melbourne’s west currently lacks this strong base in eds and meds but it is emergent
around Sunshine NEC and Werribee has some opportunities, particularly with the prospective Australian
Education City development. Local evidence supports a focus on such eds and meds but Florida’s
warning about reliance on these sectors is salutary, suggesting a need for a multi‐pronged growth
strategy for the key nodes in a poly‐centric city.
21You can also read