Augmenting State Capacity for Child Development: Experimental Evidence from India - UC San ...
←
→
Page content transcription
If your browser does not render page correctly, please read the page content below
Augmenting State Capacity for Child Development:
              Experimental Evidence from India∗

 Alejandro J. Ganimian†                Karthik Muralidharan‡               Christopher R. Walters§
  New York University                     UC San Diego                          UC Berkeley

                                         September 15, 2021

                                                 Abstract
       We use a large-scale randomized experiment to study the impact of augmenting staffing in the
       world’s largest public early childhood program: India’s Integrated Child Development Services
       (ICDS). Adding a half-time worker doubled net preschool instructional time and led to 0.29σ
       and 0.46σ increases in math and language test scores after 18 months for children who remained
       enrolled in the program. Rates of stunting and severe malnutrition were also lower in the
       treatment group. A cost-benefit analysis suggests that the benefits of augmenting ICDS staffing
       are likely to significantly exceed its costs even under conservative assumptions.

   JEL codes: C93, I21, I22, I25
   Keywords: preschool education, early childhood development, nutrition, malnutrition,
stunting, ICDS, state capacity, staffing, public service delivery, India

   ∗
      We thank the Government of Tamil Nadu especially S. Krishnan, L. Manivasan, and R. Kannan for their
support for this project. We also thank Aparna Krishnan, Gautam Patel, Megha Pradhan, and Prakarsh
Singh for their support at various stages of this project. We thank Larry Aber, Prashant Bharadwaj, Gordon
Dahl, Jishnu Das, Purnima Menon, Jayashree Raghunandan, Mauricio Romero, Abhijeet Singh, Sharon Wolf,
Hirokazu Yoshikawa, and several seminar participants for comments. Shruti Agarwal, Tanay Balantrapu, Aditi
Bhowmick, Sharnic Djaker, Smit Gade, Nandini Gupta, Putul Gupta, Murali Mallikarjunan, Nihal Ranjit,
Dhananjay Singh, Sivaranjani Sivamohan, and Anuja Venkatachalam provided excellent research assistance
and field support. This study was registered with the AEA Trial Registry (RCT ID: AEARCTR-0001772).
It was approved by the Institutional Review Boards of the University of California, Berkeley and San Diego
and the Institute for Financial Management and Research. We thank the Government of Tamil Nadu and the
Abdul Latif Jameel Poverty Action Lab (J-PAL) for funding this study. All views expressed are those of the
authors and not of any of the institutions with which they are affiliated.
    †
      NYU. alejandro.ganimian@nyu.edu.
    ‡
      UC San Diego, NBER, J-PAL, and BREAD. kamurali@ucsd.edu.
    §
      UC Berkeley, NBER, J-PAL, and MIT-SEII. crwalters@econ.berkeley.edu.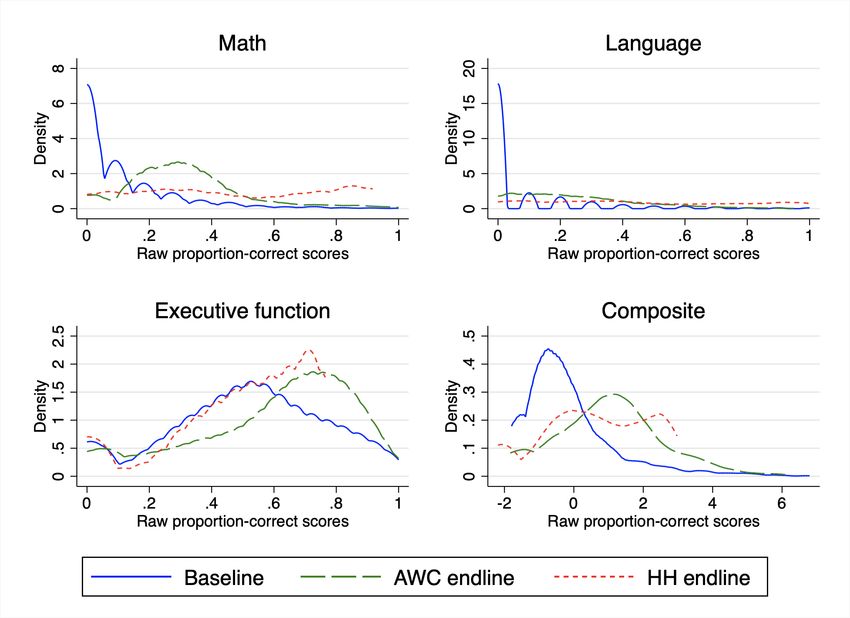
1       Introduction
There is a broad consensus in the child-development literature that children’s early-life
interactions with parents and teachers have important consequences for cognitive and
socio-emotional development (Shonkoff, Phillips, et al., 2000; Engle et al., 2007; Heckman
and Mosso, 2014). Yet, despite growing policy interest in providing quality early childhood
education in developing countries around the world (World Bank, 2018), there is little evidence
on cost-effective ways of improving early childhood education at scale.
    This paper contributes evidence on this question in the context of the largest early
childhood development program in the world: the Government of India’s Integrated Childhood
Development Services (ICDS). ICDS caters to over 36 million 3-to-6-year-olds, and it provides
a range of early childhood health and nutrition services as well as preschool education. ICDS
also caters to another 46 million children in the 0-3 age range with supplemental nutrition
and health services provided through home visitation. ICDS services are provided through
1.35 million anganwadi centers (AWCs) across India by anganwadi workers (AWWs).1 These
services are provided free of charge and disproportionately cater to the poor. Thus, the
anganwadi system is the Government of India’s primary vehicle for reaching tens of millions of
socio-economically disadvantaged children, who are most likely to be in need of early childhood
education and nutrition programs.
    Despite its importance, ICDS has limited staffing and funding, which may constrain its
effectiveness. In particular, a single worker is responsible for health, nutrition, home visitation,
and administrative tasks in addition to preschool education, which limits time spent on
preschool education.2 A scoping study we conducted in the state of Tamil Nadu (the setting
of our study) found that workers spent only 38 minutes per day (out of a scheduled two hours)
on preschool instruction (Ganimian et al., 2018). Further, AWWs are recruited locally and are
paid roughly one-fourth the salary of civil-service primary-school teachers. The combination
of low marginal cost and potential high returns suggest that adding a staff member to focus
on preschool education may be a promising policy option for strengthening the ICDS. Doing
so could increase instructional time and also free up time of the primary worker to focus on
health and nutrition activities.
    We study the impact of such an approach by conducting a large-scale randomized
experiment across a sample of 320 anganwadi centers in four districts representative of a
population of 60 million people in the Indian state of Tamil Nadu. Half of these centers
were randomly selected to receive an extra facilitator focused on early childhood education.
The facilitator was scheduled to work for half a day and focus on preschool instruction,

    1
    We use the terms AWC and “center” interchangeably, and do the same with the terms AWW and “worker”.
    2
    The worker is assisted by a helper who is responsible for cooking and cleaning. However, helpers are
much less educated, and the worker is typically the only staff member with a secondary school education.

                                                   1
and was paid half the salary of a regular worker on a full-time shift. The intervention was
implemented by the Government of Tamil Nadu using protocols similar to those that would
be used if the program were to be scaled up, including hiring and training of the facilitators.
The combination of random assignment in a representative sample of centers, and government
implementation of the program increases the external validity of our results to the full state
of Tamil Nadu (as described in Muralidharan and Niehaus, 2017).
Our primary outcomes of interest are test scores in math, language, and executive function.
We measured these through independent tests conducted in AWCs, as well as through
independent tests administered in a representative sample of households. We also collected
child anthropometric data as a secondary outcome. Finally, we measured worker attendance,
timeliness, and time use through unannounced visits to the centers. Enumerators sat in
classrooms for the full two hours scheduled for preschool instruction (10am to 12pm) and
coded all tasks performed by workers and facilitators in six-minute intervals. We present four
sets of results on time use, education, nutrition, and cost-effectiveness respectively.
First, treated centers were closed only 3.8 percent of the time compared to the control group
closure rate of 12.5 percent. On average, facilitators provided nearly an hour of daily preschool
instruction in treated centers during the two-hour observation window. Workers in treated
centers reduced time spent on preschool education, but they spent more time on health and
nutrition tasks, and on completing administrative work (while being in class and supervising
the instructional work of the facilitator). Adding the time spent across the worker and the
facilitator, we find that the total time spent on preschool education doubled in treated centers
(from 38 to 76 minutes per day). Treated centers saw an over 250% increase in total staff
time spent on health and nutrition activities (from 6 to 16 minutes), and on administrative
work (from 20 minutes to 55 minutes) during the observation window.
Second, in line with this increase in total instructional time, we find significant increases
in children’s learning levels. Eighteen months after baseline, children in treated centers
scored 0.29, 0.46, and 0.18 standard deviations (σ) higher on independent tests in math,
language, and executive function conducted in the AWCs (p < 0.01 for all three subjects).
Overall, the intervention boosted a composite measure of learning across all three domains
by 0.29σ (p < 0.01). The gains were broad-based and the treatment distribution first-order
stochastically dominates the control distribution.
While there was no differential attrition in the center-based tests across treatment and
control groups, the follow-up rate from baseline to endline was only 33%. This reflects a
combination of children graduating out of preschool, moving to private preschools, families
migrating, and irregular attendance. We therefore supplement the AWC-based outcomes by
also measuring outcomes for a representative sample of children from the baseline cohort in the
household, achieving an 89% follow-up rate with no differential attrition. Treatment effects on
2the household tests are smaller but still significant. Children in treated centers scored 0.13σ
higher in math (p < 0.01), 0.10σ higher in language (p < 0.05), 0.05σ higher in executive
function (not significant), and 0.11σ higher on the composite measure (p < 0.05).
The smaller effects on household tests most likely reflect the fact that the children who were
not in the AWC endline testing sample (but who were included in the household sample) had
either moved out of AWCs or attended them infrequently. This is corroborated by comparing
household and center-based estimates for the common sample of children who took both
tests. In this sample, we find household treatment effects of similar magnitude to those
measured on the AWC tests. Moreover, treatment-on-the-treated effects obtained by scaling
the household sample estimates by the share of children observed at the center are close
to the AWC and common sample estimates. We therefore interpret the AWC estimates as
reflecting treatment effects on children who actively attended AWCs, while the household
estimates capture intent-to-treat-style impacts on the set of eligible children, many of whom
had limited treatment exposure.
Third, we also find positive treatment effects on child nutrition. The intervention increased
weight-for-age z-scores (WAZ) by 0.10σ and boosted height-for-age z-scores (HAZ) by 0.09σ
in AWC endline measurements. Children in treated centers were 3.1 percentage points less
likely to be severely malnourished, defined as having a WAZ score below -3σ (p < 0.01). This
represents a 34% reduction relative to the control mean of 9.1%. The treatment also reduced
stunting, defined as having a HAZ score below -2σ, by 4.8 percentage points (a 16% reduction
relative to the control mean of 29.1%, p < 0.05). Nutrition estimates in the household sample
point in the same direction but are smaller and statistically insignificant, likely reflecting the
inclusion of children with lower intensity of treatment exposure in this sample.
Fourth, we estimate that the intervention was highly cost-effective. Based on literature
estimates of the relationship between test-score effects of preschool interventions and impacts
on adult earnings, we project that the present discounted value of earnings gains expected
to result from this intervention’s impacts on learning is likely to be roughly 13 times the
cost.3 We also conduct a sensitivity analysis, which suggests that the program would be
cost-effective even under conservative assumptions regarding the economic value of test-score
gains. Moreover, our projections suggest that the government would fully recover program
costs in present value if it captured as little as 8% of the increased earnings as tax revenue.
Following the framework of Hendren and Sprung-Keyser (2020), this suggests that the
marginal value of public funds invested in the program could be very high since the program
is likely to pay for itself over time and generate large additional gains to citizens. In a parallel
3
These estimates are based on the (smaller) treatment effects estimated in the household sample rather
than the (larger) ones in the AWC sample because program costs will be paid regardless of student attendance
rates. Our default estimates do not include the projected labor-market benefits of improved nutrition, since
these results are not significant in the household sample. Incorporating projected benefits of nutrition gains
for the AWC sample increases the estimated benefit-cost ratio to between 17 and 22 (see Section 5).
3RCT conducted in the same setting, we found that an unconditional pay increase to existing
AWWs had no impact on either education or nutrition outcomes (Ganimian, Muralidharan,
and Walters, 2020). Thus, the ECE facilitator intervention was highly cost-effective, both in
absolute terms and relative to the most common alternative use of funds within the ICDS.
Reflecting the growing academic consensus on the importance of investing in early
childhood development (Engle et al., 2007; Shonkoff, Radner, and Foote, 2017) policy
documents around the world are increasingly highlighting the importance of providing quality
early childhood education, especially for low-income populations (e.g., GoI, 2020; World Bank,
2018). Yet, progress in translating these objectives into reality has been limited, in part
because of the fiscal constraints of doing so. In particular, while evidence from smaller-scale
studies of high-intensity programs suggests that investing in access and quality of early
childhood programs may make sense (Gertler et al., 2014; Heckman et al., 2010; Campbell
et al., 2002), effects of such programs have been more modest at larger scales (Attanasio et
al., 2014). As a result, policymakers may have reason to be cautious in funding large-scale
expansions of early childhood education.
Thus, our first and most important contribution is to present experimental evidence that
it is possible to improve early childhood education with an easily scalable, cost-effective
intervention implemented by the government, and to do so in the context of the largest
early childhood care program in the world. Expansions in access to pre-primary education in
upper-middle income countries have been found to improve pre-primary school attendance
and learning (Berlinski, Galiani, and Manacorda, 2008; Berlinski, Galiani, and Gertler,
2009). However, public preschool expansions in lower-income countries have been less effective
(perhaps reflecting weaker state capacity for implementation), and successful programs in these
settings have typically been operated by non-government entities (Martinez, Naudeau, and
Pereira, 2013; Bouguen et al., 2014; Blimpo et al., 2019; Dean and Jayachandran, 2019). Our
results suggest that strengthening existing public preschool education systems by adding staff
can be an effective option for improving early childhood education outcomes at scale.
Second, a large experimental literature has shown that interventions in the first 1,000 days
of life (in-utero and up to age 2) can improve child nutrition (see, e.g., Britto et al., 2017).
However, there is much less evidence on whether it is possible to reduce child stunting after this
period. We contribute to the child-nutrition literature by presenting experimental evidence
that it may be possible for interventions to promote “catch-up” growth among children between
ages 3 and 5.4 Our results suggest that augmenting front-line staff strength in early childhood
programs can be a cost-effective way of improving early childhood nutrition outcomes as well.
4
Barham, Macours, and Maluccio (2013) present indirect experimental evidence suggesting the existence
of catch-up growth. Gelli et al. (2019) present experimental evidence and Singh, Park, and Dercon (2014)
present panel-data evidence that school feeding programs can contribute to catch-up growth between ages 5
and 8. But experimental evidence on catch-up growth is very sparse. See Singh (2014) for a discussion.
4Third, and more generally, we contribute to the literature on building state capacity for
service delivery in developing countries. Low-income countries typically have a much lower
ratio of public employees per citizen in part because of their lower tax-to-GDP ratios, and in
part because of much higher public-employee salaries relative to GDP than richer countries
(Finan, Olken, and Pande, 2017). Further, a growing body of evidence suggests that this
civil-service wage premium is not correlated with productivity (Bau and Das, 2017; de Ree
et al., 2018), and that limited staffing adversely affects service delivery (Dasgupta and Kapur,
2020). Our results suggest that hiring of community-level staff at lower than civil-service
salaries may be a promising and cost-effective policy option for expanding state capacity for
service delivery more broadly (Haines et al., 2007; Muralidharan, 2016).
Fourth, and related, our results speak to the literature on the costs and benefits of
occupational licensing (Kleiner, 2000). Policy initiatives for expanding early childhood
education often stipulate that teachers should be qualified and trained (DHHS, 2017;
Berlinski and Schady, 2015; GoI, 2020). Our results, finding that locally hired staff with
a secondary-school education and just a week of training were highly effective at improving
learning outcomes, suggest that a lack of qualifications may not be a constraint to educator
effectiveness in settings with very low student learning levels. These findings are consistent
with similar results in the context of primary-school education in India and Kenya (Banerjee
et al., 2007; Muralidharan and Sundararaman, 2013; Duflo, Dupas, and Kremer, 2015).5
Finally, we provide new evidence on the efficacy of increased instructional resources
in education production. While empirical evidence on class-size reductions in low- and
middle-income countries is mixed (Urquiola, 2006; Banerjee et al., 2007), smaller class sizes
may be especially beneficial for younger children (Blatchford and Mortimore, 1994; Lazear,
2001). Our results support this hypothesis by showing that adding instructional staff can
generate large benefits for young children.6 More generally, our experimental results from India
are consistent with and complement historical evidence from higher-income countries that
has found large long-term benefits from investing in early childhood education and nutrition
programs (Alex-Petersen, Lundborg, and Rooth, 2017; Hendren and Sprung-Keyser, 2020).
5
However, this result may only apply to settings of very low student learning. Evidence from upper-middle
income countries suggests that additional teacher qualifications (e.g., pre- or in-service training) may be needed
in settings where most children have mastered basic skills (Andrew et al., 2019; Bernal et al., 2019). Even in
our setting, more qualified preschool teachers may deliver greater learning gains. However, our results suggest
that it may not be necessary to insist on such qualifications to see meaningful positive effects.
6
Another reason why class size reductions may not help much in older grades in developing countries is
that student learning levels are often several grade-levels behind curricular standards (Banerjee et al., 2007;
Duflo, Dupas, and Kremer, 2011; Muralidharan, Singh, and Ganimian, 2019). Class-size reductions may not
alleviate binding constraints to education production in such a setting. This concern is less likely to apply for
the 3-6 year old preschool children we study.
52 Setting and intervention
India has more young children than any other country in the world, with over 160 million
children of age 0 to 6 (MHA, 2012). As per the latest internationally comparable data,
35% of Indian children are stunted and 33% are undernourished (UNESCO/WHO/World
Bank, 2020).7 Data from a very recent national survey suggest that these figures may
have worsened in recent years (MHFW, 2020). Put together, India has the world’s largest
number of malnourished children, which significantly increases their risk of not reaching their
developmental potential (Grantham-McGregor et al., 2007; Lu, Black, and Richter, 2016).
Besides malnutrition, India also faces a severe challenge of low learning levels among
children. For example, a recent survey representative of rural areas showed that 50% of
students in fifth grade could not read at a second grade level (ASER, 2019). The challenges
start early: the same survey found that 43% of first-graders could not recognize letters and 36%
could not recognize one-digit numbers (ASER, 2019). Learning is particularly poor among
public-school students: only 19% of public-school first graders could read words, compared
to 42% of those in private schools (ASER, 2020). This likely reflects the greater number
of first-generation students in public schools. It also highlights the potential importance of
high-quality early childhood interventions to bridge gaps in school readiness and basic skills.
India’s national policy documents have long recognized the importance of early childhood
education. The 86th Amendment to the Indian Constitution in 2002 directed states to “provide
[early childhood education] to all children until they complete the age of 6” (GoI, 2002). The
Right to Education Act of 2009 promoted the free and public provision of education for
children ages 3 to 6 (MLJ, 2009). The National Early Childhood Care and Education Policy
Framework, adopted in 2013, stipulated the broad domains of child development that preschool
education should cover (MWCD, 2013). Finally, the National Education Policy of 2020 aims
that all children ages 3 to 6 should have access to “free, safe, high quality, developmentally
appropriate care and education by 2025” (GoI, 2020).
However, achieving these policy aspirations in practice has been difficult in part due to
constraints in funding and state capacity for implementation (Sinha, 2006; Working Group
for Children Under Six, 2012; Prasad and Sinha, 2015). More generally, India is characterized
by substantial gaps between the aspirations set out in policy documents and the quality of
delivery in practice (see, for instance, Pritchett, 2009). Thus, the key challenge for early
childhood development in India is not so much at the level of policy intentions, but more so
at the level of augmenting capacity for implementation.
7
Children are considered stunted if their height-for-age is 2σ or more below World Health Organization
(WHO) child-growth standards, and undernourished if their weight-for-age is 2σ or more below WHO
standards. They are considered severely stunted or undernourished if these figures are 3σ or more below
WHO standards.
62.1 The Integrated Child Development Services
The Integrated Child Development Services (ICDS) is the main public program through which
the Government of India promotes early childhood development in India. ICDS is the largest
single provider of early childhood health and education services in the world catering to over
36 million children aged 3-6 (UNESCO, 2019). For comparison, the entire Head Start program
in the US (which has been studied much more extensively) had 652,422 funded slots as of 2019,
which is less than 2% of the coverage of the ICDS (NHSA, 2020). ICDS also caters to another
46 million children in the 0-3 age range, through home visitation services and provision of
supplemental nutrition packets.
ICDS provides all of its services through anganwadi centers (AWCs). Each anganwadi
center serves a catchment area of 400-800 people (PEO, 2011), and is typically staffed with one
anganwadi worker (AWW) and one anganwadi helper. The worker is responsible for managing
all services provided at the center, spanning early childhood health, nutrition, preschool
education, and administrative duties, with duties in both the center and in the broader
community. Center-level tasks include early childhood education, overseeing school feeding
programs, and providing nutritional supplements. Community-level duties include conducting
home visits to raise awareness of appropriate nutritional and health practices; monitoring
children’s nutritional status and providing supplemental nutrition packets to undernourished
children; and coordinating with local nurses to organize immunization camps and health
check-ups for children enrolled in AWCs.8 In addition, the workers have a considerable
amount of administrative work and are expected to maintain as many as 14 different paper
registers (PEO, 2011).9 Finally, they are also frequently asked to assist with other government
activities, such as surveying, managing electoral booths, and conducting awareness on public
schemes in their community. Anganwadi workers are typically female, residents of the local
village or urban ward, and between 25 and 35 years of age when hired. Their minimum
qualification is to have passed a secondary school (10th grade) exam (ICDS, 2017).10
The helpers serve as assistants to the workers, and are primarily responsible for cooking
and cleaning. Their duties include picking up children from their homes and taking them
8
The full list of responsibilities of an anganwadi worker is available at: https://bit.ly/2YV73iB. Last
accessed: February 3, 2021.
9
These registers include: family details, supplementary food stock, supplementary food distribution,
preschool education, pregnancy and delivery, home visits planner, referrals, and office stock (daily);
immunization and village health and nutrition day, vitamin A, weight records of children, severe and acute
malnutrition, and tracking of state-specific programs for pregnant and lactating women (monthly). There is
an ongoing effort by both the Government of India and state governments to digitize data collection through
smartphones, but the default remains paper-based record keeping by anganwadi workers.
10
Anganwadi workers receive a monthly honorarium, which is financed by the central and state governments.
On October 1, 2018, the central government raised its contribution from INR 3,000 to INR 4,500 per worker
per month (Accountability Initiative, 2021). States’ top-ups vary widely, from no additional funds (e.g., in
Arunachal Pradesh and Nagaland) to over INR 7,000 (e.g., in Haryana and Madhya Pradesh, MWCD, 2019).
7to the center, cleaning and maintaining the center, teaching children to use the toilet, and
helping them to maintain personal hygiene and cleanliness. Helpers are also responsible for
preparing, cooking, and distributing meals and nutritional supplements at the center and
to eligible households in the catchment area (under the supervision of the worker). Unlike
AWWs, helpers are not subject to formal education requirements beyond the ability to read
and write (GoTN, 2021). In our data, less than 40% of helpers had completed middle school
(grade 8) and only 11% had completed secondary school (grade 10).
Several non-experimental studies have found positive impacts of ICDS on a wide range of
short- and long-term human development outcomes. For instance, Hazarika and Viren (2013)
find that children who attend AWCs during ages 0 to 6 are more likely to enroll in primary
school; Nandi, Behrman, and Laxminarayan (2020) find that children who attend AWCs in
their first three years of life complete more years of schooling; and Ravindran (2020) reports
that children who were born in geographic areas with a higher concentration of AWCs were
less likely to be underweight and had better early numeracy and literacy skills. Further,
nutritional interventions for pregnant women and children below age 6 delivered through
ICDS have been found to not only have a positive impact on primary-school enrollment and
educational attainment (Nandi et al., 2016), but also on graduation from secondary school,
likelihood of higher education or employment, and timing of marriage (Nandi et al., 2018).
Advocates for the ICDS and children’s rights have frequently called for increasing public
spending on the ICDS, including increasing the salaries of existing workers, and hiring an
additional worker (see, e.g., Sinha, 2006; Working Group for Children Under Six, 2012;
Ramachandran, 2020; Sinha, Gupta, and Shriyan, 2021). However, despite considerable
evidence on the positive impacts of ICDS as a whole, there is much less evidence on the impact
of expanding public spending on the ICDS, and on the relative effectiveness of different ways
of doing so.11 Our study aimed to contribute experimental evidence of impact to inform this
debate, with a focus on children of age 3-6.
2.2 The early childhood education (ECE) facilitator intervention
Our study is set in the southern Indian state of Tamil Nadu, which is India’s sixth most
populous state and one of the more developed states in the country, having ranked in the top
third of all states in a national index of human development (IAMR, 2011). It is home to 4.2
million children aged 3 to 6, or 4% of children in this age group nationwide (MHA, 2012).
11
One recent exception is World Bank, 2018a which experimentally studies the impact of adding a creche
(or daycare) facility to AWCs (in the state of Madhya Pradesh) where working mothers could drop off children
under 3. The study found no impacts on either nutrition or education outcomes of children, but found a small
increase in labor-force participation of care givers. Since the program was randomized at the community level,
the non-impact could also reflect the low take up of the program: there was only an 8.2 percentage point
increase in the receipt of early childhood services in treated communities.
8Child-nutrition outcomes are better than national averages, but still concerning by absolute
standards: 27% of children are stunted and 24% are undernourished (MHFW, 2017).
The Government of Tamil Nadu (GoTN) sought our inputs on ideas worth testing to
improve outcomes in the ICDS in a cost-effective and scalable way. Since existing research
on school education in India had shown that learning deficits appear early (especially for
first-generation learners), we identified improving the quality of preschool education as a
promising idea to consider. We also conducted a scoping study on worker time-use in 24 centers
across urban, rural, and tribal districts and found that workers spent only 38 minutes per day
on preschool instruction on average (Ganimian et al., 2018). Further, in surveys conducted
for the diagnostic study, workers frequently mentioned that centers were understaffed relative
to their responsibilities. We therefore proposed to pilot and evaluate the impact of providing
AWCs with an extra staff member to focus on early childhood education.12
The intervention we study provided randomly selected centers the opportunity to hire an
extra early childhood education (ECE) facilitator to focus on preschool instructional tasks.
Facilitators were hired on two-year contracts using a similar set of eligibility criteria to those
used for anganwadi workers, though the minimum age was 18 rather than 25 years. They
were expected to arrive at the center by 9:45am and provide preschool education from 10am
to 12pm. They were expected to work half the hours of workers, and were correspondingly
paid around half their salary (Rs. 4000/month compared to Rs. 8000/month).
GoTN had already developed instructional content for early childhood education as well as
protocols for training workers in implementing this curriculum. This curriculum was designed
in partnership with UNICEF, and reflected global guidelines for early childhood education
expressed in locally contextualized content. GoTN developed manuals for facilitators based
on its materials for AWWs, and provided them with one week of training on implementing this
curriculum. GoTN’s communications to field staff noted that the goal of the program was to
both improve the quantity and quality of instruction (through the dedicated facilitator) and
also to improve child health and nutrition outcomes (through freeing up time of the worker to
focus more on these activities).13 Thus, the intervention did not change the goals of anganwadi
centers, but augmented their capacity to deliver these goals.
The addition of the facilitator could improve outcomes in several ways, including (a)
increasing the likelihood of centers opening on time and reducing the chances of their being
12
Tamil Nadu had in fact implemented a 2-worker model in the ICDS in the 1980s under the Tamil Nadu
Integrated Nutrition Project funded by the World Bank and other donors (see Heaver, 2002). Qualitative
evaluations and interviews suggested that the program was well received at the field level and effective.
However, the second worker was discontinued when donor funding for the project ended. This institutional
memory of having implemented a 2-worker model in the past also contributed to the government’s interest in
a high-quality evaluation of the impact of adding a second worker to the ICDS, and to see if it made sense to
fund a scale up out of their own budget.
13
All control and treatment centers were also provided data on nutritional status of children in the center
based on the independent baseline measurements carried out by the research team.
9closed; (b) increasing preschool instructional time; (c) enabling instruction in smaller groups if
the worker and facilitator teach simultaneously (equivalent to a class-size reduction); and (d)
increasing workers’ time available for health and nutrition related tasks. Our results should
thus be interpreted as the composite effect of the intervention through all of these channels.
3 Research methods
Our design and methods follow a registered pre-analysis plan.14
3.1 Sampling
We randomly sampled four districts across the state, to be representative of a population of
60 million people.15 For ICDS administration, each district is divided into projects comprising
100-150 anganwadi centers, which are in turn divided into sectors comprising 15-30 centers
each (PEO, 2011). We started with the universe of centers in the four sampled districts and
excluded centers with other NGO interventions, those in buildings shared with other centers,
and those with vacancies in both staff positions (worker and helper).16 We then randomly
sampled 320 centers from the remaining universe, stratifying by staffing vacancy, and project.
3.2 Randomization and summary statistics
We randomly assigned centers to the control or treatment groups, stratifying randomization
by district, an indicator for whether a center had a vacant AWW position, and a principal
component of local demographic characteristics.17 We divided our sample into 40 strata
defined by district, vacancy status, and quintiles of the principal component. Within each
stratum, we assigned four centers to the control group and four to the treatment group, for a
total of 160 control and 160 treatment centers.18
14
See https://www.socialscienceregistry.org/trials/1772.
15
Tamil Nadu has a population of 67 million. We excluded the district of Chennai, which is the state capital
and a metropolis of 7 million people. The sample is thus representative of the state, excluding Chennai. District
sampling was stratified by geographic zones and average nutrition status. The four sampled districts were
Kancheepuram, Karur, Trichy, and Virudhunagar.
16
Together, this resulted in dropping 10.8% of centers from the sampling frame.
17
These included population, age distribution, language, occupation distribution, and family income based
on administrative data for each AWC catchment area.
18
This project was carried out as part of an institutional partnership between J-PAL South Asia and
the Government of Tamil Nadu, under which we studied multiple interventions to improve early childhood
education and nutrition outcomes. The three other interventions studied included (a) an unconditional increase
in AWW pay, (b) a performance-based bonus to workers based on improvements in child nutrition, and
(c) a supplemental feeding program. Results from these interventions are reported in a companion paper
(Ganimian, Muralidharan, and Walters, 2020). No center received more than one treatment. Thus, there are
no interactions across treatments, allowing our estimates to be interpreted as effects relative to a “business as
usual” counterfactual (Muralidharan, Romero, and Wüthrich, 2020).
10Table 1 presents summary statistics on centers, workers, and children, and also compares
these baseline characteristics across treatment and control centers. AWCs on average had
15 children enrolled across all ages. Workers on average were around 50 years old, had
over 20 years of experience, and were paid around 8,000 Indian Rupees (INR) per month.
Children attending the centers were 3.5 years old on average. Baseline nutrition levels were
low: 37% of children were severely or moderately underweight with a weight-for-age z-score
(WAZ-score) below -2σ, and 35% were severely or moderately stunted with a height-for-age
z-score (HAZ-score) below -2σ. Consistent with anganwadi centers enrolling children from
relatively disadvantaged families, the fraction of underweight children in our sample is higher
than the state-wide rate of 26% in rural Tamil Nadu (MHFW, 2017).
We find no systematic differences between the treatment and control groups in center
or student characteristics, including on baseline math, language, and executive-function test
scores. By chance, workers in control centers were slightly older and more experienced, but
slightly less likely to have completed secondary schooling. We control for baseline test scores,
randomization stratum fixed effects, and AWW education and experience (to account for the
small imbalances we see at baseline) in our main estimating equations.
3.3 Implementation quality
GoTN implemented the intervention well. Virtually all treatment centers hired an early
childhood education facilitator. In our first process monitoring survey, conducted five months
after GoTN issued the notification to treated centers to hire the facilitator, 98% of centers
had a facilitator (Table A.1). On average, facilitators were 29 years old and had been hired
135 days prior to the survey, confirming that they were hired promptly, within 15-30 days of
the notification being issued. Further, nearly all facilitators (96%) reported having received
the initial 6-day training required by the government.
3.4 Data and attrition
Our core study sample consists of children present in study centers at baseline. Our primary
outcomes of interest are these children’s scores on independent tests of math, language, and
executive-function skills.19 Tests were administered individually by J-PAL enumerators in a
baseline round prior to randomization (September-November 2016) as well as in an endline
round 16 months after program rollout (March-April 2018). The test instruments were
designed to minimize ceiling and floor effects and produce a distribution with broad support.
Baseline test scores are standardized (µ = 0, σ = 1) in the full sample, and endline scores are
19
We measured executive function by assessing children’s inhibitory control, working memory, and cognitive
flexibility. These provide measures of cognitive development that are independent of curricular content.
11standardized relative to the control group distribution. Appendix C provides more details on
test construction, characteristics, and administration.
As per our pre-analysis plan, we also study treatment effects on child nutrition as a
secondary outcome. Our main measures of nutrition are WAZ and HAZ scores. We study
impacts on average WAZ and HAZ as well as on proportions of children with scores below -2σ
and -3σ, which are widely used measures of moderate and severe malnutrition and stunting.
Since measurement of child anthropometric data can be quite sensitive to field protocols,
enumerators received extensive training, and each child was measured twice. Appendix C
provides further details on observation, measurement, and training protocols.
At endline, enumerators visited every center twice within a week to measure outcomes for
as many children as possible. There was no difference in follow-up rates across treatment and
control groups (Table 2, Panel A, col. 1). We also see no differences in composition across
treatment and control groups along student age, gender, baseline test score, or nutrition status,
with all interactions of treatment status and these characteristics being insignificant (Panel B,
col. 1). A joint test of significance across all interactions confirms that there was no differential
attrition between treatment and control groups across observed baseline characteristics.
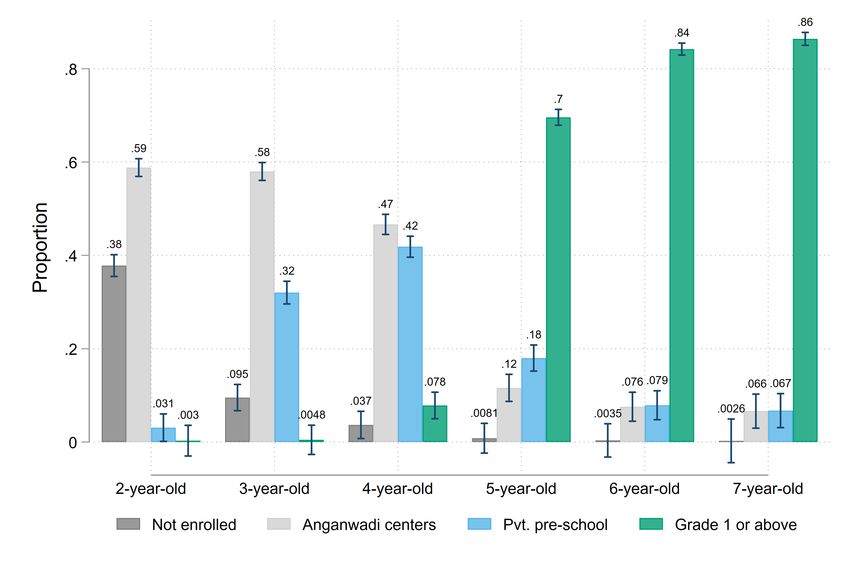
However, the overall follow-up rate in the AWC sample (of children in the baseline) was
only 33%. This likely reflects a combination of children moving out of the anganwadi centers to
private preschools, attending irregularly, migrating, and ageing out of preschool and enrolling
in first grade at age 5, (we see that older children are significantly less likely to be in the AWC
follow-up sample). Data from a different study in the same districts show the age profile
of student attendance, and we see that the proportion of children enrolled in AWCs drops
substantially from age 3 to age 5 (Figure A.1).20 Since there was no differential attrition, we
interpret treatment effects in the AWC sample as representing program effects for children
who stayed enrolled in the centers during the study and were likely to attend regularly.
To estimate intent-to-treat (ITT) effects on the entire baseline sample (including those who
did not stay enrolled in or attend regularly), we supplement the AWC-based measurements
with household-based measurements. Specifically, we drew a representative sample of 50%
of children who were observed in the baseline sample, visited their households, and tested
them there in May-June 2018 (18 months after program rollout).21 There was again no
differential attrition between treatment and control groups overall, or by observable baseline
20
The data used for Figure A.1 is from a different study in the same districts (but from different villages)
that aims to study household choice behavior across preschool options, and therefore collected much more
detailed household survey data on the universe of children in these villages. We thank Mauricio Romero and
Abhijeet Singh for sharing the data for this figure.
21
To ensure sufficient precision for studying effects on malnourished children, we oversampled children
with WAZ scores below -2σ for the household survey. All results that use this sample are re-weighted to be
representative of the full baseline sample.
12characteristics (Table 2, col. 2). However, the followup rate for the household measurements
was much higher, at 89% compared to 33% for the AWC endline.
We also conducted one round of unannounced and announced visits to centers over the
course of the study. The unannounced visits were used to measure attendance, punctuality,
and time use. Enumerators arrived at each center before the official opening time to determine
when the center opened, and when the worker and the facilitator arrived. They then tracked
the amount of time that the worker and facilitator spent on various tasks between 10am-12pm
(the scheduled time for preschool instruction), using an adaptation of the Stallings Observation
System (see Stallings and Mohlman, 1990). We collected data based on these observations in
a random sample of 40 centers per district (20 each in the treatment and control groups), for
a total of 160 centers (50% of the study universe of 320 centers). The announced visits were
used to survey workers and facilitators and to obtain additional details on teaching practices.
3.5 Estimation
We estimate program impacts by comparing mean outcomes for children in treatment and
control centers, controlling for randomization strata and baseline characteristics. The main
estimating equation is:
Yic = αs(c) + Xic0 γ + βTc + εic , (1)
where Yic is an outcome for child i enrolled at center c; s(c) is the randomization stratum of
center c and αs(c) is a stratum fixed effect; Xic is a vector of baseline covariates that includes a
baseline measure of the outcome variable for individual children, the mean baseline outcome
for all children at the center, and AWW education and experience; Tc is an indicator equal
to one if center c is assigned to the treatment group; and εic is an error term. The parameter
of interest is β, which represents the average causal effect of the a center receiving the early
childhood education facilitator intervention.
We estimate equation (1) by ordinary least squares (OLS) regression in the AWC sample.
Regressions for the household sample are weighted to account for differences in sampling
probabilities for the household survey, allowing us to recover effects for the population of
children who took the baseline test. Standard errors are clustered at the center level.
4 Results
4.1 Center openings and staff attendance
The addition of the early childhood education facilitator significantly reduced the likelihood
of centers being closed at the scheduled start of preschool instruction (10am). Based on our
unannounced visits, treated centers were closed only 3.8% of the time compared to 12.5% in
13control centers, which is a 70% reduction (Table 3, Panel A).22 Centers were also around 5
percentage points more likely to be open by the scheduled opening time of 9am (though the
difference is not significant). Overall, the presence of an extra staff member improved center
quality on the extensive margin of the likelihood of centers being open and opening on time.
The addition of the facilitator also reduced the absence of anganwadi workers in treated
centers by 50%, from 20% to 10% (Table 3, Panel B). This may reflect the need for workers
to arrive in time to open the center for the facilitator. Since AWWs are responsible for items
stored in the center (including provisions for feeding children), centers are typically locked with
the AWW having the keys. Consistent with this idea, the absence rate of workers in treated
centers (10%) was similar to that of the facilitators (8.7%), whereas it was significantly higher
in control centers (20%). This complementarity between worker and facilitator attendance
may have contributed to increased worker attendance in treated centers.23
4.2 Time use
Next, we examine impacts on the intensive margin of time use during the two-hour window
of direct observation of classroom activity during the time scheduled for preschool instruction
(10am-12pm). We find that facilitators spent around half this time (57 minutes) on preschool
instruction (Table 4, col. 1). They spent around 20 minutes on administrative work, and
6 minutes on health and nutrition tasks. The remaining 37 minutes were either off-task (27
minutes) or accounted for by absence (10 minutes).24
The intervention also shifted the time allocation of angwanwadi workers in the expected
direction. Worker time spent on preschool education fell roughly in half in treated centers: the
average AWW in the control group spent 38 minutes per day teaching (col. 2), whereas her
treatment counterpart spent only 18 minutes per day (col. 3). However, workers in treated
centers increased time spent on administrative tasks such as completing paperwork (35 v. 22
minutes), and on health and nutrition tasks (11 v. 6 minutes).25 All three differences above
are significant at the 1% level (col. 4). Workers in treated centers increased their time off
duty (uninvolved, out of the center, or engaged in social interactions), but this was offset by a
22
The estimates in column 3 differ slightly from the gap between columns 1 and 2 because column 3 controls
for worker characteristics. These regressions exclude randomization strata controls because the random sample
of visits was not stratified, so some strata include zero visited centers. Note that controls for strata are not
necessary for unbiased treatment effect estimation because the probability of treatment is equal across strata.
23
This finding contrasts with that of Muralidharan and Sundararaman (2013) and Duflo et al. (2015) who
find that adding a contract teacher to schools in India and Kenya reduced attendance of the existing teachers.
24
When a staff member is absent, we code the entire two-hour observation window as absent. A similar
approach is used for partial attendance. So, if a staff member arrived at 10:30am, they would be coded as
absent for the first 30 minutes, and their actual activity would be coded for the remaining 90 minutes of the
observation window. Thus, the full 120-minute observation window is accounted for in the coding.
25
The health and nutrition category captures time spent preparing or serving food, assisting children to
use the toilet, and miscellaneous health-related activities (see Table A.2 for details).
14corresponding reduction in time off task due to absence. This suggests that the presence of the
facilitator may have increased shirking among AWWs while on the job, though the offsetting
decline in time lost to absences led to total AWW time spent on education, administrative
tasks, or health and nutrition tasks being roughly unchanged.26
Despite the reduction in instructional time by AWWs, the intervention led to a large
increase in total time spent on early childhood education. Adding the time spent by both the
worker and facilitator, children in treated centers received 76 minutes per day of preschool
instruction (Table 4, col. 5), effectively doubling the time allotted to education relative to the
control mean of 38 minutes (col. 6 vs. col. 2).27 The intervention also led to a near-tripling of
time spent on health and nutrition related tasks (an increase of 11.3 minutes from a control
mean of 5.7 minutes), and about 2.5 times more time spent on administrative work. Overall,
the addition of the facilitator led to an increase in total staff time spent on all major activities,
including preschool education, health and nutrition, and administrative work (col. 6).
Since the time window we observe was the part of the day scheduled for preschool
instruction, it is unsurprising that the biggest absolute impact on time spent was on preschool
education. However, two additional considerations suggest that total time spent on health
and nutrition activities may have increased more than the impacts we measure in our
two-hour observation window. First, data on self-reported time use from the facilitators
suggests that they spent around 1.5 hours per week on health-related activities (Table B.3),
substantially more than the six minutes per day we see in the observation window. Second, the
administrative work for the AWW did not change due to the intervention. Thus, completing
some of this work during the time scheduled for ECE (as seen in Panel A), while supervising
the instructional work of the facilitator is likely to have freed up AWW time outside the
observation window to focus on nutrition and education related activities.
4.3 Learning outcomes
Consistent with the doubling of total time spent on preschool instruction, the provision of
an early childhood education facilitator produced large test-score gains. Children in treated
centers scored 0.29σ, 0.46σ, and 0.18σ higher in math, language, and executive function on
independent tests administered at the AWC 18 months after baseline, with all results being
significant at the 1% level (Table 5, Panel A, row 1). On a composite measure of learning
26
It is possible that the time we code as workers or facilitators engaging in “social interactions” includes time
spent with parents visiting the center. This could be considered as time spent productively if the interaction
provided parents with inputs and advice on home interactions with children. We are not able to quantify this
since enumerators did not code the identity of who the staff were interacting with.
27
Tables B.1-B.4 display impacts on additional measures of time allocation within each domain. Based
on announced observations, we see that roughly half of the extra preschool instructional time was spent on
“practice and drill” activities, with the rest split between classwork and question and answer time (Table B.4).
15constructed as the first principal component across the three tests, we find that children in
treated centers scored 0.29σ higher (p < 0.01).28
Treatment effects on the household tests were smaller but still significant. As shown in
the second row of Table 5, children in treated centers scored 0.13σ higher in math (p < 0.01),
0.10σ higher in language (p < 0.05), and 0.05σ higher in executive function (not significant)
on household assessments. On the composite measure of learning, children in treated centers
scored 0.11σ higher (p < 0.05).
The difference in treatment effects between the AWC and household assessments most
likely reflects the fact that the household sample includes children who were in the AWC
at baseline, but were not attending at the endline. Figure A.2 examines this possibility by
plotting the age distribution of children in the baseline and in both the AWC and household
follow-up samples. Figure A.2 clearly shows that the household sample includes many more
children over 5, who are likely to have aged out of the AWC (as shown in Figure A.1). Thus,
the lower estimated effects in the household sample likely reflects the inclusion of children
with low program exposure.
We directly examine this hypothesis by reporting treatment effects on the common sample
of children who were present for both the AWC and household endline tests. As shown in Panel
B of Table 5, treatment effects on the household tests in the common sample are considerably
larger than corresponding effects for the full household sample, and we see no meaningful
difference in treatment effects on the AWC and household tests in the common sample (0.32σ
vs. 0.29σ for composite scores).29
Since there is no differential attrition between treatment and control groups in either
sample, we interpret the larger effects found in AWC sample as reflecting the experience of
children who continued to actively attend anganwadi centers during the study, and the smaller
effects in the household sample as reflecting an ITT estimate on children present in the AWC
during the baseline. If we assume that all treatment effects in the household sample accrue
to children in the AWC sample, we can obtain an estimate of the effect of treatment on the
treated (TOT) by dividing the household sample estimate by the share of household sample
0.11σ
children with endline AWC scores. This produces a composite score TOT of 791/2080 = 0.29σ,
an estimate that is very close to the corresponding effects for the common sample and complete
AWC sample (0.29−0.31σ). This is consistent with the assumption that the difference between
household and AWC estimates reflects more intense treatment exposure for the AWC sample,
28
Table B.6 shows that these results are similar for outcomes defined as the proportion of test items answered
correctly rather than standardized scores.
29
As described in Appendix C, the household assessment was shorter and included a subset of items from
the AWC assessment. Table B.7 shows that we also find similar effects on household and AWC assessments
for the common sample when the analysis is limited to the common test items.
16though some children in the household sample who were not captured in the AWC assessments
may have received some benefits from the intervention.30
Finally, we find limited evidence of heterogeneity in treatment effects across achievement
levels or baseline child characteristics. We plot treatment and control composite score
distributions along with quantile treatment effects for the AWC assessments, and see
that the treatment distribution first-order stochastically dominates the control distribution,
suggesting broad-based test-score gains from the program (Figure 1, Panel A). Panel B
plots non-parametric estimates of average treatment effects at each percentile of baseline
composite score, and shows that there were large positive impacts across the full range of
baseline achievement. We also find no evidence of differential effects by baseline nutrition
(weight-for-age z-score), mothers’ education, or AWW vacancy (Table A.4). We find
suggestive evidence of greater effects on girls, but this result may reflect chance variation
as it is not significant in the common sample.
4.4 Nutrition outcomes
Our pre-analysis plan stated that nutrition is a secondary outcome for this study, since the
intervention primarily targeted improving preschool education, and any impacts on nutrition
would be an indirect consequence of freeing up AWW time to focus more on nutrition.
However, consistent with the data on time use showing a near tripling of total time spent
on health and nutrition activities (albeit from a modest base of six minutes per day),31 and
evidence that centers were significantly less likely to be closed, we find significant improvements
in nutrition based on endline measurements at the AWC on both WAZ and HAZ scores.
Table 6 shows that average WAZ scores were 0.10σ higher in the treatment group
(p < 0.01). The nutrition literature has noted that the mapping from WAZ score to long-term
health outcomes may be highly non-linear, with improvements mattering much more for
undernourished children (Hoddinott et al., 2013). We therefore also report effects on the
incidence of moderate and severe malnutrition (WAZ scores below -2 and -3). We find no
significant reduction in the probability that children are moderately underweight, but find a
significant 3.1 percentage point decline in the rate of severe malnutrition (p < 0.05). This
represents a 34% reduction in severe malnutrition relative to the control mean of 9.1%.
As with the test-score results, the impacts on nutrition in the household sample are
in the same direction as the AWC results, but the magnitudes are smaller, and in this
case statistically insignificant. Restricting attention to the common sample of children in
both samples (Panel B), we find broadly similar increases in average WAZ scores in the
30
Similarly, Table A.3 shows that treatment effects in the household assessment are positive and significant
for those who self-report attending the AWC, and insignificant for those who report that they do not attend.
31
As noted in Section 4.2, total staff time spent on health and nutrition tasks could have also increased
further outside the observation window.
17You can also read