CHALLENGES AND PERSPECTIVES OF DEPLOYMENT OF BEVS AND FCEVS - K: Stock Photos(131224) Coal Power Plant.jpg
←
→
Page content transcription
If your browser does not render page correctly, please read the page content below
Generation

                                  Transmission
 Flexibility                                           Buildings
                          Grid
 Storage

                         CHALLENGES AND
                          PERSPECTIVES OF
               K:\Stock Photos(131224)\Coal Power Plant.jpg
                          DEPLOYMENT OF
 Fossils
                          BEVS AND FCEVS                               Carbon
                                                                       Footprint

               Hydrogen                          CO2

Power-to-Gas       Renewables                    CCS               Fuel mix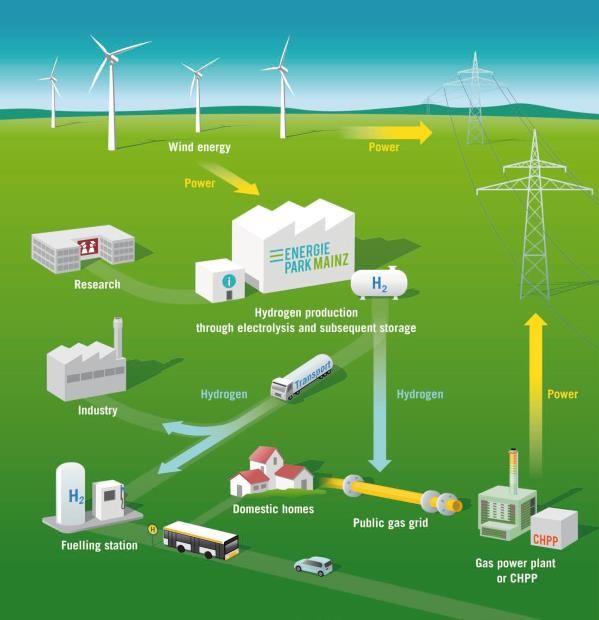
Challenges and Perspectives of
Deployment of BEVs and FCEVs

   This report is available from: https://aperc.ieej.or.jp/
                      February 2020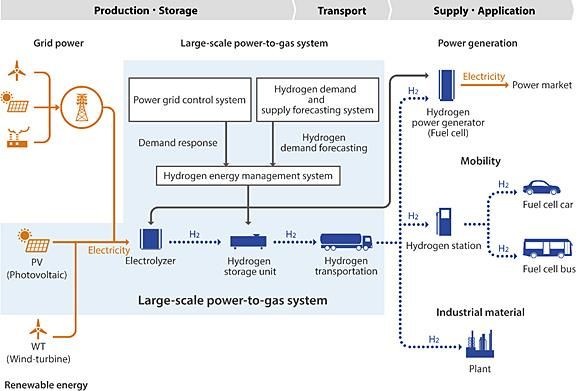
PUBLISHED BY
Asia Pacific Energy Research Centre (APERC)
Institute of Energy Economics, Japan
Inui Building, Kachidoki 11F, 1-13-1 Kachidoki
Chuo-ku, Tokyo 104-0054 Japan
Tel:    (813) 5144-8551
Fax:    (813) 5144-8555
E-mail: master@aperc.ieej.or.jp (administration)
Website:        http://aperc.ieej.or.jp/

©20 Asia Pacific Energy Research Centre

ISBN 978-4-931482-60-9

Contents
Contents ............................................................................................................................................. i
Acknowledgments ........................................................................................................................... iii
Executive Summary .......................................................................................................................... 1
1 Introduction ............................................................................................................................... 3
Current situation of battery electric vehicles in the APEC region .................................................... 3
Policy support for EV deployment in the APEC economies ............................................................... 5
1.2.1 Monetary measures – subsidy and preferential tax treatment .............................................................. 5
1.2.2 Other monetary measures ............................................................................................................................... 6
1.2.3 Non-monetary measures .................................................................................................................................. 7
Current situation and policy development of FCEV in APEC ............................................................ 8
2 Study of BEV impacts on electricity supply and demand ......................................................... 11
Benefits and challenges of vehicle-to-grid (VtG) ............................................................................ 11
2.1.1 Benefits of VtG ............................................................................................................................................... 11
2.1.2 Challenges of vehicle-to-grid ...................................................................................................................... 13
Case study of VtG ................................................................................................................................. 16
2.2.1 University of Delaware: Vehicle to Grid Demonstration Project (US) ................................................. 17
2.2.2 BMW ChargeForward: PG&E Electric Vehicle Smart Charging Pilot (US) ........................................ 17
2.2.3 JUMPSmartMaui (Japan and US) ............................................................................................................... 19
2.2.4 Implications of the case studies ................................................................................................................... 21
Cost/benefit of BEV and VtG/VtH to the consumer ....................................................................... 22
2.3.1 Preconditions and scenarios for the simulation ......................................................................................... 22
2.3.2 Economic Impact of BEV and VtH ................................................................................................................ 25
3 Study of impacts of FCEVs on electricity demand/supply........................................................ 27
Benefits and challenges of power-to-gas (PtG) .............................................................................. 27
3.1.1 Overview of PtG ............................................................................................................................................ 27
3.1.2 Expected benefits of power-to-gas ........................................................................................................... 28
3.1.3 Challenges of power-to-gas ........................................................................................................................ 31
Case study of PtG .................................................................................................................................. 32
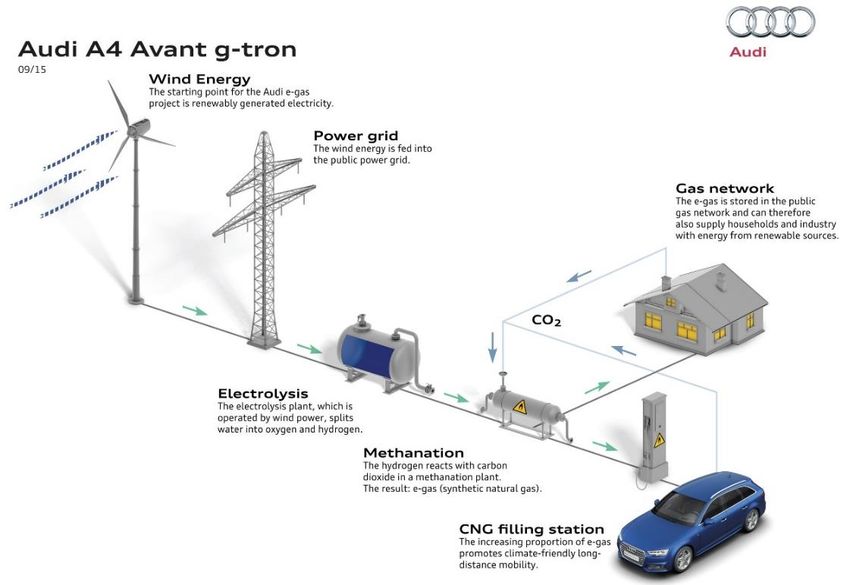
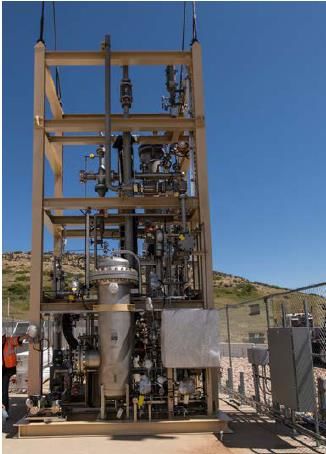
3.2.1 Energie Park Mainz (Germany) .................................................................................................................. 32
3.2.2 Audi e-gas project (Germany) .................................................................................................................... 33
Grid impact, and economics of FCEV and PtG ................................................................................ 34
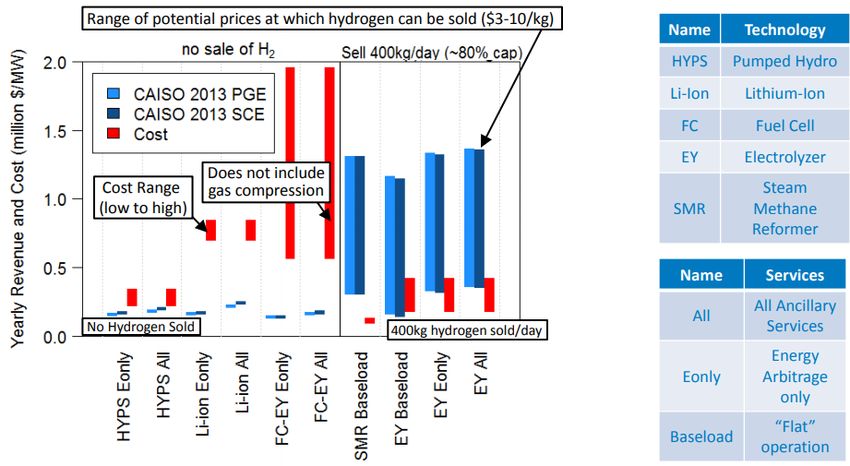
3.3.1 National Renewable Energy Laboratory and Southern California Gas Company (US) ................ 34
3.3.2 FCEV and hydrogen refuelling station ....................................................................................................... 36
3.3.3 Integration of FCEV and the electric power grid: PtG ........................................................................... 36
i
4     Impact of BEV and FCEV on CO2 emissions ............................................................................ 40
              Methodology ........................................................................................................................................... 40
      4.1.1           Estimation of CO2 emission reduction effect from the decarbonisation of LDVs .............................. 40
      4.1.2           Carbon footprint of various low carbon options ..................................................................................... 41
              Preconditions and assumptions............................................................................................................. 41
      4.2.1           LDV stock in the APEC region in 2040 ....................................................................................................... 41
      4.2.2           Assumptions on energy intensity and CO2 emission rate ....................................................................... 43
              Estimation results ..................................................................................................................................... 45
      4.3.1           Marginal CO2 emission reduction effect ................................................................................................... 45
      4.3.2           Carbon footprint of various low carbon options ..................................................................................... 47
5     Comparative analysis of BEV/VtG and FCEV/PtG ................................................................... 49
              Short-term ................................................................................................................................................ 49
      5.1.1           Economics of BEVs and FCEVs ...................................................................................................................... 49
      5.1.2           Grid integration .............................................................................................................................................. 50
              Long term perspective ........................................................................................................................... 50
              Policy implications .................................................................................................................................. 51
References ........................................................................................................................ 53

ii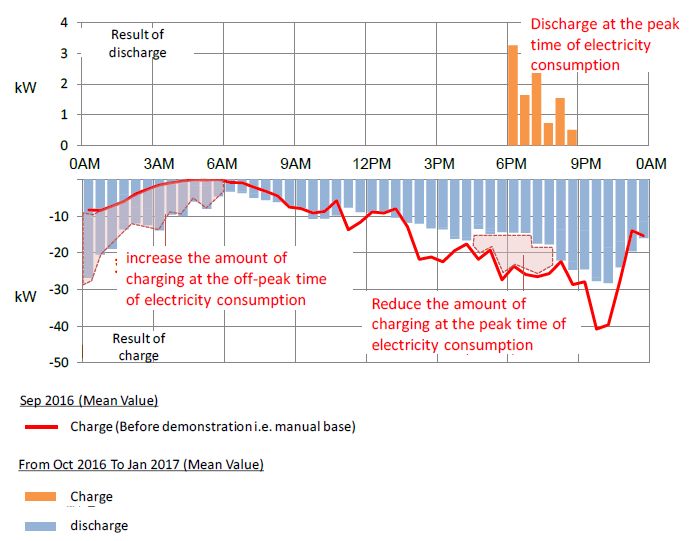
Foreword

Road transport is vital to APEC economies. With the exception of urban centres, the size and complexity
of road networks make it extremely challenging to substitute other forms of transport in a manner that
provides the same level of service and convenience. Road transport accounts for 83% of APEC transport
energy demand. Given the size and extent of this sector, it must play a role in any decarbonisation
effort. Advanced drivetrain technologies such as battery-electric vehicles (BEV’s) and fuel-cell electric
vehicles (FCEV’s) play an important part in decarbonisation. Both technologies have received significant
government support in many APEC economies. The switch to advanced drivetrain technologies offers
many opportunities as well as challenges to integrate these vehicles into our electricity networks
This study seeks to identify the challenges facing these two technologies and potential solutions. When
charging, BEVs can support intermittent renewable energy and provide other grid services such as
frequency keeping. However, they also have a set of unique challenges. Battery storage capacity in
BEVs is a limitation to vehicle mileage, requiring frequent and relatively long recharging time. In most
cases, though these limitations only affect a small portion of a driver’s travel, but this along with
historically high capital costs, has slowed down BEV adoption. At their current technology level, FCEVs
are able to store more energy, allowing for longer mileage than BEV’s but come with their own set of
issues, including the lack of refuelling infrastructure and difficulty sourcing cost-effective and low carbon
fuels.

                                            Dr. Kazutomo IRIE

                                                 President

                             Asia Pacific Energy Research Centre (APERC)

                                             February 2020

iii
Acknowledgments

We appreciate those who have made inputs to this study report, which could not have been accomplished
without the contributions of professionals, in particular those named below.

Project manager
Yoshiaki SHIBATA, Senior Economist, Group Manager, New and Renewable Energy Group, The Institute
of Energy Economics, Japan (IEEJ)
James Michael KENDELL, Senior Vice President, Asia Pacific Energy Research Centre (APERC)

Chapter authors
Sichao KAN (Chapters 2, 3, 4 and 5), Senior Researcher, New and Renewable Energy Group, IEEJ
Tomoko MATSUMOTO (Chapters 1, 2 and 3), Senior Researcher, New and Renewable Energy Group,
IEEJ
Hiroyuki ISHIDA (Chapter 4), Visiting Researcher, New and Renewable Energy Group, IEEJ

Other contributors
Alexey KABALINSKIY (editing), Researcher, APERC
Hugh MARSHALL-TATE (editing), Researcher, APERC
NGUYEN Linh Dan (editing), Researcher, APERC
Rin WATANABE (cover design), Researcher, APERC

iv
Executive Summary
The APEC region is the world’s biggest automobile market both at present and in the foreseeable
future. The way regional transport sector is decarbonised will have significant impact on the global
energy demand and supply balance, greenhouse gas (GHG) emission as well as the automobile
industry. By comparing the current deployment trend, government support, economic competitiveness,
grid impact and integration, and the effect on CO2 emission reductions of battery electric (BEV) and
fuel cell electric vehicles (FCEV), this study attempts to draw insights on the region’s road transport
future decarbonisation.
At present the adoption of BEV is much higher than that of the FCEV. In the APEC region, as of 2017
the BEV stock reached nearly 1.6 million vehicles while FCEV stock was less than 6,000 vehicles, due
to the higher cost of FCEV itself and its associated infrastructure. Both government support and the
automobile OEM’s1 R&D2 are also more focused on BEVs. In the APEC region more than 10 economies
have implemented policies to support BEV adoption and seven economies have announced target
roadmaps for BEV penetration, while only four economies have announced FCEV roadmaps. At
present, only three FCEV models are available in the market, while the consumers have many more
choices for BEVs.
For decarbonisation of the mobility sector, replacement of internal combustion engine vehicles (ICEVs)
with BEV or FCEV using clean hydrogen (hydrogen produced from fossil fuels with Carbon Capture
and Sequestration (CCS) or from water electrolysis using renewable electricity) on top of fuel
economy improvement was found to result in overall CO2 emissions reduction. However, if the
hydrogen is produced from fossil fuel without CCS, the carbon footprint of a FCEV would be much
higher than that of a high efficiency ICEV and BEV, thus replacement of an ICEV with a FCEV would
result in increased CO2 emissions.
When looking at the carbon footprint of a high efficiency ICEV, BEV, and FCEV, in all studied
economies except China, an FCEV using hydrogen produced from renewable energy is less carbon
intensive than high efficiency gasoline ICEV. And in several economies (Indonesia, the Philippines, and
in some cases for Australia and China), where the CO2 emission rate of power generation is high, a
FCEV using renewable hydrogen is less carbon intensive than a BEV.
According to the analysis results (Chapter 4), in Canada, Japan, Korea, and the United States, where
the carbon intensity of power generation is lower than in other economies, a BEV is the cleaner choice
comparing with a gasoline ICEV and FCEV (using renewable hydrogen). However, in the remaining
economies, a gasoline ICEV with improved fuel economy would be more effective in reducing
CO2 emission than a BEV.
BEV and FCEV can both contribute to the grid flexibility (e.g. “power-to-gas” (PtG)), though they
interact with the grid in different ways. Several demonstration projects show that with proper
management of BEV charging/discharging they will provide grid service. However, given the limited
battery capacity of a BEV and the uncertainty associated with BEV’s connection time to the grid,
further scale-up of BEV adoption is necessary for the commercialization of vehicle to grid (VtG). At
the early stage of BEV penetration vehicle to home (VtH) or vehicle to building (VtB) could be the
practical form of BEV grid integration.

1   OEM = Original Equipment Manufacturer
2   R&D = Research and Development

1
The interaction of a FCEV and its associated infrastructure with the grid is made through the Power
to Gas (PtG) system, in which fluctuation of the grid could be balanced by hydrogen production and
power generation by fuel cells. Since capacity of the PtG system is larger and the operation is more
predicable than with a BEV, PtG is more effective in providing grid service than VtG. However,
hydrogen production cost from water electrolysis using renewable power is still high. To further
facilitate the commercialization of PtG, cost reduction and performance improvement of water
electrolyzers, preferable grid service market regulations, as well as expansion of the hydrogen
application market are necessary.
In the longer term, BEV penetration trend is expected to continue (IEA (2018), APERC (2016)). FCEV
adoption will be at a slower pace due to not only the cost reduction of FCEV itself but also on the
build-up and cost reduction of the whole hydrogen supply chain.

2
1 Introduction
Decarbonisation of the transport sector is crucial to reduce CO2 emission because the sector is the
second largest source of CO2 emissions next to electricity and heat generation. The transition to clean
energy in the transport sector is not as prevalent as in other sectors. Petroleum products are the
dominant fuel in road transport, which is likely to persist for the coming decades. Utilising alternative
fuels is vital to reduce CO2 emissions from vehicles and electrification of vehicles will be crucial in this
regard. The shift in road transport toward electric vehicles (EV) has already emerged globally, and
the movement is being rapidly taken up in some economies. This trend will have implications for
electricity demand and supply.
The report asses the effects of battery electric vehicles (BEV) and fuel cell electric vehicles (FCEV) in
terms of impact on the grid and on the decarbonisation. EVs includes BEVs, plug-in hybrid electric
vehicles (PHEV) and FCEVs. BEVs are purely powered by electricity stored in on-board battery
storage and FCEVs convert hydrogen to electricity for propulsion, whereas PHEVs have both an
electric motor and internal combustion engine. PHEVs “use the electric battery as the primary energy
source by relying on battery power for propulsion for a limited range 15 - 40 miles (25 ‐ 65 km)
before switching to internal combustion propulsion.” Thus, PHEV is not studied in this report in that they
still use gasoline.
Chapter 1 provides an overview of current situations and policy development of BEVs and FCEVs in
the APEC region. Chapter 2 explains briefly vehicle-to-grid (VtG), presents a case study of VtG, and
quantitative analysis of BEV/VtH impact on the grid and economic cost/benefit to the consumer.
Chapter 3 looks at the risks and opportunities of power-to-gas (PtG) applications, focusing on the
grid impacts and economics. Chapter 4 evaluates the CO2 emission reduction effect of BEV and FCEV
by quantitative analysis for selected APEC economies. Lastly, Chapter 5 provides comparative
analysis of BEV/VtG/VtH and FCEV/PtG applications.

               Current situation of battery electric vehicles in the APEC
               region
The EV market has grown rapidly, particularly after 2010, although the share of EVs remains small.
Using the data from the International Energy Agency’s latest report Global EV Outlook 2018, this
section shows how many EVs have penetrated into the market in the APEC region.3
Comparing the BEV stock between 2012 and 2017, a substantial increase is observed worldwide
(Figure 1-1). The global stock of BEV has increased from 0.11 million in 2012 to 1.9 million in 2017,
in five years. The share of APEC in global BEV stock expanded from 69% in 2012 to 79% in 2017.
Particularly, China, the United States, and Japan represent three quarters of the world BEV stock.
The growth of the BEV stock is outstanding in China, recording almost a 60-fold increase from five
years ago and as of 2017, has close to the half of the global stock. The United States accounts for
the second largest share with 401,550 BEV in 2017 although the annual growth rate has been slowing
down. Japan follows the two big economies in the APEC region, but a continuously declining growth
rate of BEV sales explains the reduction of Japan’s share from 27% in 2012 to merely 5% in 2017.
While BEV stock is much smaller compared with the three economies mentioned above, some APEC
economies show a high growth rate, implying that BEVs uptake is expected and could be accelerated
in these economies. For example, the average annual growth rate of New Zealand, Canada, and
Korea between 2012 and 2017 is 147%, 95% and 95%, respectively.

3   IEA (2018), Global EV Outlook 2018: Towards cross-modal electrification, Paris: OECD/IEA

3
FIGURE 1-1. BEV STOCK, 2012 AND 2017
2 500 Non-APEC
Australia
2 000 Canada
Chile
1 500 China
1 000 Japan
Korea
500 Mexico
New Zealand
thou.-
Thailand
2010 2011 2012 2013 2014 2015 2016 2017
United States
Source: IEA (2018)
Despite ongoing penetration of BEVs, the share that BEVs occupy in the vehicle market is marginal
(Figure 1-2). In the APEC region, the highest market share is 1.8% in China, followed by 1.1% of
Korea and New Zealand. The market share of these economies has surged for the last few years as
shown in Figure 1-2. The United States and Canada show a gradual BEV market share increase. In
other APEC economies, market share remains below 0.5%.
FIGURE 1-2. BEVS’ MARKET SHARE OF THE APEC ECONOMIES, 2012-2017
2.0% Australia
Canada
1.5% Chile
China
1.0% Japan
Korea
0.5% Mexico
New Zealand
0.0% United States
2010 2011 2012 2013 2014 2015 2016 2017
Source: IEA (2018). Global EV Outlook 2018.
Electric vehicle supply equipment (EVSE) such as charging infrastructure has also been developed
along with BEV uptake. This infrastructure is fundamental to encourage purchase of BEVs. EVSE is
designed to provide alternating current (AC) and direct current (DC), and different power levels
(Level 1, Level 2, and Level 3). 4 In addition, EVSE is differentiated by mode, according to the
communication protocol between a vehicle and a charger.5 EVSE includes private chargers where
vehicles are plugged in on private property, usually at home or work, and public chargers that drivers
could have access to at shopping malls, parking lots and on highways.
Since data on the private chargers are not available, IEA’s data on the publicly accessible chargers
is used to grasp the recent trend of EVSE. Figure 1-3 demonstrates that the public chargers have
steadily increased. Among others, China shows a significant increase of publicly accessible chargers,
accounting for approximately half in the world in 2017. China’s policy direction to strengthen battery
charging networks and infrastructure, which was issued in September 2015, accelerated the
development of charging infrastructure. In addition, constraints on access to private chargers in dense
4Briones, A., Francfort, J., Heitmann, P., Schey, M., Schey, S., and Smart, J. (2012), ‘Vehicle-to-Grid (V2G) Power Flow
Regulations and Building Codes Review by the AVTA,’ Idaho National Laboratory, pp.12-13
5 IEA (2018), op. cit. p.41.
4cities and the high utilization rate of non-private vehicles such as government fleets and taxis were
loosened to make public chargers more available.6 Similarly, relatively more public fast chargers per
EV in Japan tend to help improve accessibility for people who live in multi-family residences in highly
populated regions like the Tokyo Metropolitan area.
FIGURE 1-3. PUBLICLY ACCESSIBLE CHARGERS, 2012-2017
500 000
Non-APEC
400 000 Other APEC
300 000 Korea
Canada
200 000
Japan
100 000
The US
0 China
2012 2013 2014 2015 2016 2017
Note: Other APEC Economies include Australia, Chile, Mexico, and New Zealand.
Source: IEA (2018). Global EV Outlook 2018.
Policy support for EV deployment in the APEC economies
1.2.1 Monetary measures – subsidy and preferential tax treatment
Several policy measures have been implemented to encourage EV deployment in APEC economies.
EVs are acknowledged to perform better in reducing CO2 emissions compared with internal
combustion engine vehicles (ICEVs), but the higher upfront cost is one of factors that prevent consumers
from purchasing an EV. Fiscal measures including subsidy and exemption from tax and other fees are
popular means to make the EVs more affordable.
Both central and provincial governments in China, Japan and Korea provide subsidies for consumers
who purchase EVs7. Furthermore, in China and Korea, government has tightened standards for EV
subsidies in early 2018. China’s new standards that took effect in February 2018 raised the threshold
of EV subsidy eligibility by setting higher technical standards:8 (i) the minimum distance that vehicle
travels on a single charge was extended from 100 km to 150 km, and (ii) the requirement for battery
energy density was increased from 90 watt-hours per kilogram (Wh/kg) to 105 Wh/kg. These more
stringent standards aim to foster research and development and encourage companies to
manufacture vehicles that meet the technological standard in the global market.
In January 2018, Korea revised its subsidy program. Previously, 14 million won (US$12 000) for
every purchased EV was offered until 20179. Under the new system, the subsidy is differentiated by
the vehicle’s battery capacity with a range from 10.17 million won (US$9 000) to 12 million won
6 IEA (2018), op. cit. pp.45-47.
7 In China, BEVs, FCEVs and PHEVs are categorized under new-energy vehicles (NEVs).
In Japan, subsidy is calculated as 1,000 yen (US$9) per kilometer driven on a full charge times a drive range, up to
400,000 yen (US$3,500). (Next Generation Vehicle Promotion Center (in Japanese))
8Bloomberg (2018, February 13, updated on February 14, 2018), ‘China Raises Subsidies to Reward Longer Range Electric
Cars’
9 International Financial Statistics Yearbook 2018 of International Monetary Fund is referred for exchange rates.
5(US$11 000)10. A total of 240 billion won is allocated, enough to subsidize 20 000 vehicles on a first
come, first served basis.
Favourable tax treatment is also available in the APEC region. In the US, a federal tax credit of
US$2 500 to US$7 500 is available for a new EV purchased based on a vehicle size and battery
capacity.11 Some states (Louisiana, Maryland and Utah) provide tax credits, whereas New Jersey
and Washington exempt EV from state sales and use taxes.12 In Japan, EVs qualify for a tax break.
In the US and Canada, financial assistance is provided at the state level. In the US, California,
Connecticut, Delaware, Massachusetts, New York, Pennsylvania, and Texas use rebates to encourage
sales of clean vehicles.13 In Canada, British Columbia has the Clean Energy Vehicles Program that
includes a Point of Sale Incentive Program to make clean energy vehicles more affordable.14 This
program provides point of sale incentives of up to CA$5 000 (US$3 900) (with up to
CA$1 000 additional for FCEV for fuelling) to a qualified purchaser or lessee of an eligible vehicle.
As one motivating incentive for clean vehicles, Hong Kong, China and British Columbia (Canada) have
programs that offer the financial incentives to promote replacement of higher polluting or less efficient
vehicles with EVs. The One-for-One Replacement Scheme in Hong Kong, China allows private vehicle
owners who arrange to scrap and de-register their old private ICEV or EV and then register a new
EV to receive a registration tax concession up to HK$250 000 (US$32 000).15 Similarly, the BC
Scrap-It program in British Columbia (Canada) sets out a list of incentives for vehicle owners who
scrap an aging fossil-fuel powered vehicle in favour of cleaner forms of transportation. The list ranges
from incentives of CA$6 000 (US$4 600) for a new EV and CA$3 000 for a used EV to a discount
on a new electric bike (CA$850 off) and a mobility scooter (CA$600 off) and a CA$750 car share
credit.16
1.2.2 Other monetary measures
There are other types of financial measures. In New Zealand, light electric vehicles are exempt from
Road User Charges, which will save an average EV driver about NZ$600 (US$430) per vehicle
annually.17 In some major cities of China, preferential treatment is given to EV owners in getting a
license plate, which is strictly controlled by local authorities. For instance, in Beijing, 60 000 out of
100 000 new car license plates issued every year are reserved for EVs.18 Starting from 2018, the
annual car license plate quota is reduced from 150 000 to 100 000, while keeping the EV quota at
60 000. This restriction makes allotment of license plates for ICEVs less available, which will result in
taking years for an ICEV driver to get a license plate. Similarly, Shanghai, where license plates are
10 Korea Bizwire (2018, January 17), ‘Electric Car Subsidies Subject to New Standards’
11Tesla and General Motors hit 200,000 total electric vehicles sold in the U.S. in 2018, reaching a threshold that triggers
a phase-out of a federal tax credit in 2019.
12 American Council for an Energy-Efficient Economy, ‘Incentives for High-Efficiency Vehicles’
13 Ibid.
14 Clean Energy Vehicles for British Columbia, https://www.cevforbc.ca/clean-energy-vehicle-program
15 Hong Kong, China, Environmental Protection Department, ‘Promotion of Electric Vehicles in Hong Kong’
16 The BC Scrap-It Program, https://scrapit.ca/incentivechoices/
17 New Zealand Ministry of Transport, ‘Electric Vehicles,’ https://www.transport.govt.nz/multi-
modal/climatechange/electric-vehicles/, this exemption is effective until 31 December 2021.
18 China Daily (2017, December 15), ‘Beijing limits new car plates, boosts new energy vehicles’
6auctioned online to the public, waives license plate fees for EV drivers. This is quite attractive for
drivers since a license plate costs more than US$14 00019.
1.2.3 Non-monetary measures
Non-monetary incentives are also available in some APEC economies. In many states of the US, EVs
are allowed to use high occupancy vehicle (HOV) lanes.20 Parking is free for EVs in US cities such as
Honolulu, Cincinnati, and San Jose. In some cities of China, EVs are free from traffic control measures
that limit the number of vehicles on the road, for instance, based on license plate numbers. 21
Singapore where the number of vehicles is successfully controlled by the government demonstrates a
unique case of EV promotion. In December 2017, a nationwide EV car-sharing program was launched
under an agreement between the Land Transport Authority and the Economic Development Board,
and BlueSG Pte Ltd, a subsidiary of Bolloré Group.22 This program aims to deploy 1 000 EVs and
2 000 charging stations by 2020 and expects that these charging points will be the foundation for
the economy’s future EV charging infrastructure.
For China, encouraging EVs has an aspect of industrial policy as well as environmental policy. China
puts priority on new energy vehicles (NEVs) to strengthen the domestic automaker and battery
industry and make it competitive in the global market as well as to reduce CO2 emissions.23 For this
purpose, China announced the NEV mandate policy, also known as the dual-credit policy, in
September 2017 and it took effect in April 2018. Auto manufacturers are required to meet corporate
average fuel consumption (CAFC) and NEV credit targets. The mandatory requirements on NEV
credits are 10% of the conventional passenger vehicle market in 2019 and 12% in 2020, which have
to be achieved by producing or importing NEVs or by purchasing of NEV credits from other
manufactures. The minimum range for NEV credit qualification is set for BEVs, PHEVs, and FCEVs, and
the number of NEV credits is specified based on driving range and vehicle curb weight.
Not only policy support given to drivers/consumers but also some measures to help producers are
also important to boost EV deployment. Public procurement of EVs is widely adopted at the local
level in APEC economies. Government procurement provides an opportunity to present the public with
the benefits of shifting to EVs and to encourage auto industry EV production and infrastructure
development. Also, funding for research and development (R&D) is necessary to advance technology
and bring down costs of EVs. Specially, the cost of batteries is key to becoming competitive with
ICEVs. Lastly, the target to be set is critical to expand EV deployment because a specified objective
sends a clear message to the related stakeholders about the market. Table 1-1 shows the national
target of EV deployment of APEC economies.
19 The Journal Gazette (2018, May 27), ‘In China, electric cars rising in popularity’
20 This incentive will expire on September 30, 2019 in some states such as Florida and North Carolina.
21 Lu, J. (2018, February 28), ‘Comparing U.S. and Chinese Electric Vehicle Policies,’ Environmental and Energy Study
Institute
22Economic Development Board(2016, June 30), ‘Singapore launches Nationwide Electric Vehicle Car-Sharing Programme’
and BlueSG (2017, December 12), ‘BlueSG Launches Singapore’s First Large-Scale Electric Vehicle Car-Sharing Programme
Developed by the Bolloré Group’
23In June 2018, the National Development and Reform Commission and China Construction Bank announced a new
$47 billion fund for high-tech industries including EVs. (The Wall Street Journal (2018, July 20), ‘China Bets Big on Electric
Cars’)
7TABLE 1-1. NATIONAL TARGET OF EV DEPLOYMENT OF APEC ECONOMIES
Economy Target Policy/Plan
- NEV sales: 2 million (2020)
Automobile Industry Mid- and Long-term
China - 20% or more NEV share of
Development Plan (2017)
35 million vehicle sales by 2025
- EV stock: 2 200 (2025) and
4.2 million (2050)24
Indonesia The Electric Vehicle Program
- Electric Motorcycles: 2.13 million
(2025) and 13.3 million (2050)
- EV and PHEV stock: up to
Roadmap for EVs and PHEVs toward the
1 million (2020)
Japan Dissemination of Electric Vehicles and Plug-in
- EV market share 20% - 30%
Hybrid Vehicles (2016)
(2030)
2.2 million eco-friendly vehicles The Mid-term Strategies and Roadmap for Eco-
Korea (10% of registered motor vehicles) friendly Motor Vehicle Distribution (2014-
by 2020 2020)
Malaysia EV stock: 100 000 (2030) National Electric Mobility Blueprint
New
EV stock: 64 000 (2021)25
Zealand
Thailand EV stock: 1.2 million (2036) Energy Efficiency Plan 2015-2036
Source: The Institute Energy Economics Japan
Current situation and policy development of FCEV in APEC
As of 2017, the global FCEV stock was 7 200 units, which is far less than BEV.26 By economy, the US
leads the market with 3 500 FCEVs, followed by Japan at 2 300. There are 330 hydrogen refuelling
stations in operation worldwide.
FCEVs are supported by some APEC economies due to their potential to support low-carbon mobility.
Support mechanisms include: research and development support, fiscal measures and deployment
targets. The United States has put substantial efforts into hydrogen and fuel cell research
development and demonstration (RD&D) since the early 2000s. The Department of Energy (DOE) Fuel
Cell Technologies Office has led RD&D and innovation for transportation and diverse applications
utilizing hydrogen and fuel cells.27 “The Department of Energy Hydrogen and Fuel Cells Program
Plan” was initiated in 2011 to conduct “comprehensive efforts to overcome the technological,
economic, and institutional barriers to the widespread commercialization of hydrogen and fuel
cells.”28 Currently, DOE has been working on an H2@Scale which is an initiative to enable low cost
and large scale production and apply hydrogen across various sectors by utilizing variable
renewable energy, nuclear and fossil fuels to avoid curtailment or stranded assets.29
24Sommeng, A. N. and Anditya, C. (2018, September 6-8), ‘Boosting RE Power Generation in Indonesia Electricity Sector –
A Policy Action by the Government,’ presented at the 3rd International-Tropical Renewable Energy Conference (i-TREC)
2018 in Bali.
25 New Zealand Ministry of Transport, op. cit.
26 IEA (2018), op. cit., p.20
27International Partnership for Hydrogen and Fuel Cells in the Economy (IPHE), ‘IPHE Country Update: May 2018 – United
States’
28 U.S. Department of Energy (2011), ‘The Department of Energy Hydrogen and Fuel Cells Program Plan,’ p.6.
29 IPHE, op. cit.
8The United States has not set a national target on the number of FCEVs but some state governments have implemented regulations that specify a requirement for FCEVs production like California’s Zero Emission Vehicle (ZEV) Regulation. In California, manufacturers are required to produce a number of ZEVs in terms of percent credits of sales, ranging from 4.5% in 2018 to 22% in 2025. There are other nine states that have adopted California’s ZEV regulations.30 Aiming for realization of a hydrogen society, Japan has established two fundamental policy frameworks. First, the “Strategic Roadmap for Hydrogen and Fuel Cells” was approved in 2014 and revised in 2016. This roadmap laid out how Japan would be able to make use of hydrogen in three phases: significant expansion in hydrogen use in Phase 1, introduction of hydrogen power generation and establishment of large-scale hydrogen supply systems by the late 2020s in Phase 2, and establishment of a zero-carbon emission hydrogen supply system by the 2040s in Phase 3. The revised roadmap includes a specified target for FCEV deployment of 40 000 by 2020, 200 000 by 2025, and 800 000 by 2030. 31 Also, the target for the construction of hydrogen stations is set at 160 stations by 2020 and 320 stations by 2025. Second, in December 2017, Japan published a “Basic Hydrogen Strategy” which presents a policy direction for all government agencies to follow and regards hydrogen as a new carbon-free energy option, in tandem with the roadmap for introduction and deployment of hydrogen and fuel cell technologies. China and Korea also have strengthened government support for the development of the FCEVs and infrastructure. Both economies encouraged cooperation between central and local governments, and private companies like automakers in order to become competitive globally. In China, as one of NEVs, FCEV deployment is strongly supported by government. As of May 2018, there were approximately 710 FCEVs (60 vehicles, 150 buses, and 500 trucks) in China.32 China stated in the 13th Five-Year Plan that the economy will promote R&D of fuel cells, build more hydrogen stations, and achieve mass production of FCEVs by 2020. China published the Energy Saving and New Energy Vehicle Technology Roadmap in October 2016 and its Chapter 4 is the Hydrogen Fuel Cell Vehicle Technology Roadmap.33 In this roadmap, China sets the target for FCEV deployment at 5 000 by 2020, 50 000 by 2025, and one million by 2030. In February 2018, the “National Alliance of Hydrogen and Fuel Cell” was officially established, which is an interdisciplinary, cross-industry, interagency national alliance to help China’s hydrogen and fuel cell technologies to achieve market maturity and international competitiveness. Korea has also actively pursued building clean energy vehicles and creating business opportunities for local manufacturing industries. In April 2018, Korea’s government and leading companies agreed to establish a network of 310 hydrogen filling stations nationwide by 2022.34 Furthermore, in January 2019, Korea announced a hydrogen economy roadmap.35 According to the roadmap, the number of FCEVs produced in the economy will reach 80 000 by 2022, 1.8 million in 2030 and 6.2 million in 2040. The roadmap also called for 1 200 hydrogen filling stations across the county by 2040. The 30California Air Resources Board (2018), ‘The Zero Emission Vehicle (ZEV) Regulation Fact Sheet’. Nine states are Connecticut, Maine, Maryland, Massachusetts, New York, New Jersey, Oregon, Rhode Island, and Vermont. Pennsylvania, Washington and Delaware have adopted California’s Low Emission Vehicle standards. 31 Japan Ministry of Economy, Trade and Industry of Japan (2016, March 22), ‘Compilation of the Revised Version of the Strategic Roadmap for Hydrogen and Fuel Cells’ 32 IPHE, ‘IPHE Country Update: May 2018 – China’ 33 Strategy Advisory Committee of the Technology Roadmap for Energy Saving and New Energy Vehicles and the Society of Automotive Engineers of China (2016), Hydrogen Fuel Cell Vehicle Technology Roadmap (English version) 34 electrive.com (2018, April 25), ‘Korea: public-private hydrogen station network’ 35 The Korea Herald (2019, January 17), ‘Korea to produce 6.2 million hydrogen cars by 2040’ 9
government will provide subsidies for fuel cell electric taxis and trucks, work with local governments
to increase the number of fuel cell electric buses to 2 000 by 2022, and plans to start replacing all
820 police buses with fuel cell electric buses in 2021. Subsidies are expected to enhance production
capacity and reduce costs by about a half to about 30 million won (US$27 000) by 2025.
Australia has designated hydrogen as an opportunity to develop an industry and export hydrogen
to the global market, using the economy’s extensive natural resources such as fossil fuels, solar and
wind. In August 2018, Commonwealth Scientific and Industrial Research Organisation (CSIRO)
published a “National Hydrogen Roadmap” to provide a blueprint of the development of a hydrogen
industry. 36 A series of strategic investments along the value chain is needed to overcome major
barriers to market activation, which are a lack of infrastructure and the cost of hydrogen supply. This
roadmap identifies key priorities and areas for investment needed to make hydrogen commercially
competitive with alternative technologies in each targeted application of hydrogen production,
storage, transport, and utilisation.
Other APEC economies have also given consideration to application of hydrogen recently. For
instance, in Malaysia, in July 2018, the Sarawak Energy Bhd (SEB) announced plans to build a pilot
hydrogen production plant and refuelling station project to assess the viability of hydrogen and fuel
cells in the transport sector.37 The refuelling station will be the first in South East Asia. SEB was tasked
by the state government to spearhead research in hydrogen fuel cell applications in 2017.38 SEB will
invest 15 million ringgit (approx. US$3.5 million) to produce 130 kg of hydrogen per day. The state
authorities have ordered three hydrogen-powered buses from China. Sarawak plans to roll out these
hydrogen buses in the state capital later this year.
In Indonesia, the Agency for the Assessment and Application of Technology (Badan Pengkajian dan
Penerapan Teknologi, BPPT) and Toshiba Energy Systems and Solutions Corporation (Toshiba ESS), a
leading supplier of integrated energy solutions of Japan signed a memorandum of understanding
(MOU) in August 2018 on the promotion of autonomous hydrogen energy supply systems.39 The off-
grid integrated energy system uses “a renewable energy source to electrolyses hydrogen from water,
and stores and uses the hydrogen in fuel cells to provide stable delivery of CO 2-free,
environmentally-friendly electricity and hot water.” Distributed energy resource system enhances the
stability of energy supply and provides clean energy for isolated islands, mainly dependant on diesel.
The number of EVs and FCEVs in road transport is expanding. However, as shares increase challenges
and opportunities arise. For EV these include the feasibility of integrating them into the grid and
utilizing a vehicle on-board battery as energy storage. Automakers, utilities, and IT companies are
developing business models that will facilitate smooth EV integration into the grid. Cost-effective and
low-carbon production of (green) hydrogen from renewables remains a challenge for FCEV. The
following chapters explore BEV and FCEV impacts on CO2 emissions and grid.

36Bruce, S., Temminghoff, M., Hayward, J., Schmidt, E., Munnings, C., Palfreyman, D., Hartley, P. (2018), National Hydrogen
Roadmap, CSIRO, Australia
37 Sarawak Energy (2018, July 29), ‘Sarawak Energy Pilots Hydrogen Production Plant & Refueling Station for
Transportation Sector’
38Sarawak Energy (2017, November 7), ‘The Chief Minister of Sarawak’s Media Statement on today’s press conference
on Hydrogen & Fuel Cell Research and press release’
39Toshiba Energy Systems & Solutions Corporation (2018, August 31), ‘Toshiba and BPPT Conclude Memorandum of
Understanding on the Promotion of Autonomous Hydrogen Energy Supply Systems in Indonesia’

10
2 Study of BEV impacts on electricity supply and demand
This chapter examines how and to what extent BEVs would affect electricity demand and supply. To
cope with the rapid growth of BEV deployment, management of battery charging is vital to balance
the power market. The first part lays out the relationship between BEVs and electricity
demand/supply, focusing on the benefits and hurdles of applying vehicle-to-grid (VtG) systems. Then,
some pilot projects are examined to understand VtG application and its impacts on the electrical grid.
Lastly, BEV and VtG/VtH impact on the grid’s the economic cost/benefit to the consumer are
examined in detail by quantitative simulation.

                 Benefits and challenges of vehicle-to-grid (VtG)
            2.1.1 Benefits of VtG
VtG is a system that enables bidirectional electricity flow between a vehicle and the grid and controls
recharging and discharging of a vehicle battery when needed. VtG can be a useful tool when many
vehicles are aggregated and operated properly, although each EV’s power is very small. In VtG,
each vehicle is connected to the grid and the system operator controls charging and discharging of
the vehicle battery to balance the market. The aggregator service provider manages groups of
vehicles to provide services to the electric utilities or system operators.
EV adoption contributes both to reduction in CO2 emissions in many economy’s and dependence on
the petroleum products. Yet, that is not the only reason to incorporate VtG. It can also have significant
benefits for both sides of electricity supply and demand. The benefits the VtG offer to the grid are
described below.
                      Role as distributed energy resource
A major role anticipated for VtG is to function as a distributed energy resource or energy storage,
which is especially critical as variable renewable energy such as solar and wind has increased in
power generation. Because of their intermittent and unpredictable nature, these variable renewables
have raised concerns about the impacts on the electrical grid. System operators and utilities look for
flexible energy resources to reduce the uncertainty and variability of renewables to maintain grid
stability. In general, EVs are parked most of the time and can be plugged into the power grid when
they are not operated. The parked EVs enable the batteries of the vehicles to work as energy storage
since they absorb surplus energy for the period of high power generation relative to low demand or
release power back to the grid during the time when power generation is not enough to meet demand.
Consequently, curtailment of intermittent renewable generation is lessened by using EV batteries. This
function will be even more effective if batteries with bigger capacity are involved.
                     Shifting the load
VtG helps the load shift or load curve flatten through demand response/re-allocation. The time of
peak demand for charging can be deferred from the evening hours to lower demand periods like
midnight if the time of charging is controlled. Charging behaviour is likely to vary with lifestyle (for
instance, whether or not, how often, and how far a vehicle is used to go to work or school), and
with/without a time-of-use rate plan.
Many vehicle owners charge their vehicles when they arrive home from work either immediately
during peak load hours or overnight during off-peak hours.40 This indicates that the charging occurs
at 18:00 – 6:00 in most cases. If numerous vehicle owners start to charge their vehicles at the same
time upon arriving home in the evening more investment in distribution will be required to manage

40   Briones et al. (2012). op. cit., pp.23-24

11
the larger peak demand. Meanwhile, if overnight charging is used, the night-time load increases,
which improves the average capacity factor of power system.
Figure 2-1 shows differences in charging patterns of consumers with/without time-of-use rate plans
during summer weekdays. Power demand in the blue bar is indicated as RES (without time-of-use
rate) increases significantly in the evening and peak at 9 pm. By comparison, power demand in the
red bar shown as TOU (with time-of-use rate) is relatively low during the peak period coloured in
grey and goes up substantially after the peak period because off-peak charging is cheaper. Where
no time-based rates are available, the investment require to maintain a stable and reliable power
supply may be high if excessive charging occurs during the peak period from the early evening to
the late night. Since the time of charging is supervised through the VtG system, peak charging demand
can be mitigated.
FIGURE 2-1. CHARGING PATTERNS DURING SUMMER WEEKDAYS AT PROGRESS ENERGY
Note: TOU - consumers with Whole House Time-of-Use Rate, and RES – other consumers. Peak periods are shown in grey.
Source: U.S. Department of Energy (2014)41
Provision of ancillary services
VtG can provide ancillary services that support the transmission and distribution systems such as
frequency regulation and “spinning reserve” 42 frequency regulation immediately fine-tunes the
balance of supply and demand within a short time frame (4 - 10 seconds).43 A VtG system can
influence the frequency in response to requests by the grid operators by regulating “up” or “down”
by respectively exporting to or drawing power from the grid. Another related type of ancillary
service is “spinning reserves” where VtG provides fast-response generating capacity on request from
the system operator.44
Enhancement of power supply security
Improvement of power supply security is also a benefit that VtG could add. Working as distributed
energy resources, VtG could be useful in case of an emergency such as a power failure. The US
Department of Defence, for instance, finds national security advantages of microgrids or ancillary
services through VtG in military bases to reduce vulnerability in the event of power outage or act of
41U.S. Department of Energy(2014), ‘Evaluating Electric Vehicle Charging Impacts and Customer Charging Behaviors –
Experiences from Six Smart Grid Investment Grand Project. Smart Grid Investment Grant Program’, p.11
42 North American Electric Reliability Corporation (2012), ‘Glossary of Terms Used in NERC Reliability Standards’
43 Briones et al. (2012), op. cit., p.7.
44 The U.S. Energy Information Administration (EIA), ‘Glossary – Electricity’
12terrorism.45 Independence of power infrastructure is vital for resilience in that the localized systems
can be isolated from damage caused by problems on the grids.
Financial benefits
Last but not least, VtG has financial merits for both utility companies and consumers. Utilities could cut
capital spending to build new power plants or upgrade existing infrastructure, which is necessary to
cope with increasing electricity demand otherwise, because of the possible benefits of VtG mentioned
above. Meanwhile, vehicle owners will receive revenues by selling power or providing ancillary
services to the grid and benefit from fuel cost savings. A study that assessed the costs and benefits
of EV adoption under California’s Zero Emission Vehicle Program found that utility customers are
better off from increasing EVs because there are positive net benefits to the utility, part or most of
which can be shared with customers as reduced electricity tariffs.46
2.1.2 Challenges of vehicle-to-grid
While many potential advantages have been identified in VtG, it will not necessarily be easy to
commercialize this new system with advanced technology on a large-scale because of the financial,
technical, and administrative problems to overcome. This section raises major challenges for
deployment of VtG. Specifically, barriers for infrastructure development, issues related to
involvement of various stakeholders, technology development, and regulatory framework are
described below to explain why VtG is not easy to apply.
Infrastructure development
Development of electric vehicle supply equipment (EVSE) is indispensable as more EVs enter the
market. Especially, installation of public charging stations at appropriate places and intervals is
essential to extend driving range. However, costs associated with EVSE can be an impediment to set
up an EVSE at home or to increase the number of public chargers at non-residential locations.47
Three types of EVSE are typically used, that is, AC Level 1, AC Level 2, and DC Fast Charging,
depending on supply power and charging time (Table 2-1). Among them, there are a wide range of
costs associated with EVSE development, which can be affected by factors such as EVSE unit features
and site locations. 48 These costs include charging station hardware costs, installation costs, and
operation and maintenance costs and differ among types of EVSE. Charging station hardware is the
dominant cost of a home charger, whereas installation costs have more impact on the cost of public
charging stations.49 Table 2-1 from a study by Smith and Castellano (2015) presents approximate
cost ranges for EVSE units and installation, and reveals that installation costs are highly variable.50
Installation costs include changeable factors such as labour costs and necessary materials and lead
to great variability. Furthermore, VtG applications that require additional special features are likely
to add extra costs in order to enable interaction between vehicles and the grid. As to VtG
45 Briones et al. (2012), op. cit., p.11.
46Ryan, N. E. and Lavin, L. (May 2015), ‘Engaging Utilities and Regulators on Transportation Electrification,’ The Electricity
Journal, Vol.28, Issue 4, pp. 78-91.
47Most EV suppliers provide an AC Level 1 cord set with the vehicle but those who wish to have AC Level 2 speed or other
features will have to pay extra.
48 Parking garage installations are the easiest and most economical public charging stations. In comparison, curbside and
surface lot stations tend to be more expensive than parking garage installations because they require trenching or
directional boring to run conduit and wire to the station occasionally. (Rocky Mountain Institute (2014, April 29), ‘Pulling
Back the Veil on EV Charging Station Costs’)
49 Rocky Mountain Institute (2014), Ibid.
50 Smith, M. and Castellano, J. (2015), ‘Costs Associated With Non-Residential Electric Vehicle Supply Equipment - Factors
to consider in the implementation of electric vehicle charging stations,’ prepared by New West Technologies, LLC for the
U.S. Department of Energy Vehicle Technologies Office, p.30
13applicability, however, an AC Level 1 is not suitable. While it is equipped with the basic functions, its
low supply power and lack of control or monitoring capabilities make it impractical to operate VtG.51
TABLE 2-1. EVSE COMPARISON BY CHARGING LEVEL
EVSE unit* Average Installation
Charging Vehicle range added per cost range installation cost range
Power supply
level charging time and power (single cost (per (per unit),
point), US$ unit), US$ US$
miles
4 @ 1.4 kW 120 VAC/20A
hour 300 -
AC level 1 (12-16 A N/A 0 - 3,000**
miles
6 hour @ 1.9 kW 1 500
continuous)
miles
10 @ 3.4 kW 208/240 VAC /
hour
miles 20 - 100 A 400 - 600 -
AC level 2 20 hour @ 6.6 kW 3 000
(16 - 80 A 6 500 12 700
miles
60 hour @ 19.2 kW continuous)
208/480 VAC 3-
miles
24 20 minutes
@ 24 kW phase
DC fast miles (input current 10 000 - 4 000 -
50 @ 50 kW 21 000
charging 20 minutes proportional to 40 000 51 000
miles
90 @ 90 kW output power;
20 minutes
~20 - 400 A AC)
Note: *EVSE unit costs are based on units commercially available in 2015.
**The $0 installation cost assumes the site host offers an outlet for EV users to plug in their Level 1 EVSE cordsets and that
the outlet already has a dedicated circuit.
Source: Smith and Castellano (2015). p.7, p.30
The governments of APEC economies have taken measures such as national targets and financial
incentives to promote EVSE installations. For instance, China and Korea set a clear target for EVSE
deployment. China aims to have 4.3 million private EVSE outlets and 500 000 public accessible
chargers by 2020.52 Korea plans to increase the number of EV fast-charging stations to 10 000 by
2022, a nearly four-fold increase from 2 531 in 2017,53 which is comparable to the number of the
economy's gasoline refuelling stations of 12 000.54 In the US, various financial incentives are offered
by the state governments to reduce the installation cost of EVSE.55 In addition to the current measure
to provide a subsidy for EVSE installation, Japan is considering relaxing regulations with an aim of
revitalizing retailors’ business and promoting vehicles running on alternate fuels. Small gas stations
may be allowed to set up charging terminals alongside a gas pump, which are currently required to
be about 10 meters apart, in fiscal year 2019 when the government intends to revise the
regulations.56
51 Briones et al. (2012), op. cit., pp.13-15.
52 IEA (2018), op. cit., p.47.
53 IEA (2018), op. cit., p.117.
54 Yonhap News (2018, February 2), ‘S. Korea to invest 35 tln won in future vehicles in next 5 years’
55 National Conference of State Legislatures (2017), ‘State Efforts To Promote Hybrid and Electric Vehicles’
56 Nikkei Asian Review (2018, February 21), ‘Japan paves way for gas stations to charge up electric cars’
14Technology advancement
Further technology advancement is needed to prove the usefulness of VtG operation. Among others,
a vehicle battery is an important factor because it significantly influences the performance of EVs as
well as VtG application. Improved battery performance such as extended range and longer battery
life will enhance public acceptance of EVs. When it comes to VtG, however, consumers may be
concerned about possibility of battery degradation if they participate in the VtG program. 57
Technology development to improve the capacity and cycle life of the battery is expected not only
to facilitate penetration of EVs but also to help enable VtG application.
Equally, key technologies to be advanced are specific operating systems, equipment and devices for
VtG to control and monitor EVs, EVSE, and the grid, and to enable communications between them.
These technologies will allow the connected entities to be managed effectively. The vehicles need to
be equipped with battery-management software and hardware for two-way flow of electricity,
communication device between vehicles and distribution system operators, and EVSEs connecting
vehicles to grid.58 With VtG technology, the distribution system operators are able to program when
and how long to recharge and simultaneously manage control of many vehicles while balancing
electricity flow. In addition, advanced metering infrastructure (AMI) and sensing technologies are
important for real-time energy management and to ensure grid quality and reliability, when the EVs
are integrated into the grid.59
As much as the importance of technology development is recognized, cyber security has to be
considered as well. Along with technology improvement, enhanced connectivity under the VtG
program implies that power plants, the grid, EVSE, EVs, homes/workplaces are likely to be exposed
to cyberattacks. The network of two-way flow of electricity is constantly monitored and controlled to
optimize VtG operation through the use of data collected. The interactive network where monitoring
and control of many devices are distributed will heighten risks that the computer systems and
programming apparatus of enabling communications are penetrated. If operation and control systems
of power plants and the grid become the target of cyberattacks, society and economic activity could
be damaged enormously. Vehicle systems can be an easy entry point for cyberattacks due to
accessibility of the vehicles.60 This grave problem necessitates deliberate actions and appropriate
countermeasures to protect all relevant components from a vehicle to the grid against cyberattacks.
A fundamental measure to be taken are new mandatory standards for hardware and software. Also,
monitoring cyber security will be vital and necessary although it may add extra cost.
Involvement of various stakeholders
To make VtG work, participation and cooperation will be requested of many parties including the
electrical utility or grid operator, the automaker, the vehicle battery manufacturer, the EVSE provider,
the vehicle owner, the workplace/commercial site owner, and the aggregation service provider. A
fundamental but challenging step is to coordinate these multiple stakeholders, who have different
purposes, some of whom may find no benefits in VtG operation. The utility companies and the vehicle
57 Karali, N., Gopal, A. R., Steward, D., Connelly, E., and Hodge, C. (2017), ‘Vehicle-Grid Integration – A global overview
of opportunities and issues,’ Lawrence Berkeley National Laboratory and National Renewable Energy Laboratory, p.18;
Briones et al. (2012), op. cit., p.10
58 Steward, D. (2017), ‘Critical Elements of Vehicle-to-Grid (V2G) Economics,’ National Renewable Energy Laboratory, p.1
59 Markel, T., Meintz, A., Hardy, K., Chen, B., Bohn, T., Smart, J., Scoffield, D., Hovsapian, R., Saxena, S., MacDonald, J.,
Kiliccote, S., Kahl, K., and Pratt, R. (2015), ‘Multi-Lab EV Smart Grid Integration Requirements Study – Providing Guidance
on Technology Development and Demonstration.” National Renewable Energy Laboratory, p. 21; “AMI integrates smart
meters, communications networks, and meter data management systems and enables two-way communications by providing
near real-time data on power consumption and electricity price.”
60 Karali et al. (2017), op. cit., p.35.
15You can also read