Interdisciplinary Analysis of Social Acceptance Regarding Electric Vehicles with a Focus on Charging Infrastructure and Driving Range in Germany ...

Page created by Rita Curtis
 
CONTINUE READING
Interdisciplinary Analysis of Social Acceptance Regarding Electric Vehicles with a Focus on Charging Infrastructure and Driving Range in Germany ...
Article
Interdisciplinary Analysis of Social Acceptance Regarding
Electric Vehicles with a Focus on Charging Infrastructure and
Driving Range in Germany †
Amelie Burkert * , Heiko Fechtner and Benedikt Schmuelling

                                          School of Electrical, Information and Media Engineering, University of Wuppertal, Rainer-Gruenter-Str. 21,
                                          42119 Wuppertal, Germany; fechtner@uni-wuppertal.de (H.F.); schmuelling@uni-wuppertal.de (B.S.)
                                          * Correspondence: burkert@uni-wuppertal.de
                                          † This paper is an extended version of our paper published in the 16th IEEE Vehicle Power and Propulsion
                                            Conference, 14–17 October 2019, Hanoi, Vietnam.

                                          Abstract: A variety of measures are currently being taken on both the national and international
                                          levels in order to mitigate the negative effects of climate change. The promotion of electric mobility
                                          is one such measure for the transport sector. As a key component in a more environmentally-friendly,
                                          resource-saving, and efficient transport sector, electric mobility promises to create better sustainability.
                                          Several challenges still need to be met to exploit its full potential. This requires adapting the car
                                          technology, the value chain of vehicles, loads on the electricity network, the power generation for the
                                          drive, traffic, and charging infrastructure. The challenges to this endeavor are not only technical in
                                          nature, but they also include social acceptance, concerns, and economic, as well as ecological, aspects.
                                          This paper seeks to discuss and elucidate these problems, giving special focus to the issues of driving
                                          range, phenomenon of range anxiety, charging time, and complexity of the charging infrastructure in
         
                                   Germany. Finally, the development of social acceptance in Germany from 2011 to 2020 is investigated.
Citation: Burkert, A.; Fechtner, H.;
Schmuelling, B. Interdisciplinary
                                          Keywords: charging infrastructure; wireless power transfer; conductive charging; electric vehicles;
Analysis of Social Acceptance             range anxiety; social acceptance
Regarding Electric Vehicles with a
Focus on Charging Infrastructure and
Driving Range in Germany . World
Electr. Veh. J. 2021, 12, 25. https://    1. Introduction
doi.org/10.3390/wevj12010025                   Climate change is one of greatest challenges with which humanity is currently con-
                                          fronted. High concentrations of carbon dioxide (CO2 ) in Earth’s atmosphere is one of the
Received: 16 November 2020
                                          causes of this phenomenon. The resulting greenhouse effect has been linked to global
Accepted: 7 February 2021
                                          warming and to natural catastrophes (e.g., desertification, droughts, fire, melting glaciers,
Published: 11 February 2021
                                          coastal flooding) [1].
                                               As the second highest-ranking culprit in GHG emissions after the energy sector, the
Publisher’s Note: MDPI stays neutral
                                          transport sector produces immense amounts of CO2 [2]. Figure 1 offers a breakdown into
with regard to jurisdictional claims in
                                          CO2 emissions in general sectors and the transport sector in detail [3]. Overall, the transport
published maps and institutional affil-
                                          sector accounts for 24% of the total CO2 emission. Of this, passenger transport produces,
iations.
                                          on its own, 60.6% and is, therefore, an important starting point for fundamental changes.
                                          Electric vehicles need to usurp the position held by conventional vehicles to greater and
                                          greater degrees to enable a more environmentally friendly and resource-saving transport
                                          sector. Such a change to the sector poses difficult and new burdens on the automotive
Copyright: © 2021 by the authors.
                                          industry. It not only requires new drive and charging technologies to be developed, but
Licensee MDPI, Basel, Switzerland.
                                          also a completely new charging infrastructure, which is also discussed to some extent in [4].
This article is an open access article
distributed under the terms and
conditions of the Creative Commons
Attribution (CC BY) license (https://
creativecommons.org/licenses/by/
4.0/).

World Electr. Veh. J. 2021, 12, 25. https://doi.org/10.3390/wevj12010025                                        https://www.mdpi.com/journal/wevj
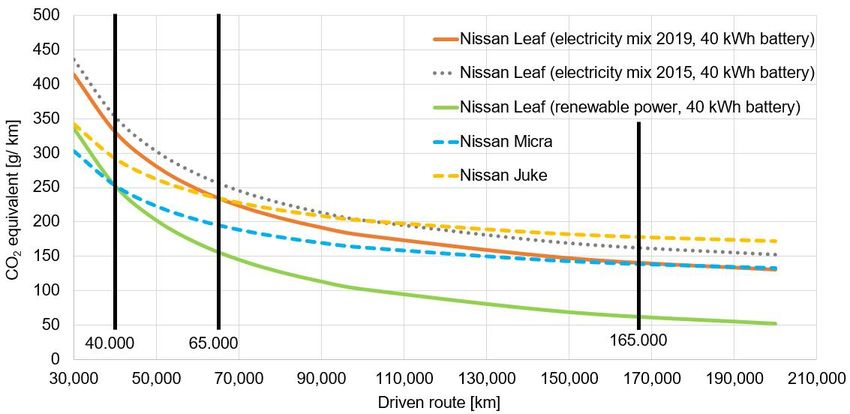
Interdisciplinary Analysis of Social Acceptance Regarding Electric Vehicles with a Focus on Charging Infrastructure and Driving Range in Germany ...
ectr. Veh. J. World
              2021, 12, 25 Veh. J. 2021, 12, 25
                    Electr.                                                                                                            2 of 33              2 of 32

                           Figure 1. Breakdown
                               Figure           of CO
                                      1. Breakdown      emission
                                                    of2CO        by general sectors (left) and within transport sector (right) in 2017 [5].
                                                          2 emission by general sectors (left) and within transport sector (right)

                               in 2017 [5].
                                                 1.1. Greenhouse Gas in Germany’s Transport Sector
                                1.1. Greenhouse Gas inPower
                                                         Germany’s
                                                                supply Transport   Sector energy is to be preferred to truly be able to call electro-
                                                                          from renewable
                                      Power supply from renewable energy is tothis
                                                 mobility    sustainable.     However,           lofty goalto
                                                                                            be preferred       is truly
                                                                                                                  not yet bewithin
                                                                                                                             able toreach.     In 2015, energy in
                                                                                                                                        call elec-
                                                 the transport
                                tromobility sustainable.           sectorthis
                                                             However,      waslofty
                                                                                mostly goalobtained
                                                                                              is not yet from   non-renewable
                                                                                                            within    reach. In 2015,resources
                                                                                                                                          energy(e.g., 94% fossil
                                in the transport fuel, 2%
                                                  sector    gas)
                                                          was     and only
                                                               mostly         4% from
                                                                        obtained    from  renewable
                                                                                            non-renewableresources    [5], and(e.g.,
                                                                                                                 resources      this 94%
                                                                                                                                      ratiofossil
                                                                                                                                             has not yet changed
                                fuel, 2% gas) andsignificantly
                                                    only 4% from  to renewable
                                                                     date. The number
                                                                                   resourcesof[5], hybrid    andratio
                                                                                                      and this      purely
                                                                                                                         has electric   vehicles only represent
                                                                                                                             not yet changed
                                                 2% ofThe
                                significantly to date.   the number
                                                              total number     of registered
                                                                        of hybrid   and purely    vehicles
                                                                                                     electricinvehicles
                                                                                                                 Germany   only[6].  It must 2%
                                                                                                                                 represent     also be noted that
                                                 the  production     of  electric vehicles     (EVs)
                                of the total number of registered vehicles in Germany [6]. It must also is very   CO   2 intensive,
                                                                                                                            be noted that the environmental
                                                                                                                                       with   the
                                                 impact    by  CO     emissions    in  the  production       of electric
                                production of electric vehicles2(EVs) is very CO2 intensive, with the environmental        vehicles    being   two-thirds higher
                                                                                                                                          impact
                                                 than  for  conventional     vehicles   due   to the  way   in  which
                                by CO2 emissions in the production of electric vehicles being two-thirds higher than for the batteries    are produced   [7]. After
                                                 their  production,    electric vehicles     have   the   potential   of
                                conventional vehicles due to the way in which the batteries are produced [7]. After their causing   nearly   zero  emissions,  pro-
                                                 vided
                                production, electric     that the
                                                       vehicles     power
                                                                 have   the is based on
                                                                             potential    of renewable
                                                                                             causing nearly energy.
                                                                                                                 zeroBe    that as it provided
                                                                                                                        emissions,     may, without renewable
                                                 energy    resources,    life cycle  analysis     shows     that   emissions
                                that the power is based on renewable energy. Be that as it may, without renewable energy        of   EVs   are comparable with
                                                 conventional     vehicles.
                                resources, life cycle analysis shows that emissions of EVs are comparable with conven-
                                tional vehicles.       For instance, Figure 2 shows the impact of various energy sources on carbon emissions.
                                      For instance, Figureelectric
                                                 A  purely    2 shows Nissan   Leaf with
                                                                          the impact    of two    different
                                                                                            various     energyenergy    sources
                                                                                                                  sources         (German
                                                                                                                             on carbon        electricity mix 2015
                                                                                                                                            emis-
                                                 and   2019,  German     renewable      power     of 2019)   is compared
                                sions. A purely electric Nissan Leaf with two different energy sources (German electricity    with    two   conventional   Nissan
                                                 vehicles   (Nissan    Juke   and  Nissan     Micra)    [8].  The
                                mix 2015 and 2019, German renewable power of 2019) is compared with two conventionalvehicles   that   are  presented   in Figure  2
                                                 have been chosen for an easy comparison of different vehicles from one manufacturer and
                                Nissan vehicles (Nissan Juke and Nissan Micra) [8]. The vehicles that are presented in
                                                 to consider the Nissan Leaf, which is one of the best-selling vehicles worldwide [9]. The
                                Figure 2 have been chosen for an easy comparison of different vehicles from one manu-
                                                 vehicles are comparable in their size and configuration. The calculations are based on the
                                facturer and to consider the Nissan Leaf, which is one of the best-selling vehicles world-
                                                 worldwide harmonized light-duty vehicles test procedure (WLTP) and [10]. The worst-case
                                wide [9]. The vehicles are comparable in their size and configuration. The calculations are
                                                 scenario was considered, in which it is assumed that Nissan Leaf production causes a total
                                based on the worldwide harmonized light-duty vehicles test procedure (WLTP) and [10].
                                                 of 10 t CO2 (as compared to a conventional Nissan vehicle, which produces 6 t). Battery
                                The worst-case scenario was       considered, in which it is assumed that Nissan Leaf produc-
                                                 production accounts for a large part of total CO2 and it varies depending on the capacity of
                                tion causes a total of 10 t CO2 (as compared to a conventional Nissan vehicle, which pro-
                                                 the battery installed.
                                duces 6 t). Battery production accounts for a large part of total CO2 and it varies depending
                                                       If supplied by the German electricity mix of 2019, the climate balance of Nissan
                                on the capacity of the battery installed.
                                                 Leaf is better after approximately 65,000 km when compared to Nissan Juke and after
                                      If supplied by the German electricity mix of 2019, the climate balance of Nissan Leaf
                                                 approximately 165,000 km as compared to Nissan Micra. With an annual mileage of
                                is better after approximately
                                                 less than 15,000 65,000
                                                                      km km[11],when    compared
                                                                                 the purchase       ofto   Nissan Leaf
                                                                                                        a Nissan     Juke does
                                                                                                                            and after    approx- any significant
                                                                                                                                  not provide
                                imately 165,000advantages
                                                   km as compared        to  Nissan    Micra.    With    an  annual     mileage
                                                                 before a vehicle age of 10 years. The climate balance would       of  less  than only be better
                                15,000 km [11], the   purchase    of a Nissan   Leaf   does    not  provide    any   significant    advantages
                                                 after >11 years in comparison to conventional Nissan Micra (see Table 1). On the other
                                before a vehiclehand,
                                                   age ofthe
                                                          10 purchase
                                                              years. Theofclimate
                                                                              Nissanbalance
                                                                                        Leaf wouldwould     only be
                                                                                                         already    be better  after >11
                                                                                                                        worthwhile          years
                                                                                                                                        at an  annual mileage of
                                in comparison to    conventional    Nissan    Micra   (see  Table   1). On   the  other   hand,  the
                                                 10,000 km as compared to the Nissan Juke. Accordingly, a higher mileage per year meanspurchase
                                of Nissan Leaf would
                                                 a betteralready
                                                           carbon be    worthwhile
                                                                     footprint.          at an annual
                                                                                  The difference           mileage
                                                                                                      becomes          of 10,000
                                                                                                                    even           km as com- when a Nissan
                                                                                                                           more pronounced
                                pared to the Nissan     Juke.  Accordingly,     a higher     mileage     per  year   means
                                                 Leaf is powered by renewable energy. After only 25,000 km, its climate       a  better   carbonbalance is better
                                footprint. The difference becomes even more pronounced when a Nissan Leaf is powered
Interdisciplinary Analysis of Social Acceptance Regarding Electric Vehicles with a Focus on Charging Infrastructure and Driving Range in Germany ...
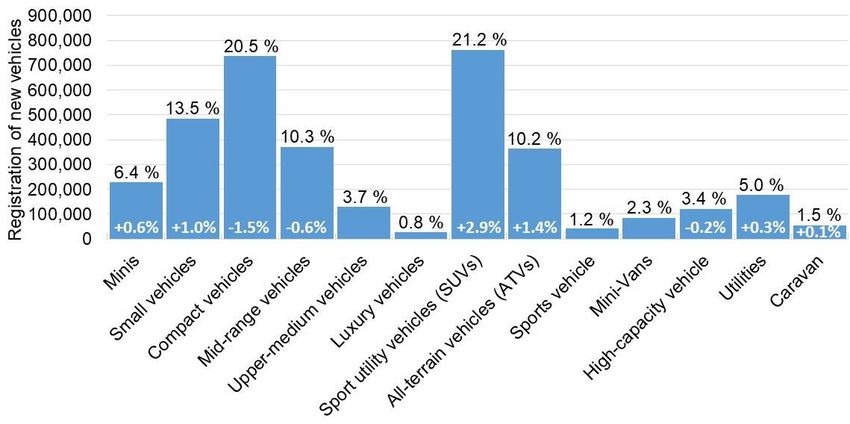
lectr. Veh. J. 2021, 12, 25                                                                                                       3 of 33
            World Electr. Veh. J. 2021, 12, 25                                                                                                        3 of 32

                                by renewable energy. After only 25,000 km, its climate balance is better than that of a con-
                                ventional Nissan  Juke
                                               than  thatand
                                                           of aafter  40,000 km
                                                                 conventional       betterJuke
                                                                                 Nissan     thanand
                                                                                                  thatafter
                                                                                                        of a40,000
                                                                                                               Nissan kmMicra.
                                                                                                                           betterTable   2 of a Nissan
                                                                                                                                  than that
                                shows the annual    average
                                               Micra.   Table mileage
                                                                2 showsof thethe  population
                                                                               annual    averagein mileage
                                                                                                    Germany   ofand    it highlightsinthe
                                                                                                                  the population        Germany and it
                                percentage of the population
                                               highlights         for whom the
                                                            the percentage        purchase
                                                                              of the          of a Nissan
                                                                                      population   for whom Leaf   would
                                                                                                                 the        be beneficial
                                                                                                                     purchase   of a Nissan Leaf would
                                compared to abe Nissan   Jukecompared
                                                  beneficial    or Nissan toMicra.    For Juke
                                                                               a Nissan    example,   if an Micra.
                                                                                                 or Nissan    owner Forof an  EV drives
                                                                                                                            example,   if an owner of an
                                20,000 km per EV
                                               year,  their20,000
                                                   drives    climate kmbalance  would
                                                                        per year,   theirbe  betterbalance
                                                                                          climate    after only
                                                                                                              would1.7 (Nissan
                                                                                                                        be betterJuke)
                                                                                                                                  after to
                                                                                                                                         only 1.7 (Nissan
                                2.7 (Nissan Micra)
                                               Juke)years,   while taking
                                                      to 2.7 (Nissan   Micra)that  it iswhile
                                                                               years,    charged   with
                                                                                              taking  thatrenewable
                                                                                                            it is chargedpower
                                                                                                                            withinto  ac-
                                                                                                                                  renewable   power into
                                               account
                                count (see Table 1).     (see Table 1).

                                Figure 2. CarbonFigure
                                                 footprint of different
                                                       2. Carbon        Nissan
                                                                   footprint    vehicle types
                                                                             of different      [8,12].
                                                                                          Nissan  vehicle types [8,12].

                                Table 1. Improvement
                                                Table 1.ofImprovement
                                                           Nissan Leaf’sofecological balance
                                                                            Nissan Leaf’s    over conventional
                                                                                          ecological balance overNissan vehiclesNissan
                                                                                                                  conventional   in    vehicles in years
                                years [a] (depending on power supply and annual mileage [km]).
                                                [a] (depending on power supply and annual mileage [km]).
                                 Annual Mileage          Electricity Mix of 2019                   Renewable Power
                                                                         Electricity Mix of 2019                Renewable Power
                                      [km]         Nissan
                                                Annual     Micra [a] Nissan Juke [a] Nissan Micra [a] Nissan Juke [a]
                                                       Mileage
                                                     [km]           Nissan Micra                         Nissan Micra
                                   5001–10,000         16.5–33              6.5–13    Nissan Juke 4–8
                                                                                                    [a]           2.5–5  Nissan Juke [a]
                                                                         [a]                                  [a]
                                  10,001–15,000        11–16.5             4.3–6.5               2.7–4          1.7–2.5
                                                  5001–10,000          16.5–33              6.5–13            4–8             2.5–5
                                  15,001–20,000         8.3–11             3.3–4.3               2–2.7          1.3–1.7
                                                       10,001–15,000          11–16.5             4.3–6.5                 2.7–4             1.7–2.5
                                Table 2. Percentage15,001–20,000           8.3–11
                                                    of the population driving                 3.3–4.3 (2019). The data
                                                                               various annual mileages            2–2.7regarding            1.3–1.7
                                annual mileage is based on data published by the Federal Motor Transport Authority [11].

                                                 Annual
                                                   TableMileage   [km]of the population driving
                                                         2. Percentage                     Percentage
                                                                                                 various of Population
                                                                                                         annual  mileages[%]
                                                                                                                          (2019). The data regarding
                                                       0–5000
                                                   annual                                                 12.97
                                                          mileage is based on data published by the Federal Motor Transport Authority [11].
                                                     5001–10,000                                          29.06
                                                                 Annual Mileage [km]                          Percentage of Population [%]
                                                    10,001–15,000                                         29.53
                                                                        0–5000                                            12.97
                                                    15,001–20,000                                         15.06
                                                   more than 20,000 5001–10,000                           13.37           29.06
                                                                       10,001–15,000                                          29.53
                                1.2. EU Policies Regarding CO2 Emissions
                                                                15,001–20,000                                                 15.06
                                      An examination of CO2 emissions
                                                                more than of newly registered vehicles over the last13.37
                                                                          20,000                                    few years
                                reveals that CO2 emissions have decreased by about 30% between 1998 and 2017 (as
                                shown in Figure 3) only to have increased again by 20% within two years (in 2018 and
                                                1.2. EU Policies Regarding CO2 Emissions
                                2019) [13]. This development can be explained by the significant higher share of newly
                                                      An examination of CO2 emissions of newly registered vehicles over the last few years
                                registered vehicles in vehicle segments, like   luxury vehicles, SUVs, ATVs, sport vehicles,
                                                reveals that CO2 emissions have decreased by about 30% between 1998 and 2017 (as shown
                                utility vehicles, and recreational vehicles (when compared to 2018). Figure 4 shows the
                                                in Figure 3) only to have increased again by 20% within two years (in 2018 and 2019) [13].
                                difference of the new vehicle registration from 2019 to 2018 for each vehicle class (in
                                                This development can be explained by the significant higher share of newly registered
                                                vehicles in vehicle segments, like luxury vehicles, SUVs, ATVs, sport vehicles, utility
Interdisciplinary Analysis of Social Acceptance Regarding Electric Vehicles with a Focus on Charging Infrastructure and Driving Range in Germany ...
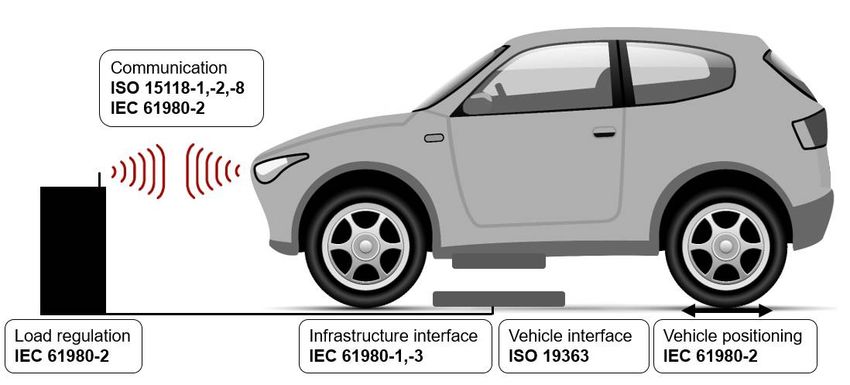
vehicles (approx. 621,190 vehicles) were registered in 2019 as compared to the previous
                                                 year [14]. Luxury vehicles, SUVs, ATVs, sport vehicles, utility vehicles, and recreational
                                                 vehicles produce a higher amount of CO2, which leads to an overall increase of the average
                                                 CO2 emission of all newly registered vehicles in Germany [6]. More than 13.2 million ve-
                                                 hicles of the luxury and leisure classes were registered in Germany in 2019 (2018: 12.39
            World Electr. Veh. J. 2021, 12, 25                                                                                                                4 of 32
                                                 million, 2017: 11.64 million). This means that approximately 50% of new vehicle registra-
                                                 tions were for luxury and leisure vehicles from 2017 to 2019 [14]. Figure 4 depicts the per-
                                                 centage distribution of vehicle classes. This distribution can also serve to explain the enor-
                                                 mous
                                                 vehicles,increase   in the average
                                                             and recreational          CO2 emissions
                                                                                   vehicles              (158 g CO
                                                                                             (when compared           2/km) in
                                                                                                                  to 2018).       20194(Figure
                                                                                                                               Figure      shows 3).the difference
                                                        Because    of  this development,     the European     Union     felt itself
                                                  of the new vehicle registration from 2019 to 2018 for each vehicle class (in      compelled      to act  and has
                                                                                                                                                        white).    A
                                                 since   introduced
                                                  significant   increasea law
                                                                            canto
                                                                                betry and in
                                                                                    noted  counteract
                                                                                              the compactthis class
                                                                                                              trend.   With ansport
                                                                                                                    (+1.5%),      aim utility
                                                                                                                                         to reduce    greenhouse
                                                                                                                                                  vehicles  (SUVs)
                                                 gas  emissions,
                                                 (+2.9%),            the European
                                                             and all-terrain          Union
                                                                                 vehicles      Regulation
                                                                                            (ATVs)   (+1.4%) 2019/631     was published
                                                                                                                [14]. Overall,      almost 5%  in April
                                                                                                                                                   more2019     [15]
                                                                                                                                                          vehicles
                                                 and   states621,190
                                                 (approx.      that, asvehicles)
                                                                         of 1 January
                                                                                    were2020,  a targetinvalue
                                                                                          registered       2019ofas95    g CO2/km
                                                                                                                     compared       tomay     not exceed
                                                                                                                                        the previous        95%
                                                                                                                                                         year     of
                                                                                                                                                                [14].
                                                 newly     registered    passenger    cars.  This target   value   refers    to the   entire
                                                  Luxury vehicles, SUVs, ATVs, sport vehicles, utility vehicles, and recreational vehicles      vehicle  fleet of   a
                                                 manufacturer.
                                                 produce a higher    From    1 January
                                                                          amount    of CO2021,  100%leads
                                                                                          2 , which    of newly
                                                                                                             to an registered      vehicles
                                                                                                                     overall increase        of must   not exceed
                                                                                                                                                the average    CO2
                                                 the  limit value
                                                  emission    of all of  95 g registered
                                                                      newly    CO2/km. The     restriction
                                                                                          vehicles          that is introduced
                                                                                                     in Germany       [6]. More than in 2020
                                                                                                                                           13.2 must   be vehicles
                                                                                                                                                 million   viewed
                                                 critically,  because
                                                  of the luxury           vehiclesclasses
                                                                    and leisure      with significantly
                                                                                           were registered more    than 95 g in
                                                                                                               in Germany        CO   2/km
                                                                                                                                    2019      can be
                                                                                                                                            (2018:     putmillion,
                                                                                                                                                    12.39   on the
                                                 market     as long
                                                  2017: 11.64         as theThis
                                                                 million).    average
                                                                                  means emissions    of the entire
                                                                                          that approximately       50%fleet
                                                                                                                          of are
                                                                                                                              newbelow
                                                                                                                                    vehicle this  value. Figure
                                                                                                                                               registrations   were 3
                                                  for luxury
                                                 also  shows the andguideline
                                                                       leisure vehicles   fromfrom
                                                                                  value valid    20172020
                                                                                                        to 2019
                                                                                                            and [14].     Figure 4the
                                                                                                                  it represents        depicts
                                                                                                                                          hurdlethethatpercentage
                                                                                                                                                        must still
                                                  distribution
                                                 be  overcome of   in vehicle
                                                                       reducing classes. This distribution
                                                                                   greenhouse    gas emissions. canThe
                                                                                                                     alsocurrent
                                                                                                                            serve tovalue
                                                                                                                                        explain    the enormous
                                                                                                                                               of approximately
                                                  increase
                                                 155  g COin 2/kmthemust
                                                                      average   CO2 emissions
                                                                            be reduced   by 61%.(158 g CO2 /km) in 2019 (Figure 3).

Electr. Veh. J. 2021, 12, 25                                                                                                              5 of 33
                                                  Figure 3.
                                                 Figure      Average g CO22/km
                                                          3. Average       /kmfrom
                                                                               fromnewly
                                                                                    newlyregistered
                                                                                          registered vehicles in Germany (from
                                                                                                                         (from 1998
                                                                                                                               1998to
                                                                                                                                    to2019)
                                                                                                                                      2019)[14,15].
                                                 [14,15].

                   Figure 4. Newly  registered
                               Figure 4. Newly vehicles sorted
                                                 registered    by vehicle
                                                            vehicles sorted class in 2019.class
                                                                              by vehicle   The data  is based
                                                                                                in 2019.      on data
                                                                                                         The data      obtained
                                                                                                                   is based      from
                                                                                                                            on data    the website of
                                                                                                                                     ob-
                   the German tained
                               Federalfrom  theTransport
                                        Motor   website ofAuthority
                                                           the German[14].Federal  Motor
                                                                           In white:      Transport to
                                                                                      the difference  Authority
                                                                                                         the year[14].
                                                                                                                  2018.In white: the dif-
                               ference to the year 2018.
                                                     Because of this development, the European Union felt itself compelled to act and has
                                                since introduced
                                 1.3. Applied Methodology        a law Question
                                                           and Research to try and counteract this trend. With an aim to reduce greenhouse
                                                gas emissions, the European    Union
                                       Over the years, several studies have been     Regulation
                                                                                   published  on 2019/631
                                                                                                 the topic was  published
                                                                                                           of barriers     in April 2019 [15]
                                                                                                                       to elec-
                                 tromobility. Studies, such as [16–18], are focused on identifying, categorizing, and
                                 weighting these barriers. For this purpose, social-empiric studies were conducted and
                                 evaluated in the relevant regions. In particular, the study [16] from 2020 shows that, cur-
                                 rently, the issues of range and charging infrastructure still play an important role in social
Interdisciplinary Analysis of Social Acceptance Regarding Electric Vehicles with a Focus on Charging Infrastructure and Driving Range in Germany ...
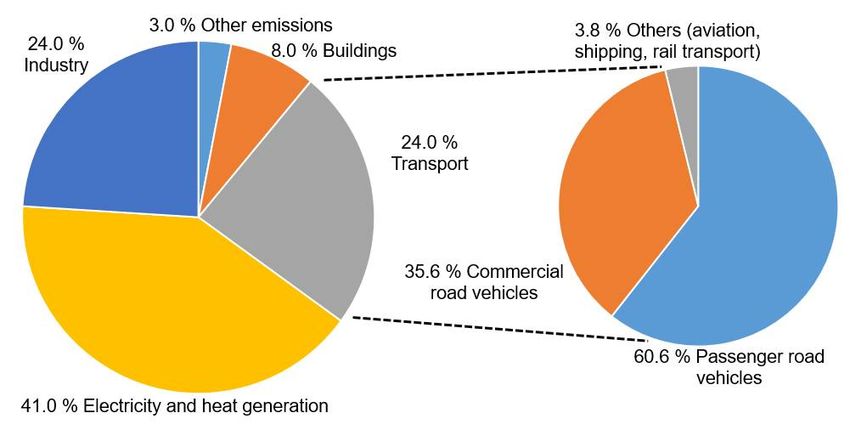
World Electr. Veh. J. 2021, 12, 25                                                                                            5 of 32

                                     and states that, as of 1 January 2020, a target value of 95 g CO2 /km may not exceed 95%
                                     of newly registered passenger cars. This target value refers to the entire vehicle fleet of a
                                     manufacturer. From 1 January 2021, 100% of newly registered vehicles must not exceed
                                     the limit value of 95 g CO2 /km. The restriction that is introduced in 2020 must be viewed
                                     critically, because vehicles with significantly more than 95 g CO2 /km can be put on the
                                     market as long as the average emissions of the entire fleet are below this value. Figure 3
                                     also shows the guideline value valid from 2020 and it represents the hurdle that must still
                                     be overcome in reducing greenhouse gas emissions. The current value of approximately
                                     155 g CO2 /km must be reduced by 61%.

                                     1.3. Applied Methodology and Research Question
                                          Over the years, several studies have been published on the topic of barriers to electro-
                                     mobility. Studies, such as [16–18], are focused on identifying, categorizing, and weighting
                                     these barriers. For this purpose, social-empiric studies were conducted and evaluated
                                     in the relevant regions. In particular, the study [16] from 2020 shows that, currently, the
                                     issues of range and charging infrastructure still play an important role in social acceptance.
                                     Another study [19] is based on the barriers that were identified in other studies for a
                                     sensitivity analysis. This methodology is intended to show the extent to which changes
                                     or developments in barriers have affected social acceptance over the years. For our work,
                                     we took our cues from studies, such as [16–18], with a special focus on a current opinion
                                     survey [16]. In particular, we looked at the barriers of range, charging time, and charging
                                     infrastructure in Germany.
                                          The charging infrastructure for EVs is often cited as a counterargument for purchasing
                                     an EV (see the studies [16,18,20]). It is for this reason that the focus of this paper is placed
                                     on the charging infrastructure, on the one hand, and, on the other hand, on the driving
                                     range of EVs in combination with the charging time, as it is argued that the technology is
                                     not mature and causes, among other things, the phenomenon of range anxiety. Hence, the
                                     main goal of this paper is to analyze current charging technologies for EVs. Additionally,
                                     the paper also presents an analysis of the range of current EVs and the driving behavior of
                                     potential owners of EVs. The applied interdisciplinary approach includes, among others, a
                                     detailed literature review of current research publication, political framework (e.g., funding
                                     programs), laws, and standards. In Chapter 4, the outcomes of the analysis are compared
                                     with two studies from 2011 and 2020, and focused on social acceptance for EVs. Thus, this
                                     paper provides detailed insight into two of the main barriers of social acceptance for EVs
                                     and seeks to answer the research question of whether the current measures are sufficient to
                                     have a positive effect on social acceptance. In addition, recommendations on how these
                                     barriers might be overcome are given in the conclusion.

                                     1.4. Structure of the Paper
                                           Section 2 provides an overview of the barriers to electromobility. The topics of energy
                                     storage and insecurity in dealing with accidents are only touched upon. Further, the paper
                                     presents a detailed exploration of the range problem of electric vehicles. Particular attention
                                     is paid to the phenomenon of range anxiety, the development of battery technology, and
                                     the importance of charging time. The range is a decision criterion when buying an electric
                                     vehicle and it is an important factor in planning the charging infrastructure and it defines
                                     the distribution and density of charging spots [21]. In the next part, the topic of charging
                                     infrastructure is then taken up. To supply these electric vehicles with (renewable) energy, a
                                     corresponding charging infrastructure for the public and private sectors must be developed
                                     and set up according to the requirements. Section 2.5.1 will then examine the current status
                                     of Germany’s charging infrastructure and compare it to that of other countries (e.g., EU,
                                     USA, China). This will be followed by a discussion of numerous factors (geographic charac-
                                     teristics, target group, charging technologies, pricing, backend and roaming, authorization
                                     process), which influence the planning of the charging infrastructure. The next section
                                     will present an analysis of social acceptance of EVs from 2011 to 2020 while using two
Interdisciplinary Analysis of Social Acceptance Regarding Electric Vehicles with a Focus on Charging Infrastructure and Driving Range in Germany ...
able) energy, a corresponding charging infrastructure for the public and private sectors
                                     must be developed and set up according to the requirements. Section 2.5.1 will then ex-
                                     amine the current status of Germany’s charging infrastructure and compare it to that of
                                     other countries (e.g., EU, USA, China). This will be followed by a discussion of numerous
                                     factors (geographic characteristics, target group, charging technologies, pricing, backend
World Electr. Veh. J. 2021, 12, 25                                                                                                6 of 32
                                     and roaming, authorization process), which influence the planning of the charging infra-
                                     structure. The next section will present an analysis of social acceptance of EVs from 2011
                                     to 2020 while using two studies that are based on the five barriers (see Figure 5) to high-
                                     light how
                                      studies   measures
                                              that         taken
                                                   are based      so far
                                                              on the     have
                                                                      five    affected
                                                                           barriers (seesocial
                                                                                         Figureacceptance   and how
                                                                                                 5) to highlight howthematic
                                                                                                                      measurespriori-
                                                                                                                                 taken
                                      so far
                                     ties    have
                                          have    affected
                                               shifted.    socialthe
                                                        Finally,  acceptance  andsummarizes
                                                                     conclusion    how thematic thepriorities have shifted.
                                                                                                    main findings           Finally,
                                                                                                                    and results      the
                                                                                                                                of this
                                      conclusion summarizes the main findings and results of this work.
                                     work.

                                     Figure
                                      Figure5.5.Electric
                                                 Electricmobility’s
                                                         mobility’sbenefits
                                                                    benefitsand
                                                                             andbarriers.
                                                                                 barriers.

                                     2.2.Barriers
                                          Barriersof
                                                   ofSocial
                                                       SocialAcceptance
                                                              Acceptance
                                            Establishing aa new
                                           Establishing      new technology
                                                                  technology on onthe
                                                                                    theautomotive
                                                                                         automotivemarket
                                                                                                        marketcan,
                                                                                                                can,atat
                                                                                                                       times,
                                                                                                                           times,bebea Herculean
                                                                                                                                        a Hercu-
                                      task. At  the time  of writing, there are still various  obstacles  standing   in
                                     lean task. At the time of writing, there are still various obstacles standing in the the  way   of achieving
                                                                                                                                           way of
                                      a broad social
                                     achieving   a broadacceptance    of electric
                                                           social acceptance   of vehicles.   Figure Figure
                                                                                  electric vehicles.   5 shows    the most
                                                                                                               5 shows      the salient   of these
                                                                                                                                most salient     of
                                      barriers.  These   barriers are  important   to discuss  as it is quite logical    that  electric
                                     these barriers. These barriers are important to discuss as it is quite logical that electric         mobility
                                      can onlycan
                                     mobility    be only
                                                      successfully  established
                                                           be successfully        as the new
                                                                             established        form
                                                                                           as the newofform
                                                                                                          mobility    if all the
                                                                                                               of mobility         population’s
                                                                                                                                if all the popu-
                                      doubts   can  be  dispelled. The   individual   challenges   that  have  led  to  the
                                     lation’s doubts can be dispelled. The individual challenges that have led to the barriersbarriers   in public
                                                                                                                                                 in
                                      perception    are explained   below.  This  is followed   by  a discussion   of  the
                                     public perception are explained below. This is followed by a discussion of the develop- development       and
                                      progress
                                     ment   and made
                                                 progressover the years
                                                            made          on years
                                                                   over the  the individual    issues. Finally,
                                                                                    on the individual    issues. Chapter       3 shows3that
                                                                                                                 Finally, Chapter          showsthe
                                      measures    taken  have  had  a positive  effect and  the social  acceptance    of   electric
                                     that the measures taken have had a positive effect and the social acceptance of electric        vehicles  has
                                      changedhas
                                     vehicles    significantly.
                                                     changed significantly.
                                      2.1. Energy Storage
                                     2.1. Energy Storage
                                            Despite the fact that the price of built-in energy storage systems has been steadily
                                           Despite the fact that the price of built-in energy storage systems has been steadily
                                      decreasing over the years, electric vehicles today are still up to 40% more expensive than
                                     decreasing
                                      conventionalover  the years,
                                                     vehicles  [22].electric vehicles today are still up to 40% more expensive than
                                     conventional   vehicles  [22].
                                            Those energy storage systems consist of many separate lithium-ion battery packs and
                                      the price per pack ten years ago was about $800. In the meanwhile, the price has fallen
                                      by 75% by 2017 [23], and forecasts for the future look promising; the price per pack will
                                      continue to fall as countries are forced to put more electric vehicles on the roads. The higher
                                      the demand for electric vehicles, the higher the demand for batteries and the greater the
                                      cost of energy storage will decrease [24]. Research in this field works on optimizing various
                                      characteristics, such as battery size, the chemical composition of the battery, cell quality,
                                      cell size, and format (see Section 2.3), all of which affect the cost of the total battery pack.
                                      Figure 6 illustrates the development of battery pack cost over years from 2010 onwards.
emissions by EVs taking place during the production, transport, conversion, and distribu-
                     tion of electricity (charging device (3 kW to 50 kW): 0.26 MJ to 0.28 MJ; petrol/diesel: 0.86
                     MJ). Nevertheless, an adequate charging infrastructure must be developed to truly make
                     electric vehicles a feasible option for frequent use. Therefore, the diffusion and sustaina-
                     bility of electric vehicles is not based on a further improvement of the vehicle itself (cur-
World Electr. Veh. J. 2021, 12, 25                                                                                                      7 of 32
                     rently this problem is only linked to the costs), but to the development of adequate infra-
                     structures, the efficiency, and use of renewable energy sources in electricity production.

     Figure 6. Cost development
                Figure             of lithium-ion
                        6. Cost development        battery packs
                                                of lithium-ion    for electric
                                                                battery packsvehicles  (from
                                                                               for electric    2009 to(from
                                                                                            vehicles    2018)2009
                                                                                                              [23].toThe reported average
                                                                                                                       2018)
                [23].
     is the simple    The reported
                   average          average
                            of statements     is theby
                                            made      simple average
                                                        market leadersofand
                                                                         statements
                                                                             what themade    by market
                                                                                       industry          leaders
                                                                                                  reported       and
                                                                                                             (blue      what Observed
                                                                                                                     triangles).
                the industry
     average prices are basedreported    (blue triangles).
                               on Bloomberg     New Energy Observed   average
                                                              Finance’s        prices
                                                                         industry     are based
                                                                                   survey         onrhombi).
                                                                                            (orange   Bloomberg New En-
                ergy Finance’s industry survey (orange rhombi).
                                         Looking at well-to-wheel analysis, which includes the entire process chain from the
                 2.2. Insecurity inprovision
                                     Dealing with   Accidents
                                               of drive energy (electricity, petrol, diesel) to the conversion into kinetic energy, it
                                   is noticeable   that electric
                       The energy storage system that is used    vehicles
                                                                     in EVsarepresents
                                                                               comparable
                                                                                        a newtochallenge
                                                                                                conventional
                                                                                                           in thevehicles
                                                                                                                  event on highways
                 of a car accident (over
                                      [26].100
                                            A km/h).     On urban
                                               battery consists       traffic routes
                                                                  of hundreds         (up to 30 km/h)
                                                                                  of individual           and intercity
                                                                                                 cells; should   one be routes (up to
                                   80  km/h),    the consumption    and   emissions   are reduced   by  more
                 damaged, a chain reaction of electrical short circuits could follow causing overheating,      than half [25]. Further-
                                   more,   the  results that were   obtained    by [25] also show   that
                 which, in turn, means that any fire caused by the accident would constantly be reignited,electric vehicles are highly
                                   efficient when compared to conventional internal combustion vehicles (the average power
                                   consumption is 0.47 MJ/km compared to 2.46 MJ/km of fuel for conventional vehicles),
                                   with the consumption of non-renewable primary energies and generation of greenhouse
                                   gas emissions by EVs taking place during the production, transport, conversion, and distri-
                                   bution of electricity (charging device (3 kW to 50 kW): 0.26 MJ to 0.28 MJ; petrol/diesel:
                                   0.86 MJ). Nevertheless, an adequate charging infrastructure must be developed to truly
                                   make electric vehicles a feasible option for frequent use. Therefore, the diffusion and
                                   sustainability of electric vehicles is not based on a further improvement of the vehicle itself
                                   (currently this problem is only linked to the costs), but to the development of adequate
                                   infrastructures, the efficiency, and use of renewable energy sources in electricity production.

                                   2.2. Insecurity in Dealing with Accidents
                                        The energy storage system that is used in EVs presents a new challenge in the event
                                   of a car accident [26]. A battery consists of hundreds of individual cells; should one be
                                   damaged, a chain reaction of electrical short circuits could follow causing overheating,
                                   which, in turn, means that any fire caused by the accident would constantly be reignited,
                                   a phenomenon that is known as thermal runaway [27]. Extinguishing such a fire could
                                   take hours and requires several thousand liters of water. On top of that, a thermal imaging
                                   camera or smoke sensors would need to be used to check whether the fire has been
                                   completely extinguished [28]. A fire that is caused by an EV is not necessarily more
                                   dangerous by one affecting a conventional vehicle; it must simply be treated differently
                                   due to the chemical reactions involved. In particular, care must be taken during the first
                                   24 h following the fire, as cells could reignite at any time. This additional precaution means
                                   that EV wrecks are stored separately [29].
World Electr. Veh. J. 2021, 12, 25                                                                                                             8 of 32

                                       2.3. Driving Range of Current Electric Vehicles
                                            Shifting from conventional vehicles to electric vehicles faces a series of challenges
                                       that must be overcome, such as the purchase costs, charging infrastructure, and charging
                                       time, as already stated above. The driving range of current electric vehicles is another
                                       often-cited challenge to the shift to electric mobility. This can be underlined, e.g., by [30],
                                       in which the authors demonstrate that the driving range of electric vehicles is one of the
                                       main barriers. For example, 35% of the interviewees in Germany name the driving range
                                       as an obstacle with regard to buying an electric vehicle [30]. However, the range of today’s
                                       electric vehicles is much greater when compared to electric vehicles from several years
                                       ago. Moreover, the study [31] that was published in 2016 concludes that the daily mileage
                                       of American citizens was 50.7 km (green line in Figure 7). In Germany, the average daily
                                       travel distance was 46 km in 2017 [32] as can be seen in Figure 7 (black line). A further
                                       finding of this study [32] is that full-time employees drove, on average, 65 km daily. The
                                       average mileage of weekend trips was 52 km per day. In addition, the study [32] highlights
                                       the differences between rural areas and urban areas. In 2017, Germans living in rural areas
                                       drove, on average, 52 km and people living in urban areas drove an average of 42 km [32].
                                       These average travel distances cited in [32] are then strongly incongruent with the findings
World Electr. Veh. J. 2021, 12, 25                                                                                          10 of 33
                                       of [30] and the phenomenon of range anxiety considering the driving ranges of modern
                                       EVs, and this needs to be further investigated.

                                                             500
                                                             450
                                                             400
                                                             350
                                        Driving range [km]

                                                             300
                                                             250
                                                             200
                                                             150
                                                             100
                                                              50
                                                               0

                                                     Driving
                                        Figure7.7.Driving
                                      Figure                  range
                                                           range      of current
                                                                   of current     electric
                                                                              electric     vehicles
                                                                                       vehicles       compared
                                                                                                 compared     withwith  average
                                                                                                                    average dailydaily driving
                                                                                                                                  driving  rangerange
                                                                                                                                                  of
                                        of American
                                      American         (green
                                                   (green line)line)  and German
                                                                and German     (black(black
                                                                                       line) line) motorists
                                                                                             motorists         and
                                                                                                         and the    the average
                                                                                                                  average        driving
                                                                                                                           driving range range
                                                                                                                                          of the of the
                                                                                                                                                 ana-
                                      lyzed   EVs (orange
                                        analyzed            line).line).
                                                    EVs (orange     The data of the
                                                                         The data ofdriving   range
                                                                                     the driving     is based
                                                                                                   range       on data
                                                                                                          is based      presented
                                                                                                                    on data        on the
                                                                                                                            presented     websites
                                                                                                                                      on the  websites
                                      ofofthe
                                           thevarious
                                                variousmanufacturers.
                                                        manufacturers.The  Theaverage
                                                                               averagedaily
                                                                                         dailydriving
                                                                                                drivingrange
                                                                                                         rangefor
                                                                                                                forthe
                                                                                                                    theUSA
                                                                                                                        USAwas
                                                                                                                             wastaken
                                                                                                                                  takenfrom
                                                                                                                                        from[31]
                                                                                                                                              [31] and
                                      and
                                        for for Germany
                                            Germany    fromfrom  [32].
                                                              [32].

                                            Range    anxiety isexample
                                              The following      hardly aillustrates
                                                                             new phenomenon.        Already
                                                                                        the extension   of the in 2011, range
                                                                                                               driving    [50] presented
                                                                                                                                 of electrican  anal-
                                                                                                                                              vehicles
                                      ysis  of theyears.
                                        in recent   range Inanxiety    thatmajority
                                                               2014, the     is caused of by theelectric
                                                                                          small  limitedvehicles
                                                                                                            range ofhadelectric   vehicles.
                                                                                                                            a driving    rangeAtbelow
                                                                                                                                                  this
                                      time,  there
                                        150 km      were
                                                 [33].     onlycompared
                                                        When     14,590 electric
                                                                             to thevehicles
                                                                                     data fromused  worldwide
                                                                                                 2014,  the average[33],driving
                                                                                                                          and their   range
                                                                                                                                  range       wassame
                                                                                                                                          of the   far
                                      shorter
                                        class ofwhen   compared
                                                  vehicle  was 220tokm  today’s
                                                                           in 2019electric vehicles.
                                                                                     [33]. This       This can to
                                                                                                corresponds      serve   to explain
                                                                                                                    an increase     inthe  existence,
                                                                                                                                       driving  range
                                      and   prevalence,
                                        of about   46.67%ofinrange     anxiety. For example, under ideal conditions, the Mitsubishi i-
                                                               five years.
                                      MiEV The     authors
                                              of 2012        of this
                                                        was able       paperabout
                                                                   to drive     conducted
                                                                                      155 kmtheir
                                                                                               [51].own
                                                                                                     Thus,data
                                                                                                             theanalysis
                                                                                                                 difference to between
                                                                                                                                provide further
                                                                                                                                           the rangeev-
                                      ofidence   regarding
                                          electric            this the
                                                   vehicles and     trend.
                                                                        rangeThisof analysis  included
                                                                                    conventional          datawas
                                                                                                    vehicles    on noticeable.
                                                                                                                    12 electric vehicles
                                                                                                                                    In recentthat   are
                                                                                                                                               years,
                                        currently
                                      the  share ofavailable    on the market.
                                                      electric vehicles   on the road Thehas
                                                                                           vehicle  selection
                                                                                              rapidly   grownwas and,done     based
                                                                                                                       in 2018,    the on  their sales
                                                                                                                                        threshold   of
                                        volume
                                      five        in battery
                                            million  Europe electric
                                                               between    Januaryand
                                                                        vehicles     to November      in 2020,
                                                                                         plug-in hybrid         see Table
                                                                                                           worldwide      was3. exceeded
                                                                                                                                When compared
                                                                                                                                            [33]. Theto
                                        the sales
                                      average      volume
                                                driving     of the
                                                          range   ofEVs   (BEV: 338,918;
                                                                      the analyzed,         PHEV:
                                                                                       current       346,112)
                                                                                                vehicles       [34], the
                                                                                                           is 343.67  km,total   sales volume
                                                                                                                            as mentioned          of all
                                                                                                                                              before.
                                      In addition, Table 4 highlights that the range of an electric vehicle correlates with, among
                                      other things, the purchasing costs.

                                      Table 4. Correlation between purchase price and driving range. The data of the purchase prices
                                      are based on data presented on the websites of the various manufacturers.
World Electr. Veh. J. 2021, 12, 25                                                                                                    9 of 32

                                     new car registrations in the EU was 11.96 million vehicles between January to November
                                     in 2020 [35]. In addition, 194,163 EVs and, in total, 2.2 million passenger vehicles with a
                                     combustion engine have been registered in Germany in 2020 [36]. Thus, EVs still have a
                                     small share of total vehicle registrations in the EU and Germany.

                                     Table 3. Selected vehicles for the analysis of the driving range of modern electric vehicles (EVs) [37].

                                              Vehicle Model                      Sales Volume                  Battery Capacity [kWh]
                                               Renault Zoe                           83,356                               41
                                               Tesla Model 3                         63,086                               55
                                            Hyundai Kona EV                          37,202                               64
                                                VW e-Golf                            31,326                              35.8
                                        Audio e-tron 55 Sportback
                                                                                     30,181                              86.5
                                                 quattro
                                                 VW ID.3                             28,839                               62
                                              Peugeot 208 EV                         28,137                               50
                                               Kia Niro EV                           27,049                               64
                                                Nissan Leaf                          26,366                               40
                                                  BMW i3                             20,647                              42.2
                                                 VW e-Up!                            18,176                              36.8
                                             smart EQ fortwo                         16,226                              17.6

                                           In view of the increasing number of new electric vehicles models in recent years, future
                                     publications will consider a greater number of electric vehicles. The range of the selected
                                     vehicles is between 159 km (Smart EQ fortwo) and 484 km (Hyundai Kona EV) according to
                                     WLTP, see Figure 7. The average driving range of the analyzed electric vehicles is 343.67 km
                                     (orange line in Figure 7), which is significantly higher than the driving range of 220 km
                                     that is presented in [33], which depends on the greater battery capacities of modern EVs,
                                     see Table 3.
                                           One of the key drivers of this welcome development is the growing energy density of
                                     lithium-ion batteries. The battery technology has considerable influence on the range of
                                     electric vehicles. On the one hand, more stored energy at the same battery weight makes
                                     longer travel distances feasible and, on the other hand, a greater energy density enables
                                     lower battery weights and vehicle weights [38]. This can reduce the energy consumption
                                     through a lower vehicle weight that is based on its influence on the different driving
                                     resistances [39]. A higher energy density means a greater driving range for the same
                                     battery weight. In 2018, the volumetric energy density of lithium-ion batteries was between
                                     200 Wh/L to 300 Wh/L [40] and between 400 Wh/L to 450 Wh/L on the cell level [41].
                                     The authors of [41] forecast an energy density of 650 Wh/L to 700 Wh/L for 2023 through
                                     improvements in the production process and chemical materials used.
                                           In addition, the gravimetric energy density of modern lithium-ion batteries lies in
                                     the range of 90 Wh/kg to 250 Wh/kg [42]. Tesla, for example, uses lithium nickel cobalt
                                     aluminum oxide batteries (NCA) [42], which, when compared to other lithium-ion batteries
                                     (e.g., lithium manganese oxide: 100 Wh/kg to140 Wh/kg), has a greater gravimetric energy
                                     density (200 Wh/kg to 250 Wh/kg) [42,43].
                                           Solid-state batteries are a promising technology for a further improvement of the
                                     energy density and driving range. This technology has the potential to increase the energy
                                     density by up to 40% [44] and 70% [45] as compared to the current state-of-the-art lithium-
                                     ion batteries. Further advantages of solid-state batteries are the reduced flammability and
                                     a longer lifetime compared to batteries with liquid electrolyte [45].
                                           The price for lithium-ion battery packs is also showing a positive development. In
                                     2018, it stood at below 200 $/kWh, and Bloomberg forecasts a price of 94 $/kWh for 2024
World Electr. Veh. J. 2021, 12, 25                                                                                              10 of 32

                                     and 62 $/kWh for 2030 [46]. Thus, decreasing costs and increasing energy densities can
                                     lead to a greater driving range of future electric vehicles. Figure 6 also shows the price
                                     development of battery packs.
                                          However, despite all of the facts that should dispel any concerns in this regard, the
                                     psychological phenomenon ‘range anxiety’ still exists [47–49]. This is surprising consid-
                                     ering the driving range of modern electric vehicles and the actual mobility behavior of
                                     potential users of electric vehicles, as seen in Figure 7. Furthermore, the theory of range
                                     anxiety is presented to clarify whether this purchasing barrier is justified or not.
                                          Range anxiety is hardly a new phenomenon. Already in 2011, [50] presented an
                                     analysis of the range anxiety that is caused by the limited range of electric vehicles. At this
                                     time, there were only 14,590 electric vehicles used worldwide [33], and their range was far
                                     shorter when compared to today’s electric vehicles. This can serve to explain the existence,
                                     and prevalence, of range anxiety. For example, under ideal conditions, the Mitsubishi
                                     i-MiEV of 2012 was able to drive about 155 km [51]. Thus, the difference between the range
                                     of electric vehicles and the range of conventional vehicles was noticeable. In recent years,
                                     the share of electric vehicles on the road has rapidly grown and, in 2018, the threshold of
                                     five million battery electric vehicles and plug-in hybrid worldwide was exceeded [33]. The
                                     average driving range of the analyzed, current vehicles is 343.67 km, as mentioned before.
                                     In addition, Table 4 highlights that the range of an electric vehicle correlates with, among
                                     other things, the purchasing costs.

                                     Table 4. Correlation between purchase price and driving range. The data of the purchase prices are
                                     based on data presented on the websites of the various manufacturers.

                                                Category                      Price Range [€]          Average Driving Range [km]
                                                    1                          20,000–29,999                        245
                                                    2                          30,000–39,999                        374
                                                    3                             >40,000                           438

                                          For example, the Audi e-tron 55 Sportback has a driving range of 446 km and a
                                     purchase price between of $83,750, depending on the vehicle features. Compared to the
                                     Audi e-tron 55 Sportback, the smart EQ fortwo has a driving range of approximately 159 km
                                     and a price of $21,387. In addition, the categories in Table 4 underline the correlation. The
                                     selected vehicles of category 1 have an average driving range of 245 km as compared to the
                                     vehicles of category 3 (438 km). These examples underline the correlation between purchase
                                     costs and driving range. However, despite the plentiful offer for high-range vehicles, range
                                     anxiety remains an object of research in current academic publications [52,53].
                                          In his doctoral thesis [54], T. Franke analyzes sustainable mobility in the context
                                     of limited resources. One interesting finding is that drivers of electric vehicles have a
                                     theoretical safety buffer of 20% to 25% of the driving range in their mind. In other words,
                                     20% to 25% of the available driving range are not used. For example, in the case that the
                                     driving range is 100 km, the driver thinks that the driving range is only between 75 km
                                     to 80 km. The safety buffer is caused by an incorrect perception of the actual driving
                                     range [54,55].
                                          A further study [56] concludes that range anxiety correlates with the level of experience
                                     drivers have with electric vehicles. A greater experience in driving an electric vehicle leads
                                     to less range anxiety [56]. This correlation was also found in [50]. Based on the findings
                                     of [50,56], a survey with 179 interviewees was conducted in 2017 for this paper to analyze
                                     the prevalence of range anxiety. Fifty-two of the interviewees were owners of electric
                                     vehicles and 127 interviewees owned a conventionally powered vehicle. Only 28% of the
                                     electric vehicle owners stated that they have range anxiety, as shown in Figure 8. When
                                     compared to the electric vehicle owners, 62% of the interviewees who were not owners of
                                     an electric vehicle have range anxiety. These findings underline the results of [56] and show
ence drivers have with electric vehicles. A greater experience in driving an electric vehicle
                                     leads to less range anxiety [56]. This correlation was also found in [50]. Based on the find-
                                     ings of [50,56], a survey with 179 interviewees was conducted in 2017 for this paper to
                                     analyze the prevalence of range anxiety. Fifty-two of the interviewees were owners of
                                     electric vehicles and 127 interviewees owned a conventionally powered vehicle. Only 28%
World Electr. Veh. J. 2021, 12, 25                                                                                              11 of 32
                                     of the electric vehicle owners stated that they have range anxiety, as shown in Figure 8.
                                     When compared to the electric vehicle owners, 62% of the interviewees who were not
                                     owners of an electric vehicle have range anxiety. These findings underline the results of
                                     [56]
                                     that and
                                          rangeshow  that is
                                                 anxiety  range   anxiety is a psychological
                                                             a psychological   phenomenon phenomenon         thatprevalent
                                                                                              that is especially  is especially preva-
                                                                                                                            in people
                                     lent in
                                     who     people
                                           have      who have
                                                no previous      no previous
                                                               experience      experience
                                                                           in using        invehicles.
                                                                                    electric  using electric vehicles.

                                     Figure
                                     Figure 8.
                                            8. Results
                                               Results of
                                                       of an
                                                          an own
                                                             own survey
                                                                 survey in
                                                                        in the
                                                                           the context
                                                                               context of
                                                                                       of range
                                                                                          range anxiety.
                                                                                                anxiety.

                                           Besides the psychological aspects, there are also technical solutions for combating               combating
                                     range anxiety.
                                             anxiety. ForFor example,
                                                              example,the   theoptimization
                                                                                 optimizationofofrangerangeprediction
                                                                                                               predictioncancan   reduce    range
                                                                                                                               reduce range anxiety. anxi-
                                     ety. In previous
                                     In previous           publications
                                                       publications          [57,58],
                                                                         [57,58],      a system
                                                                                   a system     is is  presentedthat
                                                                                                   presented        thatisisable
                                                                                                                             ableto to detect
                                                                                                                                       detect payload
                                                                                                                                                 payload
                                     changes of vehicles tire pressure monitoring. By knowing the current vehicle mass and by
                                     determining its   itspayload,
                                                           payload,the  the   calculation
                                                                           calculation       of energy
                                                                                         of energy         consumption
                                                                                                      consumption             and available
                                                                                                                       and available     driving  driving
                                                                                                                                                    range
                                     range   along
                                     along the        the can
                                                   route   routebecan    be optimized.
                                                                    optimized.             A further
                                                                                   A further    technicaltechnical
                                                                                                             solutionsolution    is the integration
                                                                                                                        is the integration      of range of
                                     range   extenders
                                     extenders             to enhance
                                                    to enhance             the driving
                                                                   the driving    rangerange     [59]. Alternatively,
                                                                                          [59]. Alternatively,             the development
                                                                                                                    the development                of soft-
                                                                                                                                            of software
                                     solutions
                                     ware         can also
                                            solutions     canbealso
                                                                helpful,    for example,
                                                                      be helpful,           to provide
                                                                                     for example,      to the  driverthe
                                                                                                           provide     with   information
                                                                                                                           driver             regarding
                                                                                                                                    with information
                                     nearby charging
                                     regarding     nearbystations
                                                             charging [60].  A wide
                                                                          stations    range
                                                                                    [60].     of parameters
                                                                                          A wide                 (vehicle weight,
                                                                                                     range of parameters              battery
                                                                                                                                (vehicle         capacity,
                                                                                                                                           weight,     bat-
                                     traffic
                                     tery    volume,traffic
                                          capacity,       meteorological       data, etc.) needs
                                                                volume, meteorological          data,toetc.)
                                                                                                         be considered
                                                                                                              needs to be to   precisely to
                                                                                                                            considered      predict    the
                                                                                                                                               precisely
                                     range ofthe
                                     predict     electric
                                                     rangevehicles
                                                             of electric[61].  The authors
                                                                            vehicles  [61]. Theof authors
                                                                                                   [61] recommend         e.g., the development
                                                                                                              of [61] recommend         e.g., the devel- of
                                     an advanced
                                     opment     of ansoftware
                                                         advanced   solution
                                                                       softwarethatsolution
                                                                                    uses, e.g.,  artificial
                                                                                              that            intelligence
                                                                                                    uses, e.g.,   artificialfor   range prediction
                                                                                                                              intelligence     for range to
                                     analyze    and    consider    all necessary    influencing     parameters.      In
                                     prediction to analyze and consider all necessary influencing parameters. In summary,summary,      while    it can  be
                                     said that
                                     while       range-prediction
                                             it can                     software has beensoftware
                                                       be said that range-prediction           improvedhas   in recent  years, current
                                                                                                                 been improved             systems
                                                                                                                                      in recent        still
                                                                                                                                                    years,
                                     harbor asystems
                                     current     great potential     for improvement
                                                           still harbor                    regarding
                                                                            a great potential            the integration
                                                                                                 for improvement             of artificial
                                                                                                                         regarding     the intelligence.
                                                                                                                                            integration
                                           Plug-inintelligence.
                                     of artificial    hybrid electric vehicles (PHEV) are another promising solution for overcoming
                                     rangePlug-in
                                             anxiety.    By driving
                                                      hybrid    electricPHEVs,
                                                                           vehiclespotential
                                                                                     (PHEV)purchaser
                                                                                                are another   ofpromising
                                                                                                                 EVs get in solution
                                                                                                                               contact with      vehicles
                                                                                                                                          for overcom-
                                     powered      by   electrical    energy.    This   growing     experience      with
                                     ing range anxiety. By driving PHEVs, potential purchaser of EVs get in contact with  EVs   enabled     by    driving
                                                                                                                                                     vehi-
                                     PHEVs     can   lead  to a reduction     of range   anxiety,  although     further   investigations
                                     cles powered by electrical energy. This growing experience with EVs enabled by driving                  are  needed
                                     if more detailed
                                     PHEVs      can leadstatements        in this of
                                                             to a reduction       regard
                                                                                      rangeareanxiety,
                                                                                                to be made,     as already
                                                                                                           although           asserted
                                                                                                                        further           in [56] andare
                                                                                                                                   investigations        in
                                     accordance      with   the  results   of our  own   survey.
                                     needed if more detailed statements in this regard are to be made, as already asserted in
                                           Thein
                                     [56] and    introduction
                                                     accordanceof      fastthe
                                                                     with    charging
                                                                                results technologies,
                                                                                         of our own survey.like the Tesla Supercharger, can also
                                     help to overcome the range anxiety [62]. Therefore, the next section will analyze the
                                     charging time of current electric vehicles to underline the potential for improvement.

                                     2.4. Charging Time of Modern Electric Vehicles
                                          The relationship between range anxiety and the available charging infrastructure
                                     is addressed and discussed in [52,62]. In these studies, the authors emphasized that an
                                     increasing number of charging stations and integration of rapid charging systems into the
                                     charging infrastructure can help to reduce the range anxiety. The natural consequence
                                     of this relationship is that increasing battery capacities and the development as well as
                                     the integration of electronic components necessary for fast charging are important topics
                                     for automobile manufactures. Another important issue is ensuring that systems for fast
                                     charging would be economical. Section 2.5 presents further details about economic aspects
                                     regarding charging infrastructure.
                                          The charging times in EVs depend on the battery capacity and type of grid connection.
                                     For instance, charging with a DC connection can last a few minutes, while using an AC
                                     connection would take several hours. When charging using AC current, the vehicle’s on-
World Electr. Veh. J. 2021, 12, 25                                                                                            12 of 32

                                     board charger receives alternating current (AC), which it then converts into direct current
                                     (DC), which is finally sent to vehicle battery. Charging the vehicle with DC current is done
                                     using a DC charging station, which can convert the AC current that is received from the
                                     power grid to a DC current. This charging current then bypasses the on-board charger of
                                     the EV and it is sent via a battery management system (BMS) to the battery, as instructed
                                     by the vehicle’s charging control system. What this essentially means is that the charging
                                     time is not limited by the power of the on-board charger, which opens up great potential
                                     for reducing the charging time.
                                          Using the example of a Nissan Leaf with a battery capacity of 40 kWh, Table 5 provides
                                     possible charging times with AC charging according to the charging capacity. However, this
                                     only represents an ideal case of 100% efficiency, and it neglects any losses. In the study [63],
                                     the losses of a conductive charging system were investigated in detail through an analysis
                                     of both the selected vehicle and charging station components. The losses evidently depend
                                     on AC current (10 A, losses: 17%; 40 A, losses: 12%). High losses occur, especially when
                                     the transformers operate below their rated power. In the best case, a Nissan Leaf that is
                                     charged with AC current requires two hours to be fully charged. This is unacceptable for
                                     long journeys due to the extremely increased time required. Therefore, the only remaining
                                     option is DC charging. With a possible charging capacity of 50 kW, a Nissan Leaf would be
                                     charged within 40 min [8].

                                     Table 5. The charging time of Nissan Leaf with 40 kWh battery depending on charging current and
                                     capacity [8].

                                            Charging Current               DC                             AC
                                          Charging capacity [kW]           50           22          11          3.7          2.3
                                            Charging time [h]             0.67         6.5         11.5         11.5        17.4

                                           The aging of batteries depends, among others, on the charging power. The majority
                                     of modern electric vehicles are limited to a C-rate between 1 C and 1.5 C [49]. The C-rate
                                     defines the maximum charging and discharging current with regard to the battery capacity.
                                     Higher charging rates (e.g., between 1 C and 4 C) can cause lithium plating, increasing
                                     impedance, and promoting a reduction in cell capacities [49,64]. As a result, lithium-ion
                                     batteries can age faster [64]. Additionally, the battery temperature is a further important
                                     factor that influences aging of batteries and needs to be considered [49].
                                           The charging technology of seven modern electric vehicles was analyzed to obtain an
                                     overview of the charging time of electric vehicles. The charging times presented below refer
                                     to a charging process up to a state of charge (SoC) of 80%. At charging powers between 3.6
                                     to 50 kW, the charging times vary from 36 min. (VW e-Golf, 50 kW) to approximately 27.5 h
                                     (Audi e-tron Sportback 55 quattro, 3.6 kW), see Figure 9. When compared to the selected
                                     vehicles, the Porsche Taycan, e.g., can be charged by higher C-rates, e.g., approximately
                                     3 C, at a voltage level of 800 V [49,65], which means that the Porsche Taycan is able to be
                                     charged by a maximum charging power of 270 kW. This leads to a significant reduction
                                     in charging time, such that the Porsche Taycan can be charged from 5 to 80% of SoC in
                                     22.5 min. under ideal conditions. In other words, sufficient energy for 100 km can been
                                     charged within 5 min. The effects of fast charging regarding battery aging of the Porsche
                                     Taycan and other electric vehicles need to be observed and analyzed in the coming years.
fuel cell electric vehicles to compete with conventional vehicles regarding refuel time.
                     When compared to conventional and fuel cell vehicles, the average charging time of the
                     analyzed modern electric vehicles is 45.6 min. with a charging power of 50 kW (see Figure
                     9). Therefore, it can be summarized that faster charging and a greater availability of fast
World Electr. Veh. J.charging
                      2021, 12, 25 stations have the potential to increase public acceptance of electric vehicles.                 13 of 32
                     Based on this conclusion, the following sections will explore the significance of the charg-
                     ing infrastructure for the growing spread of electric vehicles.

                  Figure 9.time
     Figure 9. Charging      Charging   timeelectric
                                 of current  of current electric
                                                     vehicles    vehicles depending
                                                              depending   on chargingonpower.
                                                                                        charging
                                                                                              Thepower.
                                                                                                  data ofThe data oftime is based on
                                                                                                          charging
                  charging   time is based on  data  provided  by the manufacturers  on their websites.
     data provided by the manufacturers on their websites. The AC charging power (3.6 kW–22 kW) of some The AC charging
                                                                                                                      of the selected
                  power (3.6 kW–22 kW) of some of the selected vehicles is limited by the onboard-charger. Hence,
     vehicles is limited by the onboard-charger. Hence, the charging time at 11 kW can be similar to the charging time at 22 kW
                  the charging time at 11 kW can be similar to the charging time at 22 kW (e.g., Kia Niro EV). In ad-
     (e.g., Kia Niro EV). In addition, some of the EVs are able to be charged by charging power above 50 kW (e.g., Tesla Model 3).
                  dition, some of the EVs are able to be charged by charging power above 50 kW (e.g., Tesla Model
                  3).
                                       To win over potential buyers of electric vehicles, in the best-case scenario, the charging
                                 times for EVs need to be close to the time that is required for refueling conventional
                 2.5. Charging Infrastructure
                                 vehicles. In [66], the authors emphasize that the refueling process of fuel cell electric
                       Academicvehicles
                                  literature  on the
                                            takes    subject already
                                                  approximately         highlights
                                                                    between    2 to a3 number
                                                                                       min. Thisof quick
                                                                                                   issues refueling
                                                                                                          that are re-
                                                                                                                     process enables
                 lated to the charging   infrastructure   for electric vehicles. Important    aspects  such
                                 current fuel cell electric vehicles to compete with conventional vehicles   as safety
                                                                                                                    regarding refuel
                 and condition assessment
                                 time. Whenhave      been examined
                                                compared               in order
                                                            to conventional   andtofuel
                                                                                     avoid
                                                                                        cellmalfunctions
                                                                                             vehicles, the and  to en-
                                                                                                           average   charging time of
                 sure interoperability   and functionality
                                 the analyzed                of the vehicles
                                                 modern electric    electroniciscomponents
                                                                                 45.6 min. with[67,68]. Furthermore,
                                                                                                   a charging   power of 50 kW (see
                 the impact of an   installed
                                 Figure        charging infrastructure
                                          9). Therefore,                  on air quality
                                                         it can be summarized            andcharging
                                                                                  that faster  the associated  effects availability of
                                                                                                         and a greater
                 on human health fastwere   analyzed
                                      charging         [69]have
                                                 stations   and the potential
                                                                     possibilitytoof  combining
                                                                                   increase       renewable
                                                                                             public  acceptanceenergy
                                                                                                                  of electric vehicles.
                                 Based on this conclusion, the following sections will explore the significance of the charging
                                 infrastructure for the growing spread of electric vehicles.

                                  2.5. Charging Infrastructure
                                       Academic literature on the subject already highlights a number of issues that are
                                  related to the charging infrastructure for electric vehicles. Important aspects such as safety
                                  and condition assessment have been examined in order to avoid malfunctions and to ensure
                                  interoperability and functionality of the electronic components [67,68]. Furthermore, the
                                  impact of an installed charging infrastructure on air quality and the associated effects
                                  on human health were analyzed [69] and the possibility of combining renewable energy
                                  sources with charging infrastructure [70]. Various publications [71–74] attempt to establish
                                  models for the prediction of the demand for publicly accessible charging stations, while
                                  other studies focus on infrastructure configurations and, thus, on the technical aspect [75].
                                       While all of these topics are indeed of great importance for a successful integration of
                                  electric vehicles into the automotive market and for increasing customer acceptance, the
                                  aforementioned publications fail to do justice to the complexity of developing a satisfactory
                                  and sustainable charging infrastructure with its numerous influencing factors. Therefore,
                                  this study seeks to look more closely at those influencing factors that play a role in the
                                  development and planning of a charging infrastructure, and shows the interactions and
                                  links between the different topics. It has the merit of also considering non-technological
                                  issues.
                                       The main difficulty is in developing a well-networked charging infrastructure with-
                                  out operative experiences and, at the moment, lacking any standards. Furthermore, the
                                  technical developments for AC charger, or rather DC charger, are not completed due to
You can also read