DUBLIN CITY LOCAL ECONOMIC AND COMMUNITY PLAN 2016-2021
←
→
Page content transcription
If your browser does not render page correctly, please read the page content below
DUBLIN   LOCAL ECONOMIC
         AND COMMUNITY
  CITY   PLAN

         2016-2021
DUBLIN CITY

   2
LOCAL ECONOMIC AND COMMUNITY PLAN 2016-2021

        LOCAL
     ECONOMIC
AND COMMUNITY
         PLAN

                         2016-2021

                                         3
DUBLIN CITY

        CONTENTS
         Foreword | Councillor Daithí Doolan
         and Councillor Paul McAuliffe

         1 Introduction and Background to the Dublin
         City Local Economic and Community Plan,            P1
         2016 – 2021

         2 Development of the Dublin City Local Economic
         and Community Plan 2016 - 2021                     P7
         3 Dublin in Brief                                 P 11
         4 12 High Level Goals and Evidence Base           P 17
         Appendix 1 Dublin City Local Community
         Development Committee Membership
                                                           P 59

         Appendix 2 Economic Development and
         Enterprise SPC Membership
                                                           P 59

         Appendix 3 LECP Advisory Steering Group           P 60
         Appendix 4 Economic Working Group                 P 60
         Appendix 5 Social Inclusion and Community
                                                           P 60
         Activation Programme

         Appendix 6 Written submissions received, June
                                                           P 60
         2015

         Appendix 7 Attendance at local stakeholder
                                                           P 62
         workshop, 25 June 2015

         Appendix 8 Attendance at national stakeholder     P 63
         workshop, 29 June 2015

         Appendix 9 Completed questionnaires received      P 64
         from State agencies
  I4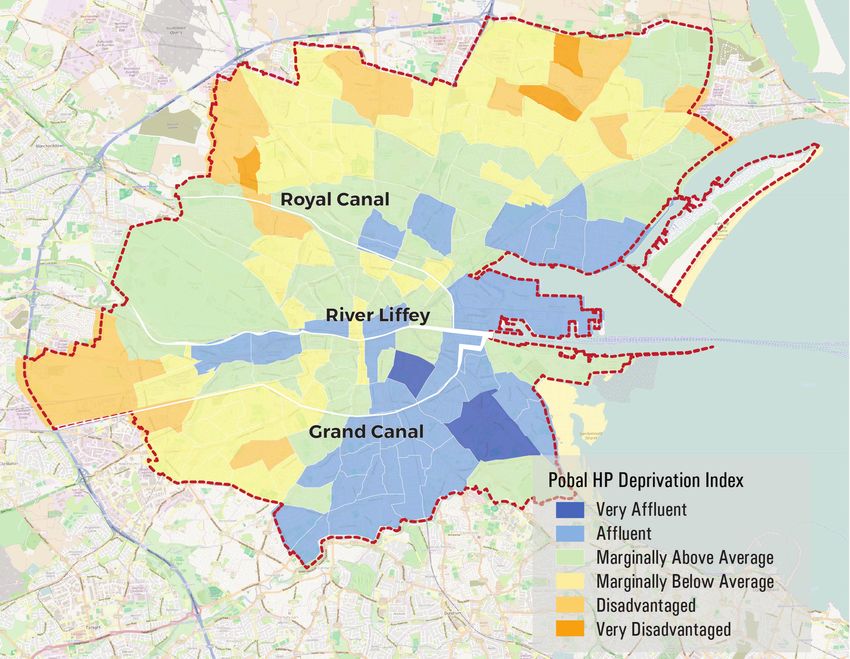
LOCAL ECONOMIC AND COMMUNITY PLAN 2016-2021

TABLE OF FIGURES
Figure 1 Population and population       Figure 14 Proportion of people with a
change Dublin City Council               disability, Dublin City, 2011
Administrative Areas, 1991 – 2011
                                         Figure 15 Creative industries, Dublin
Figure 2 Age structure, Dublin City,     City, 2015
2011
                                         Figure 16 Dublin and National
Figure 3 Type of household, Dublin       unemployment rate (%), 2006 - 2015
City (%)
                                         Figure 17 Employment by economic
Figure 4 Voter Turnout, Local            sector, selected years - Dublin 000’s
Elections 2014, Dublin City
                                         Figure 18 Breakdown of male /
Figure 5 Non-Irish population,           female employment in economic
Dublin City, 2011                        growth sectors, Dublin, Q1 2015

Figure 6 Affluence and Deprivation,      Figure 19 Highest level of education
Dublin City, 2011                        achieved, Dublin City, 2011

Figure 7 Socio-economic group,           Figure 20 Proportion of Dublin
Dublin Local Authorities (%), 2011       City population with a technical or
                                         vocational qualification up to PhD,
Figure 8 Residential Land                2011
Availability Survey 2014
                                         Figure 21 Ecosystem for
Figure 9 Percentage of people living     Entrepreneurship
in owner occupied dwellings, Dublin
City, 2011                               Figure 22 Mode of transport for
                                         Dublin City workforce, 2011
Figure 10 Percentage of people
living in private rented dwellings,      Figure 23 Daily commuting patterns
Dublin City, 2011                        into Dublin City, 2011

Figure 11 Percentage of people           Figure 24 Local and Regional Drug
living in dwellings rented from the      Task Force Areas, Dublin City
local authority or voluntary housing
body, Dublin City, 2011                  Figure 25 Percentage of people who
                                         had used an illegal drug, 2009/10
Figure 12 Dublin Office Market
2015                                     Figure 26 Dublin Performance
                                         Indicators
Figure 13 Access to broadband,
Dublin City, 2011

                                                                                 II
                                                                                 5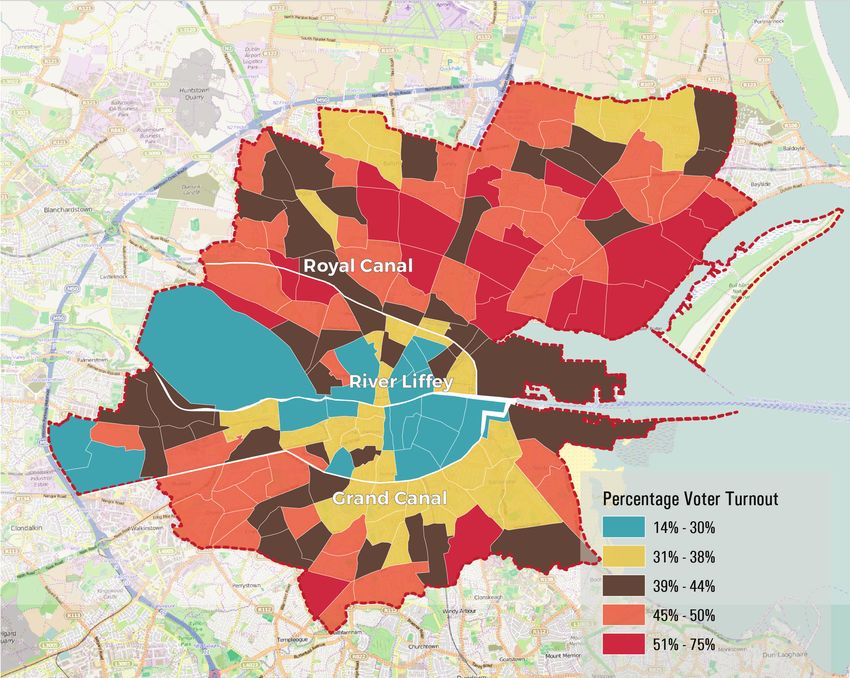
DUBLIN CITY

  FOREWORD

              This Local Economic and Community Plan has identified the key strategic goals that will
              inform the future local economic and community development of Dublin City. This plan
              should act as a key reference document for all publically funded-bodies and other agencies
              operating in the city. Over time and with agreement, it will help co-ordinate the activities of
              all involved, thus ensuring better results for those living, working, and investing in the city.

              In identifying these goals the various people and organisations involved have been
              conscious of the need to both support the emerging economic recovery and to ensure
              that the benefits of the recovery are equitably distributed. This process has presented
              an opportunity to prioritise and integrate the actions of Dublin City Council and others
              involved in the areas of economic and community development.

              We are cognisant that this plan is prepared within the existing resource limitations prevalent
              in our current fiscal situation. While many of the issues and priorities listed in the plan,
              such as infrastructural improvement, are regional or national in nature, we are advocating
              the delivery of these projects in order to meet the challenges that are faced by Dublin as
              the capital city.

              Dublin City Council will actively engage with all agencies and players in pursuing the
              necessary investment to improve the lives of all those who work, live, invest in or visit
              Dublin City.

              This is an action-based plan which will be the focus of the work for the Economic
              Development and Enterprise Strategic Policy Committee and the Local Community
              Development Committee in the coming years. These committees are charged with
              implementing and monitoring the plan.

              The next 12 months will be spent collaborating with individuals and organisations in
              identifying further actions that will contribute to the achievement of our high-level goals.

              The Local Economic and Community Plan will therefore become the cornerstone for
              socio-economic development in the City for the next six years.

                     Councillor Daithí Doolan                   Councillor Paul McAuliffe
                     Chair                                      Chair
                     Dublin City Local Community                Dublin City Economic
                     Development Committee                      Development and Enterprise
                                                                Strategic Policy Committee
  III6
LOCAL ECONOMIC AND COMMUNITY PLAN 2016-2021

ACKNOWLEDGEMENTS

 The Dublin City Local Community Development Committee and the Economic
 Development and Enterprise Strategic Policy Committee would like to thank Éadaoin
 Ní Chléirigh and Odran Reid who facilitated the consultation workshops, and Dr John
 FitzGerald and Dr Deiric Ó Broin who made presentations to give context at the
 workshops.

 The two Committees would also like to thank Dr Brendan Williams, Lecturer in Urban
 Economics and Director of the Urban Environment Research Project at the UCD School
 of Architecture, Planning and Environmental Policy, the members of the Dublin City
 Council Economic Working Group and the team at Future Analytics Consulting for their
 assistance in the drafting of this Local Economic and Community Plan.

 Finally, we would like to extend our gratitude to the individuals, community organisations
 and business representatives who took the time to lend their expertise and experiences
 to this Plan through attendance at consultations and written submissions.

                                                                                          IV
                                                                                          7
DUBLIN CITY

   8
LOCAL ECONOMIC AND COMMUNITY PLAN 2016-2021

                        SECTION 1
INTRODUCTION AND BACKGROUND TO
  THE DUBLIN CITY LOCAL ECONOMIC
   AND COMMUNITY PLAN 2016 - 2021

                                                    1
DUBLIN CITY

INTRODUCTION AND BACKGROUND TO
THE DUBLIN CITY LOCAL ECONOMIC AND
COMMUNITY PLAN 2016 - 2021

              Vision for the Dublin City Local                                         Committee (LCDC) and Social Inclusion
              Economic and Community Plan                                              and Community Activation Programme
              2016 – 2021                                                              (SICAP) Implementers.

                                                                                       The actions set out are dependent on
                         To grow and sustain a city                                    budget provisions and resource allocations
                      based on principles of equality,                                 for 2016.
                     social justice and environmental
                      sustainability where the needs                                   During this, the first year of the LECP, Dublin
                      of thriving, active and engaged                                  City Council, the LCDC and the Economic
                     local communities are served by                                   Development and Enterprise Strategic
                          a strong local economy.                                      Policy Commitee (SPC) will monitor the
                                                                                       progress made in the 2016 Action Plan,
                                                                                       including the identification of any gaps or
              The Dublin City Local Economic and                                       duplications in activity that may exist. Work
              Community Plan (LECP) 2016 – 2021 sets                                   will be carried out in 2016 to develop actions
              out 12 high-level goals for the six-year                                 for 2017 that will capture the activity of
              lifetime of the Plan1. These priorities and                              other public and publically-funded bodies.
              goals were set through consultation with                                 To this end, some key overarching actions
              members of the public, local community
                                                                                       for Dublin City Council, the LCDC and the
              organisations and businesses and with
                                                                                       SPC for 2016 are as follows:
              elected representatives of Dublin City
              Council (DCC), and the context and rationale
                                                                                           •     Continue to develop and update the
              for each goal have been established
                                                                                                 publicly available socio-economic
              through examination of relevant national
                                                                                                 profile of the City, with further analysis
              and local statistical evidence (see Section
                                                                                                 carried out to inform actions for 2017.
              4).
                                                                                           •     Identify, within the monitoring
              The specific objectives and actions for the
              achievement of the goals will be outlined                                          function of the LCDC and SPC, any
              and monitored on an annual basis. The                                              gaps, overlaps or areas for potential
              2016 Action Plan contains actions to be                                            collaboration    between     relevant
              carried out in 2016 by relevant Dublin City                                        service providers to ensure the
              Council departments singly or in conjunction                                       optimum use of resources.
              with named organisations, members
              of the Local Community Development

              1 The
              1 The 12
                    12 high-level
                       high-level goals
                                  goals for
                                        for the Dublin City LECP are not numbered according to priority.
   2          according to priority.
LOCAL ECONOMIC AND COMMUNITY PLAN 2016-2021
• In-depth engagement with local • The Core Strategy and objectives of
communities and community the Dublin City Development Plan,
and voluntary organisations to including any environmental-related
establish more local priorities and policies and objectives
actions relevant to the six-year
goals. Participation will include • Any other City Development Plan
representatives of groups protected provisions responsible for the
under equality legislation and people protection and management of the
living in, or at risk of, poverty. environment including environmental
sensitivities.
• Engage with public and publicly-
funded bodies not represented on
the LCDC/Economic Development
and Enterprise SPC to agree Dublin City Local Economic and
strategic priorities and actions to be Community Plan 2016 - 2021
included in the Action Plan for 2017
and subsequent years. Local Government Reform in Ireland
A key purpose of local government, as
• Further examination of suggestions
stated in Putting People First, Action
for actions received as part of the
Programme for Local Government (2012)
consultation process on the high-
is to ‘promote the well-being and quality of
level goals.
life of citizens and communities’. Following
a national programme of local government
• Devise a plan of work for the LCDC
reform initiated in 2012 with the publication
to draw on the experience, expertise
of Putting People First and enacted in the
and resources of the combined
Local Government Reform Act, 2014,
membership of the LCDC.
the community, local and economic
development functions of local authorities
• Develop and maintain a working have been expanded and given renewed
relationship between the LCDC and focus.
the Economic Development and
Enterprise SPC through the LECP One of the measures of local government
Advisory Steering Group. reform requires each local authority across
the State to develop a Local Economic
• Work with the relevant agencies to and Community Plan which will identify
develop the Dublin Region Action and implement actions to strengthen and
Plan for Jobs. develop the economic and community
dimensions of the local authority area
over a six-year period. The bodies jointly
Implementation of the LECP shall be tasked with developing, implementing and
consistent with the following: monitoring the LECP are the Dublin City
Local Community Development Committee
• The Regional Planning Guidelines and the Economic Development and
or Regional Spatial and Economic Enterprise Strategic Policy Committee.
Strategy (whichever is in place)
3DUBLIN CITY
The Dublin City Local Community The Social Inclusion and Community
Development Committee Activation Programme
The Dublin City LCDC, established in SICAP is the successor programme to
2014, is a statutory body with membership the Local and Community Development
drawn from Dublin City Council, other State Programme. It commenced nationally on
agencies, the community and voluntary 01 April 2015 and the current programme
sector and the private sector (see Appendix will run until December 2017. It aims to
1 for a list of the members of the LCDC). reduce poverty and to promote social
The LCDC meets on a regular basis and is inclusion and equality with a focus on
responsible for: disadvantaged areas and a number of
target groups at risk of social exclusion.
• The preparation, implementation, The programme has three broad goals:
monitoring and review of the community development; education and
community element of the LECP training; employment and self-employment.
• Co-ordinating, planning and
overseeing local and community In Dublin City, delivery of the programme
development funding, namely the in five areas of the City was put to a
Social Inclusion and Community competitive tendering process and is now
Activation Programme being delivered by the five successful
• Bringing a more joined-up approach tendering organisations (see Appendix
to the implementation of local 3 for the five SICAP areas (‘Lots’) and
and community development Programme Implementers).
programmes and interventions
• Ensuring a focus on learning and
feedback, enhancing the links
between service delivery and policy
development
• Pursuing opportunities for additional
funding for the area
4LOCAL ECONOMIC AND COMMUNITY PLAN 2016-2021
Dublin City Public Participation Network Role of the LECP Advisory Steering Group
An additional new structure relevant to the An Advisory Steering Group was formed
landscape of local government reform and in September 2014 to oversee the drafting
alignment with local development is the of a single, integrated Local Economic
Public Participation Network (PPN). The and Community Plan. The Advisory
Dublin City PPN will be the main vehicle Steering Group is made up of members
through which community representatives of the LCDC and the SPC, together with
can participate in local decision-making Dublin City Council staff responsible for
structures such as the Strategic Policy providing administrative support to the
Committees of the City Council, the Local two committees. The specific remit of the
Community Development Committee, Joint Advisory Steering Group includes:
Policing Committees and other bodies.
• The development of the socio-
There are now more than 500 organisations economic profile and high-level
registered with the Dublin City PPN under goals
three strands: Community and Voluntary;
Social Inclusion and Environment. A • Arrangement and management of
Secretariat for the PPN was elected at the the consultation process for the
first plenary meeting of the Network in May community and economic elements
2015. of the LECP
• Management of communications
with other stakeholders in the
Economic Development and Enterprise LECP process (Regional Assembly,
Strategic Policy Committee Regional Economic Forum)
The Economic Development and Enterprise • Ensuring clarity as to who will lead
Strategic Policy Committee is one of seven / co-ordinate each action of the
SPC’s established in Dublin City Council, LECP
and is tasked with proposing and debating
alternative relevant policies, and advising • Ensuring consistency with the
the Council accordingly. The Economic Dublin City Development Plan and
Development and Enterprise SPC has 15 the Regional Planning Guidelines
members: 10 elected members of Dublin / Regional Spatial and Economic
City Council, and five additional external Strategy
sectoral representatives (see Appendix
2 for a list of members of the SPC). The • Advising and assisting on
implementation and monitoring of the implementation and monitoring
economic components of the LECP is to arrangements for the LECP
be undertaken by this SPC.
5DUBLIN CITY
Role of the Eastern and Midland Regional
Assembly
The establishment of the Eastern and
Midland Regional Assembly in January
2015 included provision for the role of
the Assembly in the consideration of the
Local Economic and Community Plans of
local authorities within their functional area.
The role of the Assembly relates to the
consistency of the LECP:
• With the core strategy and objectives
of the Dublin City Development Plan
• With any regional spatial and
economic strategy
• Between the community and
economic elements of the Plan
6LOCAL ECONOMIC AND COMMUNITY PLAN 2016-2021
SECTION 2
DEVELOPMENT OF THE DUBLIN CITY
LOCAL ECONOMIC AND COMMUNITY
PLAN 2016 – 2021
7DUBLIN CITY
DEVELOPMENT OF THE DUBLIN CITY LOCAL
ECONOMIC AND COMMUNITY PLAN
2016-2021
Strategic Environmental Staged Approach to the LECP
Assessment / Appropriate
Assessment The Dublin City LECP was developed in
several stages, in accordance with the
Requirements for Strategic Environmental final Guidelines on Local Economic and
Assessment are established by the Strategic Community Plans issued by the Minister
Environmental Assessment Directive2 and for the Environment, Community and Local
transposing Regulations3. A Draft Strategic Government in January 2015.
Environmental Assessment Screening
Report has been prepared which has Stage 1 Evidence-based decision
been informed by a submission made by making - Preparation of a socio-economic
the Environmental Protection Agency. The profile and draft high-level goals
conclusion of the Strategic Environmental
Assessment screening process is that In the initial stage of the development of
Strategic Environmental Assessment is not the LECP a socio-economic profile of the
required. administrative area of Dublin City Council
was commissioned. Each of some 70
Requirements for Appropriate Assessment social and economic indicators examined
are established by the Habitats Directive4 in the profile of the City were chosen to
inform the high-level goals of the six-year
and transposing Regulations5. The
Local Economic and Community Plan and
conclusion of the Appropriate Assessment
the subsequent objectives and actions to
screening process for this LECP is that
be carried out by the local authority and
further (‘Stage 2’) Appropriate Assessment
relevant partners. The data will also provide
is not required.
a benchmark for evaluating the impact of
these actions over time.
The socio-economic profile of the City
will be used to inform policy at all levels
in Dublin City Council. The report of the
socio-economic profile and the associated
background data have been made publicly
available and, as such, will be a valuable
2 Directive 2001/42/EC of the European Parliament and of the Coun-
cil of Ministers, of 27th June 2001, on the Assessment of the Effects of
Certain Plans and Programmes on the Environment
3 Communities (Environmental Assessment of Certain Plans and
2Programmes) Regulations 2004 (S.I. No. 435 of 2004) as amended
Directive 2001/42/EC of the European Parliament and of the Council of Ministers, of 27th June 2001, on the Assessment of the Effects of
by European
Certain Plans Communities
and Programmes (Environmental Assessment of Certain
on the Environment
3Plans and Programmes) (Amendment) Regulations 2011 (S.I No. 200
Communities (Environmental Assessment of Certain Plans and Programmes) Regulations 2004 (S.I. No. 435 of 2004) as amended by Eu-
of 2011).
ropean Communities (Environmental Assessment of Certain Plans and Programmes) (Amendment) Regulations 2011 (S.I No. 200 of 2011).
44 Council Directive
Council Directive 92/43/EEC of 21stMayMay1992
1992ononthe
theconservation
conservationofof natural habitats and of wild fauna and flora
5natural habitats and of wild fauna and flora
European Communities (Birds and Natural Habitats) Regulations 2011 (S.I. No. 477 of 2011)
8 5 European Communities (Birds and Natural Habitats) Regulations
2011 (S.I. No. 477 of 2011)LOCAL ECONOMIC AND COMMUNITY PLAN 2016-2021
resource for citizens, communities and Dublin City Gazette. Several media outlets
decision-makers across the city as well including The Journal, Dublin City FM
as regionally and nationally. In addition to and Near FM gave additional coverage
the socio-economic profile, a desk-based to the public consultation process. The
review of relevant national and European Dublin City Council web unit promoted
policy was carried out, the purpose of the public consultation on the Dublin City
which was to ensure consistency between Council website and via social media
the LECP and local and national plans, channels. Each of the five Dublin City
strategies and policies. Council Area Committees was briefed on
the consultation process and members
In the first quarter of 2015, the Dublin City were invited to make submissions and to
LCDC, the Economic Development and encourage constituents to do likewise.
Enterprise SPC and Dublin City Council
elected representatives participated in four The 500 member organisations of the
workshops to establish draft high-level Dublin City Public Participation Network
goals for public consultation. The goals and more than 100 community and
were identified on the basis of the work voluntary organisations, representative
of Councillors and committee members bodies and public sector organisations
on the ground in communities across were directly invited to make written
Dublin City. The identification of goals submissions. Members of the LCDC and
was further evidenced by examination of SPC also directly canvassed submissions
the socio-economic profile of Dublin City, from within their networks.
including statistics relating to key social,
demographic and economic indicators. Written submissions could be made via
email, by post or online on Dublin City
Arising from these workshops and through Council’s public consultation site, Citizen
the work of the LECP Advisory Steering Space. A total of 87 written submissions
Group, 12 high-level goals were prepared to the LECP were received by the deadline,
for public and stakeholder consultation. broken down as follows:
Stage 2 Public and Stakeholder • 40 not-for-profit organisations
Consultation • 23 private individuals
• 12 State / semi-State bodies
The 12 draft high-level goals for the City • 5 elected representatives (4 Dublin
for the six-year lifetime of the LECP were City Councillors and 1 TD)
put to formal public and stakeholder • 7 business / business representative
consultation during the month of June organisations
2015. Documentation was provided in
Irish and English and submissions in either
language were invited from all members
of the public and interested organisations.
The public consultation was advertised
in the Irish Times, the Herald, online Irish
language newspaper, Tuairisc, and in the
9DUBLIN CITY
In addition to written submissions, two The two documents that form the Dublin
stakeholder consultation sessions were City LECP (6-year strategy document and
held in June. More than 50 local community, 2016 Action Plan) were sent to all Dublin
voluntary and business organisations City Council elected members, the LCDC
attended a consultation session on 25 and the Economic Development and
June 2015. The session asked participants Enterprise SPC on 14 October 2015 and
to give specific input on each of the 12 an information session on the material was
draft high-level goals as well as to make held on 15 October in Council Chambers,
observations on the 12 high-level goals as City Hall. Members were invited to submit
a whole. written comments and suggestions on the
6-year strategy document and specific
On 29 June 2015 some 22 State elements of the Action Plan.
agencies attended a workshop; 13 State
bodies responded to a pre-consultation Six written submissions were received by
questionnaire, outlining relevant elements the Advisory Steering Group and these
of their strategies, which were used as a tool were presented to a joint meeting of the
to design the session. The session asked LCDC and SPC on 22 October. Following
participants to comment on the 12 high- discussion, the draft LECP was agreed,
level goals and to discuss how the State with amendments, by the LCDC and SPC
agency they represented could contribute at the meeting on 22 October.
to, or play a part in, the Dublin City LECP,
notwithstanding their national remit. Stage 4 Finalise Plan
Following a review by the LECP Advisory The draft Dublin City LECP was submitted
Steering Group of the contributions made to the November meeting of the Eastern
at the consultation sessions and of witten and Midland Regional Assembly and
submissions received, a set of 12 revised it was agreed at that meeting that the
high-level goals were drafted for approval draft plan was consistent with the core
by the LCDC and SPC. strategy and the objectives of the Dublin
City Development Plan 2011 - 2017, with
The 12 high-level goals were presented at the Greater Dublin Area Regional Planning
a joint meeting of the LCDC and SPC on Guidelines 2010 - 2022 and that the draft
14 July 2015. Following discussion and plan demonstrated consistency between
some amendments, the 12 high-level goals the community and economic objectives.
were formally adopted by each committee.
On 07 December, Dublin City Council
considered and adopted the Plan.
Stage 3 Development of objectives and
actions
Objectives and actions for the 2016 Action
Plan were gathered from relevant DCC
departments, LCDC members and SICAP
Programme Implementers.
10LOCAL ECONOMIC AND COMMUNITY PLAN 2016-2021
SECTION 3
DUBLIN IN BRIEF
11DUBLIN CITY
DUBLIN IN BRIEF
A Snapshot of Dublin City Population and population change
Dublin City Council is the largest local In the 20-year period from 1991 to 2011 the
authority in Ireland, covering an area that population of Dublin City increased by 10
stretches from Donaghmede in the north- per cent compared to a larger increase in
east to Terenure in the south of the City and the State population over the same period
bordered by the Phoenix Park to the west of 30 per cent and a population growth of
and Dublin Bay to the east. some 79 per cent in Fingal County. Kildare,
Meath and Wicklow had increases of 72,
The political, cultural and economic capital 75 and 41 per cent respectively.
of Ireland, Dublin City is home to some
527,612 people (Census 2011) and host Additionally, the increase has not been
to many workers, students and visitors on uniform across the City (see Figure 1). In
a daily basis. Preliminary figures estimate fact, during that 20-year period the area of
that population growth in the Dublin region the City that lies between the Canals saw a
accelerated significantly in the 2014 to population increase of 62 per cent while the
2015 period, with an increase in population population of the rest of the City declined
of 30,000 forecast. These figures will be slightly (-1%) with many electoral divisions
revised following the publication of the seeing a loss of population. This reflects
2016 Census of Population. the high level of apartment building in the
inner city from the late 1980s onwards.
Given strong national and regional
increases in population in this period, this
loss of population is notable. Almost half
of the 162 Electoral Districts in Dublin City
Council saw population decline.
Figure 1: Population and population change Dublin City Council Administrative Areas,
1991 – 2011
130,605 127,484 125,091 122,363 125,597
118,306 114,821 116,396
111,287 112,110
112,440 114,589
95,018 102,385 109,693
105,259
97,035 100,810
95,287 93,255
67,309
60,056
54,213
40,017
44,911
1991 1996 2002 2006 2011
Dublin South East Dublin North West Dublin South Central Dublin North Central Dublin Central
12 Source: CSO, Census 2011LOCAL ECONOMIC AND COMMUNITY PLAN 2016-2021
Age structure of Dublin City Emigration balanced by in-migration
In 2011, a relatively large proportion (32%) Given the severity of the recent economic
of the population of Dublin City was in the downturn, many commentators had
20 – 34 year age group, making Dublin calculated that mass emigration had
a young city, often referred to as a key returned over the census period. However,
strength in attracting investment and labour the 2011 Census figures show in fact that
into the city. However, the proportion of there was net positive in-migration of
children (0 - 14 years) living in Dublin City 122,292 in the period 2006-2011. This
was relatively low at 15 per cent, compared does not infer that there was no migration
with 24.2 per cent in neighbouring Fingal out of the country but that more people
and a State average of 21.3 per cent. The moved into Ireland than left it over the
population pyramid of Dublin City in Figure five-year Census period. The years 2010
2 shows the population bulge of people in – 2012 demonstrate the emergence of
their 20s and 30s with a drop off at family net emigration for the first time since the
formation stage. This raises the question mid-1990’s.
of whether the city is equipped for family
friendly living and what can be done to
improve the urban offering for families with Households and families in Dublin City
children. The benefits of attracting families
with children to live in city centre areas are In 2011 there were 500,000 people living
manifold and include economic growth in 208,008 private households in Dublin
and an important source of tax revenue, City. The remainder of the population and
in addition to increased urban diversity, visitors to the city present on the night
civic engagement, meaningful personal of the Census were spread across 708
relationships, neighbourhood stability and communal establishments.
vigilance and reduced urban sprawl (Alves,
2013). The Census 2011 figures also show
that some 31 per cent of households in
Figure 2: Age structure, Dublin City (%), Dublin City were one-person households
2011 as compared with 17 per cent in Fingal
85 years and over Female
and South Dublin and 23 per cent in Dún
80 - 84 years Male
Laoghaire-Rathdown (see Figure 3). The
75 - 79 years proportion of single-person households in
70 - 74 years Dublin City is relatively low when compared
65 - 69 years with EU cities of similar population size.
60 - 64 years
For example Antwerp, Manchester and
55 - 59 years
50 - 54 years
Nice have proportions of single-person
45 - 49 years households of 45, 43 and 40 per cent
40 - 44 years respectively. Other large EU cities have
35 - 39 years notably higher proportions such as 55
30 - 34 years per cent in both Amsterdam and Berlin
25 - 29 years (Eurostat, 2012).
20 - 24 years
15 - 19 years
10 - 14 years
5 - 9 years
0 - 4 years
6 4 2 2 4 6
13
Source: CSO, Census 2011DUBLIN CITY
Figure 3: Type of household, Dublin City Age structure
(%), 2011
It has been suggested that Ireland’s
relatively young population may result in
some competitive advantage over the
medium term. This is based on the fact that
Ireland will have a proportionately greater
working-age population than other EU
countries with consequently less pressure
on pensions and services for older people.
Although the population of Ireland is on
average younger than other EU countries,
medium- and longer-term planning for an
ageing population is important. As the
population ages over the next few decades,
Source: CSO, Census 2011 this will have implications in the following
areas:
In 2011 some 11 per cent of households (or • The amount and type of health
22 per cent of families) in Dublin City were services
headed by a lone parent, the vast majority • The cost of funding health services
of whom (88%) were women. The link • Pension funding
between lone parenthood and poverty has • Technologies for assisted living and
been well documented in poverty research. universal design
In 2013, the EU Survey on Income and • Housing markets and wealth
Living Conditions (EU SILC) found that lone distribution
parent households experienced higher at • Family support structures and
risk of poverty rates (31.7%), deprivation community care
rates (63.2%) and consistent poverty rates
(23%) than any other type of household. These issues are already being examined
by, among others, Age Friendly Ireland
Again according to Census 2011, the and by the Centre for Ageing Research
average household size in Dublin City was and Development in Ireland, and Dublin
2.40 compared with 2.73 for the Greater City Council has committed to developing
Dublin Area. Average household size in the an age-friendly city. While an ageing
State has fallen from 3.14 in 1996 to 2.73 population structure presents challenges,
in 2011. it also presents social and economic
opportunities.
These demographic trends can be viewed
as the starting point for consideration of the
strengths, weaknesses, opportunities and
challenges facing the city and its people in
the coming period. According to Williams
et al (2012), critical issues arising include:
14LOCAL ECONOMIC AND COMMUNITY PLAN 2016-2021
Sprawl and dispersion Working collaboratively through
the LECP process
The evidence from a number of sources
shows that Dublin has a sprawl-type urban There are many examples of inter-agency
and regional settlement pattern, that is, one work happening across the City - the
which is based on low-density housing and willingness of organisations across the
high car-dependency. The 2011 Census community and voluntary, business and
confirms that a pattern of population public sectors to engage with the LECP
dispersal has continued even during the process has further demonstrated this
recession. This presents challenges with openness to working together. During
regard to: 2016, enhanced cooperation between the
bodies responsible for the implementation
• Provision of infrastructure of the LECP, and other agencies with a
• Provision of social services remit for local economic and community
• Complex commuting patterns and development, will provide for shared
accessibility strategies and implementation with a
• Energy costs mechanism for monitoring and evaluation.
However, the on-going issue of conflicting
Local Government remit in Ireland boundaries or geographical areas of remit
of various public bodies and programmes
Local Government in Ireland has a limited of work for example Dublin City Council;
level of independence from central Social Inclusion and Community Activation
government as financial autonomy remains Programme; An Garda Síochána; the
restricted and decision-making on key Health Service Executive; Children and
priorities is still often relatively centralised. Young People’s Services Committees;
A key legacy issue of the recent financial Local Drug and Alcohol Task Forces; the
crisis is the lack of investment in social and Education Training Board / City of Dublin
community infrastructure. Ownership of Youth Services Board and the Department
budget decisions at local level offers the of Social Protection can make inter-agency
potential to uncover new and innovative work or collaboration challenging and
solutions to local funding. As a sector, local data-gathering and comparative analysis
government will need to be practical in difficult.
balancing the efficient collection of charges
against the reality of the current economic
situation.
15DUBLIN CITY
Public procurement opportunities
One of the current key developments in and in the operation of the new campus.
the city, the Dublin Institute of Technology Likewise, Grangegorman Development
Grangegorman Campus represents good Agency has given due consideration to
practice examples in the area of using the impact on the local communities
public procurement as a resource for of the increased number of students
social or community benefit. The voluntary expected to live in the area in their report
Grangegorman Labour and Learning ‘Studentificaton’.
Forum has worked with the Grangegorman
Development Agency to develop a
Grangegorman Employment Charter to
ensure that the local community benefits
from employment opportunities arising
from the project during construction phase
16LOCAL ECONOMIC AND COMMUNITY PLAN 2016-2021
SECTION 4
12 HIGH-LEVEL GOALS AND
EVIDENCE BASE
17DUBLIN CITY
12 HIGH-LEVEL GOALS AND
EVIDENCE BASE
Ensure that all residents and visitors, regardless of social
1 or cultural background, feel a sense of ownership and
engagement with the City, feel safe in their communities
and are welcome to fully participate in the community,
social, cultural, business and political life of the City.
2 Work in partnership with communities to promote social
inclusion, tackle poverty and disadvantage, and promote
participation, empowerment and positive social change.
housing
Support the adequate provision of a range of mixed-tenure,
3 housing
affordable,
housing adaptable housing and work spaces that are fit
for purpose in economically, socially and culturally mixed
and sustainable neighbourhoods.
4 Put in place the infrastructure that positions Dublin as a
safe, environmentally sustainable, vibrant, diverse and
attractive place to live, work, visit and invest in by planning
and providing for balanced and sustainable social and
economic development, catering for a growing population.
Provide and protect a range of public, safe and affordable
5 amenities, activities and facilities that are relevant and
accessible to people of all ages and abilities and that
contribute to the health and well-being of all.
Maximise opportunities and support for the creative
6 industries and cultural and artistic sectors to develop.
Promote the Irish language and access to cultural
experiences for all through the provision of diverse cultural
artistic programming.
18LOCAL ECONOMIC AND COMMUNITY PLAN 2016-2021
Identify and support the growth sectors such as tourism,
7 technology, food chain, education, retail and green
business that will create, sustain and grow quality
employment and self-employment opportunities for all.
Promote
education access to a range of education, training and
developmental opportunities starting in early childhood,
8 education
leading to a culture of lifelong learning and an appropriately
education
qualified and skilled workforce.
€
€ 9 smeDevelop
and start up
theeco-system of start-ups, social enterprise,
smemicro-business
and start up and small business in the city economy.
€
sme and start up
Support the continued development of a quality, affordable
and accessible movement system within the City
10 prioritising walking, cycling and quality public transport
which serves both the needs of local neighbourhoods
and the economy of the City and the health and well-
being of all.
Tackle the causes and consequences of the drugs crisis
11 and significantly reduce substance misuse across the
City through quality, evidence-informed actions.
drugs
drugs
drugs
Enhance the recognition of Dublin as a globally connected
12 city region and as the national economic generator.
19DUBLIN CITY
GOAL 1
Ensure that all residents and visitors, regardless of social or cultural
background, feel a sense of ownership and engagement with the City,
feel safe in their communities and are welcome to fully participate in the
community, social, cultural, business and political life of the City.
Dublin City has a long tradition of Voter turnout in Dublin City
community participation, volunteerism and
social and political activism. With many Voter turnout is considered internationally
active residents associations, volunteers, a as a useful means of measuring civic and
Dublin City Comhairle na nÓg, faith-based political engagement. In the 2014 local
groups, interest groups, 500+ community elections, Dublin City had one of the lowest
and voluntary organisations and a number turnout rates nationally, with an average of
of national representative organisations
housing 43 per cent, while the State average was
based in the city, there is huge opportunity 52 per cent. Figure 4 shows the difference
to leverage further community engagement in turnout levels across the city, with less
in local and citywide activity. than 30 per cent of those registered to
vote casting a ballot in parts of the inner
Volunteering city and suburbs to the west. In contrast,
turnout in other parts of the city was much
The issue of volunteering was first explored higher. It is worth noting that the voter
in the 2006 Census which found that at that turnout in Dublin City for the more recent
time there were 60,648 people engaged in Marriage Equality Referendum in 2015 was
voluntary activity in Dublin City. Voluntary much higher at 62 per cent. Again taking
activity was spread across several spheres: the example of suburbs to the west of the
social / charity (36%), religion (31%), sport city, turnout increased from 30 per cent in
(23%) and politics / culture (10%). Gender the 2014 local elections to between 40 and
difference across activity was notable with 50 per cent in the referendum just one year
more men volunteering in sport and politics later.
/ culture and more women taking part in
social / charity work and religious groups.
More recently, in 2013, the Quarterly
National Household Survey (QNHS)
revisited volunteering and found that 28
per cent of people in the Dublin region (four
Dublin local authority areas) had volunteered
their time in the four weeks prior to the
survey. This compares to the highest rate
of volunteerism found nationally in the Mid-
West region at 37 per cent.
education
20LOCAL ECONOMIC AND COMMUNITY PLAN 2016-2021
Figure 4: Voter Turnout, Local Elections 2014, Dublin City
Source: Dublin City Local Returning Officer, 2014
Safety in the City In 2013, 75 per cent of 1,200 respondents
to an official Dublin City Council online
While safety and security issues are always survey reported that they felt safe in Dublin
of paramount concern for the city, Dublin city centre during the day. At the same
City can be considered a relatively safe time, just 35 per cent of respondents stated
city in international terms. In the Garda that they felt safe in the city centre at night
Dublin Metropolitan Region, the highest (Your Dublin, Your Voice 2013). Some 36
numbers of recorded offences in the year per cent of respondents to an earlier Your
up to Q1 2015 were in the categories; Dublin, Your Voice survey in 2010 were of
‘Theft and related offences’, ‘Burglary and the opinion that anti-social behaviour was
related offences’ and ‘Damage to property the ‘worst thing about Dublin’.
and the environment’. The fourth highest
number of recorded offences was in the Harassment, bullying and intimidation
category ‘Public order and other social (including that which is homophobic,
code offences’ which showed a decrease gender-based or racially motivated) in the
on the figure for the preceding year (CSO, public realm create fear and the perception
2015). However, in recent years there has that Dublin is not safe. Public space
been increasing concern among the public belongs to all residents of, and visitors to,
over levels of anti-social behaviour in some the City who have an equal right to move
parts of the city. freely about the City and to engage in all
the City has to offer without fear or anxiety
for their well-being or belongings.
21DUBLIN CITY
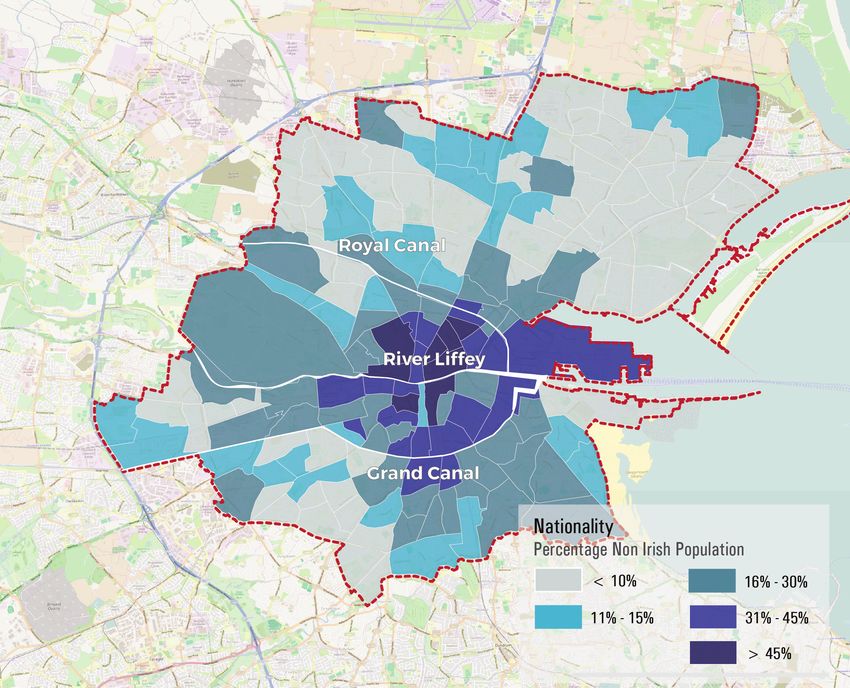
Integration and diversity
In 2011, some 18 per cent (98,699 persons) Racism’s iReport.ie system for reporting
of Dublin City residents were of non-Irish racist incidents was alerted to 125 racist
nationality, with the majority from countries incidents nationally, 59 of which occurred
within the EU-27. In some parts of the city in Dublin. It is therefore incumbent on
the migrant population is as high as 65 per Dublin City Council and other stakeholders
cent while in other areas the population is to ensure that diversity and integration is
much less diverse (CSO, 2011). managed in such a way that any potential
discrimination or exclusion is minimised.
Cultural diversity in cities can represent a
valuable social and economic resource.
In the six-month period July to December
2014, the European Network Against
Figure 5: Non-Irish population, Dublin City, 2011
Source: CSO, Census 2011
22LOCAL ECONOMIC AND COMMUNITY PLAN 2016-2021
GOAL 2
Work in partnership with communities to promote social inclusion, tackle
poverty and disadvantage, and promote participation, empowerment
and positive social change.
Community Development Affluence and deprivation in Dublin
City
There are many strands tohousing public policy
that play a role in the alleviation of poverty According to the Pobal Haase Pratschke
and the promotion of social inclusion such (HP) Deprivation Index, more than half of
as taxation policy, social welfare, housing, the population of Dublin City are marginally
health and education. The principles and above average, affluent or very affluent at
practice of community development are a electoral district (ED) level. Figure 6 shows
key component in the fight against poverty clearly that the distribution of affluence
and the drive for greater social inclusion across the city is uneven, with 75 per cent
and equality. Community development of residents in the Dublin City Council South
affords the right to communities (both East area ranked as affluent or very affluent
geographical and communities of interest) while the same is true for just 5 per cent
to act for positive social change and to of residents in both the South Central and
address issues in their own communities North Central areas.
and in wider society.
Figure 6: Affluence and Deprivation, Dublin City, 2011
education
€
sme and start up
Source: Pobal HP Deprivation Index (Haase and Pratschke, 2012) 23DUBLIN CITY
Conversely 48 per cent and 62 per cent of People in Dublin were less likely to be at
residents in the North Central and North risk of poverty or living in consistent poverty
West areas respectively are categorised as than any other region in Ireland.
marginally below average, disadvantaged
or very disadvantaged. Socio-economic grouping classifies the
population into categories based on the
A more in-depth examination of the level and skill of the occupation or former
deprivation index at neighbourhood level occupation of those at work, retired or
shows pockets of disadvantage within unemployed. All others are classified
some of the most affluent areas of Dublin according to the grouping of the person in
City. the household on whom they are deemed
to be dependent. Figure 7 shows that in
The latest release of the EU Survey on 2011, some 20 per cent of people in Dublin
Income and Living Conditions (EU SILC City fell within the non-manual worker
2013) which measures poverty and category similar to other Dublin Local
deprivation rates across the EU-27, Authority areas. However, less than 15
showed the proportions of the population per cent were Employer / Managers while
of the Dublin region that were at risk of this was true for higher proportions in Dún
poverty (9.1%), experiencing deprivation Laoghaire Rathdown (27%), Fingal (20%)
(28.1%) and living in consistent poverty and South Dublin (17%).
(4.9%)6. Key influencing factors on these
rates were: being unemployed, being
unable to work due to a disability or illness,
living in social housing, parenting alone or
being a child (under 17 years).
Figure 7: Socio-economic group, Dublin Local Authorities (%), 2011
Source: CSO, Census 2011
6 At
6
At risk
risk of
of poverty
poverty rate
rate isis the
the share
share of
of the
the population
population living
living below
below 60% of the national median income; the deprivation rate is the share of
60% of the national
households that are median
unable to income; theleast
afford at deprivation rate isbasic
two of eleven the share
goods or services; the consistent poverty rate is the share of the population
of households
who are at riskthat are unable
of poverty and to afford at least
experiencing two of deprivation
enforced eleven basic
goods or services; the consistent poverty rate is the share of the
population who are at risk of poverty and experiencing enforced
24 deprivationLOCAL ECONOMIC AND COMMUNITY PLAN 2016-2021
Life-cycle and target group
approach to social inclusion
Outside of area-based measures, the
National Action Plan for Social Inclusion
2007 – 2016 set specific targets and
actions for tackling poverty and social
exclusion across a range of policy areas
and across the life-cycle: children, people
of working age, people with disabilities,
older people and communities. The new
Social Inclusion and Community Activation
Programme targets people living in
disadvantaged areas and specific groups:
lone parents, new communities, people
with disabilities, the unemployed (including
youth), Roma and Travellers.
The Traveller and Roma communities are
particularly vulnerable to poverty and social
exclusion and face barriers in accessing
education, training, employment and
services. At Census 2011 there were
2,000 Travellers living in Dublin City; the
Census did not include ‘Roma’ as an ethnic
identifier although it is estimated that there
are 5,000 Roma people living in Ireland
(Nasc, 2015).
25DUBLIN CITY
GOAL 3
Support the adequate provision of a range of mixed-tenure,
affordable, adaptable housing and work spaces that are fit for
housing
purpose in economically, socially and culturally mixed and sustainable
neighbourhoods.
Housing supply and demand moved into housing. At the rough sleeper
count in winter 2015, there were 91 people
In 2011 the total housing stock of Dublin confirmed sleeping rough in the Dublin
City was 241,678, with a vacancy rate of region on that night. This was a 46 per cent
10 per cent. In 2014, there were 914 house decrease since 2014 when 168 people
completions in Dublin City. The Regional were confirmed as rough sleeping.
Planning Guidelines 2010 - 2022 estimate
that an increase in the population of Dublin The role of the local authority in direct
City to 606,110 in 2022 means that housing provision of housing has been reducing in
completions need to reach 4,217 per year the past decades. In line with national policy,
in order to meet future demand. local authorities have an essential role in the
facilitation of housing development through
In July 2015 there were 21,592 applications the preparation and review of development
on the Dublin City Council social housing plans. The zoning and servicing of lands
waiting list comprising 25,617 adults and for residential housing development plays a
16,489 children. In 2014, almost 5,000 major role in the functioning of the property
adult individuals accessed homeless market. Current estimates for the amounts
accommodation in the Dublin Region and of land zoned for development in the Dublin
almost 800 of these service users were area are provided in Figure 8.
Figure 8: Residential Land Availability Survey 2014
Stage 1 Stage 2
Potential
Area (Ha.) Area (Ha.) Potential Number of
Local Authority Number of
Available Available Dwellings
Dwellings
Dublin City 298 29,694 298 29,694
Dún Laoghaire Rathdown 557
education 26,456 399 19,710
Fingal 1,159 36,025 1,159 36,025
South Dublin 798 31,276 798 31,276
Total 2,812 123,451 2,654 116,705
Source: Department of the Environment, Community and Local Government, February 2015
€
sme and start up
Stage 1: Local Authorities identified the total level of undeveloped lands that were
residentially zoned as of the 31 March 2014, regardless of the sequence of the
development of those lands or phasing under local authority development plan core
strategies.
Stage 2: Local Authorities identified from the parcels of land identified in Stage 1 those
lands which were potentially available for development in relation to the order or priority
26
or phasing indicated under the relevant Development or Local Area Plan period.LOCAL ECONOMIC AND COMMUNITY PLAN 2016-2021
Occupancy types across Dublin
City
In 2011, 52 per cent of households in Dublin Figures 9, 10 and 11 show the spread and
City were owner occupied while 32 per cent concentration of different types of tenancy
were rented from a private landlord and a across the city.
further 13 per cent were rented from Dublin
City Council or an Approved Housing Body.
Figure 9: Percentage of people living in owner occupied dwellings, Dublin City, 2011
Source: CSO, Census 2011
27DUBLIN CITY
Figure 10: Percentage of people living in private rented dwellings, Dublin City, 2011
Source: CSO, Census 2011
Figure 11: Percentage of people living in dwellings rented from the local authority or
voluntary housing body, Dublin City, 2011
28
Source: CSO, Census 2011LOCAL ECONOMIC AND COMMUNITY PLAN 2016-2021
These figures indicate high concentrations now (Q3 2015) just 2.3 per cent lower than
of private rented accommodation in the their highest point in 2007, with the average
inner city and south-east of the city, and monthly rent for a three bedroom semi-
similar high concentrations of social detached house in Dublin costing €1,222
housing in twelve electoral districts across and €1,017 for a one-bedroom apartment
a few areas of the city. In 2005, the Irish (PRTB, 2015).
Housing Unit described the potential
negative economic, social and community The high cost of private rental property in
effects of housing estates where social Dublin has a disproportionate effect on low
housing is the predominant occupancy income earners. Low earnings, together
type, including low availability of commercial with a high demand for accommodation,
and other services, less opportunity for put people in receipt of rent supplement
local employment (due to the low number at increased risk of homelessness. The
of local businesses), less outward social maximum rent allowable for a single person
networking and higher stigmatisation on the rent supplement scheme in Dublin is
of, and discrimination against, residents €520. As of December 2014, there were
(Norris, 2005). 24,630 people in receipt of rent supplement
in Dublin7. A recent plan to reform the
Working in partnership with communities private rental sector, A New Deal for
on regeneration projects to achieve social Tenants (2015), which contains measures
inclusion for sustainable neighbourhoods to provide rent certainty for tenants, was
and for contributing to health and well- enacted in late 2015.
being is a priority issue for this Plan.
Projects scheduled for commencement in According to the Department of the
2016 include: Environment, Community and Local
Government, a clear upward trend in house
• Charlemont Regeneration Project prices has evolved since the final quarter of
• Dolphin House Regeneration Project 2012. Problems of housing affordability are
• St Teresa’s Gardens Regeneration especially notable in Dublin. In the fourth
Project quarter of 2015 average asking prices
in Dublin North City, Dublin City Centre
and Dublin South City were €277,135,
€245,702 and €339,550 respectively. At
Affordability in the private rented that time, asking prices in Dublin South
and residential sales markets and North City were the second and third
highest nationally (daft.ie, January 2016).
The annual growth in rental costs in the
private sector in Dublin from Q3 2014 to Q3
2015 was 8.7 per cent, with house rents
increasing by 9.3 per cent and apartment
rents by 8.3 per cent. Rents in Dublin are
7
Rent supplement data for 2015 will be available in Q3 2016 29DUBLIN CITY
Commercial property market
sectors
Independent research reports on the development in Dublin characterized by
Irish economy and property markets note periodic booms and slumps over the five
significant volatility in the Irish and Dublin decades since the 1960s. Following the
property markets in 2015 (OECD, 2015). period from 2007 to 2014, when little or
Following the collapse of the property no office development occurred across
markets in 2009 and a 50 per cent reduction the city and region, a recovery in demand
in asset prices, the economic recovery is for central office space is now emerging
having a significant impact with reduced and commercial office development has
vacancy levels and new demand emerging. recommenced in central Dublin. Figure 12
A failure of the supply process to meet new shows the increase in take-up in the Dublin
emerging demand is producing strong office market during 2015 and the marked
upward pressure on rents for commercial increase in office space under construction.
space and a shortage of affordable
housing in the Dublin market. It is clear
that the traditional speculative commercial
development process, with fixed, long-
term leases to occupiers, is under severe
pressure to respond to changing market
demands. New demand for affordable
space with tenant flexibility is a feature of
the emerging enterprise sectors.
Office sector
In common with the experience of many
Eurozone regional economies, prime office
space demand was greater than supply
for the first time in 2014 / 2015 since the
financial crisis, leading to a major reduction
of vacant space in Dublin’s Central
Business District. The shortage of supply
in prime central areas is likely to continue
in the short term as there is only limited
development currently in progress.
A combination of surges in speculative
peripheral development followed by
major market corrections have produced
a strongly cyclical pattern of office
30You can also read