Emerging Markets Outlook 2018 - Energy transition in the world's fastest growing economies - Climatescope
←
→
Page content transcription
If your browser does not render page correctly, please read the page content below
November
2018

Emerging Markets
Outlook 2018.
Energy transition in the world’s fastest
growing economies
Climatescope
                                                                                                                                   November 27, 2018

Contents

Section 1.                     Key findings                                                                                                          1
Section 2.                     Introduction                                                                                                          6
Section 3.                     Context                                                                                                               8
                               3.1. Concerns over contagion                                                                                          8
                               3.2. Economic fundamentals                                                                                            9
                               3.3. Diverging outlooks                                                                                              12
                               3.4. Risks and mitigation techniques                                                                                 13
Section 4.                     Scope and methodology update                                                                                         18
                               4.1. Scope                                                                                                           18
                               4.2. Methodology                                                                                                     19
Section 5.                     Score review                                                                                                         23
Section 6.                     Investment                                                                                                           26
                               6.1. Global trends                                                                                                   26
                               6.2. Leading markets                                                                                                 29
                               6.3. Foreign investment                                                                                              33
                               6.4. Inflows                                                                                                         38
Section 7.                     Power systems                                                                                                        40
                               7.1. Technologies                                                                                                    40
                               7.2. Policies                                                                                                        44
                               7.3. Power markets                                                                                                   48
                               7.4. Advanced energy transition                                                                                      52
Section 8.                     The path to de-carbonization                                                                                         56

Table of figures
                               Figure 1: Total annual capacity additions by technology in emerging markets .. 2
                               Figure 2: Share of annual capacity additions by technology in emerging
                               markets 2
                               Figure 3: Developing country clean energy investment ................................... 3
                               Figure 4: Emerging market foreign direct investment by investor group ........... 3
                               Figure 5: Annual generation by technology in emerging markets ..................... 5
                               Figure 6: Coal cumulative installed capacity in emerging markets by country ... 5
                               Figure 7: Projected global population growth .................................................. 6
                               Figure 8: Projected global power demand ...................................................... 6
                               Figure 9: The value of select emerging market currencies vs. the U.S. dollar ... 8
                               Figure 10: The JPMorgan Volatility Index ....................................................... 8
                               Figure 11: MSCI Emerging Markets Equity Index ............................................ 9
                               Figure 12: MSCI emerging market currency index ........................................... 9
                               Figure 13: Global debt to GDP ratios ............................................................. 10

                               No portion of this document may be reproduced, scanned into an electronic system, distributed, publicly
                               displayed or used as the basis of derivative works without the prior written consent of Bloomberg Finance
                               L.P. For more information on terms of use, please contact sales.bnef@bloomberg.net. Copyright and
© Bloomberg Finance L.P.2018   Disclaimer notice on page 66 applies throughout.
Climatescope
                                                                                                                                   November 27, 2018

                               Figure 14: Top 12 emerging market foreign currency reserves (excluding
                               China)         10
                               Figure 15: Global current account balances ................................................... 11
                               Figure 16: Normalized U.S. dollar exchange rates for select emerging market
                               currencies 11
                               Figure 17: Global economic growth rates, % year-on-year ............................. 11
                               Figure 18: 2017-2023 anticipated GDP growth in G7 economies and emerging
                               markets, $trillion (nominal) ............................................................................ 11
                               Figure 19: Economic indicators for select emerging markets, Japan, the U.S.
                               and France .................................................................................................. 12
                               Figure 20: Fundamental renewables sector indicators for select emerging
                               markets........................................................................................................ 13
                               Figure 21: Impact of financing costs on country LCOE benchmarks for utility-
                               scale PV (left) and onshore wind (right) ......................................................... 14
                               Figure 22: Risk mitigation pathways .............................................................. 15
                               Figure 23: Emerging market auctioned clean energy delivery contracts by
                               currency in which they are denominated, 2003-1H 2018 ................................ 16
                               Figure 24: Countries covered in Climatescope .............................................. 18
                               Figure 25: Share of world totals covered in this year's Climatescope vs. last
                               year ............................................................................................................. 18
                               Figure 26: PV module experience curve ....................................................... 19
                               Figure 27: Net capacity additions in emerging markets (GW) ......................... 19
                               Figure 28: Previous Climatescope Parameters vs. current Climatescope Topics
                               and weightings ............................................................................................. 20
                               Figure 29: Climatescope score of top 15 countries ........................................ 23
                               Figure 30: Top 10 scorers by Topic ............................................................... 24
                               Figure 31: Developing country clean energy investment ................................. 26
                               Figure 32: Developing country clean energy asset finance ............................. 26
                               Figure 33: Levelized cost of energy benchmarks for utility-scale PV in select
                               developing nations ....................................................................................... 26
                               Figure 34: Levelized cost of energy benchmarks for onshore wind in select
                               developing nations ....................................................................................... 26
                               Figure 35:Number of developing nations with at least one utility-scale solar/wind
                               clean energy financing, 2004-2017................................................................ 27
                               Figure 36: Developing country clean energy asset finance, $ billion ............... 28
                               Figure 37: Number of countries recording more than $100 million in clean
                               energy asset finance .................................................................................... 28
                               Figure 38: Clean energy asset finance in top eight emerging markets (ex-China)29
                               Figure 39: Five-year renewable energy asset finance as a share of 2017 GDP
                               in leading developing nations ........................................................................ 30
                               Figure 40: Five-year renewable energy asset finance as a share of 2017 GDP
                               in major OECD nations ................................................................................. 30
                               Figure 41: Levelized auction bids for India and China, and BNEF Asia Pacific
                               1H 2018 levelized cost of energy forecast ..................................................... 31
                               Figure 42: Levelized PV (left) and wind (right) bids vs. BloombergNEF mid-case
                               LCOE benchmarks at dates of planned project completions ........................... 32
                               Figure 43: Development stage of auction-winning projects ............................. 33

                               No portion of this document may be reproduced, scanned into an electronic system, distributed, publicly
                               displayed or used as the basis of derivative works without the prior written consent of Bloomberg Finance
                               L.P. For more information on terms of use, please contact sales.bnef@bloomberg.net. Copyright and
© Bloomberg Finance L.P.2018   Disclaimer notice on page 66 applies throughout.
Climatescope
November 27, 2018
Figure 44: Top five countries with largest auction pipelines to finance, 1H 201833
Figure 45: Region of origin of emerging market foreign direct investment........ 34
Figure 46: Emerging market foreign direct investment by region of origin ........ 34
Figure 47: Ten largest providers of clean energy investment to developing
nations over the past decade ........................................................................ 35
Figure 48: Emerging market foreign direct investment by investor group ......... 36
Figure 49: Top five international investor groups in emerging markets ............ 37
Figure 50: Top 10 emerging market clean energy foreign investors over the last
ten years ...................................................................................................... 37
Figure 51: 10-year foreign renewables asset finance by region, $ billion ......... 38
Figure 52: 10-year foreign investment in emerging markets, $ billion .............. 38
Figure 53: Top 10 emerging markets for international clean energy investment
over the last 10 years ................................................................................... 39
Figure 54: Share of disclosed foreign asset finance in select emerging markets
over the last 10 years ................................................................................... 39
Figure 55: Cumulative capacity by technology in emerging markets ............... 40
Figure 56: Annual generation by technology in emerging markets .................. 40
Figure 57: Coal cumulative installed capacity in emerging markets by country 40
Figure 58: Total annual capacity additions by technology in emerging markets 41
Figure 59: Clean energy annual capacity additions by technology in emerging
markets........................................................................................................ 41
Figure 60: Share of annual capacity additions by technology in emerging
markets........................................................................................................ 42
Figure 61: Number of developing countries that recorded net capacity additions
for each technology ...................................................................................... 42
Figure 62: Climatescope markets by main sector by 2017 installed capacity ... 43
Figure 63: Climatescope markets by main sector by 2017 net installed capacity
additions ...................................................................................................... 43
Figure 64: Share of emerging markets using each policy................................ 44
Figure 65: India’s 2022 renewable energy target ........................................... 44
Figure 66: Top 10 clean energy asset finance lead arrangers, 2008-2017....... 45
Figure 67: Mexico clean energy certificate demand and Sener’s power
consumption ................................................................................................ 46
Figure 68: Clean energy contracts signed annually under organized auctions in
emerging markets, by region (GW)................................................................ 47
Figure 69: India clean energy auctions planned ............................................. 48
Figure 70: Concentration of generation market and average 5-year investment
as share of GDP........................................................................................... 49
Figure 71: Clean energy investment by type of investor ................................. 50
Figure 72: 5-year clean energy investment of countries as a share of their GDP
vs. average electricity prices ($/MWh) ........................................................... 51
Figure 73: Progression of retail electricity prices across emerging markets in
domestic currencies ..................................................................................... 52
Figure 74: Progression of retail electricity prices across emerging markets in
U.S. dollars .................................................................................................. 52
Figure 75: Share of wind and solar generation in select markets .................... 52
Figure 76: Wind and solar new-build asset finance investment ....................... 53
No portion of this document may be reproduced, scanned into an electronic system, distributed, publicly
displayed or used as the basis of derivative works without the prior written consent of Bloomberg Finance
L.P. For more information on terms of use, please contact sales.bnef@bloomberg.net. Copyright and
© Bloomberg Finance L.P.2018 Disclaimer notice on page 66 applies throughout.Climatescope
November 27, 2018
Figure 77: Central America power market exports.......................................... 54
Figure 78: Central America power market imports.......................................... 54
Figure 79: Chile's power grids ....................................................................... 55
Figure 80: Levelized costs of power-generating technologies, India ................ 57
Figure 81: Projected tipping points when new solar/wind projects out-compete
new coal on a levelized cost basis................................................................. 58
Figure 82: Global LNG demand forecast ....................................................... 59
Figure 83: Global power sector emissions under three possible scenarios ...... 60
Table of tables
Table 1: List of indicators (no formatting) and sub-indicators (italic) in order of
appearance in Climatescope 2018 – indicators only applied to off-grid countries
are underscored ........................................................................................... 20
Table 2: Top 5 Climatescope scorers ........................................................... 25
Table 3: Clean energy investment in developing countries by level of power
sector privatization ....................................................................................... 48
Table 4: Standardized power purchase agreements ...................................... 49
Table 5: Duration of power-purchase agreements offered (excluding China) ... 50
No portion of this document may be reproduced, scanned into an electronic system, distributed, publicly
displayed or used as the basis of derivative works without the prior written consent of Bloomberg Finance
L.P. For more information on terms of use, please contact sales.bnef@bloomberg.net. Copyright and
© Bloomberg Finance L.P.2018 Disclaimer notice on page 66 applies throughout.Climatescope
November 27, 2018
Section 1. Key findings
Fuelled by surging electricity demand and sinking technology costs, developing
114GW
nations are today leading a global clean power transition. This marks a
Zero-carbon capacity added
in emerging markets in 2017
remarkable turnabout from a decade ago when the world's wealthiest countries
accounted for the bulk of renewable investment and deployment activity.
Developing nations at the time were viewed as holding enormous promise only;
20.4% wind, solar, geothermal and other clean technologies were regarded as too
Increase in year-on-year
expensive for mass deployment.
clean energy deployment
across emerging markets
Last year's Climatescope documented how the locus of clean energy activity
had shifted noticeably from "North" to "South", from OECD to non-OECD
103 countries. This year's survey goes one step further by illustrating how less
Markets covered in developed nations are now very much driving the energy transition.
Climatescope 2018, up from
71 in 2017 Leadership is an elusive quality to quantify. Still, this year's Climatescope offers
compelling evidence that developing nations are at the forefront of change
toward a cleaner-powered future. Consider:
• In 2017, the large majority of the world's new zero-carbon power capacity was built in
developing countries. A total of 114GW (including nuclear and hydro as well as “new
renewables”) was added in these nations, compared with approximately 63GW added in
wealthier nations.
• In a first, renewables accounted for the majority of all new power-generating capacity
added. Developing countries added 186GW in 2017 to their grids with wind and solar alone
accounting for 94GW – just over half.
• Clean energy deployment is growing fastest in developing nations. New-build additions
rose 20.4% year-on-year in these countries. By contrast, new build in wealthier nations fell
by 0.4%.
• Coal build has fallen sharply in developing countries. After peaking at 97GW of new
capacity built in 2015, coal additions slipped to 48GW in 2017. New coal in India has crashed
from 17GW per year 2012-16 to 4GW in 2017, suggesting the country is plotting a lower-
carbon course to expand energy access.
• Developing countries are driving down clean energy costs, making these technologies
more competitive with fossil generation. Over 35 emerging markets have held reverse
auctions for clean power-delivery contracts to date, including Mexico ($21/MWh for PV) and
India ($41/MWh; wind), procuring 140GW vs. 41GW in OECD countries. BNEF's estimated
levelized cost of electricity for wind and solar is below $50 for many developing nations.
• Clean energy investment is being deployed in more nations than ever. As of year-end
2017, 54 developing countries had recorded investment in at least one utility-scale wind farm and 76
countries had received financing for solar projects. That's up from 20 and 3, respectively, a decade ago.
No portion of this document may be reproduced, scanned into an electronic system, distributed, publicly
displayed or used as the basis of derivative works without the prior written consent of Bloomberg Finance
L.P. For more information on terms of use, please contact sales.bnef@bloomberg.net. Copyright and
© Bloomberg Finance L.P.2018 Disclaimer notice on page 66 applies throughout. 1Climatescope
November 27, 2018
Figure 1: Total annual capacity additions by technology in Figure 2: Share of annual capacity additions by
emerging markets technology in emerging markets
GW
243
225 Other 70%
24 Fossil
197 27 60% fuels
185 22 186 Solar
176
28 18 42 43 12 50%
148 19 15 12 Wind
15 21 18 29 23 30 69 40%
21 27 36 30 35 21 Large
22 24 25 30%
32 31 27 Hydro
22 11 Wind and
22 Gas 20%
97 solar
65 82 68 66 77
48 10%
Coal
0%
2011 2012 2013 2014 2015 2016 2017 2011 2012 2013 2014 2015 2016 2017
Source: BloombergNEF, Climatescope. Note: includes data from 100 Note: non-fossil fuel and non-wind/solar capacity additions
non-OECD nations, plus Chile, Mexico, and Turkey. Other includes were accounted for by nuclear, geothermal, biomass, and
biomass and waste, geothermal, nuclear, small hydro, oil and other large hydro projects.
fossil fuels.
Progress has of course been fueled by investment. In 2017, new clean energy financings in
emerging markets totaled $143 billion. That was roughly level with 2016 and a far cry from the
$178 billion in 2015. However, it came against a backdrop of continued price drops for
renewables technologies. A heterogeneous mix of funding sources have supported growth.
Consider:
• The vast majority of clean energy capital deployed in emerging markets came from
local sources. This was largely due to the heavy influence of domestic development banks
and credit agencies in China and Brazil.
• Foreign direct investment (FDI) supporting clean energy rose to an all-time high. It
jumped to $21.4 billion in 2017 from $13.9 billion in 2016. EU-based sources provided the
largest share at $9.6 billion, followed by the U.S. with $5.1 billion and Asia with $4.8 billion.
• Private capital is playing a growing role in clean energy FDI. While funding from
development banks and export credit agencies remained flat from 2016 to 2017, funding from
international utilities, project developers and commercial banks surged to $9.8 billion.
• The largest international funder of non-hydro renewables in developing nations over
the last decade is Enel – by far. The Italian utility and independent power producer has
provided $7.2 billion to projects mainly in Latin America. Other EU-based utilities have also
been very active.
No portion of this document may be reproduced, scanned into an electronic system, distributed, publicly
displayed or used as the basis of derivative works without the prior written consent of Bloomberg Finance
L.P. For more information on terms of use, please contact sales.bnef@bloomberg.net. Copyright and
© Bloomberg Finance L.P.2018 Disclaimer notice on page 66 applies throughout. 2Climatescope
November 27, 2018
Figure 3: Developing country clean energy investment Figure 4: Emerging market foreign direct investment by
investor group
$ billion $ billion Other
Manufacturers
178 21
Small hydro
Industrial
18 users
142 143 Geothermal Insurances
127 2
90 14 14
Other 3 2 Commercial
102 100 12
11 banks
88 71 75 10 1 1 3 Private equity
80 Biomass & 2
52 3
Waste 8 2
60 63 35 36 6 2 2 2 Project
Biofuels 1 5
22 1 2 3 3 developers
6 4 2 2
79 1 2 International
2 62 62 Solar 1 2 1
3 51 60 4 4 4 utilities
44 43 47 2 5 Export credit
25 34 2 2 3 3
Wind agencies
2008 2011 2014 2017 Development
2008 2011 2014 2017
banks
Source: BloombergNEF. Note: Includes 100 non-OECD nations, Source: BloombergNEF
plus Chile, Mexico and Turkey.
The progress achieved has been all the more impressive in light of rising U.S. interest rates,
shrinking global liquidity, and a reduced appetite for international risk among some investors.
Project updates
This year's Climatescope Emerging Market Outlook represents the collective effort of 42
BloombergNEF analysts who made 54 country visits to collect data and conduct interviews. Once
again, the study has been graciously supported by the U.K. Department for International
Development.
For 2018, the project has been expanded and updated in two key ways. First, the total number of
countries surveyed was expanded significantly to 103. This includes 100 nations classified by the
Organisation for Economic Co-operation and Development (OECD) as less developed. It also
includes three countries – Chile, Mexico, and Turkey – that are an important part of the
developing-nation story but are not technically classified as non-OECD. As a result of this
expansion, Climatescope now offers a comprehensive snapshot of virtually all developing nations.
Second, the Climatescope methodology has been streamlined and updated. While the number of
underlying data indicators remains approximately the same as last year at 165, these have now
been grouped under three overarching Topics: Fundamentals, Opportunities, and Experience.
The weightings of underlying indicators as they count toward the overall score have also been
updated slightly. Market conditions have changed dramatically since BNEF first conducted
Climatescope seven years ago. These methodology updates are intended to make the data we
have collected more accessible to users and the scoring system more reflective of current market
realities.
As in past years, Climatescope scored and ranked individual nations. While many of the countries
that have appeared near the top of the survey's leaderboard in years past are up there again this
year, there are have been some notable changes:
No portion of this document may be reproduced, scanned into an electronic system, distributed, publicly
displayed or used as the basis of derivative works without the prior written consent of Bloomberg Finance
L.P. For more information on terms of use, please contact sales.bnef@bloomberg.net. Copyright and
© Bloomberg Finance L.P.2018 Disclaimer notice on page 66 applies throughout. 3Climatescope
November 27, 2018
• Chile is the top scorer in this year's Climatescope survey. The Andean nation fared well
on all three parameters thanks to strong government policies, a demonstrated track record of
clean energy investment, and a commitment to de-carbonization despite grid constraints.
• India is the close second. The Indian market is home to the largest and most competitive
auctions in the world, which contracted over 10.5GW from wind and solar in 2017 alone. The
country aims to reach 175GW of clean energy capacity by March 2022, with 100GW coming
from solar alone. The country’s solar market almost doubled in size in 2017, making it a
record year with annual PV installations touching 8GW.
• Jordan is in third position. The country's policy framework, clean energy targets, auctions,
and renewable portfolio standard led to 730MW of wind and solar plants added in 2015-2017.
Jordan also has over 1GW of clean energy currently under construction.
• Brazil finished fourth, despite slumping clean energy investment and cancelled
auctions. Brazil has pioneered competitive auctions to contract clean energy, which led to
over 24.8GW of renewable energy contracted in 2009-2017. With the worst of its economic
crisis now behind it, clean energy appears poised for new growth.
• Rwanda rounds out the top five thanks to its unprecedented progress in expanding
generation capacity and electrification over the last decade. Since 2010, approximatively
4.3 million of the country's 11.8 million inhabitants have gained access to electricity.
• China remains critical to the global clean energy story but fell to seventh in the survey
from top of the table last year. While China remains the largest market for clean energy
build by far, curtailment issues and the halting of subsidies to solar generators dented its
score. Climatescope’s updated methodology also places greater emphasis on countries'
openness to international investors over the availability of local manufacturing. While these
changes contributed to China's drop, its unrivaled clean energy investment and potential for
de-carbonization ensured it remained in the survey's top ten.
Despite successes achieved by clean energy to date in developing countries, it is far from certain
these nations will de-carbonize their power sectors going forward. While new coal-fired capacity
additions fell to their lowest level in over a decade in 2017, actual generation from coal-fired
plants rose 4% year-on-year to 6.4TWh. Natural gas generation posted a similar 3% rise. And
despite ample evidence that new-build renewables can underprice new-build coal-fired plants,
193GW of coal are currently under construction in developing nations today according to
Coalswarm data. Some 86% of that is due to come online in China, India, Indonesia and South
Africa.
Moreover, there is the longer-term challenge for clean energy to displace existing coal-fired
plants. The question is particularly relevant for China and India, which get approximately two
thirds and three quarters of their power from coal, respectively. Combined, these two countries
added 432GW of coal capacity in just 2010-2017 (by comparison, the U.S. has a total of 260GW
of coal on line today). Faced with significant pressure to expand energy access (India) and keep
power affordably priced (China), policy-makers will be reluctant to de-commission these relatively
new plants anytime soon. And no less than 81% of all emerging market coal-fired capacity is
located in these two nations.
No portion of this document may be reproduced, scanned into an electronic system, distributed, publicly
displayed or used as the basis of derivative works without the prior written consent of Bloomberg Finance
L.P. For more information on terms of use, please contact sales.bnef@bloomberg.net. Copyright and
© Bloomberg Finance L.P.2018 Disclaimer notice on page 66 applies throughout. 4Climatescope
November 27, 2018
Figure 5: Annual generation by technology in emerging Figure 6: Coal cumulative installed capacity in emerging
markets markets by country
'000TWh 13.8
13.2
12.2 12.6
11.8
11.2
9.9
10.4
2.2 2.3
2.0 2.1 2.1
1.8 1.9
1.7 2.5 2.5 2.6
2.2 2.3 2.4 68% 13% 4%
2.2 2.2
5.3 5.8 5.7 5.9 6.1 6.4
4.5 4.9
2010 2011 2012 2013 2014 2015 2016 2017
Coal Natural Gas Large Hydro China India Russia
Nuclear Oil & Diesel Wind South Africa Indonesia Ukraine
Small Hydro Biomass & Waste Solar Turkey Taiwan Vietnam
Kazakhstan Other
Fossil Fuels (Other) Geothermal
Source: BloombergNEF, Climatescope
Finally, there is the fundamental question of how to accommodate large volumes of intermittent
clean generation into existing power markets. As they require no fuel inputs, renewables projects
operate at effectively zero marginal cost. Thus when they flood the grid in liberalized power
markets, they can potentially decimate wholesale power prices for all generators.
In the short run, this can hasten the demise of older, less efficient fossil plants and help keep CO2
emissions in check. But when not properly managed, high clean energy penetration can de-
stabilize markets, particularly if the clean output does not overlay neatly with electricity demand.
Such situations can also result in clean energy projects becoming highly reliant on the goodwill of
grid operators. In China, where over-capacity is acute in some regions for example, wind and
solar projects have at times found their production curtailed in favor of coal-fired power plants.
Developing nations are not alone in confronting the challenges posed by rising levels of clean
power generation. Germany, other countries, and parts of the U.S. have all grappled with how to
respond. Among the options on the table: wholesale power market reforms to adjust incentives
for generators; expanded demand-response programs to incentivize customers to reduce
consumption at key hours; deployment of energy storage technologies such as batteries to extend
the hours when clean electrons are available; or more transmission capacity to accommodate
greater capacity from remote regions with the best wind or solar resources.
Some developing countries are now actively seeking to implement these solutions. Brazil plans
auctions to develop transmission lines into regions with strong natural resources. The World
Banks’s Scaling Solar program in Madagascar's includes incentives to build power storage and
South Africa's state-owned utility has stated an 800MWh storage goal for 2019. Meanwhile,
countries such as Algeria and Tajikistan have aggressively promoted the use of smart meters,
which are vital to demand-response programs.
Nonetheless, substantial additional work remains. As clean energy costs continue to drop and
deployment continues to rise, developing country grids must do more than match the
sophistication of wealthier nations' grids, but surpass it. This will no doubt take concerted efforts,
including further policy development, investment, and deployment of the newest technologies. But
that also inevitably spells enormous opportunities for companies and financial institutions ahead.
No portion of this document may be reproduced, scanned into an electronic system, distributed, publicly
displayed or used as the basis of derivative works without the prior written consent of Bloomberg Finance
L.P. For more information on terms of use, please contact sales.bnef@bloomberg.net. Copyright and
© Bloomberg Finance L.P.2018 Disclaimer notice on page 66 applies throughout. 5Climatescope
November 27, 2018
Section 2. Introduction
The release of this year’s Climatescope Emerging Markets Outlook comes amid a period of
international uncertainty, as new and powerful voices have emerged to challenge the
longstanding trend toward a globalized economy. The most prominent of these has been U.S.
President Donald Trump, who has sought to rebalance his country’s trade relationship with China
through trade tariffs while countering its influence in emerging markets. The creation of a new
U.S. International Development Finance Corporation in November 2018 signaled a direct
response to China’s “One Belt, One Road” foreign investment initiative.
Robust U.S. economic growth and record low unemployment are also making waves abroad as
changes in the value of the dollar and demand for key commodities such as oil impact the rest of
the world. In developing nations with financial markets heavily influenced by global dynamics,
these trends have combined with domestic issues to undermine confidence in the outlook for
economic growth. Those jitters have prompted steep drops in the value of developing nations’
currencies, fueled concerns of “contagion”, and raised the prospect of a fully-fledged crisis of
confidence for investors.
Figure 7: Projected global population growth Figure 8: Projected global power demand
Billion people
'000 TWh
12 40
10
30
8
OECD
6 20 OECD
4
Non-OECD 10
2 Non-OECD
0 0
2000 2010 2020 2030 2040 2050 2015 2020 2030 2040 2050
Source: World Bank Source: BloombergNEF 2018 New Energy Outlook
Beyond the headlines, however, many developing nations are enjoying the longest period of rapid
economic growth in history. The same fundamental factor that has propelled their growth in recent
years remains: rapidly growing populations that are urbanizing, advancing, and demanding more
access to energy (Figure 7 and Figure 8). This dynamic has created the greatest infrastructure
investment boom in history and continues to offer long-term opportunities for investors.
This Climatescope Emerging Market Outlook begins with a review of Climatescope 2018’s new
methodology (Section 4) and scores (Section 5), followed by analysis on how economic and
financial trends are affecting dynamics for emerging market clean energy investors (Section 4). It
then analyzes trends in clean energy investment (Section 6) and assesses the successes and
challenges developing countries face as they transition to lower-carbon, more modern sources of
power generation (Section 7).
This Outlook represents the culmination of BNEF’s annual Climatescope project, which involves
42 of our analysts compiling detailed data on 103 developing nations, including making visits to
54 countries in spring and summer 2018. Readers are encouraged to explore complete datasets
No portion of this document may be reproduced, scanned into an electronic system, distributed, publicly
displayed or used as the basis of derivative works without the prior written consent of Bloomberg Finance
L.P. For more information on terms of use, please contact sales.bnef@bloomberg.net. Copyright and
© Bloomberg Finance L.P.2018 Disclaimer notice on page 66 applies throughout. 6Climatescope
November 27, 2018
and profiles each of these nations on the Climatescope web site to leverage fully this deep dive
into how world's fastest growing economies are driving the energy transition.
No portion of this document may be reproduced, scanned into an electronic system, distributed, publicly
displayed or used as the basis of derivative works without the prior written consent of Bloomberg Finance
L.P. For more information on terms of use, please contact sales.bnef@bloomberg.net. Copyright and
© Bloomberg Finance L.P.2018 Disclaimer notice on page 66 applies throughout. 7Climatescope
November 27, 2018
Section 3. Context
3.1. Concerns over contagion
2016 and 2017 were largely positive for emerging market currencies as they recovered from 18
months of depreciation against the dollar prompted by rising U.S. interest rates. This had the
effect of keeping inflation and the cost of servicing debt in check for such countries. However,
things took a turn for the worse in 2018 with developing country indices slipping badly.
Matters appeared to come to a head on August 10, 2018, when the U.S. imposed steel and
aluminum tariffs on Turkey. The move sharply reduced the value of the Turkish lira against the
dollar while causing shockwaves across South Africa, Argentina, India, Indonesia, and Mexico
(Figure 9). Developing nation currencies were at their most unstable since 2011, according to the
JPMorgan Index (Figure 10). This in turn spooked investors, fueled capital outflows, and
prompted talk of an emerging economy crisis.
Figure 9: The value of select emerging market currencies Figure 10: The JPMorgan Volatility Index
vs. the U.S. dollar
Jan 1, 2018 = 100 Index
120 30
25
100
South Africa 20
Emerging
80 Brazil 15 markets
10
60
Turkey 5
Argentina G7
40 0
Jan 18 Apr 18 Jul 18 Oct 18 2008 2011 2014 2017
Source: Bloomberg Terminal Source: Bloomberg Terminal. Note: turnover-weighted index of
G7 and emerging market volatility, based on three-month at-the-
money forward options.
While current volatility is a far cry from that in the wildest days of 2008, traders appear generally
pessimistic, with concerns homing in on the Argentinian peso, Turkish lira, Brazilian real and
South African rand, in particular. The instability has fed fears of a repeat of previous emerging
market routs, with the contagion experienced during the Asian financial crisis of the late 1990s
looming particularly large.
Specific to clean energy, the fear is that a broader retreat from emerging markets could siphon
credit from renewable energy projects, compounding difficulties facing developers trying to secure
financing in countries already perceived as vulnerable. Furthermore, falling exchange rates
complicate the task of paying obligations denominated in hard currencies.
To cap it all, the globalization of securities markets has exacerbated the potential for herd
behavior. With many portfolios treating emerging markets as a homogeneous asset class,
particular attention has centered on MSCI emerging market equity and currency indices
No portion of this document may be reproduced, scanned into an electronic system, distributed, publicly
displayed or used as the basis of derivative works without the prior written consent of Bloomberg Finance
L.P. For more information on terms of use, please contact sales.bnef@bloomberg.net. Copyright and
© Bloomberg Finance L.P.2018 Disclaimer notice on page 66 applies throughout. 8Climatescope
November 27, 2018
measuring performance across a basket of 24 leading emerging markets. Both indicators in 2018
have gone through their longest routs since their founding in the 1990s (Figure 11 and Figure 12).
Figure 11: MSCI Emerging Markets Equity Index Figure 12: MSCI emerging market currency index
All time high
160 160
140 140
All time high
120 120
100 100
80 80
2016 2017 2018 2016 2017 2018
Source: Bloomberg Terminal. Note: the MSCI equity index Source: Bloomberg Terminal. Note: the MSCI currency index
covers 85% of the free float-adjusted market capitalization of 24 covers 24 leading emerging markets across the world.
leading emerging markets across the world.
3.2. Economic fundamentals
With the U.S. Federal Reserve signaling it plans to raise rates again in coming months, further
tightening of global liquidity and further strengthening of the dollar are likely. Yet developing
economies appear better equipped to weather macroeconomic headwinds than ever before.
In the wake of the 2008 financial crisis, countries capitalized on quantitative easing and low
interest rates to accumulate significant piles of what was then cheap debt. Companies in
emerging markets also waded into the fray, racking up $3.8 trillion of overseas bonds outstanding
as of the end of March 2018, up from $1.3 trillion at the start of 2010. Economies as diverse as
China, Peru, Chile and Vietnam were among those most active in taking advantage of the
abundance of cheap funding.
Past profligacy may now be starting to catch up with borrowers, both in wealthy and less
developed nations. With dollars accounting for more than three quarters of foreign currency debt
in emerging markets, developing nations are said to be on the brink of an unprecedented
refinancing peak, with up to $2.9 trillion of emerging market bonds set to mature by year-end
2019.
Still, levels of developing country indebtedness have remained largely stable for the last tw o
decades. Following the 2008 financial crisis, such nations notably took on far fewer liabilities than
wealthier nations (Figure 13). There is also the more optimistic view that today’s borrowing from
emerging countries reflects improved access to financial markets and countries’ greater ability to
issue bonds unilaterally in support long-term investments, such as infrastructure projects.
No portion of this document may be reproduced, scanned into an electronic system, distributed, publicly
displayed or used as the basis of derivative works without the prior written consent of Bloomberg Finance
L.P. For more information on terms of use, please contact sales.bnef@bloomberg.net. Copyright and
© Bloomberg Finance L.P.2018 Disclaimer notice on page 66 applies throughout. 9Climatescope
November 27, 2018
Figure 13: Global debt to GDP ratios Figure 14: Top 12 emerging market foreign currency
reserves (excluding China)
Share of GDP Trillion dollars
120 4
Advanced economies
100
3
80
Emerging markets
60 2
40
1
20
0 0
2001 2005 2009 2013 2017 2006 2010 2014 2018
Source: International Monetary Fund, BloombergNEF. Note: For Source: Bloomberg Terminal Note: For a full list of countries
a full list of countries included in the IMF’s “Advanced included in the IMF’s “Advanced Economies” classification see
Economies” classification see here. here.
Emerging markets also have more control over their currencies than ever as the vast majority of
these are no longer directly pegged to the dollar. Moreover, these nations have higher foreign
exchange reserves, putting their domestic central banks in better position to take action to
weather economic downturns, if needed. As of April 2018, foreign reserves for the 12 largest
developing economies (excluding China) were up 40% from 2010 levels and surpassed $3.2
trillion for the first time (Figure 14).
This is good news for some particularly renewables-friendly markets. Mexico’s foreign reserves,
for example, nearly doubled between 2010 and 2018 to $178 billion. Still, there are major
disparities. Countries whose economies heavily rely on commodity exports can burn through such
reserves extremely quickly. Saudi Arabia alone, for instance, used almost $1 trillion from 2015 to
2018 to shore up its economy and finance its government budget.
Current account balances, which broadly measure a country’s exports minus its imports, can also
serve as a barometer of a nation’s economic health. Countries that rely heavily on exports of
natural resources such as metals, timber, or other products can see their current account
balances dwindle during global economic downturns. Compensating for shortfalls requires greater
foreign capital inflows, which can be a difficult feat during periods of low confidence. Another
option for countries is to tap into foreign exchange holdings.
Taken as a group, developing nations’ account balances stopped deteriorating in 2015 and have
even rebounded slightly since (Figure 15). At a country level, Indonesia, South Africa, Argentina
and Turkey – countries whose currencies have suffered the most in 2018 – all have significant
current account deficits. Meanwhile, countries like Thailand and Vietnam that each run large
current account surpluses have seen their currencies remain stable through the volatility of 2018
(Figure 12).
No portion of this document may be reproduced, scanned into an electronic system, distributed, publicly
displayed or used as the basis of derivative works without the prior written consent of Bloomberg Finance
L.P. For more information on terms of use, please contact sales.bnef@bloomberg.net. Copyright and
© Bloomberg Finance L.P.2018 Disclaimer notice on page 66 applies throughout. 10Climatescope
November 27, 2018
Figure 15: Global current account balances Figure 16: Normalized U.S. dollar exchange rates for
select emerging market currencies
Share of GDP January 1, 2018 = 100
1.5 110
Advanced Thailand
economies 100
1
90 Vietnam
80 Turkey
0.5 Emerging
70
markets Argentina
0 60
50
-0.5 40
2010 2012 2014 2016 2018 Jan 18 Apr 18 Jul 18 Oct 18
Source: International Monetary Fund Note: For a full list of Source: Bloomberg Terminal. Note: gaps in data are due to
countries included in the IMF’s “Advanced Economies” market closures.
classification see here.
While not achieving growth levels seen prior to the financial crisis, emerging markets are now
picking up the pace: average real GDP growth rates have been firm each year since 2015 (Figure
17). Looking ahead, the International Monetary Fund predicts that the current growth will continue
apace through 2023 and provide a sizeable buffer against the expected continuing decline of
global liquidity. Developed nations, meanwhile, are set to see their collective annual growth rate
decelerate from 2.5% in 2018 to 2.2% in 2019. Together, emerging markets are anticipated to add
$3.5 trillion more GDP to the world economy between 2017 and 2023 than are G7 nations (Figure
18).
Figure 17: Global economic growth rates, % year-on-year Figure 18: 2017-2023 anticipated GDP growth in G7
economies and emerging markets, $trillion (nominal)
10 Emerging 10.0
markets
5 7.6
World
0 Advanced economies
3.1
-5
1.0 1.0 0.9
-10
2000 2005 2010 2015 2020 G7 China Rest of Middle Americas Africa
Asia East & (exc N
North Africa)
Africa
Source: International Monetary Fund Note: For a full list of Source: International Monetary Fund
countries included in the IMF’s “Advanced Economies”
classification see here.
Inflationary pressures have also broadly eased even with the recent turmoil. A recent International
Monetary Fund (IMF) study showed that despite periods of sustained dollar appreciation, sharp
No portion of this document may be reproduced, scanned into an electronic system, distributed, publicly
displayed or used as the basis of derivative works without the prior written consent of Bloomberg Finance
L.P. For more information on terms of use, please contact sales.bnef@bloomberg.net. Copyright and
© Bloomberg Finance L.P.2018 Disclaimer notice on page 66 applies throughout. 11Climatescope
November 27, 2018
fluctuations in commodity prices and the 2008 financial crisis, consumer prices in emerging
countries have remained low and stable since the mid-2000s. This stands in sharp contrast to the
inflationary chaos of the 1990s. Inflation in developing nations has been improving in recent years
and hit a record low of 2.8% in August 2018, just as markets were roiling from Turkey’s
misfortune, suggesting that fears of impending, widespread contagion may well be overstated.
3.3. Diverging outlooks
Investors’ tendency to view all emerging market investments monolithically can obscure important
nuances between nations. Each country that has been part of the contagion conversation in
recent months has its own unique story to tell.
Prior to the recent crisis, Turkey’s economy was showing signs of weakness, with its current-
account balance down and inflation rate up. Turkish businesses have enjoyed a glut in dollar
borrowing, boosting private debt to 70% of GDP as of the summer of 2018, up from 40% in 2010.
Figure 19: Economic indicators for select emerging markets, Japan, the U.S. and France
Source: BloombergNEF, International Monetary Fund
As medium-term investors, renewables project developers must pay heed to a mixed bag of
fundamental economic and energy sector indicators (Figure 19). Focusing on countries BNEF
deems ripe for future renewable energy investment, the economies investigated display the full
range from febrile to strong. The diversity of conditions and challenges facing different developing
nations serves as a warning against taking a broad-brush approach.
No portion of this document may be reproduced, scanned into an electronic system, distributed, publicly
displayed or used as the basis of derivative works without the prior written consent of Bloomberg Finance
L.P. For more information on terms of use, please contact sales.bnef@bloomberg.net. Copyright and
© Bloomberg Finance L.P.2018 Disclaimer notice on page 66 applies throughout. 12Climatescope
November 27, 2018
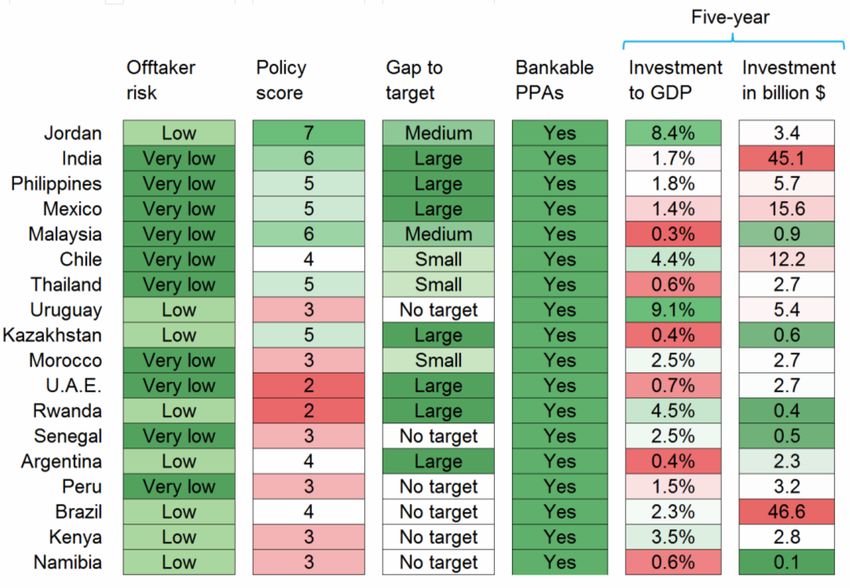
Figure 20: Fundamental renewables sector indicators for select emerging markets
Source: BloombergNEF, International Monetary Fund Note: Offtaker risk is defined as the
probability that the entities responsible for electricity procurement fail to meet their contractual
obligations. Policy score ranks countries on the diversity of renewable energy-oriented policies
across seven areas. Gap to target rates the progress yet to be made in meeting a country’s
national clean energy target. Bankable PPAs confirms the possibility of concluding power
purchase agreements of a tenor of 15 years or greater. The two investment metrics track
renewables asset finance-related investments over five years (2013-2017).
Strong or weak economies do not necessarily correlate with strong/weak clean energy
investment, Climatescope shows. As part of the survey, BNEF analysts sought to assess the
relative levels of risk presented by offtakers (buyers of power, often state utilities) in specific
nations. A selection of these is shown above.
In theory, offtaker risk should be comparatively low in countries that demonstrate strong economic
data because utilities there enjoy plentiful and growing demand for electricity. Utilities in such
countries should also be less likely to fall behind on tariff payments back to generators for the
same reason. But economic conditions are by no means the only factors behind public utilities
lapsing into arrears: political priorities and administrative inertia are often to blame.
3.4. Risks and mitigation techniques
However favorable the economic conditions or strong the demand, renewable energy developers
operating in developing countries must navigate risk by evaluating opportunities while employing
hedges to minimize exposure. While renewable technology costs have dropped dramatically over
the last several decades, upfront expenses remain high.
No portion of this document may be reproduced, scanned into an electronic system, distributed, publicly
displayed or used as the basis of derivative works without the prior written consent of Bloomberg Finance
L.P. For more information on terms of use, please contact sales.bnef@bloomberg.net. Copyright and
© Bloomberg Finance L.P.2018 Disclaimer notice on page 66 applies throughout. 13Climatescope
November 27, 2018
There are also the higher costs of capital typically involved with financing clean energy in
developing nations and this has historically resulted in a segregation between wealthy and less
developed countries. In OECD countries, the benchmark weighted average cost of capital
(WACC) to finance a typical wind or solar project for 2017-18 ranged from 2.5-6.5%. Meanwhile,
in emerging economies, the benchmark ranged from 5-11% (Figure 21).
Differences in financing terms translate directly into higher total estimated levelized costs for
projects (and should dictate the price at which developers can promise to deliver power to the
grid). As a result, developing economies have tended to be home to some of the highest LCOEs
across the world.
Figure 21: Impact of financing costs on country LCOE benchmarks for utility-scale PV (left) and onshore wind (right)
LCOE ($/MWh, nominal) LCOE ($/MWh, nominal)
150 150
Utility scale PV Onshore wind
125 125
100 100
75 2018 75
50 50
25 25
0 0
0% 5% 10% 15% 0% 5% 10% 15%
Weighted average cost of capital Weighted average cost of capital
Bubble size: capacity factors OECD Developing economies
Source: BloombergNEF. Note: The weighted average cost of capital it is a measure of how much it costs to finance a
project.Notes: analysis based on 1H 2018 BNEF LCOE estimates.
Lower system costs or better renewable resources can to some degree compensate for an
unfavorable investment environment. A good example for this is India, which despite its relatively
high average WACC for renewables (around 8% today for wind and solar, down from 12% in
2017) has some of the lowest levelized costs for solar and wind at around $40/MWh. This is
mainly due to India’s very competitive environment, which forces renewable developers to
achieve comparatively low capex and opex by global standards.
A variety of measures and instruments to mitigate developer risk in emerging markets have been
deployed to date (Figure 22).
No portion of this document may be reproduced, scanned into an electronic system, distributed, publicly
displayed or used as the basis of derivative works without the prior written consent of Bloomberg Finance
L.P. For more information on terms of use, please contact sales.bnef@bloomberg.net. Copyright and
© Bloomberg Finance L.P.2018 Disclaimer notice on page 66 applies throughout. 14Climatescope
November 27, 2018
Figure 22: Risk mitigation pathways
Often overlap
MDB OR
DEVELOPER OFFTAKER GOVERNMENT FX FUND
INSURER
Stakeholders
Currency
Natural hard currency hedge
CURRENCY swap
Exchange rate-indexed contract
Political risk
insurance
OFFTAKER Loan
guarantee
Risks
Sovereign Transfer of risk
obligation
Source: BloombergNEF
Offtaker risk
Among these are financial de-risking instruments, most often offered by multilateral development
banks (MDBs). These include:
• Partial loan guarantees: Issued by the likes of the World Bank Group’s International
Development Association, partial loan guarantees involve the multilateral development bank,
or MDB, assuming part of the risk of default that would otherwise have to be shouldered by a
local financial institution. This tool has proven effective in opening additional funding streams
stemming from domestic and international lenders who might otherwise be skeptical of clean
energy projects due to lack of experience. Loan guarantees are particularly effective in
countries with shallow, immature capital markets.
Yet partial loan guarantees often depend on a government’s goodwill, as they typically
require the host government to reimburse the MDB should the borrower default on its
obligations. This has the added consequence of limiting the scope of action to that afforded
by the government’s solvency – guarantees are hard to countenance when state coffers are
in the red. Moreover, due to their administrative complexity, partial loan guarantees can take
a significant amount of time to evaluate and process.
• Political risk insurance (PRI): With the risk of upheaval very real in many developing
countries, PRI indemnifies against losses incurred by a range of eventualities. Typical policies
cover areas such as expropriation, war and civil disturbance, and breach of contract – the
latter can apply to unforeseen policy changes affecting the terms of a power purchase
agreement (PPA).
PRI policies are underwritten by institutions ranging from MDBs to private actors. The
Multilateral Investment Guarantee Agency of the World Bank Group is one of the more
prominent providers. Compensation provided by PRI offers a strong layer of protection that
can facilitate a project’s access to finance.
But financial risk cannot be entirely removed from the equation. Insurance pay-outs can take
a long time to be disbursed, as they are often only awarded if the insured party has sought
redress through arbitration. The loss of revenue incurred in the meantime can be substantial.
No portion of this document may be reproduced, scanned into an electronic system, distributed, publicly
displayed or used as the basis of derivative works without the prior written consent of Bloomberg Finance
L.P. For more information on terms of use, please contact sales.bnef@bloomberg.net. Copyright and
© Bloomberg Finance L.P.2018 Disclaimer notice on page 66 applies throughout. 15Climatescope
November 27, 2018
• Sovereign guarantees: Given the, at times, shaky standing of local offtakers, governments
can play a critical role in reducing developer risk by guaranteeing PPA payments. In many
developing countries, state-owned utilities serve as the only buyers of clean power from
producers. Sovereign guarantees see the government backstopping such PPAs and shoring
up state-owned electricity companies to protect their credit standing.
When sovereign guarantees have been offered, default rates on PPAs have been shown to
be quite low, at least in the African context. Governments typically apply a high degree of
scrutiny to contracts before offering them. However, sovereign guarantees do not prevent
payments being delayed as they are typically only triggered as a last resort.
Currency risk
Currency exchange risks are inherent in most clean energy projects in developing nations. These
are inextricably bound to broader risks countries face such as economic downturns, policy shifts
and security worries. But there are methods for specifically addressing currency fluctuations.
These include:
• Power-delivery contracts signed in hard currencies: The simplest currency risk mitigation
tool is to allow developers of projects to be compensated not in local currency but in U.S.
dollars, or another hard currency. Under some reverse auction schemes, developers simply
sell their power and receive payment in greenbacks. In other cases, such as in Mexico, they
sell in local currency but with indexation to pre-agreed dollar exchange rate. Figure 23
highlights the volume of contracts signed in developing countries split by currency.
Figure 23: Emerging market auctioned clean energy delivery contracts by currency in
which they are denominated, 2003-1H 2018
GW
29.2
26.7 26.4
24
5
1.7 0.6 0.4 0.2 0.1 0.1
INR BRL USD CNY ZAR TWD MYR SAR JOD KZT EUR
Source: BloombergNEF. Note: INR = Indian Rupee, BRL = Brazilian Real, CNY = Chinese Yuan,
USD = US Dollar, ZAR = South African Rand, TWD = Taiwan New Dollar, MYR = Malaysian
Ringgit, SAR = Saudi Riyal, JOD = Jordanian Dinar, KZT = Kazakhstani Tenge, EUR = Euro.
• Hedging strategies: As many offtakers refuse to sign contracts in currencies other than their
own, other strategies have been devised to protect project owners from currency fluctuations.
These can include derivatives for hedging, for instance currency swaps agreed with third-
parties. Such exchanges take a variety of forms, but all hinge on the same basic concept: one
party borrows one currency from another party, lending another currency in return. The
No portion of this document may be reproduced, scanned into an electronic system, distributed, publicly
displayed or used as the basis of derivative works without the prior written consent of Bloomberg Finance
L.P. For more information on terms of use, please contact sales.bnef@bloomberg.net. Copyright and
© Bloomberg Finance L.P.2018 Disclaimer notice on page 66 applies throughout. 16You can also read