FRANCE, GERMANY, ITALY, SPAIN AND THE UNITED KINGDOM BUILDING MOMENTUM IN VENTURE CAPITAL ACROSS EUROPE - KFW
←
→
Page content transcription
If your browser does not render page correctly, please read the page content below

France, Germany, Italy, Spain
and the United Kingdom

∆Building Momentum
in Venture Capital across Europe
Imprint

Published by
Bpifrance
27–31, avenue du Général Leclerc
94710 Maisons-Alfort Cedex, France
www.bpifrance.fr

Cassa depositi e prestiti SpA (CDP)
Via Goito 4
00185 Rome, Italy
www.cdp.it

Instituto de Crédito Oficial (ICO)
Paseo del Prado 4
28014 Madrid, Spain
www.ico.es

British Business Bank
Foundry House
3 Millsands
Sheffield S3 8NH, United Kingdom
www.british-business-bank.co.uk

KfW Bankengruppe (KfW)
Palmengartenstraße 5-9
60325 Frankfurt am Main, Germany
www.kfw.de

Authors
Miguel Fernández Acevedo (ICO)
Matt Adey, British Business Bank
Claudio Bruno (CDP)
Gino del Bufalo (CDP)
Alexandre Gazaniol, Bpifrance
Dr Vivien Lo (KfW)
Dr Georg Metzger (KfW)
Blanca Navarro Perez (ICO)
Dan van der Schans, British Business Bank
Baptiste Thornary, Bpifrance

Editor
Dr Georg Metzger (KfW)

Layout and Design
Bettina Apfelbach (KfW)
Iris Brandt (KfW)

Picture Credits
Getty Images / Photograf Westend61

December 2016
Table of Contents

Greetings                                                      5

Foreword                                                       7

1.      General Part                                          11
1.1     Venture capital: what it is and why it is important   13
1.2     The EU venture capital market                         14
1.3     Fostering the European VC market                      23
1.4     Recommendations for building momentum in the
        venture capital markets in Europe                     26

2.      Country Reports                                       29
2.1     France                                                31
     2.1.1      Development of the VC market                  31
     2.1.2      Role of public institutions                   32
     2.1.3      Specific challenges and needs                 33
     2.1.4      Policy recommendations                        34
2.2     Germany                                               35
     2.2.1      Development of the VC market                  35
     2.2.2      Role of the national development bank         37
     2.2.3      Specific challenges and needs                 38
     2.2.4      Policy recommendations                        40
2.3     Italy                                                 41
     2.3.1      Development of the VC market                  41
     2.3.2      Role of public financial institutions         43
     2.3.3      Specific challenges and needs                 44
     2.3.4      Policy recommendations                        46
2.4     Spain                                                 47
     2.4.1      Development of the VC market                  47
     2.4.2      Public policies in VC                         48
     2.4.3      Specific challenges and needs                 49
     2.4.4      Policy recommendations                        51
2.5     United Kingdom                                        53
     2.5.1      Development of the VC market                  53
     2.5.2      Role of the national development bank         54
     2.5.3      Specific challenges and needs                 56
     2.5.4      Policy recommendations                        56

References                                                    59

Appendix                                                      61
List of Figures
Figure 1: Fundraising of VC firms in the EU hit hard by financial
crisis 15
Figure 2: Government agencies most important source of
VC funds in Europe 15
Figure 3: Venture investments by VC firms located in the EU
almost halved after 2008 16
Figure 4: Divergent development of VC investments in selected
countries 17
Figure 5: VC investments rates in the United States far ahead
of EU countries 18
Figure 6: UK accounts for a quarter of the EU VC market 18
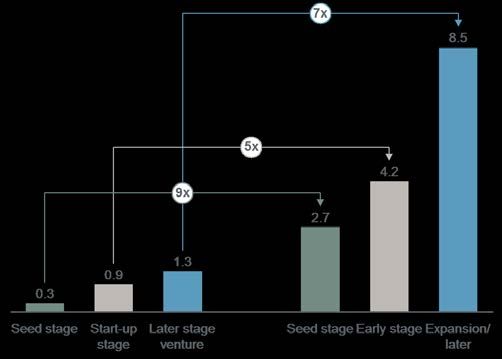
Figure 7: Average VC-backed US company receives five-times
more VC than its EU counterpart 18
Figure 8: VC investment in Top 10 OECD VC markets by stages
of investment, 2014 19
Figure 9: Breakdown of average VC deal size, 2015 19
Figure 10: Venture capital invested at company level by stage and
number of deals 19
Figure 11: Number of VC deals in the United States by stage,
2015 20
Figure 12: VC investment by stages, USA and Europe, 2015 20
Figure 13: Venture capital invested at company level and number
of deals 21
Figure 14: Breakdown of average VC deal size over the last
5 years 21
Figure 15: Total amount rose by VCAP funds of funds 22
Figure 16: Breakdown of total VC funds invested by stage, in
per cent, 2015 22
Figure 17: Annual average exit size for deals above CAD 100 m,
2011–2015 22
Figure 18: Amounts invested in French VC funds by investor type 31
Figure 19: Less French funds raise more capital 31
Figure 20: Investments by French VC firms 32
Figure 21: Investments in French companies 32
Figure 22: Performance of French VC funds since origin 33
Figure 23: Evolution of divestments in the Spanish VC sector
(number) 34
Figure 24: Evolution of divestments in the Spanish VC sector
(amounts) 34
Figure 25: Government, corporates and private individuals fund
the German VC market 35
Figure 26: Fundraising of German VC firms 36Figure 27: Investments by German VC firms 36
Figure 28: VC investments into German companies 36
Figure 29: Development of business climate and demand in
German VC market 37
Figure 30: Development of exit activity 38
Figure 31: Exits by sale of silent partnerships dominate and
write-offs account for 80 % of deals 39
Figure 32: Post-crisis IPOs in Germany still few, while IPOs in
the US recovered fast 39
Figure 33: US companies fuelled with significantly more VC
– at every development stage 40
Figure 34: Fundraising of Italian VC firms 41
Figure 35: Investments by Italian VC firms 42
Figure 36: VC investments into Italian companies 42
Figure 37: VC divestments by exit route 45
Figure 38: IPOs at Borsa Italiana 45
Figure 39: Total funds raised by Spanish VC firms 47
Figure 40: Investments by Spanish VC firms 48
Figure 41: VC investments into Spanish companies 48
Figure 42: Investments of Fond-ICO Global and of other investors
in the Spanish VC market 49
Figure 43: Average fund size of Spanish private equity companies 50
Figure 44: Volume of VC divestments in Spain 50
Figure 45: Number of VC divestments in Spain 50
Figure 46: VC investment rate fell to a low level 51
Figure 47: Venture Capital Funds raised per year by fund stage
focus 53
Figure 48: VC investments into UK companies 54
Figure 49: VC investments by UK VC firms (funds) 54France, Germany, Italy, Spain and the United Kingdom Building Momentum in Venture Capital across Europe
Greetings

“Europe's economy is about the same size as that of the US, but our
capital markets are only half their size. Our corporate bond market is a
third of the size; our venture capital markets a fifth. US SMEs get about
five times more funding from capital markets than in Europe.“ (Lord Hill
speaking at the Bruges European Business Conference on 18 March
2016).

These figures only partially describe the challenges facing the European
Union today. The tightening of banking regulations affects traditional
lending to SMEs. The weak balance sheets of some financial institutions,
the ageing population, growing competition in the area of innovation, the
shortening of investment cycles, and the emergence of new competitors
around the world are just a few of the issues we face.

National Promotional Banks and Institutions have for many decades
played an important role in financing start-ups. As a result, we have
acquired considerable insight into our respective markets and have
closely followed their developments. Part of this is brought together in this
report in order to benefit from each other’s experience.

Having done so, we hope to contribute to the Venture Capital debate
taking place within the European Commission, but also within other EU
institutions and in our respective countries. What can be done to
overcome the large fragmentation of the Venture Capital market in the
EU? What are the success factors for Venture Capital funds in the EU in
comparison to those in North America? And not least, to what extent can
national and EU financial instruments help EU start-ups to rise to
innovation and growth challenges? These and many other questions have
been addressed in this joint study.
Nicolas Dufourcq                 Dr. Fabio Gallia
Directeur Général of Bpifrance   Chief Executive Officer of
Maisons-Alfort Cedex, France     Cassa depositi e prestiti SpA
                                 Rome, Italy

Pablo Zalba Bidegain             Dr Ulrich Schröder
Chief Executive Officer of       Chief Executive Officer of
Instituto de Crédito Oficial     KfW Bankengruppe
Madrid, Spain                    Frankfurt am Main, Germany

Keith Morgan
Chief Executive Officer of
British Business Bank
Sheffield, United Kingdom
Foreword Innovation is changing the world, producing new opportunities to which we must continually adapt if we are to play a key role in the global economy. If Europe is to be successful in developing the significant technologies of the future and realising their benefits in global markets, our capacity for innovation needs to increase and the skill level of our workforce must improve. Strengthening the foundation of innovative, growth-oriented start-ups and providing the best conditions for their development is, therefore, more necessary than ever. Access to venture capital is an important success factor for these enterprises. However, the size and depth of European venture capital markets lag behind those of other leading global econo- mies. For instance, the amount of venture capital provided by US inves- tors to start-ups amounts to 0.211 % of GDP per annum on average – more than seven times the EU average. Within Europe, venture capital markets in individual countries also vary greatly in terms of their size and stage of development. Public interventions significantly contribute to the functioning of European venture capital markets and play an important role in helping them develop into more stable and liquid markets, increasing their positive effects on the wider economy. As we can learn from US pioneer experien- ces, this is a long-term mission. This report on the national venture capital markets in Europe is the second cooperative research project by the promotional banks of the four largest Euro area economies – Bpifrance, KfW Bankengruppe (KfW), Cassa Depositi e Prestiti (CDP) and Instituto de Crédito Oficial (ICO). This year, the British Business Bank, the UK’s national development bank has joined the group, providing first-hand knowledge and experience regarding Europe’s largest VC market. The Business Development Bank of Canada (BDC) also contributed its insights into North American venture capital markets. As promotional banks for our respective countries, improving finance for innovation is a common key priority and we consider promoting venture capital to be an important factor for the development and growth of innovative businesses. Innovation systems and venture capital markets in each of our countries are very diverse. We have compiled this report in order to learn from each other’s knowledge of domestic venture capital markets and identify ways of tackling common market challenges. Young innovative companies will shape Europe’s future. If Europe is to catch up with the most successful and competitive regions of the world, it needs stronger venture capital markets. As promotional banks, we share our understanding and commitment to support venture capital markets and to increase Europe’s capacity for innovation and competitiveness in the future.
Philippe Mutricy                 Prof Edoardo Reviglio
Chief Economist of Bpifrance     Chief Economist of
Masinsons-Alfort Cedex, France   Cassa depositi e prestiti SpA
                                 Rome, Italy

Blanca Navarro                   Dr Jörg Zeuner
Chief Economist of               Chief Economist of
Instituto de Crédito Oficial     KfW Bankengruppe
Madrid, Spain                    Frankfurt am Main, Germany

Matt Adey
Director of Economics of
British Business Bank
Sheffield, United Kingdom
1. General Part
1.1 Venture capital: what it is and why it is                VC is generally provided by VC funds, which rely on
important                                                    two types of actors:
How venture capital works
Technological changes are reshaping the global               • “Limited Partners” (LP) who provide almost all of a
economy. Promoting innovation is thus, more than             funds’ capital. These investors are mostly large
ever, a priority for business leaders and governments.       financial institutions (e.g. pension funds, banks,
New technologies and innovative business models              insurance companies, funds of funds), family offices
improve efficiency and productivity, ultimately fostering    (managing the assets of wealthy individuals) or public
economic growth. This has increased the attention paid       institutions.
to innovative companies and the ways of promoting
their development.                                           • “General Partners” (GP) who provide a marginal
                                                                                                  2
                                                             share of a funds’ capital (often 1 %) , but who together
There is a consensus in economic literature that young       with their management team, are the funds’ decision
innovative companies face important financial con-           makers. They make the investments and monitor the
                                                    1
straints, especially with regard to debt financing.          investee companies. GPs own a VC firm, often
These companies possess high growth potential but            managing several funds at once.
are also susceptible to failure due to their higher
technology and market risks. Their chances of success        VC funds generally have a fixed maturity (about ten
are therefore difficult for lenders to assess (information   years) and follow a classic investment pattern: they
asymmetries). As their income prospects are highly           invest their funds over a 3–5 year period, after which
uncertain and they typically lack collateral, young          they monitor their portfolios and eventually make
innovative companies are more likely to be affected by       follow-on investments in the most promising
credit rationing.                                            companies. In the final years of the investment term,
                                                             VC firms have to divest in order to generate a financial
Venture capital (VC) is a chance for young innovative        return for their investors. Potential buyers of their
companies to overcome these challenges. As equity            investment portfolio include other funds (exit via
holders, VC investors participate directly in the            secondary sale), industrial firms which for example, are
increasing business value of successful companies.           seeking to acquire and develop a new technology (exit
Unlike lenders, they are thus able to weigh their higher     via trade sale), or public markets by listing on a stock
risks against increased opportunities. Furthermore, VC       exchange (exit via IPO). However, given the high level
investors are able to mitigate information asymmetries       of risk involved, the most common outcome for a VC-
by closely screening and monitoring investee firms:          backed company is failure (meaning a negative return
                                                             up to total loss). Return-oriented VC firms need to
• VC firms employ highly skilled specialists with            compensate for these losses by aiming to make very
expertise in the business sector of their investment         high returns on a small number of their most promising
targets (industry’s economic environment, existing           investments.
technologies, competition etc.).
                                                             These institutional VC firms co-exist with informal
• Once they have invested in a company, VC investors         investors, such as business angels. Angel investors are
usually have seats on the companies’ boards and are          typically wealthy individuals and / or former business
often involved in the firm’s daily operational life, i.e.    leaders who invest their own personal resources in
they manage their portfolio companies “hands-on”.            young innovative companies and in addition provide
                                                             their own management expertise to the investee
• VC investors frequently disburse funds in stages,          companies. These investors are complementary to VC
with additional funding being contingent on the              firms because they generally focus on the earliest
achievement of operational and financial objectives.         stages of a company, invest smaller amounts, and can
This “staging” process allows them to reduce                 have other motives than just financial returns, such as
information asymmetries and to align the interests of        altruistic reasons or the desire to create new busi-
the VC firm and the founders of the company they have        nesses. Therefore, angel investors can bring new
invested in.                                                 companies to the level of development where they
                                                             become interesting investments for VC firms.

1                                                            2
    See e.g. Hall (2002) for theoretical arguments.              See Mulcahy et al. (2012).

                                                                                                               Page 13
Building Momentum in Venture Capital across Europe
Compared with other sources of finance, the VC The positive correlation between VC and innovation is
7
market is very narrow. For example, according to a well-established fact. However, causality can go
Invest Europe, VC funds in the five countries both ways: On the one hand, VC activity can contribute
considered in this report (France, Germany, Italy, to the launch of new products on the market. On the
Spain, and the United Kingdom) had EUR 39 bn in other hand, VC activity is driven by the occurrence of
assets under management in 2015, while the total investment opportunities and expectations regarding
8
amount of outstanding loans in these countries amoun- the technological development.
ted to EUR 3,500 bn as reported by the ECB. Kraemer-
Eis et al., (2016), pointed out that VC is not a 1.2 The EU venture capital market
“substitute for traditional, mainly bank-centred, SME • The EU VC market has raised EUR 40 bn since
financing instruments”; instead, it should be seen as 2007, government agencies being the most
a specific financial instrument for young innovative important contributor.
companies.
• VC firms located in the EU financed more than
The importance of VC 28,000 young companies within nine years providing
The availability of VC funding is considered to be a a total of EUR 35 bn in venture capital.
crucial element for the survival and development of
high potential companies and their ability to overcome • UK accounts for a quarter of the EU VC market.
the so-called “valley of death”. This “valley of death” The long-term impact of the “Brexit” on the VC
represents the shortage of financial resources and the market is unknown and will depend on how the VC
lack of business development knowledge that industry responds to the new economic conditions.
3
characterises start-up projects. To overcome these
obstacles, VC firms provide not only funds, but also
Development of the VC market
various types of expertise (e.g. human resources,
According to Invest Europe’s VC market activity data
finance, legislation, business strategy, or intellectual
(see Box 1), VC firms in the EU raised funds of about
property) and access to their networks. The partici-
EUR 40 bn between 2007 and 2015. In 2007, more
pation of a VC firm can also help to improve a
than EUR 7 bn of funding was raised. However, in
company’s reputation and lead to an increase in
2008 fundraising slumped to below EUR 5 bn, falling
confidence on the part of other investors, initiating a
further to its post crisis low of about EUR 3 bn in 2009
virtuous circle between VC investment and perfor-
and 2010 (Figure 1). Then, in 2011 fundraising
mance.
recovered to more than EUR 4 bn. This was due to a
catch-up effect by investors who held off investing
Empirical studies support this view: they show that VC-
during the most critical phase of the financial crisis.
backed companies exhibit higher growth in sales,
4 However, in 2012 fundraising fell back to below
employment and productivity. Despite the narrowness
EUR 4 bn before climbing to about EUR 5 bn in 2015.
of the VC market, studies find a positive correlation
between VC activity and innovation at the industrial and
5
country level. Thus, the positive stimulus of VC on the
growth of young companies translates into increased
growth and innovation at the macroeconomic level, not
only in the countries where these companies are
located but also in the countries in which they and the
VC firms operate. Particularly cross-border deals can
stimulate such diffusion. Prior to the financial crisis,
cross-border deals accounted for a third of the total
6
number of deals worldwide.
3
See Savaneviciene et al. (2015).
4 7
See the reviews of Da Rin et al. (2011), Savaneviciene et al. (2015), See Tykvová et al.(2012) or Da Rin et al. (2011) for a review.
Tykvová et al. (2012) or Kraemer-Eis et al. (2016).
8
Arqué-Castells (2012) shows that VC funds select firms that are already
5
See Kortum and Lerner (2000) and Popov and Roosenboom (2009). innovative, accelerating the market launch of these firms’ products. Bernstein
et al. (2015) shows that active monitoring by VC managers leads to a positive
6
See Schertler and Tykvová (2009). impact on innovation and the probability of an IPO.
Page 14General Part
Most of the EUR 40 bn raised since 2007 was
Box 1: VC market activity data of Invest Europe dedicated to be invested in companies which are at an
As VC firms are not obligated to inform about their
early stage of development (i.e. seed or start-up stage,
activities, there are no official VC statistics. All VC 9
46 %). About every tenth Euro was assigned to be
data sources available are based on voluntary invested in later stage ventures (12 %), while no
declarations of VC firms or on the market monitoring
specific target stage was assigned to 42 % of the funds.
of data providers. Thus, VC activity differs depending
on the data source used. Figure 2: Government agencies most important
source of VC funds in Europe
The data used in this report was supplied by Invest
Sources of VC fundraising in per cent, average 2007–2015
Europe (before 1 October 2015 known as European
Venture Capital Association, EVCA). Invest Europe Corporate
investors
is an association for Europe’s private equity, venture
Government
capital and infrastructure sectors, as well as their agencies
11
investors. Invest Europe supplies industry and Other 22
market data for all European countries, thus sources
10
providing a consistent data base. Industry statistics
show investments of VC firms located in Europe; the
market statistics present VC investments in
10 Private
European companies. The industry statistics thus individuals
include the investments of European investors in 22
non-European countries while excluding the 8
Fund of
investments of non-European investors in Europe Unclassified 7 funds
5 5
Pension
Data on private equity fundraising, investment and funds
divestment by more than 1,800 private equity firms in Family Banks
offices
Europe is gathered via PEREP_Analytics, which is a
joint Pan-European statistics platform owned by Note: The numbers refer to the whole of Europe including Norway,
Invest Europe and several European private equity Switzerland and the Ukraine, because it is not possible to extract
associations. According to Invest Europe, the 2015 numbers only for the EU on the basis of the available information.
statistics cover 91 % of the roughly EUR 560 bn Source: Invest Europe / PEREP_Analytics
capital under management in the European market.
Government agencies play an important role in
European VC fundraising. Since 2007, they have
Source: www.investeurope.eu
contributed more than a fifth of the total funds
committed to VC firms in the EU (Figure 2). No other
Figure 1: Fundraising of VC firms in the EU hit hard investor provides that amount of VC funding. Corporate
by financial crisis investors and private individuals provide about 10 %
Fundraising in EUR m
each, i.e. together roughly the amount that government
9,000
agencies contribute. Other private investors such as
banks, insurers or pension funds provide only small
8,000
portions of the overall funding. This shows that stimu-
7,000 lating private VC funding is one of the most important
6,000 challenges the European VC market faces. By compa-
rison, in the United States, public authorities are of
5,000
minor importance and pension funds are the most
4,000 10
significant source of VC funding.
3,000
9
2,000 See Appendix Table 2 for stage definitions.
10
1,000 See Brigl and Liechtenstein (2015) who compared the European and US
VC investor landscapes in 2014. However, in their analysis of VC investors’
0 contributions, they neglect unclassified funds in the European data. Doing so,
2007 2008 2009 2010 2011 2012 2013 2014 2015 they presume inherently that the unclassified funds distribute identically to the
funds assigned to an investor group which is a bold assumption. It is rather to
Early stage Later stage venture Balanced
be supposed that e.g. public funds are fully classified, thus indicating that the
authors underestimated private sources like pension funds. Furthermore; they
Source: Invest Europe / PEREP_Analytics report a share of US government contributions to VC funds of zero. However,
Page 15Building Momentum in Venture Capital across Europe
Since 2007, VC firms located in the EU have financed Box 2: The financial performance of VC funds
more than 28,000 companies with about EUR 35 bn. The “2013 Pan-European Private Equity
Annual investments reached EUR 5–6 bn in both 2007 Performance Study” shows remarkable differences
and 2008 (Figure 3). Then in 2009, when the financial in the performance of private equity funds dependent
crisis became evident, VC investments plunged to on the funds’ investment focus, vintage year but also
about EUR 3.5 bn a year and remained at this level 12
location. It is based on a total sample of 1,455 in-
until 2011. In 2012 and 2013 VC funding fell to a ternational independent funds set up between 1980
temporary low of slightly more than EUR 3 bn, but and 2013, which were recorded in the ThomsonOne
gradually recovered to 2011 levels by 2015. At the database in June 2013.
beginning of the period being considered, EU VC firms
financed as many as 4,000 deals. Thereafter, however, Firstly, the study shows that on average, VC funds
the number fell to about 3,000 deals a year, stagnating are less profitable for investors than buyout funds.
at this level until 2013. In 2014 the number rose, but Overall, from their inception to end of 2013 the funds
then dropped significantly to below 3,000 deals in reached a net-pooled internal rate of return (IRR) 13
2015. of 9.24 %, whereas VC funds performed clearly
worse (1.68) than buyout funds (11.41). Accordingly,
Figure 3: Venture investments by VC firms located the Total-Value-to-Paid-In-multiple for VC funds is
in the EU almost halved after 2008 1.1 compared to 1.42 for buyouts funds.
Investments in EUR m Number of deals
7,000 4,500
Secondly, the performance of the VC funds is highly
dispersed. By the end of 2013, the pooled IRR for
4,000
6,000 the top-quarter VC funds was 18.51 and for the top-
3,500 half 11.28. Many VC funds were thus able to
5,000
3,000 generate significant returns for their investors;
4,000 however, given the median IRR of -1.30, the majority
2,500
of VC funds exhibit negative returns.
3,000 2,000
1,500 This dispersion can be related to differences in the
2,000
1,000 vintage years of the funds. Pooling cash flows of all
1,000 VC funds hides the fact that some funds are at the
500
beginning of their investment cycle (and therefore
0 0 have not distributed to their LPs yet so their returns
2007 2008 2009 2010 2011 2012 2013 2014 2015
are computed on an estimated value), while others
Seed Start-up Later stage venture Number of companies
are mature or even terminated (their financial returns
Source: Invest Europe / PEREP_Analytics are thus realised). The study shows, thirdly, that VC
funds of older vintage years (1980–1994) exhibit
Of the EUR 35 bn invested from 2007 to 2015 VC firms
higher returns than funds of more recent vintage
provided 4 % to companies in the very early seed
years. In contrast, buyout funds yield considerable
stage. These firms used the capital for activities like
11 returns up to vintage year 2004.
research or for developing an initial concept. Start-up
ventures, which need financing for product develop-
Finally, the study shows that European VC funds
ment and initial marketing, and later stage ventures,
generate lower returns than US VC funds. European
which want to trigger their first expansion, received the
VC funds exhibit continually lower horizon IRRs than
bulk of the capital in almost equal parts (47 % and
US VC funds, regardless how many previous years
49 %).
(one, three, five or ten) are considered: the average
14
10-year IRR of European VC funds by the end of
2013 is 0.84 for European VC funds, compared to
12
EVCA (2014).
13
US public authorities provide funds to so called registered ‘Small Business The “pooled” IRR is based on all funds’ cash flows since inception and their
Investment Companies‘ (SBICs) via the Small Business Administration (SBA) residual value, which are aggregated in one pool.
and within the framework of the State Small Business Credit Initiative
14
(SSBCI), see Box 3 for details. A fund’s 10-year horizon IRR for example by the end of 2013 is based on its
residual value at that time, its net asset value by the end of 2003, and its cash
11
See Appendix Table 2 for stage definitions. flows in between.
Page 16General Part
5.03 for US VC funds. In contrast, EU buyout funds Figure 4: Divergent development of VC investments
performed slightly better (10-year IRR: 10.46) than in selected countries
their US counterparts (9.64). Index [2007=100]
200
The VC performance gap between the United States
180
and Europe has not been fully resolved. However,
the fact that European VC markets are much 160
younger than the US VC market seems to be one 140
explanation: VC firms and entrepreneurs are less 120
experienced, VC is not firmly established as an asset 100
class for investors, and exits are more difficult. This
80
hypothesis might be confirmed by the most recent
60
development. Hence, the 5-year rolling IRR for
40
European VC shows a slight improvement. In 2013,
the figure was the highest since the burst of the dot- 20
com bubble. 0
2007 2008 2009 2010 2011 2012 2013 2014 2015
EU Germany France Italy Spain UK USA*
VC investors are focused on EU innovative young
companies within three main sectors: life sciences, * See Note Figure 5 for different VC definitions.
computer & consumer electronics and communications. Source: Invest Europe / PEREP_Analytics, own calculations.
These sectors attract about 60–70 % of total VC each
Since 2007, VC investments in the EU have an
year. Since 2007, about 25–35 % of VC has flowed into
average equivalent value of around 0.028 % of GDP
life sciences companies, whereas the sectors
per year (Figure 5). In the UK and France, VC invest-
computer & consumer electronics (20 %) and
ments reach a level of 0.046 and 0.038 % of GDP per
communications (15–20 %) have received up to a fifth
annum. Germany shows VC investments of 0.029 % of
each. Until 2012, 10–16 %, a significant part, of VC
GDP every year and is only slightly above the EU
investments flowed into the energy & environment
average. Spain and Italy, where companies receive VC
sector. However, its importance has decreased
corresponding to 0.018 and 0.005 % of GDP, have the
significantly, so that it only gained 4 % of VC invest-
lowest relative share of GDP in comparison with the
ments in 2016.
other countries listed. Compared to the US VC market,
these European numbers appear small. US investors
EU VC market is highly fragmented
provide VC for companies accounting for 0.211 % of
The European aggregate hides the fact that VC
GDP per annum on average – more than sevenfold the
markets in individual European countries are very
EU average. Because the US VC market experienced
diverse in terms of development stage, size and trends.
an additional boom in the last two years (see Box 3), its
Diverging national legal and regulatory regimes as well
GDP share in 2015 was almost fourteen times higher
as innovation systems have led to highly fragmented
than that in the EU.
and diverse VC markets. Figure 4 shows the divergent
development in the five largest EU countries (as
The high level of US VC relative to GDP is out of reach
measured by GDP) France, Germany, Italy, Spain and
for most European countries. Closest to the United
the UK since 2007. As mentioned above, VC invest-
States, but still far behind, is the UK VC market, which
ments in the EU fell by almost two-fifths in 2009 and
forms a significant proportion of the EU VC market: it
have remained at roughly this level.
accounts for a quarter of all EU VC fundraising and
investments (Figure 6). The result of the UK’s referen-
Of the European countries considered in this survey,
dum on EU Membership has increased economic
VC investments in Germany developed best, reaching
uncertainty in the short and medium term. The long-
the 2007 level by 2015. In comparison, VC investments
term impact of the decision to leave is unknown at this
in Spain and Italy were hit hard over the last few years
stage and will depend, to some extent, on what the
falling to approximately 40 % of their pre-crisis levels. In
“Brexit” looks like. It will be important to closely monitor
France and the UK, VC investments developed simi-
how the VC industry responds to the new economic
larly to the European average in 2015 – reaching 60 %
conditions and to ensure that young, growing com-
of 2007 levels. These developments stand in sharp
panies across Europe are able to access the venture
contrast to the dynamics of the US market, where VC
capital financing they need.
investment tripled by 2015 after its setback in 2009.
Page 17Building Momentum in Venture Capital across Europe
Figure 5: VC investments rates in the United States Figure 7: Average VC-backed US company receives
far ahead of EU countries five-times more VC than its EU counterpart
VC investments in per cent of GDP, average 2007–2015 Mean deal size* in EUR m, average 2007–2015
7
USA 0.211
6.3
6
UK 0.046
5
France 0.038
4
Germany 0.029
3
EU 0.028 2.4
2.0
1.9
2 1.7
Spain 0.018
1.3
1 0.9
Italy 0.005
0.000 0.050 0.100 0.150 0.200 0.250 0
Germany EU Spain Italy France UK US
Note: Invest Europe and NVCA apply different VC definitions. For the
* Deal size per financing round
EU countries, the numerator of the yearly VC investments rates
represents the aggregated investment volumes of seed-, start-up and Note: The value for Germany includes financings by Mittelständische
later stage venture capital in each year reported by Invest Europe. Beteiligungsgesellschaften which provide a high number of smaller
The numerator of the US-rates includes seed stage, early stage, financings (see German country chapter for details).
expansion stage and later stage financings reported by NVCA. See
Appendix Table 2 for a comparison of VC definitions by Invest Source: Invest Europe / PEREP_Analytics,
Europe and NVCA. PricewaterhouseCoopers / National Venture Capital Association
MoneyTree™ Report Q2 2016, own calculations.
Source: Invest Europe / PEREP_Analytics,
PricewaterhouseCoopers / National Venture Capital Association EU VC markets differ not only in relative and absolute
MoneyTree™ Report Q2 2016, US Bureau of Economic Analysis, sizes, but also in size of investments. On average, VC
own calculations.
firms invest EUR 1.3 m in companies located in the EU
Figure 6: UK accounts for a quarter of the EU during in each funding round. In the countries
VC market considered, German companies are backed by the
Market share in EUR lowest amount, receiving EUR 900,000 (see note of Fi-
gure 7). Spanish (EUR 1.7 m), Italian (EUR 1.9 m),
IT
0.7 bn
French (EUR 2.0 m) and British (EUR 2.4 m) com-
New venture funds raised
by country of the fund management FR
9.7 bn
DE
7.5 bn
OEU
10.1 bn
UK
10.0 bn
panies receive a higher amount. Also, average VC deal
(EU total '07–'15: EUR 39.7 bn) ES
1.7 bn
size in the EU is significantly smaller than that in the
United States where VC-backed companies receive an
UK ~ One Quarter
IT average of EUR 6.3 m in each financing round. The
0.5 bn
Venture investments
by location of PE Offices FR DE OEU UK larger size of the US capital market may explain some
7.6 bn 6.7 bn 10.3 bn 8.7 bn
(EU total '07–'15: EUR 35.4 bn) ES of this difference. The fact remains, however, that the
1.6 bn
potential of US companies to push their business
IT
model, technology and market penetration (i.e. market
0.7 bn
Venture investments
FR DE OEU UK
share) is much better.
by country of portfolio company 6.9 bn 6.8 bn 9.9 bn 8.3 bn
(EU total '07–'15: EUR 34.4 bn) ES
1.8 bn
0% 25 % 50 % 75 % 100 %
Note: FR=France, DE=Germany, IT=Italy, ES=Spain, UK=United
Kingdom, OEU=Other EU-countries
Source: Invest Europe / PEREP_Analytics, own calculations.
Page 18General Part
Box 3: The North American VC market – a bench- The US VC market experienced phenomenal growth
mark comparison after the low reached in 2009. VC investment grew at
Pierre Cléroux, Vice President, Research and Chief Economist a compound annual growth rate of 19 % over that
Business Development Bank of Canada (BDC) period, while the number of deals jumped by 38 %
(Figure 10).
An American Success Story
The United States is by far the largest VC market in Figure 10: Venture capital invested at company
the world. In 2015, 4,380 deals totalling USD 59.1 bn level by stage and number of deals
were made, half of which were attributable to
Investments in USD m Number of deals
California alone. In comparison, 3,006 deals were
60,000 6,000
concluded in Europe, for a total of USD 4.4 bn. As a
percentage of GDP, the volume of US VC investment
50,000 5,000
ranks second only to that of Israel (Figure 8), but the
average deal size in the United States surpassed that 40,000 4,000
in the “start-up nation” by USD 5 m (Figure 9).
30,000 3,000
Figure 8: VC investment in Top 10 OECD
20,000 2,000
VC markets by stages of investment, 2014
VC investments as share of GDP in per cent 10,000 1,000
0.45
0.38 0 -
0.40
2009 2010 2011 2012 2013 2014 2015
0.35
0.28 Seed Early Stage Expansion Later Stage Number of deals
0.30
0.25
Source: PricewaterhouseCoopers/National Venture Capital
0.20 Association MoneyTree™ Report Q1 2016.
0.15
0.08
Breakdown by region and industry
0.10 0.07 0.06 0.06
0.05 0.04 0.04 0.03
Three states account for 77.5 % of the total VC
0.05
invested in 2015: California, Massachusetts and New
0.00
York. As mentioned previously, California alone
accounted for more than 57 % of the market, most of it
driven by Silicon Valley, home of the largest
Seed/start-up/early stage Later stage venture technology ecosystem in the world.
Source: OECD, “Entrepreneurship at a Glance 2015”, OECD
iLibrary.
By sector, the majority of investment occurred in
software (40 %), life sciences (19 %) and other ICT,
Figure 9: Breakdown of average VC deal size, excluding software (11 %).
2015
Average deal size in USD m Investment by stage
16
In 2015, the majority of VC investment went into
expansion and later stages (64 %), while the early and
14 13.4
seed stages accounted for 34 % and 2 %, respect-
12 tively. However, a closer look at the number of
companies funded by stage reveals that the majority
10
of deals (2,405 or 55 %) were at the seed and early
8.1
8 stages (Figure 11). Of those, 1,444 raised VC for the
first time, which led the NVCA to affirm that the US
6
VC industry remains focused on the next generation
4 of “great” US companies.i In comparison, more than
half of European VC money went to the early stage
2
(Figure 12).
0
USA Israel
Source: PricewaterhouseCoopers / National Venture Capital
Association MoneyTree™ Report Q2 2016, IVC.
Page 19Building Momentum in Venture Capital across Europe
Figure 11: Number of VC deals in the • The US capital market offers VC-backed
United States by stage, 2015 companies opportunities to exit via IPOs. In 2015,
Seed 18 % of exits were through IPOs in the United States.
Later Stage As a general rule, IPOs are more lucrative than trade
186
4%
sales.
829
19 %
• US venture capitalists are very experienced and
focus on later stages. Many have run a start-up
themselves and know how to scale up a business.
2,219 Thus, they favour investment in companies that have
1,146 51 % proven markets.
Expansion 26 % Early Stage
Role of the Public Sector
Public sector involvement has played a major role in
shaping the US VC industry, as shown by Lerner
Source: PricewaterhouseCoopers / National Venture Capital (2009). The pioneers of Silicon Valley benefited from
Association MoneyTree™ Report Q1 2016 public funding of universities and defence at the
th
Figure 12: VC investment by stages, USA and beginning of the 20 century. This public spending
Europe, 2015 continues to support the innovation process of the US
economy, even nowadays, by fostering the demand
Share of stages in per cent
for VC.
USA 2 34 64 The federal government’s Small Business Investment
Companies (SBIC) program is the principal policy tool
for supporting VC in the United States. The
Europe 3 52 45
government does not invest in promising small
businesses directly; instead, it offers loans to SBICs.
SBICs – privately owned and managed investment
0 20 40 60 80 100
funds – then use their own capital and government-
Seed Early Stage Later Stage & Expansion
backed loans to invest in the equity and debt of
iii iv
Source: PricewaterhouseCoopers/National Venture Capital qualifying small businesses , like Apple in 1978.
Association MoneyTree™ Report Q1 2016 and Invest Europe /
PEREP_Analytics.
For each dollar an SBIC raises from private investors,
Economic Impact the federal government commits up to USD 2 of debt,
Three out of the five largest US public companies up to a maximum of USD 150 m per SBIC. From 2011
based on market capitalization – Apple, Google and to 2015, the SBIC program helped secure a total of
Microsoft – received VC at the early stage. Moreover, more than USD 21 bn in financing for about 5,800
v
42 % of all public companies founded after 1974 were small businesses.
venture-backed. Together, these companies
represented 63 % of the capitalization and 85 % of all At the state level, the Obama administration
R&D spending by public companies formed since introduced the State Small Business Credit Initiative
ii
1974. (SSBCI) as part of the Small Business Jobs Act of
2010. The USD 1.5 bn initiative aims to strengthen
vi
Success factors VC programs. Some states allocated the money to
• The United States has large VC funds. There existing VC initiatives, while others created new VC
were a total of 1,224 funds in existence in the USA by programs. Those initiatives mainly consisted of direct
2015, with an average size of USD 135 m. The larger investment funds or funds of funds initiatives.
the fund, the easier it is to raise capital, develop
expertise in a specific technology niche, and fund
large deals. There can also be economies of scale
from operating larger funds as the administration
costs (i.e. overhead) of operating an office represent
a smaller percentage of the total capital committed.
Page 20General Part
Mobilising private VC by public funds of funds: Figure 14: Breakdown of average VC deal size
vii
Canada over the last 5 years
Average deal size in CAD m
Overall, the Canadian venture capital (VC) market is
18 17.1
well established and has been growing both in terms
of the number of deals and the amount of money 16
invested; however, the average deal size is small 14
12.6
compared to that in the United States. In 2015, a total 12
of CAD 2.7 bn in venture capital was invested in 10.3
10
Canadian companies, the best result since 2002.
According to the OECD, the volume of Canada’s VC 8 7.3
6.9
7.3
6.6
6.4
investment as a percentage of GDP ranked third 6 5.6 5.3 5.2
4.5 4.7
amongst other developed nations – at 0.08 % of GDP 4.2 4.3
4
– only behind Israel (0.38 %) and the USA (0.28 %),
2
the homes of more mature VC markets (Figure 8).
0
2011 2012 2013 2014 2015
The Canadian VC market came out of the 2008–2009
USA Canada Israel
global economic crisis well. Both the number of deals
and the size of the financing have boomed over the Source: CVCA, PricewaterhouseCoopers / National Venture Capital
last five years (Figure 13). VC investment grew at an Association MoneyTree™ Report Q1 2016, IVC.
average rate of nearly 18 % between 2011 and 2015,
By sector, firms in information and communication
while the number of deals went from 207 in 2011 to
technologies (ICT) have captured the largest share of
536 in 2015, up 159 %. However, average deal size
VC investment in Canada (63 %), followed by life
fell 33 % over the same period, from CAD 6.4 m in
sciences (29 %) and clean technologies (6 %). The
2011 to CAD 4.3 m in 2015. By comparison, both the
majority of VC investment occurs in early-stage
USA and Israel have expanded the amount of capital
growth (51 %), while 42 % occurs in the expansion or
per investment – by 135 and 83 % respectively –
later stage of the business life cycle. The remaining
providing greater resources for growth (Figure 14).
7 % of investment consists of seed or start-up
This was not the case with Canada, where most VC viii
capital.
money went to earlier stages of investment at the
expense of later stages.
The Role of Public Institutions
The public sector plays an important role in the
Figure 13: Venture capital invested at company
Canadian VC market. In 2013, the federal
level and number of deals
government launched the Venture Capital Action Plan
Investments in CAD m Number of deals (VCAP), a CAD 400 m initiative to support the
3,000 600 Canadian VC ecosystem. This initiative aims to draw
private sector capital back into this asset class by
2,500 500 investing in four large-scale funds of funds led by the
private sector with the participation of institutional
2,000 400 investors, corporate strategic investors, high net worth
individuals and interested provinces. For every dollar
1,500 300
invested by the public sector, private sector partners
committed CAD 2 to the funds of funds. The Business
1,000 200
Development Bank of Canada manages the VCAP
program.
500 100
0 0
VCAP has been successful. As of 18 May 2016, the
2011 2012 2013 2014 2015 program has attracted CAD 904 m in private sector
Amount of VC Number of deals money back into this asset class. Overall, CAD 1.4 bn
has been raised with government commitments
Source: CVCA.
accounting for one third of this amount (Figure 15).
Page 21Building Momentum in Venture Capital across Europe
Figure 15: Total amount rose by VCAP funds of As a result, the average annual exit size of bigger
ix
funds deals in Canada was CAD 290 m between 2011and
Amount of VC in CAD m 2015, which was nearly half of the US average, also
trailing that of other major countries (Figure 17). Given
Provincial
governments the small size of the Canadian domestic market – there
are fewer funds in Canada overall with less available
capital to invest compared to other economies –
113
Canada has to rely on foreign investors to secure
financing at later stages. Historically, close to half of all
Goverment CAD
of Canada VC raised at that stage came from foreign investors,
340 x
1.4 bn mostly from US investors.
raised by
VCAP Figure 17: Annual average exit size for deals above
904
CAD 100 m, 2011–2015
Private sector Amount of VC in CAD m
China 569
Note: As of May 18, 2016. It excludes the Government’s CAD 50 m
to existing, high-performing funds, which were all closed as of
March 31st 2015.
USA 563
Source: BDC.
Specific Challenges Israel 417
The Canadian VC market has difficulty supporting
firms in the scaling-up phase of the business life UK 338
cycle. In fact, Canadian investors tend to allocate less
capital to later stages of growth, with close to 42 % of
Canada 290
total funds invested in that category, compared to
64 % in the USA and the United Kingdom, 49 % in
0 100 200 300 400 500 600
Israel (Figure 16) and 45 % in Europe (Figure 12). Canada UK Israel USA China
Source: CVCA, Pitchbook
Figure 16: Breakdown of total VC funds invested
by stage, in per cent, 2015
Share of stage in per cent
100
7 8
90 1 2
80 35 34
70 43
51
60
50 i
PricewaterhouseCoopers / National Venture Capital Association (2016).
40 ii
See Strebulaev (2015).
30 64 64
iii
49 The U.S. Small Business Administration. “SBIC Program Overview”, online:
20 42
https://www.sba.gov/sbic/general-information/program-overview
10 iv
Mazzucato, M. (2015).
0
v
Canada Israel UK USA Dilger (2016).
Expansion & Later Early Seed vi
U.S. Department of the Treasury, “State Small Business Credit Initiative
(SSBCI)”, online: https://www.treasury.gov/resource-center/sb-
Note: Stages of investment depend on national categorization. For programs/Pages/ssbci.aspx
Canada, the “Other” category was folded into “Expansion & Later”.
vii
Brigl and Liechtenstein (2015).
Source: CVCA, PricewaterhouseCoopers / National Venture Capital
viii
Association MoneyTree™ Report Q1 2016, Invest Europe / For Canada, the “Other” category was included in “Expansion & Later”.
PEREP_Analytics Source: CVCA.
ix
Only deals above CAD100 m were considered for calculating the average.
x
Data compiled for the 1986–2016 period. Later stages include Series D, E,
F, and G. Sources: BDC.
Page 22General Part
1.3 Fostering the European VC market (health improvement, increase in human capital,
The role of public intervention reduction of air pollution). Since private investors do
Because of the positive effects of VC activity on not take these “externalities” into account, a case can
innovation and economic growth (see part 1.1), be made for the government to invest in companies
governments promote various policies in order to which might create such social benefits directly.
develop their national VC markets. Indeed, economic
literature identifies several mechanisms through which • Second, despite the availability of private funds,
public intervention can foster the development of VC some specific projects might continue to suffer as a
15
markets. result of information asymmetries between
entrepreneurs and investors. For example, since it is
First, the VC industry does not develop spontaneously. costly for private investors to collect information about
In his famous book in which he reframes public investment projects, they might refuse to consider
interventions aiming at developing the VC market, projects which do not reach a certain investment
Lerner (2009) describes how, in its infancy, Silicon threshold level. In the same way, they might exclude
Valley also benefited from various actions taken by the some emerging sectors from their investment strategy,
US government, beginning with defence contracts and because they are not yet able to generate a sufficient
public procurement and followed by the Small Business dealflow. Start-ups at the seed stage are most affected
Investment Companies program (SBIC). As Lerner by the private investors’ reluctance. By bearing risks
shows, creating a viable ecosystem for VC is a learning that private investors are not willing to take, public
process, both for entrepreneurs and investors: it investors play an important role: without their
requires the creation of new specialized actors (such commitment many entrepreneurs would not succeed to
as business angels, incubators, or intermediaries), the start-up and later stage dealflow for private investment
dissemination of a risk-taking culture and knowledge would probably run dry.
diffusion about investment opportunities. As a sign of
• Third, the VC industry is cyclical: fundraising and
16
this learning process, Giot et al. (2014) show that the
performance of private equity funds tends to increase investment flows quickly react to macroeconomic
with their experience, especially during the early indicators and to market expectations regarding
stages. investment opportunities. As witnessed during the
2008/2009 crisis, investments in the VC segment tend
In particular, a common challenge for governments is to collapse in times of economic recession. This
to attract private investors into the VC market, since situation can leave some promising young companies
this segment implies large risks and does not yield without any possibility of external funding. In this
sufficient short term financial returns (given the learning context, direct public intervention can be a useful
process described above). One way of attracting counter-cyclical policy.
private investors to the VC segment consists in sharing
the risks with them through a “fund of fund” approach: Governments can respond to these “market failures”
the government and private investors co-invest in VC with government-owned VC funds. This “direct”
funds, which in turn invest in young innovative firms. intervention is complementary to the “fund of fund”
The goal of this approach is to demonstrate the viability approach, in the sense that funds of funds do not allow
of the VC ecosystem for private investors: in that governments to act in a counter-cyclical way and/or to
regard, the invested funds pursue the objective of select projects with lower financial but higher social
maximizing financial performance and the government return.
remains a minority investor.
Although there are several economic justifications for
The second justification for public intervention lies in public intervention, the efficiency of this intervention
the fact that private investors might not cover all the greatly depends on its design. In particular, it is
needs of the economy. In particular, economic important that this type of intervention is effectively
literature identifies three reasons for which public targeted on market failures and that its dimension is
intervention might improve global welfare: well chosen, in order to avoid adverse effects like a
crowding out of private sector VC funds.
• First, some projects do not yield high financial
returns, but nevertheless have great social value
15 16
See Kraemer-Eis et al. (2016) for a brief review. See the review of Gompers et al. (2008).
Page 23Building Momentum in Venture Capital across Europe
Contribution of the National Promotional respectively. To date, FoF VC has already committed
Institutions (NPIs) EUR 45 m to four funds and, by acting as anchor
Because of the fragmentation and diversity of the investor, it plans to leverage up to EUR 500–600 m.
European VC market, common measures which Finally, according to its new Business Plan 2016–2020,
strengthen the EU market as a whole as well as CDP is also expected to increase its current commit-
precise actions targeting the specific challenges of the ment in VC by launching relevant initiatives in the
national markets are needed. This is why national technology transfer (ITAtech) and accelerators
development banks such as Bpifrance, KfW, CDP, (AccelerateIT) industries. Under the umbrella of the
ICO and the British Business Bank have developed Industry 4.0 Plan 17, ideally these initiatives aim at
instruments that respond to country-specific issues in matching private investment with resources from the
order to support their respective VC markets (see Juncker Plan.
country chapters for more details):
ICO interventions on the VC market are realized
Bpifrance covers all segments on the French VC through Axis, a separate company wholly-owned by
market (seed, early and late stage) and intervenes both ICO. Axis, the oldest VC firm in Spain, has invested
through several funds of funds and direct investments. more than EUR 879 m in the growth of around
Since the end of the 1990s, more than 10 funds of 160 companies and funds since its creation in 1986.
funds have been launched and managed by Bpifrance, In connection with VC, Axis mainly operates via three
mostly dedicated to VC funds: they have invested vehicles. The first one is Fond-ICOpyme, with an
almost EUR 2 bn in more than 130 VC funds, jointly allocation of EUR 250 m (70 % for expansion capital
with other private investors. More recently, Bpifrance and 30 % for start-ups) which may be invested through
increased its direct investment activity, in order to investments in capital, participating loans or a
respond to specific needs of companies in a more combination of both. Another instrument is the Isabel
reactive way. In 2014, new direct investments La Católica Fund-EAF Spain, that provides equity to
represented about 50 companies and EUR 150 m. business angels and other non-institutional investors
for the financing of innovative companies in the form of
KfW supports the German VC market with both direct co-investments (this fund is promoted by Axis and the
and indirect VC investments. Via its own privately EIF but it is managed by the EIF). The third and
managed VC fund “Coparion”, KfW invests in currently main vehicle by which Axis can intervene in
innovative German companies directly. Coparion is a the VC market is Fond-ICO Global, which was
syndication fund which only invests in a company if a launched in March 2013 as the first public fund of funds
private lead investor provides at least the same amount created in Spain. It has EUR 1.5 bn under Axis
of capital on the same financial terms (“pari passu”). management and its main aim is to support the
Further, KfW is invested in the High-Tech Start-up creation of new VC funds managed by private
Fund (HTGF). It is a privately managed seed-fund set managers; Fond-ICO Global operates through public
th
up as a public-private partnership between KfW, the tenders to private agents: after the last tender (the 7 )
Federal Ministry for Economic Affairs and Energy, and it has so far allocated EUR 256 m to funds focused on
established private companies. Via its promotion the first stages with a minimum settlement of
program “ERP-Venture Capital Fund”, KfW invests in investment of EUR 793 m in Spain in said first stages.
selected German and European venture capital funds
focussed on start-up or early growth (second round) The British Business Bank’s main objectives are to
financing. Via ERP-VCF, KfW acts as the cornerstone increase the supply of finance to smaller businesses in
investor attracting private VC funds to the market. areas where markets do not work well and to help
create a more diverse financial market for smaller
CDP is committed to substantially increasing the pace businesses with greater choice of options and
of development of the Italian VC market. For this providers. By the end of December 2015, the British
reason, CDP currently plays a leading role in the Business Bank’s current venture capital programmes
market mainly through Fondo Italiano di Investimento had supported 634 businesses with approximately GBP
SGR SpA (FII). Since 2010, FII has invested in five VC 2.7 bn of equity funding.
funds for a total commitment of about EUR 80 m,
supporting nearly 60 companies. Under CDP’s
direction, FII launched two funds-of-funds (FoF), 17
The „National Plan for Industry 4.0“ was launched in September 2016 by
namely FOF VC and FII Venture in 2014 and 2016 the Italian Government to promote technological change as a pillar of Italian
industrial policy.
Page 24You can also read