2020 State of Reliability - July 2020 An Assessment of 2019 Bulk Power System Performance - NERC
←
→
Page content transcription
If your browser does not render page correctly, please read the page content below
2020
State of Reliability
An Assessment of 2019 Bulk Power
System Performance

July 2020
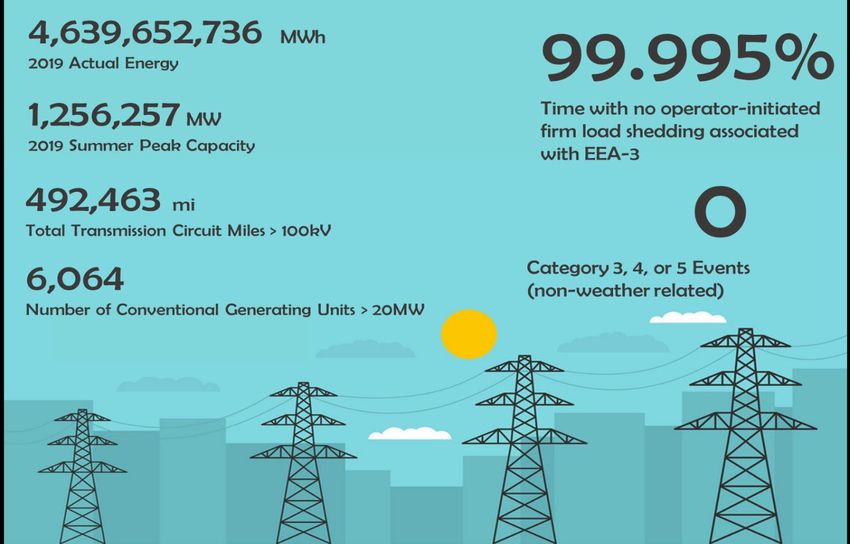
Table of Contents
Preface ........................................................................................................................................................................... iv
About This Report ........................................................................................................................................................... v
   Development Process .................................................................................................................................................. v
   Primary Data Sources .................................................................................................................................................. v
   Impacts of COVID-19 Pandemic .................................................................................................................................. v
   Reading this Report .................................................................................................................................................... vi
Executive Summary ...................................................................................................................................................... viii
   Key Findings ................................................................................................................................................................ ix
   Recommendations....................................................................................................................................................... x
Chapter 1: The North American BPS—By the Numbers ................................................................................................. 1
Chapter 2: Event Analysis Review ................................................................................................................................... 3
   Bulk Power System Awareness, Inputs, and Products ................................................................................................ 3
   NERC Alerts .................................................................................................................................................................. 4
   2019 Event Analysis Summary..................................................................................................................................... 4
   Event Trends ................................................................................................................................................................ 7
   Review of Major Events (Category 3, 4, and 5) ........................................................................................................... 8
   2019 Lessons Learned ................................................................................................................................................. 9
Chapter 3: Reliability Indicators .................................................................................................................................... 10
   Reliability Indicators and Trends ............................................................................................................................... 10
   Resource Adequacy ................................................................................................................................................... 12
   Transmission Performance and Unavailability .......................................................................................................... 17
   Generation Performance and Availability ................................................................................................................. 27
   System Protection and Disturbance Performance .................................................................................................... 29
Chapter 4: Severity Risk Index....................................................................................................................................... 38
   Severity Risk Index and Trends .................................................................................................................................. 39
Chapter 5: Trends in Priority Reliability Issues.............................................................................................................. 44
   Emerging Risk Areas .................................................................................................................................................. 44
   BPS Planning and Adapting to the Changing Resource Mix ...................................................................................... 45
   Impacts of Inverter-Based and Distributed Energy Resources on the BPS ............................................................... 48
   Increasing Complexity in Protection and Control Systems ....................................................................................... 52
   Loss of Situation Awareness ...................................................................................................................................... 59
   Bulk Electric System Impact of Extreme Event Days ................................................................................................. 64
   Expanded Eastern Interconnection: Transmission Impacts during Extreme Days .................................................... 67

                                                                     NERC | State of Reliability | 2020
                                                                                     ii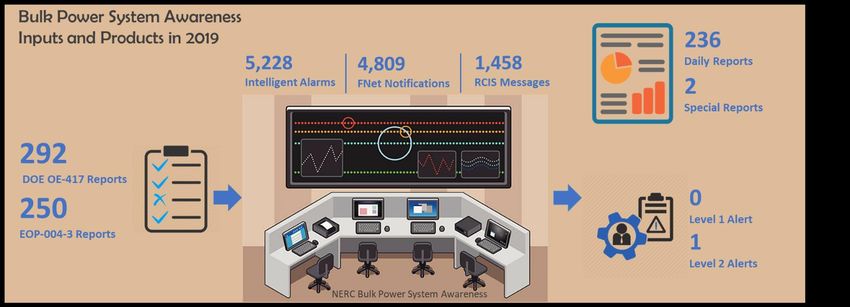
Table of Contents

   Expanded Eastern Interconnection: Generation Impacts during Extreme Days ....................................................... 68
   ERCOT Interconnection: Transmission Impacts during Extreme Days ...................................................................... 69
   ERCOT Interconnection: Generation Impacts during Extreme Days ......................................................................... 70
   Western Interconnection: Transmission Impacts during Extreme Days ................................................................... 71
   Western Interconnection: Generation Impacts during Extreme Days ...................................................................... 72
   Cyber and Physical Security ....................................................................................................................................... 74
   Critical Infrastructure Interdependencies: Electric-Gas Working Group .................................................................. 81
Appendix A: Compilation of Recommendations ........................................................................................................... 82
Appendix B: Contributions ............................................................................................................................................ 85

                                                                NERC | State of Reliability | 2020
                                                                               iii
Preface

Electricity is a key component of the fabric of modern society and the Electric Reliability Organization (ERO) Enterprise
serves to strengthen that fabric. The vision for the ERO Enterprise, which is comprised of the North American Electric
Reliability Corporation (NERC) and the six Regional Entities (REs), is a highly reliable and secure North American bulk
power system (BPS). Our mission is to assure the effective and efficient reduction of risks to the reliability and security
of the grid.

                                         Reliability | Resilience | Security
                       Because nearly 400 million citizens in North America are counting on us

The North American BPS is divided into six RE boundaries as shown in the map and corresponding table below. The
multicolored area denotes overlap as some load-serving entities participate in one RE while associated Transmission
Owners (TOs)/Transmission Operators (TOPs) participate in another.

                                 MRO         Midwest Reliability Organization
                                 NPCC        Northeast Power Coordinating Council
                                 RF          ReliabilityFirst
                                 SERC        SERC Reliability Corporation
                                 Texas RE    Texas Reliability Entity
                                 WECC        WECC

                                              NERC | State of Reliability | 2020
                                                             iv
About This Report
The purpose of this annual report is to provide objective and concise information to policymakers, industry leaders,
and the NERC Board of Trustees (Board) on issues affecting the reliability and resilience of the North American BPS.
Specifically, the report does the following:
Identifies system performance trends and emerging reliability risks
Reports on the relative health of the interconnected system
Measures the success of mitigation activities deployed
NERC, as the ERO of North America, assures the effective and efficient reduction of risks to reliability and security for
the North American BPS. Annual and seasonal risk assessments that look to the future and special reports on
emergent risks serve to identify and mitigate potential risks. Additionally, analyses of past BPS performance serve to
document BPS adequacy and to identify positive or negative performance trends. The annual State of Reliability
report is one such analysis of past performance that informs regulators, policymakers, and industry leaders while
providing strong technical support for those interested in the underlying data and detailed analytics.
Development Process
The ERO staff developed this independent assessment with support from the Performance Analysis Subcommittee.
The 2020 State of Reliability report focuses on BPS performance during the prior complete year as measured by a
predetermined set of reliability indicators and more detailed analysis performed by ERO staff and technical
committee participants. This report has been endorsed by the Reliability and Security Technical Committee and
accepted by the NERC Board.
Primary Data Sources
In addition to a variety of information-sharing mechanisms—including (but not limited to) the NERC Planning
Committee, Operating Committee, Critical Infrastructure Protection Committee, and the Electricity Information
Sharing and Analysis Center (E-ISAC)—the ERO administers and maintains the information systems described in
Figure AR.1.
Impacts of COVID-19 Pandemic
The global health crisis has elevated the electric reliability risk profile due to potential workforce disruptions, supply
chain interruptions, and increased cyber security threats. An in-depth evaluation of any impacts due to COVID-19 on
BPS operations in 2020 will be a focus of the 2021 State of Reliability report, which is typically published mid-year. The
2020 Long-Term Reliability Assessment, which is expected to be published in December 2020, will also assess any
longer-term reliability issues that need to be considered in future operations and planning of the BPS. The NERC
Pandemic Preparedness and Operational Assessment1 (April 2020) specifically covered pandemic preparedness,
possible risks to system operations, maintenance and resource planning, ERO Enterprise business continuity, and
lessons learned from outside North America; NERC did not identify any specific threat or degradation to the reliable
operation of the BPS for the spring time frame. The ERO continues to assess risks and conditions and is pursuing all
available avenues to continue coordination with federal, state, and provincial regulators as well as to work with
industry to identify reliability implications and lessons learned.
1
https://www.nerc.com/pa/RAPA/ra/Reliability%20Assessments%20DL/NERC_Pandemic_Preparedness_and_Op_Assessment_Spring_2020.p
df
NERC | State of Reliability | 2020
v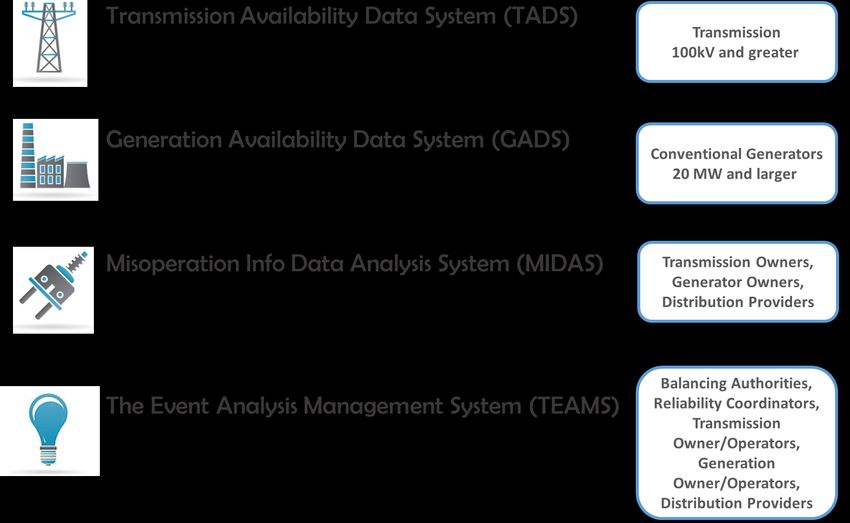
About This Report

               Figure AR.1: Information Systems Administered and Maintained by the ERO

Reading this Report
This report is divided into five chapters (see Table AR.1).

                                     Table AR.1: State of Reliability Major Parts

    The North American                Detailed statistics on peak demand, energy, generation capacity, fuel mix,
    BPS—By the Numbers2               transmission miles, and functional organizations

                                      A detailed review of qualified events analyzed by NERC, including root cause
    Event Analysis Review
                                      statistics, historical trends, and highlights of published lessons learned

                                      A set of reliability metrics that evaluate four core aspects of system performance:
    Reliability Indicators            resource adequacy, transmission performance and availability, generation
                                      performance and availability, and system protection and disturbance performance

                                      A composite daily severity index based on generation, transmission, and load loss
    Severity Risk Index
                                      and compared to prior years

                                      Data and analysis from various NERC data sources compiled to provide clear insights
    Trends in Priority
                                      on a variety of priority reliability issues (included assessments help provide
    Reliability Issues
                                      guidance to policy makers, industry leaders, and the NERC Board)

2   Definition of BPS: https://www.nerc.com/pa/Stand/Glossary%20of%20Terms/Glossary_of_Terms.pdf

                                                   NERC | State of Reliability | 2020
                                                                  vi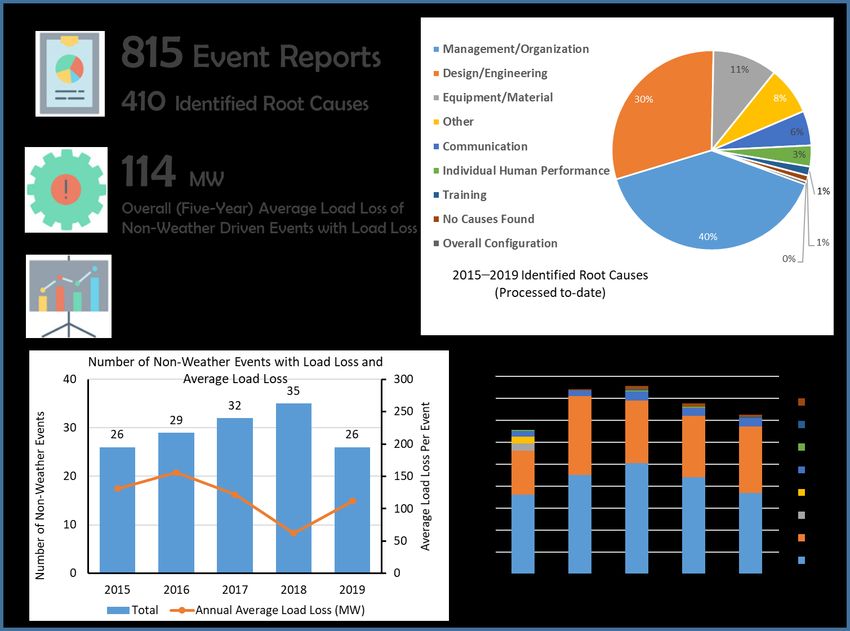
About This Report
Additional Considerations
The data in this report represents the performance for the January–December 2019 operating year unless
otherwise noted.
Analysis in this report is based on 2015–2019 data and provides a basis to evaluate 2019 performance relative
to performance over the last five years.
This report is a review of industry-wide trends and not a review of the performance of individual entities.
Accordingly, information presented in this report is always aggregated to the Interconnection level or the
regional level in order to maintain the anonymity of individual reporting organizations.
The background on approaches, methodologies, statistical tests, and procedures are available by request.
When analysis is presented by Interconnection, the Québec Interconnection is included in the Eastern
Interconnection unless specific analysis for Québec is shown.
NERC | State of Reliability | 2020
vii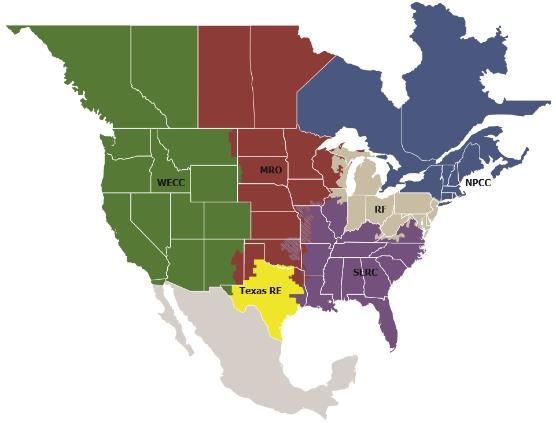
Executive Summary
The 2020 State of Reliability report is NERC’s independent assessment focused on BPS performance during 2019 as
measured by a predetermined set of reliability indicators. This annual report is an analysis of past performance that
informs regulators, policymakers, and industry leaders of reliability and performance trends, needed actions to
address known and emerging risks, and whether mitigating actions have led to positive improvements on the system.
Overall, 2019 was a very good year for BPS reliability. Performance trends in terms of generation, transmission, and
protection and control measures are generally positive. The electricity sector is undergoing significant and rapid
changes to the generation resource mix that present new challenges and opportunities for reliability. In addition,
persistent cyber and physical security threats present critical challenges to BPS reliability that require industry and
regulators to remain vigilant. With appropriate insight, careful planning, and continued support, the sector will
continue to navigate the challenges in a manner that maintains reliability. As a core element of the ERO’s mission,
NERC remains focused on identifying emerging risks in order to maintain a proactive posture to assure that the BPS
remains highly reliable.
Metrics showed improvement in numerous areas. Declining performance areas, while noted, did not show significant
change. Reliability indicators detailed in Chapter 3 show the following:
Metrics That Show Improving Performance
The Weighted-Equivalent Generation Forced Outage Rate (WEFOR) is declining.
The impact of transmission outages on the Bulk Electric System (BES) is decreasing.
The number of automatic transmission outages from ac circuits and transformers caused by human error is
decreasing.
The rate of Protection System Misoperations has decreased.
Metrics That Indicate Declining Performance
The count and severity of energy emergency alerts (EEAs) is increasing.
The Planning Reserve Margin continues to not meet expected thresholds in some areas.
The instances of transmission-related events resulting in loss of load increase in number and severity from
2018.
Element unavailability for ac circuits and transformers showing an increase due to operational outages.3
Interconnection reliability operating limit exceedances in the expanded Eastern Interconnection4 increase in
number and duration.
Metrics That Show No Major Change
Interconnection frequency response has been stable.
3 Operational Outage: A nonautomatic outage for the purpose of avoiding an emergency (i.e., risk to human life, damage to equipment, damage
to property) or to maintain the system within operational limits and that cannot be deferred. Includes non-automatic outages that result from
manual switching errors.
4 The expanded Eastern Interconnection includes the Eastern and Québec Interconnections
NERC | State of Reliability | 2020
viii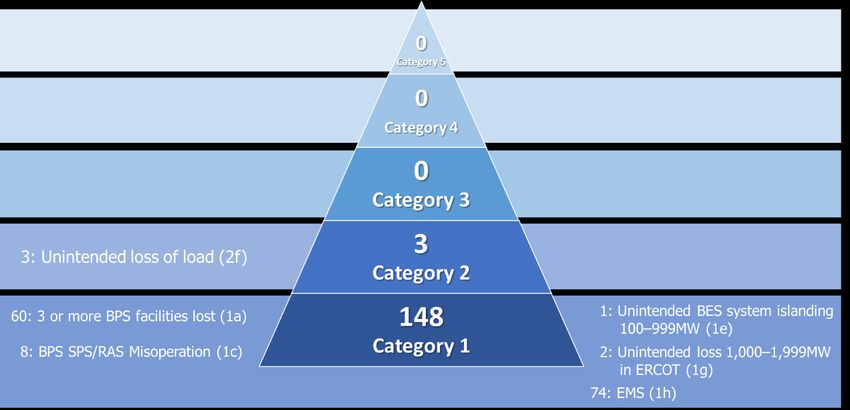
Executive Summary

Key Findings
Based on data and information collected for this assessment, NERC has identified the following key findings for 2019:

Key Finding 1
The system was highly reliable in 2019.
2019 was a year of high reliability with no Category 3, 4, or 5 events and only two EEA Level 3 conditions that led to
firm load shedding of 250 MW. Firm load was interrupted 0.005% of the time due to EEAs Level 3. For more detailed
information, refer to Chapter 2.

Key Finding 2
In Texas, the projected capacity deficit remains a reliability risk in 2020; however, better than expected
performance from the generation fleet helped meet 2019 summer peak demand.
Texas continues to have insufficient resources to meet the Reference Margin Level but still successfully met demand
throughout the 2019 summer season. Despite having set a new system-wide peak demand record of 74,666 MW on
August 12, 2019, sufficient resources were available throughout the peak day to remain above reserve requirements;
this was primarily due to higher than average contribution from wind generation resources and lower than average
total generation outages. For more detailed information, refer to Chapter 3.

Key Finding 3
Local energy-assured generation remains necessary for reliability.
In 2019, the Western Interconnection experienced its most extreme transmission day in the past five years, consisting
of a combination of the loss of a major dc flow line, repeated outages of 500 kV ac circuits, and inverter-based
resource unavailability related to the Saddleridge Fire. Impacts of the event were minimized due to the availability of
local thermal generation and good operator judgment. These observations emphasize the need for adequate local
energy-assured generation. For more detailed information, refer to Chapter 5.

Key Finding 4
NERC and industry stakeholders are advancing solutions to the addition of more inverter-based resources.
Inverter-based resources include solar photovoltaic (PV), battery storage, and many forms of wind generation. As
more of these resources are added to the system, NERC and industry stakeholders are working to identify solutions
to emerging reliability challenges. In 2017, NERC established the Inverter-Based Resource Performance Task Force
(IRPTF) to study the issue and inform industry of the risks posed and options for mitigating them. In 2019, industry
continued implementation of the Inverter-Based Resource Performance Guideline.5 This, along with wide-spread
recognition of the challenge, has gathered the industry’s best technical experts to develop solutions through a variety
of new protection and control requirements, clarification to NERC Reliability Standards, and technical specifications
through IEEE. For more detailed information, refer to Chapter 5.

Key Finding 5
Frequency response improved or remained stable in all Interconnections.
Frequency response arrests and stabilizes frequency during system disturbances. NERC closely monitors the
frequency response of each of the four Interconnections and measures the margin at which under-frequency load
shedding (UFLS) would be activated. UFLS provides a vital safety net for preserving Interconnection reliability, and
measuring the margin allows NERC and the industry to ensure there is adequate frequency response on the system.
For all Interconnections, frequency response performance improved or was stable in the arresting and stabilizing
periods. For more detailed information, refer to Chapter 3.

5   https://www.nerc.com/comm/PC_Reliability_Guidelines_DL/Reliability_Guideline_IBR_Interconnection_Requirements_Improvements.pdf

                                                         NERC | State of Reliability | 2020
                                                                        ix
Executive Summary
Key Finding 6
Protection System Misoperations rate continues to decline.
Protection system misoperations exacerbate the severity of transmission outages. The overall misoperations rate was
slightly lower in 2019 vs. 2018 (7.95%, down from 8.0% in 2018). Over the past five-year period, the misoperations
rate shows a statistically significant downward (positive) trend. The three largest causes of misoperations in 2019
have remained consistent during this time: Incorrect Settings/Logic/Design Errors, Relay Failure/Malfunctions, and
Communication Failures. For more detailed information, refer to Chapter 3.
Key Finding 7
There were no reportable cyber or physical security incidents in 2019.
Despite continually evolving threats to the BPS, no cyber or physical security incidents led to unauthorized control
actions or loss of load occurred in 2019. The industry should continue to drive improvements in its security posture
through technological hardening, growing a culture of security, and increasing effective information exchange
between entities, the E-ISAC, and trusted partner organizations. For more detailed information, refer to Chapter 5.
Recommendations
Based on these key findings, NERC formulated the following high-level recommendations:
The ERO and industry should continue improving their ability to model, plan, and operate a system with a
significantly different resource mix. Priority should be given to understanding the implications of the
following:
Frequency response under low inertia conditions
Contributions of inverter-based resources to essential reliability services
Increasing protection system and restoration complexities with increased inverter-based resources
System planners should evaluate the need for flexibility as conventional generation retirements are
considered by industry and policymakers. Retirement planning studies should consider Interconnection-level
impacts and sensitivity assessments associated with the loss of critical transmission paths and the loss of local
generation in larger load pockets.
The ERO and industry should develop comparative measurements and metrics to understand the different
dimensions of resilience (e.g., withstanding the direct impact, managing through the event, recovering from
the events, preparing for the next event) during the most extreme events and how system performance
varies with changing conditions.
The ERO and industry should continue to work closely together to understand and share information on cyber
and physical security threats and mitigate the risks posed by these threats through a variety of approaches,
including resilient system design, consequence-informed planning and operation, and practicing response
and recovery processes.
NERC | State of Reliability | 2020
xExecutive Summary
Emerging Risk Areas
In addition to these high-level recommendations, Chapter 5 includes more detailed and tactical recommendations
for each of the identified four high level risks from the 2019 ERO Reliability Risk Priorities Report:6
BPS Planning and Adapting to the Changing Resource Mix
Impacts of Inverter-Based and Distributed Energy Resources on the BPS
Increasing Complexity in Protection and Control Systems
Human Performance and Skilled Workforce
Loss of Situation Awareness
Bulk Electric System Impact of Extreme Event Days
Cyber and Physical Security
Critical Infrastructure Interdependencies: Electric-Gas Working Group
6 https://www.nerc.com/comm/RISC/Related%20Files%20DL/RISC%20ERO%20Priorities%20Report_Board_Accpeted_November_5_2019.pdf
NERC | State of Reliability | 2020
xiChapter 1: The North American BPS—By the Numbers
Figure 1.1 shows some numbers and facts about the North American BPS. The text box on the next page defines BPS
reliability.
Time with no operator-initiated
firm load shedding associated
with EEA Level 3
Figure 1.1: 2019 BPS Inventory and Performance Statistics and Key Functional Organizations
NERC | State of Reliability | 2020
1Chapter 1: The North American BPS—By the Numbers
How NERC Defines BPS Reliability*
NERC defines the reliability of the interconnected BPS in terms of three basic and functional aspects as follows:
Adequacy: The ability of the electric system to supply the aggregate electric power and energy requirements of electricity
consumers at all times while taking into account scheduled and reasonably expected unscheduled outages of system
components
Operating Reliability: The ability of the electric system to withstand sudden disturbances, such as electric short circuits or
unanticipated loss of system components
Regarding adequacy, system operators can and should take controlled actions or introduce procedures to maintain a
continual balance between supply and demand within a balancing area (formerly known as a control area). Emergency actions
in a capacity deficit condition include public appeals and the following:
Interruptible demand that the end‐use customer makes available to its load-serving entity via contract or agreement
for curtailment
Voltage reductions (often referred to as “brownouts” because incandescent lights will dim as voltage is lowered,
sometimes as much as 5%)
Rotating interruptions/outages where a preplanned set of distribution feeders is interrupted for a limited time and
put back in service and another set is interrupted, thus, “rotating” the outages
Under the heading of operating reliability are all other system disturbances that result in the unplanned and/or uncontrolled
interruption of customer demand, regardless of cause. When these interruptions are contained within a localized area, they
are considered unplanned interruptions or disturbances. When these interruptions spread over a wide area of the grid, they
are referred to as “cascading blackouts” (uncontrolled successive loss of system elements triggered by protective systems).
The intent of the set of NERC Reliability Standards is to deliver an adequate level of reliability (ALR).
Adequate Level of Reliability: The state that the design, planning, and operation of the BES will achieve when the following
reliability performance objectives are met with the following considerations:
The BES does not experience instability, uncontrolled separation, cascading, and/or voltage collapse under normal
operating conditions when subject to predefined disturbances.
BES frequency is maintained within defined parameters under normal operating conditions and when subject to
predefined disturbances.
BES voltage is maintained within defined parameters under normal operating conditions and when subject to
predefined disturbances.
Adverse reliability impacts on the BES following low-probability disturbances (e.g.., multiple contingencies, unplanned and
uncontrolled equipment outages, cyber security events, malicious acts) are managed.
Restoration of the BES after major system disturbances that result in blackouts and widespread outages of BES elements is
performed in a coordinated and controlled manner.
For less probable severe events (i.e., losing an entire right of way due to a tornado, simultaneous or near simultaneous
multiple transmission facilities outages due to a hurricane, sizeable disruptions to natural gas infrastructure impacting
multiple generation resources, or other severe phenomena), BES owners and operators may not be able to apply
economically justifiable or practical measures to prevent or mitigate an adverse reliability impact on the BES even if these
events can result in cascading, uncontrolled separation or voltage collapse.
Definition of BES: https://www.nerc.com/pa/Stand/Glossary%20of%20Terms/Glossary_of_Terms.pdf
NERC | State of Reliability | 2020
2Chapter 2: Event Analysis Review
The ERO Event Analysis Process (EAP)7 is used when examining disruption events that occur on the BPS. The EAP
makes use of the ERO Bulk Power System Awareness (BPSA) program to feed the voluntary process with real-time
reporting of potential events on the BPS. Information is gathered and applied to set definitions that meet a threshold
considered significant enough to inform risk monitoring and mitigation of daily operations on the BPS. Review and
analysis of this information helps identify potential reliability risks or emerging threats. The ERO and partner entities
can address these threats by promoting reliability through collaboration with each other and by being learning
organizations.
The primary reason for participating in an event analysis is to determine if there are lessons to be learned and shared
with the industry. The analysis process involves identifying what happened, why it happened, and what can be done
to prevent recurrence. Identification of the sequence of events answers the “what happened” question, and
determination of the root cause of an event answers the “why” question. Event analysis ultimately informs the
identification of trends on the BPS. These trends may identify the need to take action, such as the issuance of a NERC
alert to the owners and operators of the system to take an action or initiate the need for the development of or
revisions to Reliability Standards.
Bulk Power System Awareness, Inputs, and Products
NERC BPSA collects and analyzes information on system disturbances and other incidents that have an impact on the
North American BPS and disseminates this information to internal departments, registered entities, regional
organizations, and governmental agencies as necessary. Also, BPSA monitors ongoing storms, natural disasters, and
geopolitical events that may potentially impact or are currently impacting the BPS.
Figure 2.1 illustrates a number of monitoring sources, which includes owners and operators submitting a U.S.
Department of Energy – Office of Electricity (DOE-OE) Form 417 and/or the event reporting form found in NERC
Reliability Standard EOP-004. NERC also processes data coming in from intelligent alarms, GPS-synchronized
frequency sensors via the FNET that is operated by the University of Tennessee, and messages through the Reliability
Coordinator Information System (RCIS). As a result of the gathering and analysis of BPSA data, a NERC alert may be
published.
Figure 2.1: Bulk Power System Awareness by the Numbers
7 For purposes of this report, the EAP in effect was version 3.1: http://www.nerc.com/pa/rrm/ea/ERO_EAP_Document/ERO_EAP_v3.1.pdf
NERC | State of Reliability | 2020
3Chapter 2: Event Analysis Review
NERC Alerts
NERC is responsible for issuing alerts to registered entities and the electricity sector when NERC discovers, identifies,
or is provided with information that is critical to ensuring the reliability of the BPS. One alert was issued in 2019
concerning supply chains.
Level 2 Recommendation NERC Alert Based on Section 889 of the National Defense
Authorization Act for Fiscal Year 2019
On July 16, 2019, NERC released a Level 2 (recommendation) alert to raise awareness among NERC registered entities
of persistent supply chain risks related to certain Chinese manufacturers and to request information to assess the
extent of exposure of the BPS to these risks. Analysis of the responses suggest minimal exposure of the BPS through
branded products from the named Chinese telecommunications and video surveillance manufacturers and a
somewhat more common use of Chinese manufactured or supplied unmanned aerial systems (UASs) for maintenance
or asset management activities.
NERC continues to address these supply chain risks through the Critical Infrastructure Protection Reliability Standards
and through information sharing and collaboration by the E-ISAC.
2019 Event Analysis Summary
In 2019, industry reported 148 qualified events8 to the ERO Enterprise. The majority of the reports (145) were
Category 1 events. The most common event categories reported in 2019 were energy management system (EMS)
events and the loss of three or more BPS facilities. See Figures 2.2–2.4 for a summary of events and definitions for
event categories in the text box on the next page.
Figure 2.2: 2019 Qualified Events by Category
Events are assigned a category with Category 1 (the least severe) through Category 5 (the most severe). For the full
definition of the categories used in 2019 refer the text box on the next page 9 that comes out of the ERO EAP Version
3.1.10
8 For a list of definitions of Qualified Events, see the text box on the next page.
9 Category 1f and 2b were retired as of version 3.0 of the ERO Event Analysis Process
10 https://www.nerc.com/pa/rrm/ea/ERO_EAP_Documents%20DL/ERO_EAP_v3.1.pdf
NERC | State of Reliability | 2020
4Chapter 2: Event Analysis Review
Categories and Subcategories for Qualifying Events
Category 1: An event that results in one or more of the following
a. An unexpected outage that is contrary to design of three or more BES facilities caused by a common disturbance, listed here:
i. The sustained outage of a combination of three or more BES facilities
ii. The outage of an entire generation station of three or more generators (aggregate generation of 500 MW to 1,999 MW); each
combined-cycle unit is counted as one generator
b. Intended and controlled system separation by the proper operation of a special protection system (SPS) or remedial action
scheme (RAS) in New Brunswick or Florida from the Eastern Interconnection
c. Failure or misoperation of a BES SPS/RAS
d. System-wide voltage reduction of 3% or more that lasts more than 15 continuous minutes due to a BES emergency
e. Unintended BES system separation that results in an island of 100 MW to 999 MW. This excludes BES radial connections and non-
BES (distribution) level islanding
g. In ERCOT, unintended loss of generation of 1,000 MW to 1,999 MW
h. Loss of monitoring or control at a control center such that it significantly affects the entity’s ability to make operating decisions
for 30 continuous minutes or more. Some examples that should be considered for Event Analysis reporting include, but are not
limited to, the following:
i. Loss of operator ability to remotely monitor or control BES elements
ii. Loss of communications from supervisory control and data acquisition (SCADA) remote terminal units (RTUs)
iii. Unavailability of inter-control center protocol (ICCP) links, which reduces BES visibility
iv. Loss of the ability to remotely monitor and control generating units via automatic generator control
v. Unacceptable state estimator or real time contingency analysis solutions
Category 2: An event that results in one or more of the following
a. Complete loss of interpersonal communication and alternative interpersonal communication capability affecting its staffed BES
control center for 30 continuous minutes or more.
c. Voltage excursions within a Transmission Operator’s (TOPs) footprint equal to or greater than 10%, lasting more than 15
continuous minutes
d. Complete loss of off-site power to a nuclear generating station per the Nuclear Plant Interface Requirement
e. Unintended system separation that results in an island of 1,000 MW to 4,999 MW
f. Unintended loss of 300 MW or more of firm load for more than 15 minutes
g. Interconnection reliability operating limit (IROL) violation for time greater than T v
Category 3: An Event that Results in One or More of the Following
a. Unintended loss of load or generation of 2,000 MW or more.
b. Unintended system separation that results in an island of 5,000 MW to 10,000 MW
c. Unintended system separation (without load loss) that islands Florida from the Eastern Interconnection
Category 4: An Event that Results in One or More of the Following
a. Unintended loss of load or generation from 5,001 MW to 9,999 MW
b. Unintended system separation that results in an island of more than 10,000 MW (with the exception of Florida as described in
Category 3c)
Category 5: An Event that Results in One or more of the Following
a. Unintended loss of load of 10,000 MW or more
b. Unintended loss of generation of 10,000 MW or more
NERC | State of Reliability | 2020
5Chapter 2: Event Analysis Review
While the number of events per year has not changed significantly since 2016, it is notable that a large percentage of
events each year are Category 1 events. The five-year trends are shown in Figure 2.3.
Figure 2.3: Number of Events per Category by Year
Figure 2.4 indicates the event root cause trend to date. Of particular note, the largest contributors remain
Management/Organization and Design/Engineering causes and are discussed in more detail in the Event Trends
section.
Figure 2.4: 2015–2019 Identified Event Root Causes (Processed to Date)
NERC | State of Reliability | 2020
6Chapter 2: Event Analysis Review
Event Trends
There were 148 BPS events reported to NERC in 2019; this is comparable to the number of events reported per year
in the preceding four-year period. In total, 815 event reports were submitted between 2015 and 2019. A large portion
of analyzed events (50%) over the past five years did not yield a root cause, resulting in dependence on the
contributing causes for insights into the associated events; the trend for this scenario is in steady decline since 2015
(see Figure 2.5, but note that processing of 2019 events is incomplete), potentially indicating increased familiarization
with event analysis reporting system-wide. Continued focus on reporting needs and information quality will reinforce
the downward trending year-over-year. Some common reasons for the less-than-optimal root cause yield include the
inability to discern among competing contributing causes, reporting limited to “what” rather than “why,” and a third
party (beyond the reporting entity's control/direction) influenced the outcome of the event (preventing an entity-
controlled corrective action).
Figure 2.5: Percentage of Events with No Root Cause Identified
Of the 410 identified root causes, Management/Organization was identified as the leading root cause in 40% (see
Figure 2.6), a total of 163 events, of all identified root causes. Some topics considered in Management/Organization
causes are management/supervisory methods, resource management, work organization and planning, and change
management efforts. Some examples of these causes are the correct identification of a cause for a previous event
but failure to implement a good corrective action plan prior to another similar event occurring, not identifying a
special circumstance that needed to be addressed during work, and failure to recognize that a second system might
be impacted by work currently being performed.
Design/Engineering was the second leading cause in 30%, 123 events (see Figure 2.6, upper right), of all identified
root causes. Cause considerations include design input, design output, documentation, installation, verification, and
operability of design and/or environment issues. Some examples of these causes are shortfall in the scoping of the
design because of failure to realize that a protection system was not configured to account for mutual coupling or a
protection system’s timer setting was not set to allow another action to complete prior to timing out. In many cases,
there were usually processes, procedures, or other barriers that either were not sufficient to catch the error or were
not in use. See Figure 2.6 for a summary of event analysis trends.
NERC | State of Reliability | 2020
7Chapter 2: Event Analysis Review
Figure 2.6: Summary of 2015–2019 Event Analysis Trends
The number of events with load loss steadily increased over the four years before returning to the first year’s level
of the current rolling data window (2015–2019) as shown in the lower left of Figure 2.6. The associated load loss
averages trend remains effectively flat over the displayed periods; this demonstrates that, although there were more
load loss events from year-to-year in 80% of the data period, the order of magnitude of loss remains relatively low,
consistent, and not statistically significant.
The number of Category 1 events is stable over the last five years. Starting in 2016, Category 2b—Complete Loss of
SCADA, Control or Monitoring Functionality for 30 Minutes or More—was retired. This resulted in future reporting of
EMS-related events being shifted to Category 1h. This change in reporting resulted in a step-increase for the Category
1 total event count, shown in the lower right of Figure 2.6.
Review of Major Events (Category 3, 4, and 5)
No Category 3, 4, or 5 events occurred in 2019.
NERC | State of Reliability | 2020
8Chapter 2: Event Analysis Review
2019 Lessons Learned
In support of the industry led EAP, one the ERO‘s primary objectives is to publish lessons learned. In 2019, a total of
11 lessons learned were published. Topics covered included operations, communications, transmission facilities, and
relaying and protection systems. See Table 2.1 for a list of lessons learned published in 2019. The lifetime total for
publication of lessons learned through 2019 is 160. Visit the Lesson Learned11 page on the NERC website for a full list
of lessons learned published to date.
Table 2.1: Lessons Learned Published in 2019
LL # Category Title
Generation Facilities, Moisture Intrusion in Hermetically Sealed Metering Current
LL20191201
Transmission Facilities Transformers
LL20190901 Communications Risks Posed by Firewall Firmware Vulnerabilities
LL20190804 Transmission Facilities Breaker Failure due to Multiple Reclose Attempts
LL20190803 Transmission Facilities Inadvertent CVT Fuse Removal on a Live Circuit
LL20190802 Transmission Facilities RAS Unexpected Operation
Loss of Monitoring or Control Capability due to Power Supply
LL20190801 Communications
Failure
Telecom Provider Failure Induced Loss of ICCP from Regional
LL20190503 Communications
Neighbors
Enhanced Alarming Can Help Detect State Estimator and Real-Time
LL20190502 Communications
Contingency Analysis Issue
Automatic Capacitor Operations along Radial Feed Result in Load
LL20190501 Transmission Facilities
Shed
Generation Facilities,
LL20190202 Substation Fires: Working with First Responders
Transmission Facilities
Generation Facilities,
LL20190201 Current Drone Usage
Transmission Facilities
11 https://www.nerc.com/pa/rrm/ea/Pages/Lessons-Learned.aspx
NERC | State of Reliability | 2020
9Chapter 3: Reliability Indicators
This chapter provides a summary of the reliability indicators established by the ERO in concert with the Performance
Analysis Subcommittee. Reliability indicators tie the performance of the BPS to a set of reliability performance
objectives defined by NERC. Reliability performance objectives are established and defined using NERC’s definition
of adequate level of reliability (ALR). Each reliability indicator is mapped to a specific performance objective and is
then evaluated to determine whether the actual performance of the system meets the expectations of ALR. Trending
is also developed (typically, a prior five-year historical period), which helps determine whether certain aspects of
reliability are improving, declining, or stable. A summary and additional details on methods and approaches follows.
Reliability Indicators and Trends
The reliability indicators below represent four core aspects to system performance that are measurable and
quantifiable:
Resource Adequacy: Does the system have enough capacity, energy, and ancillary services?
Transmission Performance and Availability: Is the transmission system adequate to deliver electricity to all
loads reliably?
Generation Performance and Availability: Is the generation fleet energy limited?
System Protection and Disturbance Performance: Will the system withstand disturbances and remain
stable?
Reliability performance and trends of individual metrics should be evaluated within the context of the entire set of
metrics.
Metrics are rated on a four-point color scale:
Red: Actionable, may lead to key finding
Yellow: Monitor
White: Stable or no change
Green: Improving
Table 3.1 summarizes the reliability indicators categories and names, the color scale applied, and links to each
indicator’s chapter of details.
Some of the reliability indicators have been evaluated to determine whether they exhibit statistically significant
trends or whether the year-on-year changes all fall within a narrower band of confidence. Where statistically
significant trends are observed, NERC uses the following notation:
NERC | State of Reliability | 2020
10Chapter 3: Reliability Indicators
Table 3.1: Summary of Reliability Indicators
Indicator
Indicator Name 2019 Performance and Trend Results
Category
Planning Reserve Margin Texas RE-ERCOT Assessment Area
Eastern Interconnection
Resource
Western Interconnection
Adequacy Energy Emergency Alerts
Texas Interconnection
Québec Interconnection
Transmission-Related Events Resulting in Loss of
Transmission greater than 100kV
Load
Protection System
Human Error
Automatic AC Transmission Outages
Transmission AC Substation Equipment
Performance AC Circuit Equipment
and
Unavailability Protection System
Automatic AC Transformer Outages Human Error
AC Substation Equipment
AC Circuits
Transmission Element Unavailability
Transformers
Generation
Performance Weighted-Equivalent Generation Forced Outage Conventional Generation greater than
and Rate 20 MW
Availability
Eastern Interconnection
Western Interconnection
Interconnection Frequency Response
Texas Interconnection
System
Québec Interconnection
Protection
and Disturbance Control Standard Metric Disturbance Recovery Period
Disturbance
Performance Protection System Misoperations BES Protection Systems
Expanded Eastern Interconnection
Interconnection Reliability Operating Limit
Western Interconnection
Exceedances
Texas Interconnection
NERC | State of Reliability | 2020
11Chapter 3: Reliability Indicators
Resource Adequacy
For this report, two measures have been selected to indicate the status of resource adequacy for the BES: Planning
Reserve Margin and EEAs. Planning Reserve Margin presents the forward-looking perspective on whether sufficient
resources are expected to be available to meet demand. The EEAs provide real-time indication of potential and actual
energy emergencies within an Interconnection.
Planning Reserve Margin
Planning Reserve Margin Texas RE-ERCOT Assessment Area
This metric counts the number of areas reporting “adequate,” “marginal,” or “inadequate” Planning Reserve Margins
for the 2019 summer and 2019/2020 winter. NERC assesses resource adequacy by evaluating each assessment area’s
Planning Reserve Margins relative to its Reference Margin Level. On the basis of projected reserves, NERC determines
the associated risk by using the following framework:
Adequate: Anticipated Reserve Margin is greater than Reference Margin Level, and there is a high degree of
expectation in meeting all forecast parameters.
Marginal: Anticipated Reserve Margin is greater than Reference Margin Level and there is a low degree of
expectation in meeting all forecast parameters, or the Anticipated Reserve Margin is slightly below the
Reference Margin Level and additional and sufficient Tier 2 resources are projected.
Inadequate: Anticipated Reserve Margin is less than the Reference Margin Level; load interruption is likely.
Definition and Calculation
The Planning Reserve Margin determines the amount of committed capacity a given assessment area expects
compared to the projected net internal demand. Each assessment area is evaluated annually through the long-term
and seasonal assessment processes (21 assessment areas are currently evaluated). This metric counts the number of
assessment areas reporting “marginal” or “inadequate” for NERC’s prior year Summer Reliability Assessment and
Winter Reliability Assessment according to the size of the assessment area (small 25,000 MW).
Rating
Red (actionable): There is at least one inadequate large assessment area.
Yellow (monitor): There is more than one small or medium inadequate assessment area.
White (stable): There is at least one marginal, no inadequate assessments.
Green (good/improving): There are no marginal or inadequate assessments.
Purpose
The purpose of the Planning Reserve Margin is to determine how many areas and to what extent capacity deficiencies
can be expected. Planning Reserve Margins cannot precisely predict capacity deficiencies, but areas below the
Reference Margin Level indicate a higher probability of a capacity deficiency occurring than the desired target of 1-
day-in-10 years.
This indicator answers the following questions:
What assessment areas are anticipating potential capacity deficiencies?
How likely is a capacity deficiency?
How significant is the potential capacity deficit?
NERC | State of Reliability | 2020
12Chapter 3: Reliability Indicators
2019 Performance and Trends
In 2019, the reserve margin assessment reported for Texas RE-ERCOT assessment area was determined by the ERO’s
reliability assessment process to be “inadequate” for the 2019 summer peak in comparison to the ERCOT Reference
Margin Level of 13.75%. Between Summer 2018 and Summer 2019, ERCOT’s Anticipated Reserve Margin decreased
from 10.9% to 8.5% driven by higher load growth, a planned generator retirement, and delays in new generation.
ERCOT anticipated that peak demand days could trigger EEAs and operating mitigations, such as increased imports
into the area.
Texas RE-ERCOT: Large Assessment Area
2019 Anticipated Reserve Margin: 8.52%
Amount Needed to Meet Reference Margin Level: 3,802 MW
Figure 3.1 shows the 2019 summer peak Planning Reserve Margin by assessment area.
↑ 97% ↑ 56%
Figure 3.1: 2019 Summer Peak Planning Reserve Margins (Anticipated and Prospective
Reserve Margins)
Planning Reserve Margins are NERC’s primary long-term resource adequacy indicator. In order to provide more
granular insight into the availability of resources to meet expected peak demand on a seasonal basis, NERC publishes
an operational risk analysis for each assessment area in its seasonal reliability assessments. For example, the 2019
Summer Reliability Assessment examined resource and demand scenarios and the potential impact that they could
have on maintaining expected operating reserve requirements established by ERCOT.12 The waterfall chart in Figure
3.2 shows that typical generation outages during Summer 2019 could be expected to result in energy emergencies in
12ERCOT risk assessment developed by NERC using 2019 Summer Reliability Assessment data and additional data from Texas RE-ERCOT and
the ERCOT 2019 Preliminary SARA
NERC | State of Reliability | 2020
13Chapter 3: Reliability Indicators
ERCOT on peak load days, and more severe load or generation outage scenarios had the potential to require load
shedding for management. The scenario is based on historic ranges or expectations for generation maintenance
outages, forced outages, and capacity derates as well as normal and extreme peak demand scenarios. NERC uses risk
analysis such as this to enhance its resource adequacy assessments in each assessment area.
Figure 3.2: Texas RE-ERCOT Seasonal Risk Assessment
Operators in ERCOT faced challenging conditions during the 2019 summer but required minimal use of emergency
alerts to maintain sufficient resources. After a cool start, Texas experienced very hot temperatures in August and
September. EEAs were issued on two occasions in mid-August. ERCOT set a new system-wide peak demand record of
74.67 GW on August 12, 2019. Sufficient resources were available to remain above reserve requirements, primarily
due to higher-than-average performance from wind generation resources and low total generator outages during the
period of peak demand.13
ERCOT’s energy-only wholesale electricity market relies on price signals to maintain reliability. Most generators are
owned by merchant companies that compete in the market to serve ERCOT load. Prior to Summer 2019, ERCOT and
the Public Utility Commission of Texas instituted designs for the Texas electricity market to support optimal
performance, including expanding the triggering mechanism for scarcity pricing that provides maximum payouts to
generators when supply is needed most. Price-responsive demand is also a component of the market that supports
reliability. Operators in Texas use market drivers to incentivize generation, reduce outages, and manage demand
during peak conditions.
Source, Assumptions, and Limitations
This data is gathered and reported annually as part of the NERC long-term and seasonal reliability assessments. The
reports are the 2019 Summer Reliability Assessment,14 the 2019/2020 Winter Reliability Assessment,15 and the 2019
Long-Term Reliability Assessment.16
13 ERCOT review of Summer 2019: http://www.ercot.com/content/wcm/lists/172485/Review_of_ERCOT_Summer_2019_-_PUC_Workshop_-
_FINAL_10-8-19.pdf
14 https://www.nerc.com/pa/RAPA/ra/Reliability%20Assessments%20DL/NERC_SRA_2019.pdf
15 https://www.nerc.com/pa/RAPA/ra/Reliability%20Assessments%20DL/NERC%20WRA%202019_2020.pdf
16 https://www.nerc.com/pa/RAPA/ra/Reliability%20Assessments%20DL/NERC_LTRA_2019.pdf
NERC | State of Reliability | 2020
14Chapter 3: Reliability Indicators
Energy Emergency Alerts
Eastern Interconnection
Western Interconnection
Energy Emergency Alerts
Texas Interconnection
Québec Interconnection
NERC has established three levels of EEAs that allow for communication of emerging energy emergencies among
Balancing Authorities (BAs) and Reliability Coordinators (RCs) within an Interconnection. This metric measures the
duration and number of times EEAs of all levels are issued and when firm load is interrupted due to an EEA Level 3
declaration. EEA Level 3 declarations indicate that firm load interruption is imminent or in progress due to the inability
of meeting minimum contingency reserve requirements. However, not all EEA Level 3 alerts lead to an operator-
controlled firm load interruption.
Rating
Red (actionable): Year over year count increase and continues to be above the five-year average.
Yellow (monitor): Year over year count increase and first year that it is above the five-year average.
White (stable): Reporting year over year count is no change and is less than five-year average.
Green (good/improving): Year over year count improvement and less than the five-year average or zero.
Definition and Calculation
These metrics track EEA declarations for BAs when actual capacity and/or energy deficiencies occur as defined by
EOP-011-1.17
Purpose
The purpose of an EEA is to provide real-time indication of potential and actual energy emergencies within an
Interconnection. EEA trends may provide an indication of BPS capacity, energy, and transmission insufficiency. This
metric may also provide benefits to the industry when considering correlations between EEA events and Planning
Reserve Margins.
This indicator answers the following questions:
How often is the BPS in an energy emergency condition?
What areas are experiencing the most energy emergency conditions?
17 Copy of EOP-011-1: https://www.nerc.com/pa/Stand/Reliability%20Standards/EOP-011-1.pdf
NERC | State of Reliability | 2020
15Chapter 3: Reliability Indicators
2019 Performance and Trends
In 2019, a total of 20 EEA Level 3 alerts were declared, this is three more than the previous year. Some increase in
EEA Level 3 alerts can be attributed to change in resource mix and change in RCs. The most common reason for EEA
Level 3 alert declaration was to recover reserves.
Figure 3.3 shows the year-over-year changes in EEA 3 by Interconnection. The 20 EEA Level 3 alerts declared in 2019
lasted a total of 27.65 hours. The largest load loss associated with an EEA Level 3 in 2019 was 150 MW. In 2019, there
was one EEA Level 3 alert in the Québec Interconnection resulting in no firm load shedding and no EEA Level 3 events
in the Texas Interconnection.
It is noteworthy that the Western Interconnection experienced significantly more EEA Level 3 events in 2019 that
leads to a red rating. However, only two of the EEA Level 3 events in the Western Interconnection resulted in firm
load shedding. The Eastern Interconnection experienced significantly fewer EEA Level 3 events in 2019, but this was
still above the 5-year average that leads to a yellow rating. The Québec Interconnection experienced more EEA Level
3 events in 2019 and this is above the 5-year average that leads to a yellow rating. The Texas Interconnection has had
no EEA Level 3 events in the past five years that leads to a green rating.
Figure 3.3: Number of EEA Level 3 Alerts by Interconnection, 2015–2019
Source, Assumptions, and Limitations
NERC collects data from RCs when an EEA is declared:
Metric Worksheet18
NERC Reliability Standard EOP-011-119
18 https://www.nerc.com/comm/PC/Performance%20Analysis%20Subcommittee%20PAS%202013/ALR6-2_clean.pdf
19 https://www.nerc.com/pa/Stand/Reliability%20Standards/EOP-011-1.pdf
NERC | State of Reliability | 2020
16You can also read