Statistical physics of human beings in games: Controlled experiments
←
→
Page content transcription
If your browser does not render page correctly, please read the page content below
Chin. Phys. B Vol. 23, No. 7 (2014) 078902
TOPICAL REVIEW — Statistical physics and complex systems

                          Statistical physics of human beings in games:
                                      Controlled experiments∗
                                           Liang Yuan(梁 源)a)b) and Huang Ji-Ping(黄吉平)b)†
                            a) Department of Applied Physics, College of Science, Donghua University, Shanghai 201620, China
                     b) Department of Physics and State Key Laboratory of Surface Physics, Fudan University, Shanghai 200433, China

                        (Received 26 January 2014; revised manuscript received 20 February 2014; published online 22 May 2014)

                It is important to know whether the laws or phenomena in statistical physics for natural systems with non-adaptive
          agents still hold for social human systems with adaptive agents, because this implies whether it is possible to study or
          understand social human systems by using statistical physics originating from natural systems. For this purpose, we review
          the role of human adaptability in four kinds of specific human behaviors, namely, normal behavior, herd behavior, contrarian
          behavior, and hedge behavior. The approach is based on controlled experiments in the framework of market-directed
          resource-allocation games. The role of the controlled experiments could be at least two-fold: adopting the real human
          decision-making process so that the system under consideration could reflect the performance of genuine human beings;
          making it possible to obtain macroscopic physical properties of a human system by tuning a particular factor of the system,
          thus directly revealing cause and effect. As a result, both computer simulations and theoretical analyses help to show a
          few counterparts of some laws or phenomena in statistical physics for social human systems: two-phase phenomena or
          phase transitions, entropy-related phenomena, and a non-equilibrium steady state. This review highlights the role of human
          adaptability in these counterparts, and makes it possible to study or understand some particular social human systems by
          means of statistical physics coming from natural systems.

          Keywords: experimental econophysics, computer-aided controlled experiment, phase transition, entropy-like
                    quantity
          PACS: 89.65.Gh, 05.90.+m, 89.75.–k, 05.65.+b                        DOI: 10.1088/1674-1056/23/7/078902

1. Introduction                                                               economics.
                                                                                   Nobel physics prize laureate Anderson and Nobel eco-
      A social human system belongs to the family of complex
                                                                              nomics prize laureate Arrow organized a workshop on the
adaptive systems. [1–9] The systems cannot be simply described
                                                                              topic of complex economic systems in September 1987, and
by Newtonian mechanics due to strong coupling interactions
                                                                              they gave some basic thoughts that describe the evolution of
and complexity, and the agents in these systems often possess
                                                                              economic systems: [10] they imagined that there is a core dy-
intelligence and learning ability, such as investors in the stock
                                                                              namic mechanism with a few variables and parameters in the
markets and species in the ecological systems. Thus, these
                                                                              economic systems, which dominates the evolution of the sys-
agents are able to make their own decisions in the process
                                                                              tems. Exploring the evolution laws of complex adaptive sys-
of interaction with the environment (that involves the other                  tems not only helps to understand the nature of the economic
agents), and then adapt themselves to the environment accord-                 system, but also essentially promotes the development of the
ingly. That is, in the social human system that we are inter-                 related disciplines such as physics, mathematics, and com-
ested in, a human (or an institution made up of humans) is                    puter science. During the last two decades, physicists have
just an agent in the system where everyone can adapt to the                   also gradually carried out studies of economic systems world-
environment because he/she carries out social or economic ac-                 wide and formed some specialized research groups and in-
tivities according to his/her own strategies.                                 ternational academic conferences. In the mid-1990s, Stanley
      The research and analysis focusing on complex adaptive                  and coworkers first proposed the word econophysics to name
systems emerged in several fields, such as physics, chemistry,                the new interdiscipline: [11] econophysics means that physicists
and mathematics. In the past few decades, interdisciplines                    survey economic problems in the same way as they do for
formed ceaselessly, which accelerated the development of var-                 physics research. [12] After that, econophysics opens up its new
ious disciplines. A further combination between natural sci-                  age of rapid development; see Refs. [13]–[29] for examples.
ence and social science has brought new ideas and concepts to                      It is known that for natural systems handled in the tradi-
∗ Project supported by the National Natural Science Foundation of China (Grant Nos. 11075035 and 11222544), the Fok Ying Tung Education Foundation, China

 (Grant No. 131008), the Program for New Century Excellent Talents in University, China (Grant No. NCET-12-0121), the Shanghai Rising-Star Program, China
 (Grant No. 12QA1400200), and the Fundamental Research Funds for the Central Universities, China.
† Corresponding author. E-mail: jphuang@fudan.edu.cn

© 2014 Chinese Physical Society and IOP Publishing Ltd                                               http://iopscience.iop.org/cpb http://cpb.iphy.ac.cn

                                                                       078902-1
Chin. Phys. B Vol. 23, No. 7 (2014) 078902
tional physics, all kinds of materials have their unique micro-      be conducted in a laboratory and big enough to contain the
scopic configurations and interactions. The different config-        key features of the whole system under consideration. Then
urations and interactions cause different materials to possess       he/she conducts the experiment by tuning independent vari-
different properties (e.g., see Refs. [30]–[32]). Certainly, the     ables appropriately, which is similar to what experimenters do
basic units (like atoms or molecules) constructing the micro-        in physical laboratories, say, studying the free falling body by
scopic configurations in natural systems have neither intelli-       changing the height only. As a result, the cause–effect mech-
gence nor learning ability. Nevertheless, for social systems,        anism underlying the human system can be revealed due to
the basic units are human beings (or institutions consisting         controllability. In general, such human experiments cannot be
of humans) with high adaptability, which causes the internal         easily carried out for the real economy that contains a huge
mechanism to be more complex than that for natural systems.          amount of humans. However, it is feasible to build a small
Therefore, the analytical methods for social systems seem to         real system (in laboratory) to experiment on. In this review,
be quite different from those for natural systems. Physicists        we shall focus on the second method (controlled experiments)
have persistently explored natural systems for a long time and       that makes it possible to study complex adaptive systems’ evo-
accumulated vast experiences in repeated experiments. They           lution mechanisms where statistical physics plays a role as
summarized a series of statistical physical laws to describe nat-    well. Actually, the method of controlled human experiments
ural systems. Through actual tests, these laws form the theo-        should be attributed to economists; a pioneer in behavioral
rems in physics, which are conveniently used to understand           economics, V. L. Smith, pointed out long ago the three ele-
the mechanism of natural systems. For example, the famous            ments of constructing human experiments: environment, insti-
second law of thermodynamics describes the statistical law of        tutions, and behavior, [38–42] which gives the initial state of the
the thermodynamic evolution process for natural systems. We          system, while the institutions define the game rules. The en-
are inspired by these statistical physical laws when research-       vironment and the institutions are controllable variables. Con-
ing complex adaptive systems. Accordingly, here we raise a           trolling the variables can affect the final individual behavior.
relevant question: do the traditional laws or phenomena of           Such a method of experimental economics [42–46] is now grad-
statistical physics for natural systems with non-adaptive units      ually adopted by researchers in econophysics [47–55] as to be
still hold for social human systems with adaptive agents? The        extensively introduced in this review. The roles of such con-
answer to this question will help to understand the evolution        trolled experiments could be at least two-fold: (i) adopting the
process and the microscopic mechanism of complex adaptive            real human decision-making process so that the system under
systems. On the other hand, this answer might also foster the        consideration could reflect the performance of genuine human
application of traditional statistical physical laws to social hu-   beings; (ii) making it possible to obtain macroscopic physical
man systems.                                                         properties of a human system by tuning a particular factor of
      Each agent in a complex adaptive system interacts with         the system, thus directly revealing cause and effect.
the environment that can be regarded as the sum of all in-                 The unique feature of controlled human experiments lies
dividual behaviors. Thus, the interaction between an agent           in the fact that introducing behavioral economics experiments
and the environment is essentially the interaction between this      allows the researchers in the laboratory to recur to the indi-
agent and the other agents. If we do research by only rely-          vidual behavior characteristics in the real economic activities
ing on the traditional modeling method (where an artificial          that are affected by various factors including psychology. [56]
process has to be assumed to represent the decision-making           However, controlled human experiments also have some limi-
process of real human beings), the theoretical results of the        tations: they offer experimental results that are only valid for
model will unavoidably deviate from the real facts because           a specific population (both the number and the identity of sub-
of the difficulty in grasping agents’ complex interactions dur-      jects are fixed for one experiment), a specific avenue (where
ing modeling. [33–37] Generally speaking, there are at least two     the experiment is conducted), and specific time (when the ex-
methods for researching the laws of complex adaptive sys-            periment is conducted). In order to overcome such limitations
tems composed of humans. One is an empirical analysis that           and make the experimental results more general, agent-based
generally denotes the statistics of the unrepeatable historical      simulations can be used because they are beyond a specific
data. Such an analysis takes the history as a guide for the          population, a specific avenue, and specific time. Meanwhile,
future. Two key defects of this method are as follows: peo-          a theoretical analysis can help to further reveal the dynamical
ple are usually unable to verify its conclusion’s correctness        mechanism underlying the agent-based simulations and hence
with respect to a certain or a few factors due to uncontrolla-       the controlled human experiments. In this sense, controlled
bility; independent variables become unclear due to uncertain        human experiments, agent-based simulations, and theoretical
cause–effect. The other method uses controlled experiments.          analyses are three complementary tools among which the con-
In this method, one extracts a sample that is small enough to        trolled human experiments serve as a basis, and they can be
                                                               078902-2
Chin. Phys. B Vol. 23, No. 7 (2014) 078902
used to efficiently extract the core laws from experimental           the allocation of resources is the most fundamental economic
phenomena. The present review will introduce the develop-             problem. As one knows, most popular economics theories are
ment in the relevant field. [47–57] Since 2002, scientists have de-   related to deductive reasoning. According to those economic
signed and conducted a series of (computer-aided) controlled          theories, as long as all individuals are almost smart, everyone
human experiments [47–55] on the basis of a resource-allocation       will choose the best action, and then each individual can rea-
system. [58–60]                                                       son his/her best action.
      It is worth mentioning that social psychology has been               However, people gradually find that in real life, individ-
carrying out the study of human behaviors for a long                  uals often have no complete rationality and superb deductive
time. [60–66] However, the analytical process and the emphasis        reasoning ability when making decisions. Instead, it is very
of social psychology are different from what will be presented        common for them to simply use the feasible method of trial
in this review. Social psychology focuses on the psychologi-          and error. Therefore, it looks like inductive generalization
cal process behind individuals or groups, while this review fo-       and continuous learning when real individuals make decisions
cuses on the macroscopic statistical physical properties of the       (namely, inductive reasoning).
complex system made up of humans. Accordingly, this review                 In the game theory, researchers often use evolutionary
offers a new view to survey human complex systems. In ther-           games to study the similar dynamic process. However, when
modynamics, one does not know the movements of specific               using evolutionary game models, economists usually do not
gas molecules, but can obtain the macroscopic statistical prop-       take into account the character of limited rationality. There-
erties as a whole, say, the principle of increasing entropy. On       fore, they cannot convincingly yield interesting phenomena
the same footing, this review does not concern the reason be-         and critical phase transition behaviors. A social human sys-
hind specific human behaviors, but focuses on the macroscopic         tem contains a large number of agents who have the limited
statistical properties of the human systems under consider-           ability of inductive reasoning. Even so, the microscopic sim-
ation. For this purpose, after introducing some fundamen-             plicity can still lead to the complexity of the macroscopic sys-
tal knowledge related to market-directed resource-allocation          tem. Obviously, from a physical point of view, this system has
games (Section 2), we first clarify the role of human adapt-          a variety of statistical physical phenomena.
ability in four kinds of specific human behaviors, including               In the past, there were some studies about the allocation
normal behavior (Section 3.1), [50,52] herd behavior (Section         of resources. For example, in 1994, economist Arthur put for-
3.2), [51] contrarian behavior (Section 3.3), [53] and hedge be-      ward a very representative resource allocation problem, the El
havior (Section 3.4). [51,53] Then we survey a few human coun-        Farol Bar problem, when he studied the inductive reasoning
terparts of some laws or phenomena of the traditional statisti-       and bounded rationality. [68] It can be described as follows.
cal physics under some conditions, namely, two-phase phe-                  There is an El Farol bar in Santa Fe (a city in New Mex-
nomena or phase transitions (Section 4.1), [50,51,53] entropy-        ico of U.S.) which offers Irish music on every Thursday night.
related phenomena (Section 4.2), [51,67] and non-equilibrium          Each Thursday, 100 persons need to decide independently
steady state (Section 4.3). [54] This review ends with a sum-         whether to go to this bar for fun or stay at home because
mary and outlook in Section 5.                                        there are only 60 seats in the bar. If more than 60 persons are
                                                                      present, the bar is so crowded that the customers get a worse
                                                                      experience than staying at home. If most people choose to stay
2. Fundamentals of market-directed resource-
                                                                      at home at that day, then the people who go to the bar enjoy
   allocation games
                                                                      the elegant environment and make a wise choice.
2.1. El Farol bar problem                                                  In this problem, Arthur assumed no communication in ad-
      The essence of the formation of human social activities         vance among the 100 persons. They only know the historical
lies in the acquisitiveness for resources. In many social and bi-     numbers in the past weeks and have to make decisions inde-
ological systems, the agents always spontaneously adaptively          pendently. In order to make a wise choice, each person needs
compete for limited resources, and thus change their environ-         to possess his own strategies which are used to predict the at-
ments. In order to effectively describe the complexity of the         tendance in the bar this week. People cannot obtain the per-
system, scientists have made a series of attempts. Such a re-         fect equilibrium solutions at the initial time when making de-
source competition system is just a kind of complex adaptive          cisions. They must consider others’ decisions, and keep learn-
system.                                                               ing according to the limited historical experience in their mind.
      For economic systems, the basic issue appears as well.          The elements of inductive reasoning and limited rationality in
Generally, in an economic market, if the resources are ratio-         the El Farol bar problem lay a foundation for the further de-
nally allocated, the market is full of vitality. Otherwise, the       velopment of econophysics modeling, as shown in Section 2.2
development will be impeded, at least to some extent. Thus,           below.
                                                                078902-3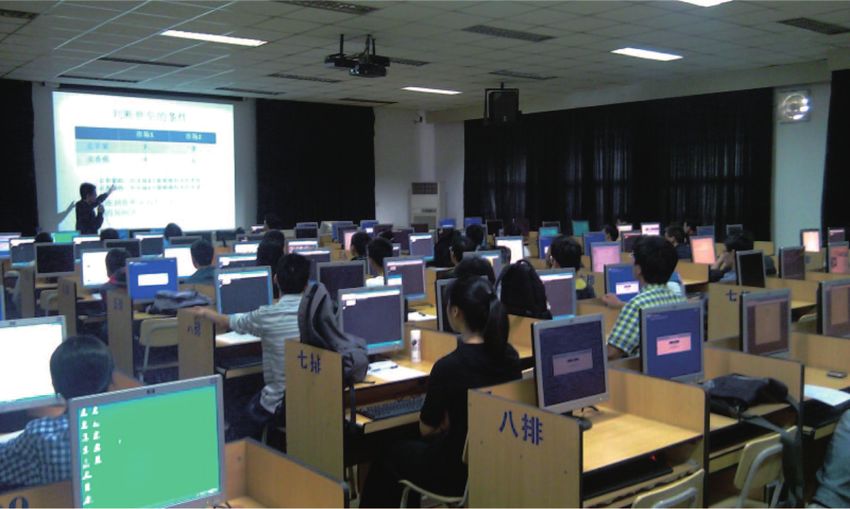
Chin. Phys. B Vol. 23, No. 7 (2014) 078902
2.2. Unbiased distribution of resources                               related to memory length m, and the historical information can
      Inspired by the El Farol bar problem, physicists Challet        only increase with 2m .
and Zhang in 1997 proposed a minority game to quantitatively               In econophysics, minority game models have been widely
                                                                      used to simulate a special kind of complex adaptive system,
describe this problem and statistically analyzed the emerg-
                                                                      the stock market. [76,116,118] Researchers always hope to gen-
ing collective phenomena in complex adaptive systems. [58]
                                                                      erate similar stock market data through the minority game
In the following years, scientists have done extensive re-
                                                                      model. The stand or fall of this similarity often needs to be
searches about the minority game and its applications in dif-
                                                                      tested to see whether model data have the same stylized facts
ferent fields, which have significantly promoted the develop-
                                                                      as the real market data. Besides, the minority game can also
ment of econophysics. [18,19,49,69–94] We introduce the minority
                                                                      be used to study competition problems about an unbiased dis-
game model as follows.
                                                                      tribution of resources. [48,90,92,117]
      There are two rooms (indicated as Room A and Room B)
and N agents, where N is an odd number. Each agent chooses
                                                                        Table 1. A model strategy table in the minority game with memory
independently to enter one of the two rooms. If one room con-           length m = 2.
tains fewer agents than the other, then the agents in this room                         Information              Choice
win. That is to say, the minority wins. The two rooms in the                                 00                    1
minority game actually correspond to the case of an unbiased                                 01                    0
                                                                                             10                    1
distribution of two resources. This game is repeated. Each
                                                                                             11                    0
agent can only make a decision next time according to the his-
torical information. As a matter of fact, in daily life, people       2.3. Biased distribution of resources
often face similar choices. Examples include choosing which                In the real world, however, agents competing for re-
road to avoid a traffic jam during rushing hour and choosing a        sources often face a biased distribution of resources in differ-
less crowded emergency exit to escape. Although each of us            ent locations. This phenomenon has many instances in our
can keep learning from limited historical experiences, it can-        daily life. For example, a company chooses to enter into or
not guarantee that we make the correct choice every time.             exit out of several industries with different capacities, [118,119]
      In the minority game, the decision-making process, which        a driver chooses different traffic routes, [120,121] and people de-
is based on historical information, is modeled to form strat-         cide to go to a small bar or a large one. [122]
egy tables. The minority game assumes that agents’ memory                  From an overall view, the ideal evolution process of re-
length of the historical information is limited. Each agent can       source allocation systems should be like this: although each
only remember the latest m rounds. If m = 2, it can form a            agent carries the selfish purposes to compete for limited re-
strategy as shown in Table 1. The historical information in           sources with other agents, the system as a whole can eventu-
the left column records the attendance in the past two rounds,        ally reach a harmonious balance state in which the resource
which is filled with a string of bits of 0 and 1. For example,        allocation is efficient, stable, and arbitrage-free. In the process
a string of “10” represents the past two winning rooms, Room          of approaching the harmonious state, each agent in the system
A and Room B. The right column is the prediction, which is            cannot know the real quantity of resources at a certain location,
filled with bits of 0 or 1. Bit 1 is linked to the choice of enter-   cannot communicate with others, and cannot be told the cor-
ing Room A, while bit 0 to that of Room B. So one can obtain          rect choice. That is, there exists an “invisible hand” (as coined
                                     m
a strategy pool with a size of 22 . As m increases, the total         by Smith [123] ) to guide the whole group to cooperate with each
number of strategy tables increases rapidly. In the original mi-      other. Then, does the invisible hand always effectively play a
nority game model, the designers let each agent randomly se-          role? In daily practice, a lot of evidence indicates that the in-
lect strategy tables. That is, the right column of each strategy      visible hand in some systems like the financial markets has a
table is randomly filled with 0 or 1. These agents are likely to      very strong guiding force, but sometimes it fails. The tempo-
repeat the same selected strategy (namely, the right columns of       rary failure implies that if the invisible hand can work, there
the strategy tables are the same). However, appropriately in-         should be some necessary basic conditions.
creasing the memory length can significantly reduce the rep-               Based on the minority game, Wang et al. proposed
etition probability. Here it is worth noting a special case: if       a market-directed resource-allocation game (MDRAG) in
the right column of a strategy table is all 1 (or 0), this strategy   2009, [50] which handles a kind of biased distribution of re-
means that the agents are always locked into Room A (or B)            sources. It is an extension of the minority game that deals
no matter what happens.                                               with an unbiased distribution of resources. A further develop-
      According to these results, it is not hard to find that the     ment is that the strategy adopted in the MDRAG gives agents
minority game model with such a strategy structure is closely         preference heterogeneity and decision-making ability which
                                                                078902-4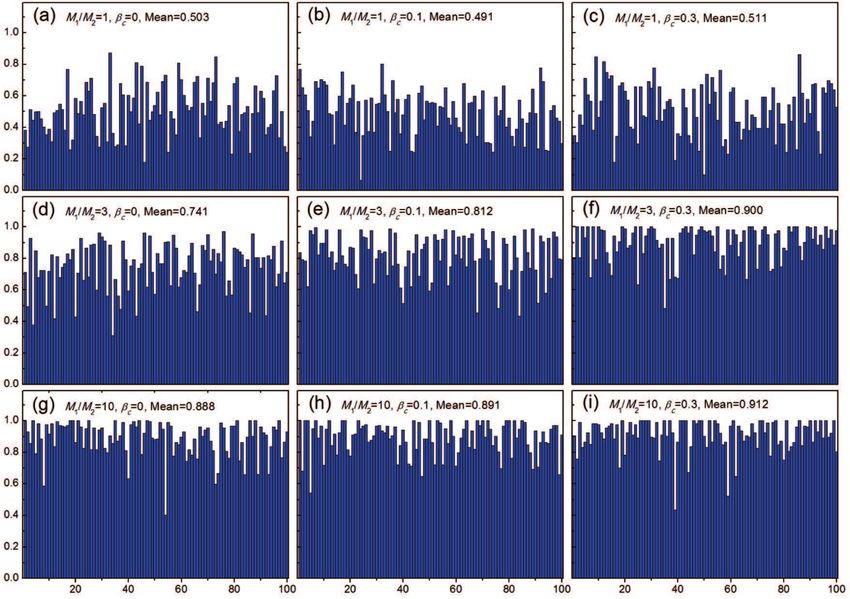
Chin. Phys. B Vol. 23, No. 7 (2014) 078902
match the environmental complexity. We summarize several                                        Table 2. A model strategy table in the MDRAG.
differences of the MDRAG model as follows.                                                           Economic situation                Choice
      1) Resources in two rooms can continuously change from                                                1                            0
the unbiased distribution to an extremely biased distribution.                                              2                            1
                                                                                                            3                            1
      2) The possible economic situations P replace the histor-
                                                                                                           ···                          ···
ical information based on the memory length in the minority                                               P−1                            0
game. In the strategy table, compared to 2m , P can continu-                                                P                            1
ously change with the smallest unit 1. The number of rows is
not requested to be 2m , but can be any positive integer P. See                        Each normal agent will be randomly given S strategy ta-
Table 2.                                                                          bles to form his/her own strategy book, which is shown in
      3) Each strategy is given its own preference L, L ∈ [0, P].                 Fig. 1. From the start of the game, each normal agent will
There is a probability of L/P to be 1 in the right column of the                  score all the strategies in his/her strategy book so as to evalu-
strategy table and a probability of (P − L)/P to be 0. At each                    ate how successful they are to predict the winning room. Fol-
time step, agents choose to enter a room according to the right                   lowing the hitherto best performing strategy in their strategy
column of the strategy tables directed by the given situation Pi ,                books, normal agents are enabled to make decisions for the
Pi ∈ [1, P].                                                                      next round.

           Fig. 1. Schematic graph showing strategy tables of a normal agent. Each normal agent is allocated S strategy tables. After scoring at
           the end of every simulating round, the best strategy is used for the next round. In the strategy sample, the current situation is Pi = 2,
           whose right column is 0, thus this agent will choose to enter room 2 in this round. [66]

3. Four kinds of specific human behaviors                                         mal behavior, herd behavior, contrarian behavior, and hedge
     In order to survive, all kinds of agents in complex adap-                    behavior. Here the normal behavior is regarded as the behavior
tive systems need to maximize self-benefits and have to com-                      of ordinary humans who have independent decision-making
pete against others for the limited resources with a biased or                    ability. Both herd behavior and contrarian behavior are a kind
unbiased distribution by adopting different strategies. The                       of collective behavior. Though ordinary humans’ decisions are
competition mechanism causes agents’ high adaptability to ex-                     basically made according to individual thinking, there are al-
ternal environments. In order to observe statistical physical                     ways some people who tend to pay heed to what others are
properties of social human systems, we have to clarify the role                   doing and thus follow the current trend or anti-trend to form
of human adaptability in various kinds of human behaviors.                        groups. If the herd behavior and the contrarian behavior exist
For this purpose, we first classify human behaviors into nor-                     in a market simultaneously, they can form a special kind of be-
                                                                         078902-5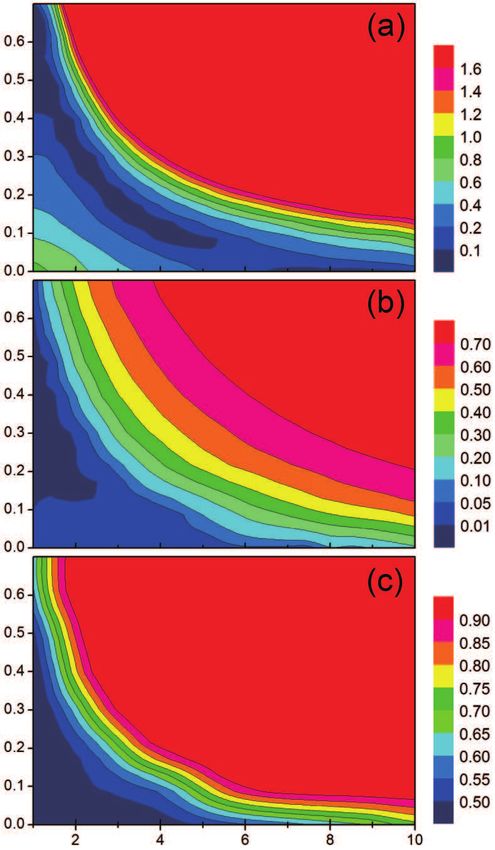
Chin. Phys. B Vol. 23, No. 7 (2014) 078902
havior, the hedge behavior. Next we shall experimentally ob-                the amount of virtual money in room i (i = 1, 2, 3). A piece of
serve the performance of a specific social human system with                global information about the payoff in the preceding round in
these four kinds of human behaviors. All the experiments sur-               all rooms was announced before a new round started. In each
veyed in this review are essentially online anonymous games;                round, the students must make their own choices without any
the researchers obtained verbal consent from all the subjects               kinds of communication. The payoff per round for a student
who were informed that they could remove themselves from                    in room i is 2 points if Mi /Ni > ∑ Mi /N, and −1 point other-
the experiment at any time.                                                 wise. Here Ni is the number of the students choosing room
                                                                            i. The total payoff of a student is the sum of payoffs of all
3.1. Normal behavior                                                        rounds, which will be converted to money payoffs in Chinese
3.1.1. Heterogeneous preferences and decision-making                        Yuan with a fixed exchange rate: 10:1 (10 points equals to 1
       capacity
                                                                            Chinese Yuan). Since the organizational and the statistic pro-
     To illustrate the system behavior, we designed and con-                cedures were done by humans, one session of 10 rounds took
ducted a series of controlled human experiments in a computer               roughly 20 minutes. [50]
lab, collaborating with the university students (who serve as                     Three kinds of games, GAME-I, GAME-II, and GAME-
the subjects); see Fig. 2 for an example. In the experiments,               III, have been investigated. GAME-II differed from GAME-
89 students from different departments (mainly physics, math-               I in the global information being announced. In GAME-I,
ematics, and economics) of Fudan University were recruited                  both the resource distribution Mi and the current population
and randomly divided into 7 groups (Groups A–G, see Ta-                     Ni in room i were announced, while only payoffs (2 or −1)
bles 3–6). The number of students in each group was just                    in each room of the current round were conveyed to the play-
set for convenience and denoted by N in Tables 3–6. In the                  ers in GAME-II. Note that the environmental complexity was
games played in the experiments, the students were told that                increased in GAME-II, since in order to win the game, play-
they have to make a choice among a number of rooms in each                  ers would have to predict other players’ decision, and in the
round of a session for sharing the different amounts of vir-                meantime infer the actual amounts of virtual money in differ-
tual money in different rooms. The students who obtain more                 ent rooms. In GAME-III, the global information was the same
than the global average, namely, those belonging to the rel-                as that in GAME-II, except an abrupt change of the amount of
ative minority, would win the payoff. At the beginning of a                 virtual money was introduced during the game without an an-
session, participants were told the number of rooms (2 or 3),               nouncement. On the contrary, all the participants have already
and in some cases the different but fixed amount of virtual                 been told that each Mi is unchanged. No further information
money in each room. In the following, Mi is used to denote                  was given to the participants.

          Fig. 2. A photo of a representative experimental field, which was taken on October 13, 2012. Each subject plays the online game
          independently through his/her own computer in the computer lab of Fudan University.

                                                                    078902-6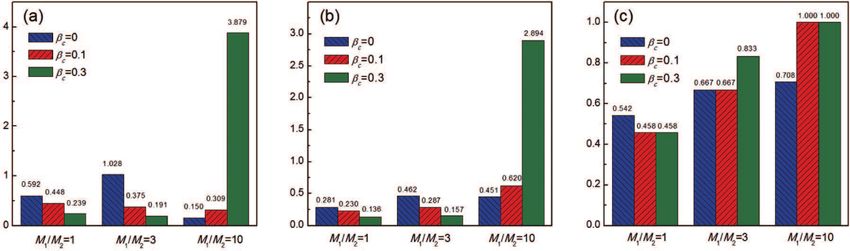
Chin. Phys. B Vol. 23, No. 7 (2014) 078902
                                                                Table 3. Results of GAME-I. [50]
                 Session             Group              Round           M1          M2             M3    hN1 i      hN2 i       hN3 i
                    1              A(N = 12)            1–10            3           2              1      5.3        4.6         2.1
                    2              A(N = 12)            1–10            3           2              1      5.5        3.8         2.7
                    3              B(N = 12)             1–10           3           2              1      5.5         4          2.5
                    4              C(N = 24)             1–20           3           2              1     12.2        7.4         4.4
                    5              D(N = 10)            1–10            5           3              –      6.1        3.9          –
                    6              D(N = 10)            1–10            3           1              –      7.4        2.6          –

                    Table 4. Results of GAME-II. [50]                              naively think that the system could evolve to this state only
       Session      Group       Round    M1     M2      hN1 i   hN2 i              because the participants knew the resource distribution (prior
          1       D(N = 10)     1–10     2      1        6.2     3.8               to playing the games) and the population in each room (dur-
          2       E(N = 10)      1–10    1      3        3.3     6.7
                                                                                   ing the game). However, the results of GAME-II show that
          3       F(N = 11)      1–10    3      1        7.2     3.8
          3       F(N = 11)     11–20    3      1        8.3     2.7               this explanation could not be correct. As shown in Table 4, al-
          4       C(N = 24)      1–15    7      1       17.8     6.2               though the players who know neither the resource distribution
          4       C(N = 24)     16–30    7      1       21.1     2.9               nor the current populations in different rooms seem not to be
                                                                                   able to adapt to the unknown environment during the first 10
                                                                                   or 15 rounds, eventually, the relation hN1 i/hN2 i ≈ M1 /M2 is
    Table 5. Track of group F (N = 11) converging to M1 /M2 = 3. [50]              achieved again in groups C and F. For instance, Table 5 shows
      Round         N1        N2        Round           N1         N2              the track through which group F gradually find the balanced
        1            5        6          11              8         3               state under the environmental complexity M1 /M2 = 3. Fur-
        2            9        2          12             10         1               thermore, the results of GAME-III support the conclusion of
        3            4        7          13              9         2               GAME-II, in which the system can reach this state even with
        4            6        5          14              7         4
        5            6        5          15              9         2
                                                                                   an abrupt change of the unknown resource distribution when
        6            7        4          16              7         4               playing the game; see the results of 21 to 45 rounds played
        7            7        4          17              7         4               by the G group in Table 6. It is surprising that the players
        8            8        3          18              9         2               can “cooperate” even without direct communications as well
        9           10        1          19              8         3
                                                                                   as no information of the resource distribution. We can define
       10           10        1          20             9          2
                                                                                   the source of a force which drives the players to get their quota
                                                                                   evenly as the invisible hand of the resource allocation market.
                                                                                   In the sequel, however, we shall show that the effectiveness of
                   Table 6. Results of GAME-III. [50]
                                                                                   this invisible hand relates to the heterogeneous preference and
       Session      Group       Round    M1     M2      hN1 i   hN2 i
                                                                                   the adequate decision-making capacity of the participants of
          1       G(N = 10)       1–5    3      1        5.4     4.6
          1       G(N = 10)      6–10    3      1        8.2     1.8               the game.
          1       G(N = 10)     11–15    3      1         7       3                      To find out the mechanism behind this adaptive system
          1       G(N = 10)     16–20    3      1         7       3                of resource distribution, we carried out a series of agent-based
          1       G(N = 10)     21–25    1      3        7.8     2.2
                                                                                   simulations to compare with the experimental results. In the
          1       G(N = 10)     26–30    1      3        4.2     5.8
          1       G(N = 10)     31–35    1      3        2.8     7.2
                                                                                   agent-based model, normal agents correspond to the human
          1       G(N = 10)     36–40    1      3        2.6     7.4               subjects in the experiment. Before the game starts, each nor-
          1       G(N = 10)     41–45    1      3        2.4     7.6               mal agent will take S strategies shown in Section 2.3 from
                                                                                   the full strategy space and use the strategy tables to achieve
     The results of six sessions of GAME-I, four of GAME-II,                       a decision-making process like human subjects. Since we de-
and one of GAME-III are given in Tables 3–6. In Table 3, the                       fined a preference index L in the MDRAG, it means that the
results of GAME-I are listed, where the time average of the                        normal agents have heterogeneous preferences because of the
player number in room i is represented as hNi i. As the data                       heterogeneous strategies. That is the essential difference from
shows, a kind of cooperation seems to emerge in the game                           the minority game. The ratio M1 /M2 represents the environ-
within 10 rounds. In particular, the ratios of hNi i converge                      mental complexity of the games. The results of the experi-
to those of Mi , implying that the system becomes efficient in                     ments are compared with the simulation results of the origi-
delivering the resources, even if they were distributed in a bi-                   nal minority game and the MDRAG in Fig. 3. With a certain
ased way. To the players, no room is better or worse in the                        set of parameters (S = 8 and P = 16), the MDRAG’s results
long run, there is also no evidence that any of them could sys-                    agree with the experimental data under a higher degree of en-
tematically beat the resource allocation “market”. One might                       vironmental complexity. In other words, the agents in both
                                                                             078902-7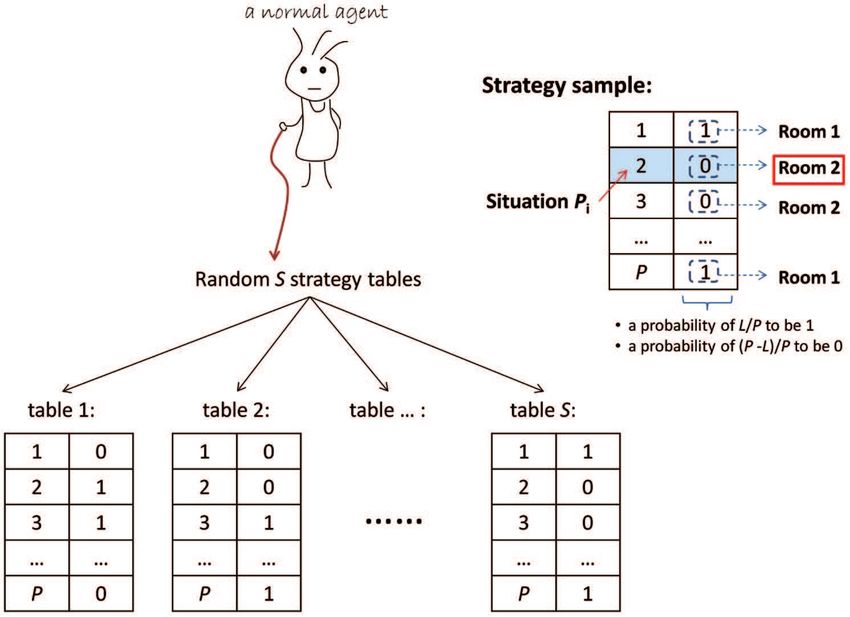
Chin. Phys. B Vol. 23, No. 7 (2014) 078902
experiments and the MDRAG can be directed by the market                            are equipped with a heterogeneous preference and decision-
to cooperate with each other, so an efficient allocation of the                    making capacity which match the environmental complexity,
biased distributed resource can be realized even without giv-                      the system can achieve spontaneously the harmonious state
ing the agents full information or instructions. On the other                      as mentioned above. Thus, in this review, we choose the
hand, the original minority game fails to reproduce the exper-                     MDRAG model as the basis for researching resource alloca-
imental results unless the distribution of resources is biased                     tion problems.
very weakly up to M1 /M2 = 3. Hence, one may infer that the
heterogeneity of agents’ preferences is a significant factor in                    3.1.2. Risk-return relationship
making the invisible hand play a role.                                                   In Section 3.1.1, we only introduced the case of resource
                                                                                   allocation without the income of agents in repeated games.
                                                                                   Here we make some changes to the above experimental de-
                                                                                   sign and treat the human subjects as investors to consider the
                                                                                   risk-return relationship. [50]
                                                                                         In the experiments, we recruited 24 students and teach-
                                                                                   ers from Fudan University as the subjects. The reward rules
       /

                                                                                   were the same as those listed in Section 3.1.1. There were two
                                                                                   virtual rooms, room 1 and room 2, for the subjects to invest
                                                                                   in. The subjects acted as fund managers who were responsi-
                                                                                   ble for implementing a fund’s investing strategy and managing
                                                                                   its trading activities. We told the subjects the requirement of
                                                                                   a total of 30 rounds for each M1 /M2 , and offered every sub-
                                      M1/M2
                                                                                   ject 1000 points (the amount of virtual money constructing the
                                                                                   fund managed by the subject) as his/her initial wealth for each
  Fig. 3. The hN1 i/hN2 i as a function of M1 /M2 , P = 16 in the minority
  game and the MDRAG, and N = 24 for all the simulations in the exper-             M1 /M2 . At the beginning of the 1st round of each M1 /M2 ,
  iment. Simulations are run for 200 times, each over 400 time steps (first
  half for equilibration, the remaining half for statistics). The line with        we told the subjects the actual ratio of M1 /M2 and asked each
  slope = 1 indicates the efficient states hN1 i/hN2 i = M1 /M2 . [50]             subject to decide his/her investing weight (denoted as x(i) for
                                                                                   subject i). Note that the investing weight x(i) is the percent-
    Figure 3 also shows that the decision-making capacity, in                      age of his/her investing wealth (investment capital) to his/her
particular the deliberation of choices (the parameter S), would                    total wealth, and it would keep fixed within the 30 rounds for
be another factor having an influence on the effectiveness of                      a certain M1 /M2 . At every round, each subject could only in-
the invisible hand. Typically, as the environmental complexity                     dependently invest in one of the two rooms. After all the sub-
(M1 /M2 ) increases, both the minority game and the MDRAG                          jects made their own decisions, with the help of a computer
will deviate from the experimental results. Nevertheless, the                      program, we immediately knew the total investments in each
problem of the minority game is very severe. As shown in                           room (denoted as W1 and W2 for Room 1 and Room 2, respec-
the figure, even the minority game with an extremely large                         tively) at this round. While keeping the total wealth conserved,
S (S = 48, a situation which seems to be inconsistent with                         we redistributed the total investment W1 +W2 according to the
the real system and will drastically increase the computational                    following two rules.
cost) can only work at a very low level of environmental com-                            (i) We divided the total investment, W1 +W2 , by the ratio
plexity. At the same time, the result of the MDRAG provides                        of M1 /M2 , yielding (W1 +W2 ) M1M+M
                                                                                                                      1
                                                                                                                        2
                                                                                                                          and (W1 +W2 ) M1M+M
                                                                                                                                            2
                                                                                                                                              2
                                                                                                                                                as
a convincing fit with the experimental data when S is large                        the payoffs for Room 1 and Room 2, respectively.
enough, but not too large for a given P value. Basically, the                            (ii) We redistributed the payoff of Room k (k = 1, 2) by
minority game does not provide a good fit even for a large S,                      the investment of the the subjects. Namely, for each round, the
while the MDRAG can fit the data and is less demanding in                          payoff for subject i choosing room k to invest in, wpayoff (i),
                                                                                                                                       in (i)
terms of the computational cost.                                                   is determined by wpayoff (i) = (W1 +W2 ) M1M+M
                                                                                                                                k
                                                                                                                                  2
                                                                                                                                    × wW      , where
                                                                                                                                          k
    Comparing the minority game and the MDRAG, we ob-                              win (i) is the investing wealth of subject i, win (i) = x(i)w(i).
serve that the performances of the MDRAG are superior to                           Here w(i) is the total wealth possessed by subject i at the end
the minority game, especially in the case of an extremely bi-                      of the previous round.
ased distribution of resources. It indicates that once the agents                        Before the experiments, we told the subjects the above
                                                                              078902-8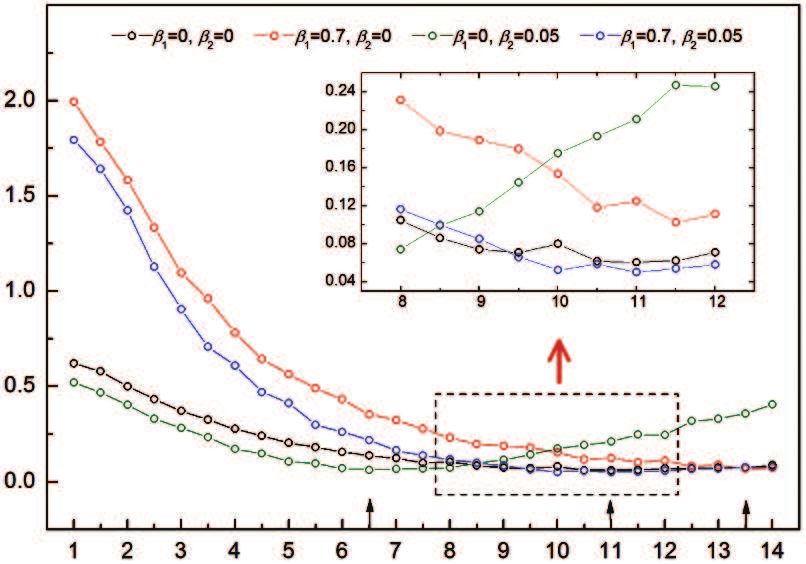
Chin. Phys. B Vol. 23, No. 7 (2014) 078902
two rules for wealth re-allocation. After each round, every                         be the losing one. Besides, the initial wealth is the same for
subject knew his/her payoff wpayoff (i). If there is wpayoff (i) >                  every subject and he/she knows nothing but himself/herself.
win (i), that is, subject i obtains more than the amount he/she                     From this point of view, the larger investing weight he/she
has invested, we consider subject i as a winner at this round.                      chooses, the higher risk (or uncertainty) he/she will take for
Equivalently, if W1 /M1 < W2 /M2 , the subjects choosing room                       the fund (i.e., the initial 1000 points). Therefore, throughout
1 to invest win at this round. Clearly, when W1 /W2 = M1 /M2 ,                      this work, we simply set the investing weight, x(i), to equal
every subject obtains the payoff which equals to his/her invest-                    the risk he/she is willing to take. Here we should remark that
ing wealth. Namely, the arbitrage opportunity has been used                         the present definition of risk appears to be different from that
up. Accordingly, we define the W1 /W2 = M1 /M2 state as a bal-                      in the finance theory. For the latter, one often defines the risk
anced state. This state may have some practical significance                        according to variance. Nevertheless, the two kinds of risks are
because global arbitrage opportunities for investing in human                       essentially the same because they both describe the uncertainty
society always tend to shrink or even disappear once known                          of funds and have a positive association with each other. On
and used by more and more investors. As shown in Fig. 4, our                        the other hand, we should mention that the risk we define for
experimental system can indeed achieve hW1 /W2 i ≈ M1 /M2 at                        each subject does not change with the evolution of the time.
which the system automatically produces the balanced alloca-                        This is a simplification which makes it possible to discuss the
tion of investing wealth; this system thus reaches a statistical                    pure effect of a fixed value of risk. Nevertheless, if we choose
equilibrium. In other words, the invisible hand plays a full                        to let the risk change with the time, for the same purpose, we
role. That is, all subjects are pursuing self-interest and we                       may take an average of the risk over the full range of time.
run the present system under three conditions: with sufficient                      Figures 5(a)–5(f) show the risk-return relationship for the in-
information (namely, the wealth change for each round has re-                       vestments in designing a complex adaptive system. From the
flected the possible information), with free competition (i.e.,                     statistical point of view, we find that investments with a neg-
no subjects dominate the system and there are zero transac-                         ative risk-return relationship are dominant over those with a
tion costs), and without externalities (the wealth change of a                      positive risk-return relationship in the whole system.
subject has reflected the influence of his/her behavior on the                            Next, we resort to the computer simulation to extend the
others).                                                                            experimental results. As shown by Fig. 4, our agent-based
                                                                                    computer simulations also give hW1 /W2 i ≈ M1 /M2 , that is,
                                                                                    the system under simulation also exhibits the market effi-
                                                                                    ciency. Further, according to the simulations, we achieve the
                                                                                    same qualitative conclusion: investments with a negative risk-

                                                                                    return relationship are statistically dominant over those with
                                                                                    a positive risk-return relationship in the whole system; see
                                                                                    Figs. 5(g)–5(l). Nevertheless, when we scrutinize Figs. 5(j)–
                                                                                    5(l), we find that some particular data seem to be located on
                                                                                    a smooth upward line. We plot these data in blue, and fur-
                                                                                    ther find that they are just corresponding to all the agents with
                                     M1/M2
                                                                                    preference = 1. Encouraged by this finding, we turn blue all
  Fig. 4. Averaged ratio hW1 /W2 i versus M1 /M2 for the human exper-
  iments with 24 subjects (red squares) and agent-based computer sim-               the data of preference = 1 in the other 9 panels of Fig. 5, and
  ulations with 1000 agents (blue dots). Here h· · · i denotes the average          observe that a similar upward line also appears in the exper-
  over the total 30 experimental rounds (experimental data of W1 /W2 for
  each round are shown in Table 1) or over the 800 simulation rounds (the           imental results (see the blue dots in Figs. 5(a)–5(f); note the
  additional 200 rounds are performed at the beginning of the simulation
  for each M1 /M2 ; during the 200 rounds, we train all of the strategies by
                                                                                    blue dots in Figs. 5(c) and 5(e) are also, on average, in an up-
  scoring them whereas the wealth of each agent remains unchanged). All             ward line even though they appear to be not so evident).
  the experimental and the simulation points lie in or beside the diagonal
  line (slope = 1), which indicates hW1 /W2 i ≈ M1 /M2 . Parameters for
                                                                                         For the upward lines themselves, they are clearly indica-
  the simulations are S = 4 and P = 16. [52]                                        tive of investments with a positive risk-return relationship.
                                                                                    Hence, to distinctly understand our main conclusion about the
     If a subject (namely, a fund manager in the experiment)                        dominance of investments with a negative risk-return relation-
chooses a larger investing weight, he/she will invest more vir-                     ship in the whole system, one has to overcome the puzzle,
tual money in a room. According to the rules of our exper-                          namely, the strange appearance of these upward lines (con-
iment, the room he/she chooses will then be more likely to                          structed by the blue dots in Fig. 5), as already analyzed above.

                                                                               078902-9
Chin. Phys. B Vol. 23, No. 7 (2014) 078902
M1/M2/ M1/M2/
Return rT(i)
M1/M2/
M1/M2/ M1/M2/ M1/M2/
Return rT(i)
M1/M2/ M1/M2/ M1/M2/
Return rT(i)
M1/M2/
M1/M2/ M1/M2/
Return rT(i)
Risk x(i) Risk x(i) Risk x(i)
Fig. 5. Relationship between the risk, x(i), and the return, rT (i) = [wT (i) − w0 (i)]/w0 (i) for (a)–(f) 24 subjects and (g)–(l) 1000 agents at various
M1 /M2 ’s. (a)–(f) Data of the human experiments (total of 30 rounds for each M1 /M2 ); (g)–(l) data of the agent-based computer simulations (total of
800 rounds for each M1 /M2 , with an additional 200 rounds performed at the beginning of the simulations; during the 200 rounds, we train all of the
strategies by scoring them whereas the wealth of each agent remains unchanged). Here wT (i) is agent i’s wealth at the end of the T -th round (the total
number of rounds, T , is T = 30 and 800 for the experiments and the simulations, respectively), and w0 (i) is agent i’s initial wealth. All of the subjects
or agents are divided into two groups with preference < 1 (red squares) and preference = 1 (blue dots). Here, the preference is given by C1 /T , where
C1 is the number of times for the subjects or agents to choose room 1 within the total of T rounds. Here, the linear fit denotes the line fitting the data
in each panel using the least square method, which serves as a guide for the eye. All of the lines are downward, which indicates a statistically negative
relationship between risk and return. The present negative relationship just reflects the dominance of investments with a negative risk-return relationship
in the whole system, in spite of a relatively small number of investments with a positive risk-return relationship. Other parameters in panels (g)–(l) are
S = 4 and P = 16. [52]
3.2. Herd behavior cally, for an individual agent, the herd behavior may suggest
According to the above controlled experiments, the allo- either irrationality [125] or rationality, [126,127] with an implica-
cation of the resources in a complex adaptive system could tion that herding can ruin the balance of the whole resource-
reach a balanced state due to the preferences and the deci- allocation system by causing excess volatility. Accordingly,
sion making ability of normal agents. Besides normal behav- herd behavior is commonly seen as a tailor-made cause for
ior, here we also consider a special kind of collective behav- explaining bubbles and crashes in a complex adaptive sys-
ior, herd behavior. In fact, herding extensively exists in the tem with the existence of extremely high volatility. Is this
collective behavior of many species in complex adaptive sys- common sense always right? Here we focus on the effect
tems, including human beings. Though human decisions are of herding on the resource allocation system and conduct a
basically made according to individual thinking, people tend series of computer-aided human experiments, on the basis of
to pay attention to what others are doing, emulate successful the MDRAG, to study the necessary conditions for a complex
persons, or those of a higher status, and thus follow the cur- adaptive system to reach the ideal balanced state. [51]
rent trend. For example, young girls often copy the clothing Human subjects of the resource-allocation experiments
style of some famous stars, called trendsetters in the fashion were students recruited from several departments of Fudan
world. Similarly, researchers would rather choose to work on University (the reward rules were the same as those listed in
a topic that is currently hot in the scientific society. As a re- Section 3.1.1). There were two rooms (room 1 and room 2)
sult, large numbers of people may act in concert, and this un- and the amounts of resources in the two rooms were M1 and
planned formation of crowds is called herd behavior. [124] Lo- M2 , respectively. In the experiment, M1 and M2 were kept
078902-10Chin. Phys. B Vol. 23, No. 7 (2014) 078902
fixed and unknown to all the participants. For each exper- dictability of the resource-allocation system. The efficiency
iment round, each participant had to choose one of the two of the whole system can be defined as e = |hN1 i/hN2 i −
rooms to share alike the virtual resource. Apart from human M1 /M2 |/(M1 /M2 ). A smaller e means a higher efficiency
participants, there were also imitating agents joining the ex- in the allocation of resources. The stability of the resource-
2
periment. All the imitating agents were generated by a com- allocation system can be described as σ 2 /N ≡ 1
∑ h(Ni −
2N
puter program, their decisions were simply made by mimick- i=1
ing human participants’ behaviors. In particular, each imitat- Ñi )2 i, where hAi denotes the average of time series A. This
ing agent would randomly select a new group (of size 5) of definition describes the fluctuation in the room population
human participants at every experiment round, and then fol- away from the balanced state where the optimal room popu-
low the choice of the best participant (who has the highest lations Ñi = Mi N/ ∑ Mi can be realized. The predictability of
score) in the group for the next round. In each round of the the system is measured by the uniformity of the winning rates
experiment, the number of human participants and imitating in different rooms. The winning rate in room 1 is denoted as
agents in room 1 is denoted as N1 , and the number in room w1 . It is obvious that if w1 is close to 0.5, the choices of the
2 as N2 . Therefore, the total number of human participants two rooms are symmetrical and the system is unpredictable.
and imitating agents can be counted as N = N1 + N2 . The hu- If the winning rate were too biased, smart participants should
man participants or imitating agents who earned more than the be able to predict the next winning room in the experiment.
global average (M1 + M2 )/N are regarded as winners of the As shown in Fig. 8, when M1 /M2 is small (M1 /M2 = 1 or
round, and the room in which the winners have entered as the 3), adding some imitating agents will lower the efficiency and
winning room. The total number of human participants or im- cause large fluctuations. On the other hand, when M1 /M2 be-
itating agents can also be expressed as N = Nn + Nm . Here Nn comes even larger (M1 /M2 = 20), the formation of a herd can
is the total number of human participants who make decisions improve the efficiency, the stability, and the unpredictability
on their own, and Nm is the total number of imitating agents of the resource-allocation system.
who do not have their own ideas. The ratio between imitat-
ing agents and human participants is defined as β = Nm /Nn .
The game panel for human subjects and the control panel for (a)
parameter adjustment are shown in Fig. 6.
As shown in Section 3.1, the heterogeneity of preferences
is an indispensable factor for the whole system to reach a bal-
anced state. Hence the preferences of the human participants M1 /M2 β
need to be checked under the influence of imitating agents.
Preferences of the 44 participants are plotted in Fig. 7 with Time for making decision s
different M1 /M2 and/or β . Figures 7(a)–7(c) show the pref-
erences of the human participants and the imitating agents
are absent. It can be found that the heterogeneity of prefer-
ences remains even for the cases in which Nm = Nn /2 imitat-
ing agents are involved; see Figs. 7(g)–7(i). Despite this het-
erogeneity, the average of participants’ preferences changes
along with M1 /M2 . In other words, the human participants (b)
have the ability to adapt themselves to fit the environment no
matter whether the imitators exist or not. Similar results ap-
pear in the distributions of human participants’ preferences,
which are shown in Figs. 7(d)–7(f) and 7(j)–7(l). Even in an
a
extreme biased case, a few subjects with preference to room 2
still exist. Here the involvement of the imitating agents does 1 2
not bring much change to the preference distribution of the t
human participants. One may say that, in this case, the herd
behavior has no harmful effect on the analyzing ability of the Time remained: 60 seconds
human participants.
To evaluate the performance of the whole system, we
have calculated efficiency (which, herein, only describes the Fig. 6. The panels of the experiment-control computer program used
in the computer-aided human experiments: (a) the control panel for the
degree of balance of resource allocation), stability, and pre- organizer, and (b) the panel for the human subjects. [51]
078902-11Chin. Phys. B Vol. 23, No. 7 (2014) 078902
10 20 30 40 10 20 30 40 10 20 30 40
1.0
Preference (room 1)
0.8
0.6
0.4
0.2
0
0.6
Probability
0.4
0.2
0
1.0
Preference (room 1)
0.8
0.6
0.4
0.2
0
0.6
Probability
0.4
0.2
0
0 0.3 0.6 0.9 0 0.3 0.6 0.9 0 0.3 0.6 0.9
Preference (room 1) Preference (room 1) Preference (room 1)
Fig. 7. Data obtained from the human experiment. (a)–(c) and (g)–(i) Preferences of the 44 participants in sequence to room 1 for the cases
(a)–(c) without and (g)–(i) with imitating agents for different resource distributions M1 /M2 . The mean denotes the average of the preferences
of the 44 participants. (d)–(f) and (j)–(l) Distributions of the 44 participants’ preferences. [51]
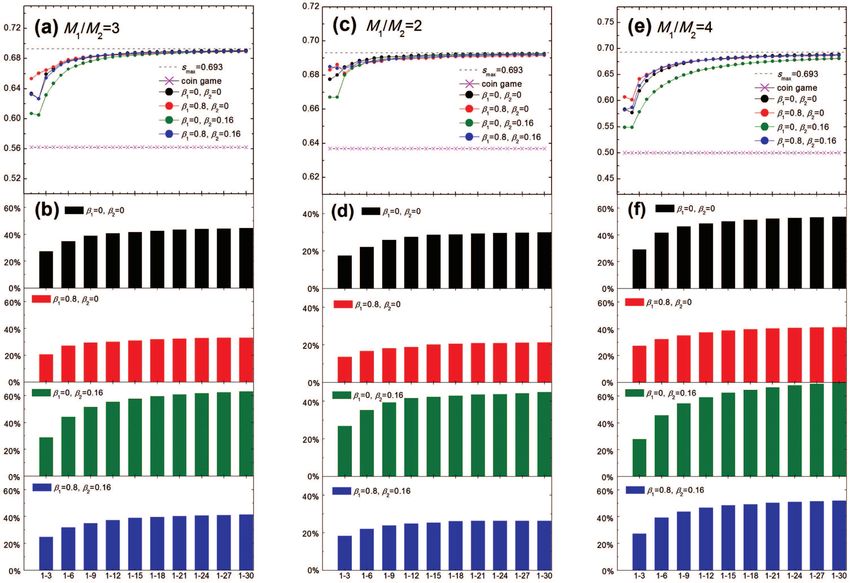
Fig. 8. Experimental results for (a) efficiency e, (b) stability σ 2 /N, and (c) predictability w1 of the modeled resource-allocation system, with human
participants Nn = 50. The β = 0 and 0.5 correspond to imitating agents Nm = 0 and 25, respectively. Each experiment lasts for 30 rounds. [51]
Clearly, the above experiment has some unavoidable lim- The agent-based model is the MDRAG with imitators. Normal
itations: specific time, a specific experiment avenue (a com- agents correspond to the subjects in the preceding experiments
puter room in Fudan University), specific subjects (students not knowing the ratio of the resource distribution. Imitators in
and teachers of Fudan University), and the limited number of the model do not have their own strategy tables and behave in a
subjects. Now we are obliged to extend the experimental re- different way. Before each round of play starts, each imitating
sults beyond such limitations through computer simulations. agent will randomly select a group of k (1 ≤ k ≤ Nn ) normal
078902-12Chin. Phys. B Vol. 23, No. 7 (2014) 078902
agents. Within this group, the imitating agent will find the of a herd in the system.
normal agent who has the best performance so far and imitate Following the analysis of the experimental results, we
its behavior in the following experiment round. It is assumed first investigate the simulation results for the preferences of
that the imitating agents know neither the historical record of the normal agents. Figure 9 shows the distributions of the
the winning room nor the details of the strategy books of other preferences similar to those shown in Fig. 7. The qualitative
group members. The only information for them to access is the agreement indicates that our agent-based modeling has taken
performance of the normal agents, that is, the virtual money into account the heterogeneity of preferences with a reason-
that these normal agents have earned from the beginning of able modeling of the decision making process for the human
the experiment. If the number of imitating agents Nm kept in- participants. We have also investigated the preferences of the
creasing, there would be more and more positive correlations normal agents in an alternative way by analyzing the Shannon
among agents’ decisions, which would trigger the formation information entropy (see Section 4.2.1).
10 20 30 40 50 10 20 30 40 50 10 20 30 40 50
1.0
Preference (room 1)
0.8
0.6
0.4
0.2
0
0.16
0.12
Probability
0.08
0.04
0
1.0
Preference (room 1)
0.8
0.6
0.4
0.2
0
0.16
0.12
Probability
0.08
0.04
0
0 0.3 0.6 0.9 0 0.3 0.6 0.9 0 0.3 0.6 0.9
Preference (room 1) Preference (room 1) Preference (room 1)
Fig. 9. Simulation results obtained from the agent-based simulations. (a)–(c) and (g)–(i) Preferences of the 50 normal agents to room 1 for the
cases (a)–(c) without (β = 0) and (g)–(i) with (β =0.5) imitating agents for different resource distributions M1 /M2 . We have run the simulations
200 times, each with over 400 time steps (first half for equilibration, the remaining half for statistics). The plots show the typical results of one
of the 200 runs, and the mean denotes the mean value of the preferences of the 50 normal agents. (d)–(f) and (j)–(l) Distributions of the 50
normal agents’ preferences. Note that the results in panels (d)–(f) and (j)–(l) are obtained from the average over the 200 runs, and the mean
also denotes this average. Simulation parameters are S = 4, P = 16, and Nn = 50. [51]
Next, efficiency, stability, and predictability of the whole is shown in Fig. 10. As shown in Fig. 10(a), when the re-
modeled system are calculated according to the definitions source distribution is almost unbiased (M1 /M2 ≈ 1), the aver-
made in the experimental study. The change of the system aged population ratio hN1 i/hN2 i can always be in concert with
behavior along with the variation of the resource ratio M1 /M2 M1 /M2 no matter whether the imitating agents are involved
078902-13Chin. Phys. B Vol. 23, No. 7 (2014) 078902
or not. On the other hand, as the resource distribution be- creases, more imitating agents can yield higher stability of the
comes more and more biased (M1 /M2 increases), surprisingly, resource-allocation systems. Finally, the effect of the herd be-
the whole system tends to reach the balanced state only if more havior on the predictability of the resource-allocation system
imitating agents (larger β ) join the system. Figure 10(b) shows is shown in Fig. 10(d). When more imitating agents are intro-
the change of the efficiency of the resource-allocation system. duced to the system for large M1 /M2 , the prediction of the next
The tendency is that when the resource ratio gets more biased, winning room becomes more difficult as the winning rates for
a larger size of herd is needed to realize a higher efficiency the two rooms are more symmetric. Notice that the system
of the resource distribution. As shown in Fig. 10(c), the in- behavior under various conditions found herein by the agent-
crease of the number of imitating agents will cause larger fluc- based simulations echoes with the observations in the experi-
tuations in the low M1 /M2 region. However, as M1 /M2 in- ment.
/
σ2/N
w1
e
M1/M2 M1/M2
σ 2 /N,
Fig. 10. The (a) hN1 i/hN2 i, (b) e, (c) and (d) w1 as a function of M1 /M2 for an open system in the agent-based simulations. Parameters are
Nn = 50, S = 4, P = 16, k = 5, and β = 0, 0.5, 1.0, and 2.0. For each parameter set, the simulations are run for 200 times, each over 400 time steps
(the first half for equilibration, the remaining half for statistics). In panel (a), slope = 1 denotes the straight line with its slope being 1. [51]
We have revealed that, if the bias between the two re- ing agents learn from the best local human participant or nor-
sources M1 /M2 is large and unknown to the participants, a mal agent, the herd formed by these agents will certainly be
herd of a typical size could help the overall system to reach more oriented to the richer room. Based on these results, we
the optimal state, namely, the state with a minimal fluctuation, argue that the herd behavior should not be labeled the killer of
a high efficiency, and a relatively low predictability. When the balance and stability all the time.
resource distribution is not biased so much, the normal agents
can play pretty well so that the resource-allocation system be- 3.3. Contrarian behavior
haves in a healthy manner (efficient or balanced, stable and In the minority game, the minority can win more re-
unpredictable). In such situations, adding imitating agents will sources. One may consider following the minority to increase
only bring about a “crowded system” in which larger fluctua- the probability of winning. Besides the herd behavior, the con-
tions turn up. In this respect, our study shares some common trarian behavior is also a specialized kind of self-organization
features with the binary-agent-resource model. [128,129] When in complex adaptive systems. Determining the nature of the
a large bias exists in the distribution of resources, the richer contrarian behavior is also of practical importance when one
room will offer more arbitrage opportunities so that it deserves faces the relevant problems of resource allocation. Thus, the
to be chosen without too much deliberation. Since the imitat- contrarian behavior has been an active subject of studies in
078902-14You can also read