Detailed appraisal of the offshore wind industry in China - Working with
←
→
Page content transcription
If your browser does not render page correctly, please read the page content below
1

Detailed appraisal of the
offshore wind industry
        in China

Working with: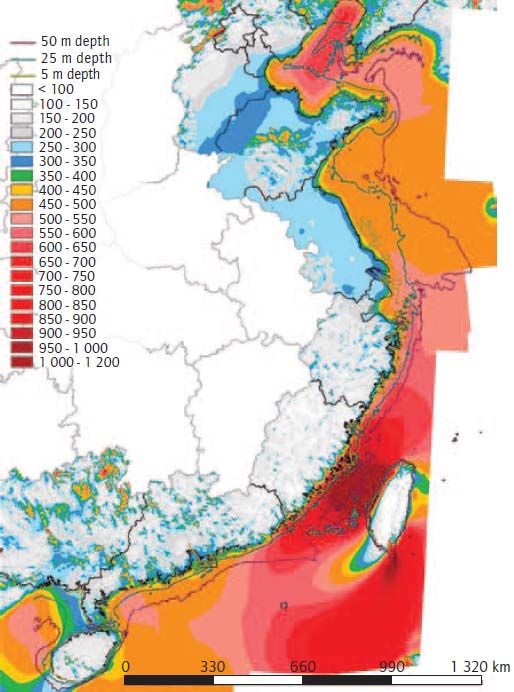
The Carbon Trust wrote this report based on an impartial analysis of primary and
                               secondary sources. The Carbon Trust’s mission is to accelerate the move to a
                               sustainable, low carbon economy. It is a world leading expert on carbon reduction
                               and clean technology. As a not-for-dividend group, it advises governments and
                               leading companies around the world, reinvesting profits into its low carbon mission.

                               The British Embassy in Beijing funded this report. The Embassy is the main
                               British diplomatic mission in China and is responsible for all aspects of the UK’s
                               bilateral relationship with China. Under Ambassador Sebastian Wood's
                               leadership, the Embassy promotes UK interests through a strong, effective
                               relationship with China, covering a diverse range of issues, from bolstering global
                               security to increasing mutual economic prosperity, from establishing stronger
                               people-to-people ties to supporting British nationals in China.

                               Chinese Wind Energy Association (CWEA) was founded in 1981 as a non-profit
                               social entity, registered with the Ministry of Civil Affairs of the People’s Republic
                               of China. CWEA aims to promote the advancement of China’s wind energy
                               technologies, drive the development of China’s wind energy industry and enhance
                               the public awareness of new energy. It helps promote international academic and
                               technical cooperation; provide a bridge between the government and institutions;
                               establish good relationships with domestic and overseas wind societies and
                               cooperate with them; communicate with scientists and engineers closely.

                               CECEP Wind-Power Corporation develops and operates wind energy projects. The
                               company was formerly known as China Energy Conservation Windpower
                               Investment Company Limited. CECEP Wind-Power Corporation is based in
                               Beijing, China. The company operates as a subsidiary of China Energy
                               Conservation and Environmental Protection Group.

Authors:
                                                             Nick Duan
Stephen Wyatt                                                Junior Consultant, Carbon Trust
Director, Carbon Trust                                       nick.duan@carbontrust.com
stephen.wyatt@carbontrust.com
                                                             Bingxin Xie
Al-Karim Govindji                                            Vice Director, CWEA
Senior Manager, Carbon Trust                                 xiebx@cgc.org.cn
al-karim.govindji@carbontrust.com
                                                             Minghui Liu
Rhodri James                                                 Analyst, CWEA
Analyst, Carbon Trust                                        liumh@cgc.org.cn
rhodri.james@carbontrust.com
                                                             Guo Yi
                                                             Project Manager, CECEP
                                                             garyguoyi@hotmail.com
Table of contents
Executive Summary ....................................................................................................................................... 4

Market .......................................................................................................................................................... 6
   1.1     China Economy and Energy Needs                                 6
   1.2     Offshore Wind Resource                                       10
   1.3     Energy Supply and Demand                                     11
   1.4     Provincial Distribution of Offshore Wind                     12
   1.5     Offshore Wind Sites                                          17

Policy & Regulatory Framework .................................................................................................................. 19
   2.1 Renewable Energy Law                                             19
   2.2 First Concession Round                                           22
   2.3 Government Coordination                                          23
   2.4 Feed-In-Tariffs                                                  23
   2.5 Priority Status                                                  24
   2.6 Health and Safety                                                24

Financing .................................................................................................................................................... 25

Wind Farm Developers ................................................................................................................................ 27
   4.1 Overview                                                         27
   4.2 Project Consenting Process                                       29
   4.3 Project Development Timeline                                     31
   4.4 Design Institutes                                                32

Infrastructure ............................................................................................................................................. 33
   5.1 Grid Connectivity and Offshore Cabling                           33
   5.2 Ports                                                            36
   5.3 Manufacturing                                                    37

Technology .................................................................................................................................................. 39
   6.1 Turbines                                                         40
   6.2 Foundations                                                      49
   6.3 Installation                                                     58
   6.4 Operations & Maintenance                                         64

Synthesis .................................................................................................................................................... 66

References .................................................................................................................................................. 69

Detailed appraisal of the offshore wind industry in China 4
Executive Summary
China's energy demand continues to grow rapidly, most of it met by coal (70%) and oil (19%). Electricity
supply is dominated by coal, though hydro already makes an important contribution. However, the
government has committed to reduce energy intensity and increase use of renewables. To date, China has
focussed on driving the development of onshore wind as a key contributor to its renewables targets, with
total capacity at 75GW, a CAGR growth of 69% from 2001 to 2012. However, the challenge of connecting a lot
of this capacity to the energy hungry eastern coastal regions as well as a desire to diversify energy sources
has led to an increasing focus on offshore wind as a potential new source of renewable energy close to the
demand. Indeed, the government has set ambitious targets of 5GW of installed offshore wind capacity by
2015 and 30GW by 2020 that would eclipse capacity in other countries. However, China faces numerous
challenges to the development of the offshore wind industry, highlighted below.
Policy
While targets provide a market signal of the seriousness the government takes, it has not been met with
clear guidance on the feed in tariff rates that have been set too low and do not offer a definitive timeframe
for developers to be able to make effective investment decisions. Given the relative immaturity of the
offshore industry in China and the lack of commercial projects, it is not surprising that the government itself
needs more clarity about the likely costs of project development to enable the appropriate tariff to be set. A
reliable study around the future costs of deployment would help both government and developers.
Cost
The proximity to shore of China's farms (typically less than 15km) makes them similar to Round 1 and Round
2 sites in the UK, where typical capex ranged from around £1.2m/MW to £1.5m/MW (BWEA and Garrad
Hassan, 2009a). Analysis we have reviewed indicates that the deployment costs in China are similar, at
around £1.3m/MW to £1.4m/MW. While in the UK over the last five years costs have escalated dramatically
due to the more challenging conditions of farms further from shore and in more difficult met-ocean
conditions, where capex has doubled to £3.0m/MW. So any assessment of future costs in China must
account for changes in location so farms.
Consenting & Connections
The process of granting consents to developers can take two years. In an effort to speed up approvals, the
National Energy Administration (NEA) has delegated authority to the regional government; however, local
authorities often lack the skills to effectively evaluate proposals, thus shifting the approval process back to
central government.
As most of the farms are off the eastern coast where grid infrastructure is robust, there is little issue here.
However, connecting farms to shore via cables is a challenge given that grid companies have limited
capabilities and experience in this area, which will become more acute as farms move further from shore.
Technology
China faces a number of challenges around the technical deployment of offshore wind farms:
Turbines: European offshore wind turbines are moving to beyond 95% availability, a key factor for
achieving satisfactory project returns. Reliability of Chinese turbines is thought to be less than this,
with a key issue being the gearbox. Some OEMs are moving to gearless turbines but these also have
Detailed appraisal of the offshore wind industry in China 5
challenges around weight and hence additional cost of fabrication and installation. Corrosion and
heat Is also a major challenge given the unique conditions off the China coast.
Foundations: The sea bed off China’s east coast (within 5-30m depth) is characteristic of soft, silty
soils which are unlike soil conditions in Europe. This causes difficulty with regard to foundation type
and installation techniques. Selecting appropriate foundations will therefore be crucial, and while
there may be available solutions from existing European technologies, there is likely to be scope for
local R&D to develop bespoke solutions for China, such as suction buckets.
Installation: The lack of expertise as well as bespoke vessels makes installation the key cost in
Chinese offshore wind development. Additionally, China lacks skills in hammering techniques as
well as offshore assembly.
Operations & Maintenance: Poor turbine reliability significantly adds cost to O&M and so can
greatly reduce developer margins over time. A lack of expertise around transfer vessels also limits
the operation window for conducting repairs.
Above all, China has leveraged its skills and capabilities from the onshore wind industry to the offshore wind
market where the technical challenges are much greater and where the weather conditions more impactful
on turbine performance. Furthermore, initial demonstrations in China have focussed on the inter-tidal
range; given that the NEA has insisted that future farms be at least 10km from shore, a rapid learning is now
taking place that will take time to flow through to improved capabilities, technology and equipment. But
given the rapid growth of the onshore market, there can be confidence that China can achieve its offshore
wind targets, perhaps not by 2015, but perhaps by 2020.
Detailed appraisal of the offshore wind industry in China                                                                  6

Market
1.1 China Economy and Energy Needs
China is the world’s second largest economy, and recent economic growth has been accompanied by increased
energy consumption, with China now the largest consumer of energy and the largest emitter of carbon dioxide.
Indeed, electricity demand growth has exceeded economic growth in recent years (Innovation Norway, 2013).
Electricity demand in China has increased dramatically over the past decade, with total electricity consumption
in 2012 at a staggering 4,693 TWh (generating capacity = 1,144 GW), representing a three-fold increase since
2002 (IndexMundi, 2013). The majority of this electricity is supplied by coal-fired power stations, with hydro
power also increasing its share of the energy mix in recent years (Fig.1.1.1). However, with electricity demand
expected to reach 8,000 TWh by 2020 and 10,000 TWh by 2030 (IEA, 2011) and increasing pressure to develop
cleaner sources of energy, in 2006 the Chinese government set ambitious targets for renewable energy through
its Renewable Energy Law (REL), which requires that 15% of primary energy comes from renewables by 2020
(NEA, 2013) (Fig.1.1.2). This desire for a more sustainable energy supply strategy is explicitly outlined in China’s
12th Five-Year Plan (2011-2015), which states that China “will promote diversified clean energy sources and
other measures to encourage changes in energy production and use.”

Fig.1.1.1. Electricity installed capacity in China
                              1,400
                                                                                                      Nuclear
   Generation capacity (GW)

                              1,200
                                                                                                      Wind
                              1,000
                                                                                                      Hydro
                               800
                                                                                                      Thermal
                               600
                               400                                                                    Total

                               200
                                                                                                  Source: US EIA (2006-
                                 0                                                                2010), China NEA (2011-
                                      2006     2007      2008   2009     2010   2011       2012   12); Carbon Trust analysis.

Fig.1.1.2. China targets for non-fossil energy consumption as percentage of total primary energy consumption
                                20%
   energy consumption

                                                                                  15.00%
    Percentage of total

                                15%
                                                                11.40%
                                10%          8.00%

                                 5%

                                 0%
                                         2011 (actual)          2015               2020           Source: China NEA (2011).

Wind energy has emerged as a key pillar of China’s renewable strategy, with its installed capacity growth
rates exceeding those of any other energy source in recent years (Fig.1.1.3), and propelling China to become
the largest installer of wind energy in the world. This growth has been almost entirely focussed on onshore
Detailed appraisal of the offshore wind industry in China                                                        7

wind, with Chinese manufacturers emerging as key players in the onshore wind industry. However, issues
surrounding transmission costs and losses has left many onshore wind farms idle and disconnected from
the grid, slowing the growth of China’s onshore industry dramatically. With central government still
committed to maintaining wind energy as a key component of its renewable energy mix (Fig.1.1.4), China is
beginning to switch greater focus to offshore wind power. Indeed, China’s offshore wind resource has been
estimated at 200 GW in water depth 5-25m and 500 GW in water depth 5-50m (GWEC, 2012).

Fig.1.1.3. Percentage growth in electricity installed capacity in China (2007-2012)

                        140%
                                                                                                        Nuclear
                        120%
                                                                                                        Wind
   Percentage growth

                        100%                                                                            Hydro
                              80%                                                                       Thermal

                              60%                                                                       Total

                              40%
                                                                                                   Source: US EIA (2010)
                              20%
                                                                                                   for 2006-2010, China
                                  0%                                                               NEA (2013) for 2011-
                                                                                                   12; Carbon Trust
                                        2007        2008   2009   2010     2011   2012
                                                                                                   analysis.
Fig.1.1.4. China’s 12th Five-Year Plan for Renewable Energy

                                  400
                                                                                         Hydro
                                  350                                                    Hydro Pumped Storage
                                  300                                                    Onshore Wind
                                                                                         Offshore Wind
                  Capacity (GW)

                                  250
                                                                                         Nuclear
                                  200
                                                                                         Solar
                                  150                                                    Biomass
                                  100

                                   50
                                                                                   Source: China NEA
                                   0                                               (2013); Carbon Trust
                                        2010 (actual)      2015          2020      analysis.

The Chinese government has set ambitious targets to scale-up the deployment of offshore wind power.
China’s 12th Five Year Plan for Energy set a goal of 5 GW capacity by 2015 – a ten-fold increase from current
installed capacity of 565 MW – and 30 GW by 2020 (fig.1.1.5). This would require a build-out rate of 5 GW per
year on average beyond 2015 (equivalent to current global capacity) – a level of growth which is
unprecedented in the offshore industry and would see China overtake the UK as the market leader in
offshore wind energy sometime between 2015 and 2020. Importantly, China’s wind goals (onshore and
offshore) also have targets that set the amount of energy produced (190 TWh per year), so that a focus is put
on efficient and effective energy generation, rather than simply building capacity (Innovation Norway, 2013).
Detailed appraisal of the offshore wind industry in China                                                                   8

Fig. 1.1.5. National offshore wind capacity targets to 2020

          UK
    Denmark
       China
     Belgium
    Germany
 Netherlands
     Sweden
       Japan
          US

               0            5000           10000            15000             20000        25000          30000
                                                   Generation capacity (MW)       Source: EWEA (2011); Freshfields Bruckhaus Deringer
                                                                                  (2013); EREC (2011); IEA (2011); U.S. Dept of Energy
                                                2010     2013    2020             (2011); www.4coffshore.com; Carbon Trust analysis.

A comparison with the growth of China’s onshore wind industry indicates that reaching these targets for
offshore wind could be feasible (Fig.1.1.6). Indeed, there may be opportunities to transfer manufacturing and
technology capabilities between the two industries, particularly between turbine manufacturers.
Nevertheless, it is widely accepted that offshore wind carries many more challenges than the onshore
industry and, as such, the rate of deployment should be expected to be slower.
Fig. 1.1.6. China installed capacity of onshore wind power

                                               CAGR
                                               +69%

                                                                                                 Source: CWEA (2013).

China’s offshore wind industry has already shown encouraging signs of growth (Fig.1.1.7); however, a ten-
fold increase from 565 MW in mid-2013 (389 MW by end of 2012) to 5 GW by 2015 will require a significant
scaling up of deployment. Adding 4.5 GW of capacity in ~18 months, to reach 5 GW, would surpass what the
onshore wind industry took 3-4 years to achieve, between 2003 and 2007, when the industry was at a similar
stage of maturity. There are a significant number of projects in the pipeline, with sufficient capacity
consented to reach the 2015 target (Fig.1.1.8); however, disputes over the level of feed-in-tariff and poor
coordination between state organisations has stalled construction on a number of sites, making it unlikely
that the 5GW target will be reached by 2015. Recent industry estimates consider 2.5-3 GW by 2015 to be a
more realistic target (Wind Power Monthly, 2013).
Detailed appraisal of the offshore wind industry in China                                                                 9

However, if offshore wind can parallel the longer term growth rates realised in the onshore industry, the
2020 target of 30 GW installed capacity might be achievable. The onshore industry also initially struggled for
a 2-3 year period until suitable tariffs and policies were implemented, and the offshore industry can expect
to mirror a similar level of growth as the industry reaches critical mass and economies of scale bring
returns to developers and investors (Quartz & Co., 2013). Furthermore, the government has recently
identified offshore wind as a priority industry, with a view to encouraging offshore wind development through
favourable policies and incentive mechanisms, which should add to the growing optimism of reaching its
near- and medium-term targets.

Fig. 1.1.7. China offshore wind capacity, installed 2007-2012

                                                         CAGR
                                                         +153%

                                                                                         Source: CWEA (2013).

Fig.1.1.8. Pipeline of offshore wind projects versus national targets

                   40000

                   35000

                   30000
   Capacity (MW)

                   25000

                   20000

                   15000

                   10000

                   5000

                      0
                                             Pipeline                                    Target

                       Fully Commissioned               Under construction       Consent Authorised
                       Consent Application Submitted    Concept/Early planning   Development zone
                                                                                                        Source: www.4coffshore.com;
                       2015 target                      2020 target
                                                                                                        Carbon Trust analysis.
Detailed appraisal of the offshore wind industry in China                                                        10

1.2 Offshore Wind Resource
The offshore wind potential off China’s east coast has been estimated at 200 GW within water depth 70 m/s (the upper threshold for Class I turbines) (World Bank, 2008).

The frequency of summer typhoons in the south means that the most abundant wind resource (Force 6 and above)
is located in the Taiwan Strait. Offshore areas near Fujian, southern Zhejiang, and Guangdong are therefore prime
locations to maximise this wind resource. The occurrence of typhoons north of the Yangtze River is very limited,
but the wind resource is still sufficient for significant offshore development, particularly in northern Zhejiang and
Jiangsu. Jiangsu alone has an estimated potential near-offshore capacity of 14 GW and at depths of 5 to 25m (IEA,
2011). Average wind speeds in Fujian are ~10m/s, while other provinces typical experience average wind speeds of
6-8m/s, which are still sufficient to harness optimum levels of power output (Quartz & Co., 2013).

Fig.1.2.1. Distribution of annual average wind power densities in 5-50m depth sea areas

                                                             Source: IEA (2011)

Despite these macro-level wind resource assessments, there is a lack of accurate wind resource data at site
scale. The importance of wind speed cannot be overemphasised, as it is critical in determining the
commercial viability of wind power projects. Accurate wind resource measurement to ascertain the power
output of a site is therefore crucial before making expensive offshore investments.
Detailed appraisal of the offshore wind industry in China 11
1.3 Energy Supply and Demand
China’s electricity demand is concentrated along its east coastline. Offshore wind represents an attractive
energy solution here as they lack coal resources and are becoming increasingly dependent on transporting
fuels from inland China or importing from abroad (fig.1.3.1). These provinces also suffer from power
shortages in the summer months, with power generation and grid transmission systems unable to cope with
rising demands. Considering the richness of offshore wind resources and its proximity to markets,
developing offshore wind energy in coastal regions could be an effective solution to solve their power
shortage, relieve the stresses both from railway and power transmission systems, and reduce greenhouse
gas emissions (Hong & Moller, 2012). Fig.1.3.2 shows the extent to which offshore wind off five of China’s
coastal provinces could fill their respective electricity gaps in 2020, which cumulatively would represent
63.3% of the total imported electricity in these provinces.
Fig.1.3.1. Electricity generation and consumption in China’s coastal provinces in 2009
Source: Hong & Moller (2012).
Fig.1.3.2. Imported electricity in 2009 compared to offshore wind generation in 2009.
Source: Hong & Moller (2012).Detailed appraisal of the offshore wind industry in China 12
There is also significant appeal over onshore wind power, where the wind resource is concentrated in the northern
and western regions of China (Fig.1.3.3). China’s onshore industry has suffered from significant transmission costs
and energy losses, which resulted in many sites being left without connection to the grid (Yu & Zheng, 2011). With
China’s extensive wind resource being located so close to China’s populous urban hubs, it is expected that the
current grid infrastructure would require only limited modifications to connect farms to the grid.
Fig.1.3.3. China’s onshore wind generation vs. provincial electricity demand
Source: Ma & Weekes
(2010).
While China has an abundant offshore wind resource, the strongest winds appear to be onshore, in the
inland northern regions (World Bank, 2008). The issues facing China’s wind industry therefore differ from
the situation in Europe, where the increased resource offshore goes some way to counterbalancing the
increased capital costs. Rather, in China, it is the proximity to demand and reduced transmission costs that
provide the incentive for offshore wind development.
1.4 Provincial Distribution of Offshore Wind
In April 2009, the National Energy Administration (NEA) required each coastal province to formulate a provincial
offshore wind development plan, including the number of farms, their size, and their location. Offshore wind
plans have been completed in six provinces to date, with Jiangsu showing the greatest level of ambition (fig.1.4.1).
Jiangsu already leads China’s offshore wind market with 79% of installed capacity, most of which is situated in
intertidal zones, and has submitted a plan for 4.6 GW installed capacity by 2015 and 9.45 GW by 2020. Shanghai,
which includes the first and largest commercial offshore wind farm in China – the 102MW Donghai Bridge project
– has more modest targets and has already had its provincial plan approved by the NEA, including an additional
600 MW by 2015 and total installed capacity of 1.55 GW by 2020. Meanwhile, despite very little installed capacity
so far, Shandong and Hebei have ambitious plans to scale-up offshore wind by 2020; and Guangdong has
completed a provincial plan which includes a target of 10.7 GW by 2030 (Innovation Norway, 2013).
There are already a significant number of projects in the pipeline to deliver the target capacity, in some cases
far outstripping 2020 targets (e.g. Fujian, Hebei, and Zhejiang), and in others appearing to fall short of the
plans (e.g. Shandong and Shanghai). However, it should be acknowledged that much of this pipeline is at the
concept stage and subject to change significantly over the coming years. Nevertheless, such ambition affirms
that, despite delays, the industry remains confident about the potential for growth and development in China.Detailed appraisal of the offshore wind industry in China 13
Fig.1.4.1. Provincial plans for offshore wind energy in China versus project pipeline.
10000
9000
8000
7000
Capacity (MW)
6000
5000
4000
3000
2000
1000
0
Fujian Guangdong Hebei Jiangsu Shandong Shanghai Zhejiang
(Pending) (Completed) (Completed) (Completed) (Completed) (Completed) (Completed)
2013 (current) 5 0 0 444 12 102 0
2015 300 1000 500 4600 3000 700 1500
2020 1100 5600 9450 7000 1550 3700
Pipeline 4080 2566 8398 7907 2572 804 5946
*Guangdong has set a target of 10.7 GW by 2030
Source: Hong & Moller (2012); Innovation Norway (2013); Quartz & Co (2013); www.4coffshore.com; Carbon Trust analysis.
Fig.1.4.2. Provincial plans for offshore wind energy in China
Source: Innovation Norway (2013). (N.B. Guangdong target is for 2030).Detailed appraisal of the offshore wind industry in China 14
The cumulative plans of all of China’s provinces exceed the national targets (2015 = 11.6 GW planned vs. 5
GW national target; 2020 = 39 GW planned vs. 30 GW national target). However, as discussed in section 1.1,
given the challenges the industry is facing (both regulatory and technical), the 2015 target in particular will
be difficult to attain. Nevertheless, with 565 MW already installed, 1,978 MW under construction, and 6,712
MW consented (fig.1.4.3), China’s potential to meet its near-term target appears somewhat more promising,
particularly given that the consented projects must begin construction within two years from concession,
otherwise the site will be re-opened to tender. Given that the typical wind farm in China takes 1-2 years to
construct (e.g. Donghai Bridge), China appears on track to install ~9 GW by 2017, with analysis from Quartz
& Co predicting up to 4.5 GW being achievable by 2015 (Quartz & Co., 2013).
Fig.1.4.3. Status of China’s offshore wind projects (installed and pipeline)
25000
22761
20000
CAPACITY (MW)
15000
10000
6712
5000
1978 2048 1600
565
0
Fully Under Consent Consent Concept/Early Development
Commissioned construction Authorised Application planning zone
Submitted
Source: www.4coffshore.com; Carbon Trust analysis
Unsurprisingly, these regional plans for installed offshore wind capacity are closely tied to the cost of
offshore wind development. Analysis by Hong & Moller (2012), which calculated the cost of energy under
tropical cyclone risk and spatial constraints, discovered that the lowest cost sites for offshore wind
development are along the coasts of Jiangsu, Shanghai, Hebei, Liaoning, and Tianjin (fig.1.4.5). While Fujian
is endowed with the highest wind density, its total technical potential of offshore wind energy is much lower
than that of Zhejiang and Guangdong. Even though the largest technical potential of offshore wind energy is
located in Guangdong, the spatial constraints exclude as high as 14.5% of its exploitable potential (Hong &
Moller, 2012). Guangdong experiences 3-4 typhoons every year, and as such, development can only be
planned in areas not susceptible to adverse weather conditions (Quartz & Co., 2013). In addition, the
economic risk of tropical cyclones are fairly high in both Fujian and Guangdong, compared to other
provinces such as Jiangsu and Shanghai which are at lower risk to tropical typhoons.Detailed appraisal of the offshore wind industry in China 15 Fig.1.4.4. Marginal levelised electricity production costs in China’s coastal provinces Source: Hong & Moller (2012). The relative costs of offshore wind development are also expected to vary over time, as capacity increases and spatial constraints in certain regions become more acute. Thus, while in the short term Shanghai is the most economically competitive location for developing offshore wind farms, costs are likely to increase dramatically as more cumulative electricity generation capacity is installed and sites must be developed further from shore (fig.1.4.4). In the long term, Jiangsu emerges as the most cost competitive province for the large-scale development of offshore wind farms, due to the level of wind resource around its extensive coastline, lack of spatial constraints from shipping routes and marine conservation zones, and lower risk from tropical cyclones.
Detailed appraisal of the offshore wind industry in China                                             16

Fig.1.4.5. Spatial distribution of levelised electricity production costs around China’s coastal provinces

Source: Hong & Moller (2012).
Detailed appraisal of the offshore wind industry in China                                                 17

1.5 Offshore Wind Sites
While China had installed 389.6 MW offshore wind power by the end of 2012, 67% of this was situated in
intertidal zones, with just 128 MW located offshore (fig.1.5.1). Furthermore, the majority of this capacity (102
MW) is located in a single site – Donghai Bridge – with the remainder consisting of prototypes of various unit
capacities for demonstration and testing purposes. The unique conditions of China’s intertidal zone
produced a number of challenges for offshore wind development, particularly with regard to installation and
O&M, and very few solutions have been established. However, the intertidal projects to date have been
valuable as a testing bed for different turbine and foundation designs. For example, the Rudong 182 MW
intertidal wind farm in Jiangsu province tested 9 turbines from 8 manufacturers, as well as a variety of
foundations, including monopiles and tri-piles, and introduced a number of players to the offshore industry
(Innovation Norway, 2013).

However, new regulations introduced in 2011 by the NEA and SOA through the “Implementation Rules of the
Interim Measures for the Management of Development and Construction of Offshore Wind Power” dictate
that, in principle, future offshore wind farms should be located no less than 10km from shore and in water
depth no less than 10m if the width of the tidal flat is
Detailed appraisal of the offshore wind industry in China                                                                            18

Fig.1.5.2. Geographical conditions of selected existing and planned offshore wind farms in China

                              16

                              14

                              12
   Water depth (m)

                              10

                                   8

                                   6

                                   4

                                   2

                                   0
                                       0               5                10             15             20             25         30
                                                                           Distance from shore (km)
                                        Fully Commissioned              Under construction            Consent Authorised
                                        Consent Application Submitted   Concept/Early planning

*Point size reflects average project capacity (see fig.1.5.3).
Source: 4coffshore; Carbon Trust analysis.

Thus while distance from shore and water depth are likely to be challenges, China may be able to benefit
significantly from experience in the UK and elsewhere in Europe, where technological solutions exist and
capability is strong. However, it is also expected that there will be some unique challenges for China’s
offshore industry.

Following the success of the Donghai Bridge project and various demonstration projects, the scale of future
projects in the pipeline is expected to increase significantly, with more commercial-scale projects coming
on-line (Fig.1.5.3). Whereas existing installed projects are small-scale demonstration/early-commercial
sites, typically ranging from 2-100 MW capacity, there are plans to develop large arrays of up to 1.8 GW
capacity by 2020. These sites are likely to deploy the 5+ MW turbines currently at the demonstration stage.

Fig.1.5.3 Average farm capacity of installed and planned offshore wind farms

                                   350.0
         AVE. FARM CAPACITY (MW)

                                   300.0
                                   250.0
                                   200.0
                                   150.0
                                   100.0
                                    50.0
                                       0.0
                                                Fully             Under           Consent         Consent       Concept/Early
                                             Commissioned      construction      Authorised      Application      planning
                                                                                                 Submitted

Source: www.4coffshore.com; Carbon Trust analysis.
Detailed appraisal of the offshore wind industry in China 19 Policy & Regulatory Framework Energy, and electricity in particular, is a highly policy dependent market, strongly shaped by regulation, incentives, and public goals. A prerequisite for a successful offshore wind market is therefore a good level of support from government. Such support is important for renewables as a whole but, given the relatively risky nature of offshore wind, it is particularly important in this area. Offshore wind development requires both significant capital and technical resources, and in order to mobilise these two key ingredients, investors must have confidence in the long term support of the sector by government. Without this, offshore wind will remain unnecessarily expensive or will not be developed at all (World Bank, 2008). According to analysis undertaken by the World Resources Institute, industry scale-up correlates with support policies with at least a three year time horizon, often with accompanying government commitment to the wind industry and ambitious targets for deployment (WRI, 2012). This has been evident in China’s onshore industry, where steady growth was supported by a competitive feed-in-tariff, the availability of low interest rate project financing, research/industry clusters, and public awareness and support for wind power. However, this has yet to be paralleled in the offshore industry. Thus, while China has set clear and ambitious deployment goals for offshore wind, the lack of financial incentives has stalled the growth of the industry. 2.1 Renewable Energy Law In order to promote the development of the offshore wind power industry, China has established a basic offshore wind power policy system. Based on the Renewable Energy Law (REL), the system consists of offshore wind power planning and development, economic incentive policies, grid connection policy, and technical standards (fig.2.1.1). The system is expected to evolve over time to provide comprehensive regulatory support for the industry.
Detailed appraisal of the offshore wind industry in China 20
Fig.2.1.1. Influence of China’s Renewable Energy Law on offshore wind power.
Source: CWEA (2013)
Among the regulations included in the REL were a number of progressive policies to encourage investment
in the industry. These included national targets, consenting policy, economic incentives, and grid connection
policy.
National targets:
Deployment – The government has set a target of 5 GW by 2015; 30 GW by 2030
Industry – power companies with capacity greater than 5 GW must produce 3% of electricity from non-
hydro renewables by 2010 and 8% by 2020 (Ma & Weekes, 2010). Since most power generators in China
are large state-owned enterprises with a capacity of more than 5 GW, this impacts the quantity of
electricity produced from renewables significantly.
R&D – Targets have also been put in place to encourage increased innovative activity, including a target
for R&D expenditure to account for 2.5% of GDP. During the 11th Five Year Plan period, an estimated
15.3% of government stimulus funding was directed towards innovation, energy conservation, ecological
improvements and industrial restructuring; and in 2010 the government invested US$1.3 billion in clean
energy R&D, including wind (WRI, 2012).Detailed appraisal of the offshore wind industry in China 21
Consenting policy:
Planning – the REL attempts to streamline planning on a nationwide basis to ensure more co-ordination
between central and provincial governments. After problems in the first concession round, this now
includes clear guidance on the roles of the respective government departments involved in offshore
development.
Economic incentives:
Price – the REL establishes a feed-in tariff for the price of electricity based on the region and type of
energy. For onshore wind, the NDRC established 4 FITs in 2009 for 4 groups of regions (NDRC, 2009).
Group I, with richest wind resource, is CNY 0.51 /kWh. Group II 0.54, Group III 0.58 and Group IV 0.61.
However, crucially, fixed FITs for offshore wind are yet to be announced, with FITs for early offshore
projects determined either by consenting or bidding (see section 2.2).
Renewable Energy Development Fund – this compensates grid companies for the increased costs of
purchasing power from renewable sources (Out-Law, 2013).
Preferential Tax Policy - Investments in renewable energy benefit from favourable treatment both in
terms of obligations for value added tax (VAT) and enterprise income tax (EIT). Since 2009, VAT for wind
power has been reduced from 17% to 8.5% and income tax has been reduced from 33% to 15% (Xiliang et
al., 2012).
Grid connection policy:
Connection – Companies must connect wind farms to the grid, and grid operators have a legal
requirement to source a proportion of their energy from renewable sources. Furthermore, developers are
not allowed to begin construction until they have obtained grid connection approval.
Power Purchase Agreement – Grid operators must purchase all renewable energy generated by
licensed companies.
Power generation predictions - In order to improve wind power connection, the REL requires all
connected wind farms to set up a wind power predication and report system.
The REL did not move deployment forward significantly in itself, but by introducing medium and long-term
renewable energy targets there was certainty in the market of the importance that the government was
placing on offshore wind moving forward (WRI, 2012). However, the first round of concession tenders have
experienced significant problems, namely through poor coordination between government departments and
the absence of a sustainable and long-term feed-in-tariff.Detailed appraisal of the offshore wind industry in China 22
2.2 First Concession Round
China’s first round of concession bidding started in September 2010. Project developers were selected
through an evaluation process that examines the bid’s tariff, construction design, technological capacity, and
performance record (Ma & Weekes, 2010); although low electricity price and high equipment localisation
appear to be the prevailing factors in determining the winning bidder (Hong & Moller, 2012). Four projects
totalling 1 GW power capacity were selected in four subsidiary counties of Yancheng city, Jiangsu; two of
which were offshore and two of which were intertidal.
Table.2.2.1. First concession round project details
Project Capacity Developer Feed‐in‐Tariff Construction started
(MW) (CNY per KWh)
Jiangsu Binhai Offshore 300 China Datang Corporation Renewable 0.7370 Sept 2013
Wind Farm Power Company
Jiangsu Sheyang Offshore 300 China Power Investment Corporation 0.7047 Expected 2013
Wind Farm
Jiangsu Dongtai Intertidal 200 Shandong Luneng Group 0.6235 Sept 2013
Wind Farm
Jiangsu Dafeng Intertidal 200 China Longyuan Power Group 0.6396 Sept 2013
Wind Farm
Source: CWEA; www.4coffshore.com.
Fig.2.2.1. Location of first round concession projects in Jiangsu province
Source: CWEA (2013).Detailed appraisal of the offshore wind industry in China 23
2.3 Government Coordination
These projects were originally expected to complete within four years but construction only commenced in
three of the projects in September 2013 (Binhai, Dongtai, and Dafeng), with construction expected to start in
Sheyang in the final quarter of 2013 (4coffshore, 2013). This delay was in part caused by a lack of
coordination and conflict between various government departments, particularly the National Energy
Administration (NEA) and the State Oceanic Administration (SOA). While the SOA wants wind farms to be
built as far as possible from the shore, in order to save space for fishing, transportation and many other
uses, the NEA wants the opposite, in order to reduce the costs and technical challenges of installing wind
farms further from shore. Indeed, while the NEA has a commitment to develop offshore wind farms in China,
the SOA has no such mandate (Quartz & Co., 2013). Poor coordination led to certain areas being designated
for both offshore wind development and other activities, with developers having to relocate to new sites,
having incurred the costs for planning the original farm’s development (EE News, 2012). For example:
The Sheyang project, being developed by China Power Investment Corporation, was stuck in the project
design phase due to the conflict of military use of the area (xinhuanet, 2013);
The Dongtai project, being developed by Shandong Luneng Group, experienced a 10km relocation further
offshore to make way for a wildlife conservation area, and only applied to the NEA for project approval in
Nov 2012, a year and a half later than planned;
The projects at Binhai and Dafeng, owned respectively by China Datang Corporation and China Longyuan
Power Group, didn’t apply to NEA for project approval until 2013.
In order to resolve this conflict, in 2010 the NEA and SOA jointly released a new set of regulations and frameworks
for offshore wind projects, delegating responsibility for selecting developer bids and agreeing FIT rates to the NEA,
and responsibility for site approval to the SOA. The regulations also specified that future concession projects
should be located at least 10km from shore and 10m water depth if the tidal flat is more than 10km wide, and
should avoid areas designated for commercial uses (e.g. fishing, tourism, military). This level of clarity over which
offshore sites are licensed for development should ease the overall process and encourage developers to enter
the market. The first four concession projects have since undergone a new round of environmental evaluation and
cable routing (Innovation Norway, 2013), with construction having recently got underway in three sites (Binhai,
Dafeng, and Dongtai) and expected to commence in Sheyang in the final quarter of 2013.
2.4 Feed-In-Tariffs
The other major obstacle making developers reluctant to start construction is the overly low feed-in-tariffs.
Prior to this first concession round the government had removed a regulation stipulating that the highest
and lowest bids would be eliminated from the tender, which had been used to good effect in the early
onshore concession rounds. The danger of selecting bids based on price is that it tends to produce
extremely low bids. In order to win the concession project, some bidders intentionally underestimate
operating costs to get a lower price compared to other bidders. This created a race-to-the-bottom bidding
war to win the concession projects, with developers entering bids with low and unprofitable FITs.
One interpretation might be that power companies were keen to impress local and central government with
their progress towards developing clean energy sources (Innovation Norway, 2013), while another might
suggest that this was in order to gain first-mover advantage over other developers hoping to engage with the
offshore industry (Quartz & Co., 2013). However, once such a bid is selected, it proves economically
impossible to construct and operate the offshore wind farm, with developers failing to meet the build-outDetailed appraisal of the offshore wind industry in China 24 price stated in their concession tender, and construction stalling as a result of their inability to make commercial returns against such a low FIT (Hong & Moller, 2012). It is unsurprising that developers are unable to make a profit given that the offshore FITs were only ~30% higher than the FITs established for onshore wind power, despite offshore projects typically costing 2-3 times more than those onshore. To help the developers of the first concession round to recoup the substantial investments in their respective projects, the NEA has allowed the four developers to apply for new feed-in-tariffs. For example, China Datang has applied for an increase of FIT from CNY 0.737 to 0.860 per kWh (Takung, 2013). Yet even this revised FIT is below the CNY 1.0/kWh thought to be necessary for developers to make an 8% internal rate of return (IRR) (Wind Power Monthly, 2013). However, it should be acknowledged that due to the immaturity of the offshore industry in China and the lack of commercial projects in operation, it is still unclear what level of FIT would be most appropriate, and the industry has much to learn before it can confidently establish a long term incentive mechanism. Indeed, the onshore wind industry went through 5 rounds of concession bidding before NDRC established the benchmark FITs and offshore wind has only been through one round so far. Thus, in the absence of a FIT, the Chinese government are likely to go through more rounds of concession tendering. The second round, with a total capacity of 2 GW, was originally planned to commence in 2011 but was postponed in line with the delays to the first concession round. With the first round projects now approved and on track to all begin construction towards the end of 2013, it is anticipated that the second round of concession tenders will open soon, likely in 2014. These ‘pilot’ projects will provide an opportunity for developers to gain experience in constructing offshore wind farms and provide a testing ground for various offshore wind technologies that can be deployed in China. Experience gained from these projects will help to identify key challenges and understand an appropriate level for a long-term and sustainable FIT (Quartz & Co., 2013). 2.5 Priority Status China’s offshore wind industry has also recently been boosted by the announcement in February 2013 that offshore wind has been given priority status by the NDRC. This affirms the government’s commitment to supporting the sector and should result in preferential policies and incentive mechanisms for the industry, as well as better access to funding and faster consenting approval. With equipment manufacturing also explicitly identified in the priority list, the entire offshore wind supply chain can expect to benefit (Quartz & Co., 2013). Importantly, increased support is also expected to result in more favourable FITs to project developers. 2.6 Health and Safety Despite the offshore wind regulations formulated thus far, very little attention has been paid to health and safety (H&S). China has a relatively poor health and safety record within the wind industry. In 2012, eight deaths out of a global total of 12 in the wind industry (both on and offshore) occurred in China (Wind Power Monthly, 2013b). There is a perception that manufacturers are generally unwilling to reveal their H&S track records or collaborate on H&S issues (Wind Power Monthly, 2012). In response to this globally poor record, the Chinese government has been perceived as pushing health and safety standards to improve the country’s reputation (Wind Power Monthly, 2013b). Turbine manufacturers with international connections also recognise the need for a sound H&S record. Goldwind has invested over CNY 7 million in its safety programmes in China and as of the beginning of 2012, and claims that it has not experienced any major injuries since certifying its management safety systems in 2010 (Wind Power Monthly, 2012).
Detailed appraisal of the offshore wind industry in China                                                    25

Financing
As indicated in previous sections of the report, project costs are one of major barriers to scaling up the
deployment of offshore wind in China. The investment cost per MW of offshore wind farms in China is
estimated to be 1.5-3 times of the same scale onshore wind farms (Hong & Moller, 2012), at around CNY
14,000-19,000/kW (IEA, 2011). For developers to make sufficient returns on their investment (typical
benchmark = ~8% IRR), a competitive feed-in-tariff is therefore necessary. The IEA suggests that a
reasonable tariff for offshore wind power should be at least CNY 0.30/kWh higher than for coal power,
because offshore wind turbines and construction can be much more expensive than for land-based projects
(IEA, 2011). However, the FITs established for the initial concession projects (ranging from CNY 0.6235-
0.737/kwh) have been deemed too low for developers to make profits.

In July 2012, NEA commissioned China Renewable Energy Engineering Institute (CREEI) to conduct policy
research on an offshore wind FIT. CREEI recommended “a stable benchmark FIT mode,” which would set
different FITs for different groups of areas whose wind resources and construction conditions are different,
which is the same practice employed for the onshore wind industry. However, no timeline has been set for
the announcement of offshore wind tariffs and, according to a Carbon Trust interview with the National
Renewable Energy Research Centre of China, better utilization of onshore wind seems a more imminent
priority for NDRC.

Even the Donghai Bridge Project, which benefitted from Certified Emission Credits (CER) under the Clean
Development Mechanism (CDM) and has a FIT of CNY 0.978/kwh, is only marginally above the industry
benchmark at 10% IRR. Without the CER income it has been estimated that the actual IRR could be just 4.5%
(Yu & Zheng, 2011). Considering that the initial concession projects in Jiangsu have FITs ~30% lower than
this, it is clear that they will struggle to achieve any financial return, and the result of insufficient financial
resources is the long-term delay of offshore wind farm constructions, which has been evident in these
projects. Indeed, Hong & Moller (2012) expect that under the current pricing mechanism only 40-70% of the
national 2020 target will be achieved (Hong & Moller, 2012).

In order to overcome this issue, the NEA has given permission to the four projects to apply for new FITs
(Takung, 2013), although they are unlikely to obtain the CNY 1.0/kwh FIT industry expects is necessary to
make profits on these early offshore wind projects (Wind Power Monthly, 2013). For example, China Datang
has applied for an increase of FIT from 0.737 to 0.860 CNY per kWh.

The other motivation is to gain first-mover advantage in the nascent offshore wind market. Through gaining
first-hand experience of developing offshore wind projects, developers can progress up the learning curve
ahead of competitors, and place themselves in an advantageous position to win future concession tenders
and larger, more profitable offshore projects further down the line (Quartz & Co., 2013). Indeed, the industry
is expected to benefit from this approach as the cost of offshore wind development in China is expected to
decrease over time, becoming more cost effective as the industry matures and reaches critical mass. For
example, the IEA (2011) expect that investment costs will decrease to CNY 14000/kw in 2020, CNY 12000/kw
in 2030, and CNY 10000/kw in 2050 (fig.3.0.1). Together with reduced O&M costs, the level of FIT required
will also decrease significantly for near-offshore sites. However, cost reduction through both innovation and
learning-by-doing will be integral to this.
Detailed appraisal of the offshore wind industry in China                                                   26

Fig.3.0.1. Expected investment costs and feed-in tariffs of typical wind farms in China (2010 prices)

Source: IEA (2011).

As state-owned enterprises (SOEs), developers benefit from low-cost financing from China’s banking sector,
particularly through low-interest non-recourse loans. Furthermore, the Chinese Development Bank (CDB)
specifically supports the renewable energy sector through its lending, and provincial governments have also
been known to support local renewable energy manufacturers (Innovation Norway, 2013). However, Yu &
Zheng note that the motivation to invest is not necessarily for profit, but to comply with government targets
(Yu & Zheng, 2011). Development of offshore wind in China is mostly conducted by state-owned power
companies that are financed by state-owned banks like China Development Bank. Thus the offshore wind
industry may be operating less on a market basis but as a centrally planned economy. The level of financing
available for SOEs is thought to be sufficient for the next 2-3 years; however, with EUR 120 billion required to
construct 30 GW of offshore wind power, more investment will be required from additional sources (Quartz
& Co., 2013). Increasing the profitability of offshore projects will encourage investment, while collaboration
with foreign companies could also bring in additional revenue.
Detailed appraisal of the offshore wind industry in China                                                                                             27

Wind Farm Developers
4.1 Overview
Offshore wind development in China is largely monopolised by a handful of state-owned utilities, most of which
have existing experience from the onshore wind and oil and gas industries. Given the significant investment
required and, thus far, limited opportunities for commercial returns, it is unsurprising that offshore wind
development is dominated by around 8 cash-rich SOEs (fig.4.1.1), which also benefit from significant support
from the Chinese Development Bank (CBD). In addition to the aspiration to get a foothold in one of China’s
prioritised industries, with a view to making long-term financial returns, state utilities are also bound by
legislation under the Renewable Energy Law (REL) to source at least 3% of their energy from non-hydro
renewable source; which will increase to 8% in 2020. China Longyuan Power Group, a subsidiary of China
Guodian Corporation and the largest onshore wind power producer in China, leads the market by some distance,
both in terms of current and planned capacity; and, together, these 8 utilities have cumulatively installed 98% of
current capacity, with 5.0 GW already consented and an additional 12.3 GW in the pipeline (fig.4.1.1). Assuming a
cost of CNY 13 million per MW installed capacity,1 total investment in the industry from these top 8 developers
can be expected to be in the order of CNY 233 billion to develop these projects (table.4.1.1).

Fig.4.1.1. Capacity for offshore wind developers
                         6000

                         5000

                         4000
     Capacity (MW)

                         3000

                         2000

                         1000

                             0
                                   China                                                       China
                                                             China           China                             China                             China
                                 Longyuan   China Three                                      National                          Shenhua
                                                            Datang         Guangdong                          Huadian                           Huaneng
                                  Power       Gorges                                        Offshore Oil                        Group
                                                          Corporation       Nuclear                            Group                             Group
                                   Group                                                    Corporation
                     Installed     238         208             102              102               2                0               0                6
                     Consented    1999         606             708              552             402              348              302              804
                     Pipeline     5450         296             700             1301             800             1700             1602              500

*Where developers have partnered on a project, capacity has been counted against each participating developer.

Source: www.4coffshore.com; Carbon Trust analysis.
1   Based on typical cost of £1.2m/MW to £1.5m/MW for UK Round 1 and 2 projects and China Longyuan investing EUR 1.6 bn to install 1 GW (Quartz & Co., 2013).
Detailed appraisal of the offshore wind industry in China 28
Table.4.1.1. China’s top 8 offshore wind developers.
Company
Total planned
Developer turnover (EUR Comments
capacity
millions)
China Longyuan Power Group 7.7 GW 2,075 Plans to use 20% of all equity‐raised money to develop
(China Guodian Corporation) offshore wind projects (recently raised EUR 291 million).
China Three Gorges 1.1 GW N/A No official targets; but considered one of the most
financially secure utilities in China, with significant cash
reserves.
China Datang Corporation 1.5 GW 526 Plans to invest EUR 7.4 billion in offshore wind projects.
China Guangdong Nuclear 2.0 GW N/A
China National Offshore Oil 1.2 GW 21,568 Received EUR 1.7 billion from the Chinese government
Corporation (CNOOC) to develop a 1 GW offshore wind farm in Bohai Bay.
China Huadian Group 2.0 GW 262 Plans to invest EUR 738 million in Jiangsu province
alone.
Shenhua Group 1.9 GW 14,724
China Huaneng Group 1.3 GW N/A
TOTAL 17.9 GW
Source: www.4coffshore.com; Quartz & Co (2013).
Chinese developers have also been keen to establish partnership in various parts of the supply chain,
particularly with wind turbine manufacturers. To date, given the industry’s nascent level of maturity,
projects have been developed using make-shift equipment, particularly regarding vessels and installation
equipment. Building and developing a strong supply chain dedicated to offshore wind development is
therefore clearly advantageous for developers and partnering with suppliers in the bidding process can
strengthen their position when seeking to win new project sites. For example, MingYang has partnered with
Guangdong Nuclear Power Group, Huadian Group, and Huaneng Group respectively with plans to co-develop
a series of projects using MingYang’s 6 MW turbines (4coffshore, 2013).
While, but for a few examples, developers in China tend to operate individually, one joint collaboration with
multiple stakeholders has emerged in the industry, similar to those evident in Europe. The South Offshore
Wind Joint Development is a joint venture consisting of nine enterprises which aims to de-risk project
development and attract higher levels of investment, as well as bringing together players from different
parts of the supply chain (Quartz & Co., 2013). The collaboration, which includes China South Power Grid
(grid operator), Guangdong Yudean Group (power utility), and MingYang (WTG) – though none of the big eight
– has had consent approved for a 198 MW project in Guangdong province, which started construction in May
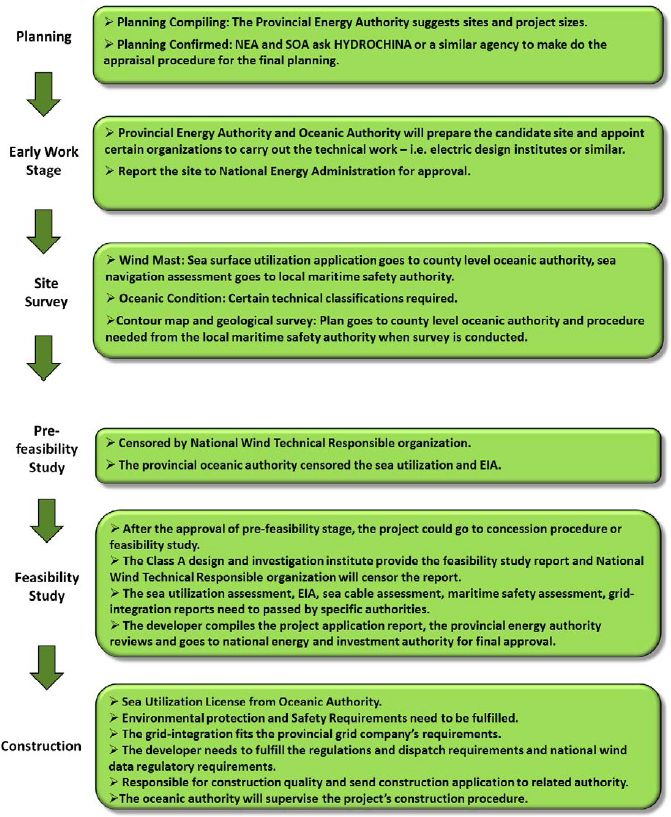
2013 (4coffshore, 2013).Detailed appraisal of the offshore wind industry in China 29 4.2 Project Consenting Process Because each province in China has its own master plan for developing offshore wind power, developers usually go to provincial energy administrations and local governments to find out available projects and sign the agreement with them to start preliminary development work. The provincial plans are drafted by appointed investigation and design institutes, and then compiled into the national plan by the Water Resources and Hydropower Planning and Design General Institute, on behalf of NEA. A total of 38 projects, with cumulative capacity of 16.5 GW, are currently performing preparation work. Although there is no standard practice, wind resource, grid connection and construction conditions are primary factors for developers to consider when evaluating a potential project. Construction conditions is a broad term used by Chinese developers to refers to considerations of traffic, fishery, marine geology, facilities available and construction company's capabilities. In China's first round of concession bidding, developers had to team up with design institutes, turbine suppliers and construction companies before being eligible to submit a bid. Due to the limited experience in offshore wind in China, developers usually take for reference the practices of Shanghai Donghai Bridge demo project and Longyuan Rudong Intertidal demo project. It usually takes at least 2 years to obtain full consent from the government to build an offshore wind farm, involving a complex and lengthy process of obtaining approvals from many different administrative departments (fig.4.2.1). Developers will need to obtain approvals from the oceanic administration, maritime safety administration, fisheries, environmental protection department, and military. Before they can proceed to make the final application to NEA, they still need to ask for State Grid's consent to ensure grid connection. In May 2013, the NEA extended the authority to approve offshore wind project to provincial governments in an effort to endorse the prime minister’s call for “reducing central government’s consenting rights” and reduce the timeline to gain consenting approval (cnwpem, 2013). However, Carbon Trust interviews with industry suggest that a lack of implementation guidance to local authorities means that the provinces are unable to properly assess the projects; thus, the consenting process has changed little with central government still taking control of offshore wind development. Concessions are allocated typically for a 25-year period, and provincial grid companies are required to sign a power purchase agreement (PPA) with successful bidders. The price at which electricity is delivered to the grid is fixed during an initial period, typically about 10 years, at a level set during the initial bidding process, with the price in subsequent years expected to adjust to the prevailing electricity market price in the region served by the grid (Xiliang et al., 2012).
You can also read