Green Economy and Green Jobs in China - worldwatch report 185 - Current Status and Potentials for 2020
←
→
Page content transcription
If your browser does not render page correctly, please read the page content below

worldwatch report 185

   Green Economy and
   Green Jobs in China

       Current Status and
       Potentials for 2020

jiahua pan, haibing ma, and ying zhang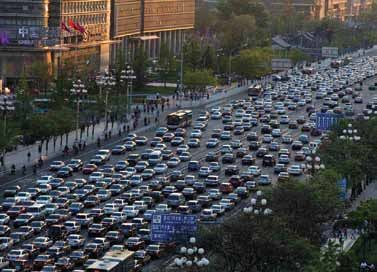
worldwatch report 185

     Green Economy and
     Green Jobs in China:
Current Status and Potentials for 2020

        jiahua pan, haibing ma,
            and ying zhang
           lisa mast ny, e d i to r

        wor l dwatch i n st i t u te
© Worldwatch Institute, 2011
                                       Washington, D.C.
                                    ISBN 978-0-9835437-0-1

                    Printed on paper that is 50 percent recycled, 30 percent
                          post-consumer waste, process chlorine free.

              The views expressed are those of the author and do not necessarily
         represent those of the Worldwatch Institute; of its directors, officers, or staff;
                                or of its funding organizations.

On the cover: Chinese workers install a wind turbine at Chicheng Wind Farm in Hebei province.
                           Photograph © Simon Lim/Greenpeace

  Reprint and copyright information for one-time academic use of this material is available
by contacting Customer Service, Copyright Clearance Center, at +1 978-750-8400 (phone) or
+1 978-750-4744 (fax), or by writing to CCC, 222 Rosewood Drive, Danvers, MA 01923, USA.
   Nonacademic and commercial users should contact the Worldwatch Institute’s Business
 Development Department by fax at +1 202-296-7365 or by email at wwpub@worldwatch.org.
                   The report is also available at www.worldwatch.org.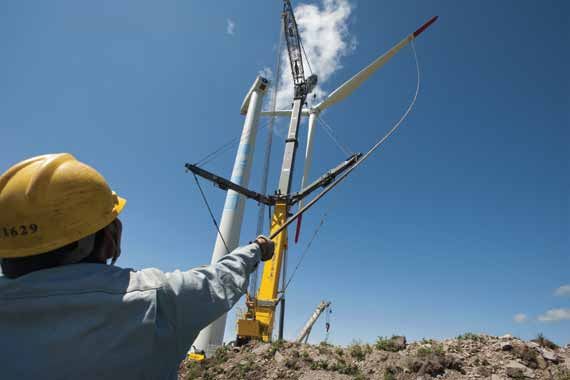
Table of Contents

Summary. .  .  .  .  .  .  .  .  .  .  .  .  .  .  .  .  .  .  .  .  .  .  .  .  .  .  .  .  .  .  .  .  .  .  .  .  .  .  .  .  .  .  .  .  .  .  .  .  .  .  .  .  .  .  .  .  .  .  .  .  .  .  .  .  . 5
China’s Shift to a Green Economy. .  .  .  .  .  .  .  .  .  .  .  .  .  .  .  .  .  .  .  .  .  .  .  .  .  .  .  .  .  .  .  .  .  .  .  .  .  .  .  .  .  .  .  .  . 7
Greening the Energy Supply. .  .  .  .  .  .  .  .  .  .  .  .  .  .  .  .  .  .  .  .  .  .  .  .  .  .  .  .  .  .  .  .  .  .  .  .  .  .  .  .  .  .  .  .  .  .  .  .  .  . 10
Greening Transportation . .  .  .  .  .  .  .  .  .  .  .  .  .  .  .  .  .  .  .  .  .  .  .  .  .  .  .  .  .  .  .  .  .  .  .  .  .  .  .  .  .  .  .  .  .  .  .  .  .  .  .  . 16
Greening the Forestry Sector. .  .  .  .  .  .  .  .  .  .  .  .  .  .  .  .  .  .  .  .  .  .  .  .  .  .  .  .  .  .  .  .  .  .  .  .  .  .  .  .  .  .  .  .  .  .  .  .  . 20
Accelerating China’s Green Transition . .  .  .  .  .  .  .  .  .  .  .  .  .  .  .  .  .  .  .  .  .  .  .  .  .  .  .  .  .  .  .  .  .  .  .  .  .  .  .  .  . 25
Endnotes. .  .  .  .  .  .  .  .  .  .  .  .  .  .  .  .  .  .  .  .  .  .  .  .  .  .  .  .  .  .  .  .  .  .  .  .  .  .  .  .  .  .  .  .  .  .  .  .  .  .  .  .  .  .  .  .  .  .  .  .  .  .  .  .  . 28
Index. .  .  .  .  .  .  .  .  .  .  .  .  .  .  .  .  .  .  .  .  .  .  .  .  .  .  .  .  .  .  .  .  .  .  .  .  .  .  .  .  .  .  .  .  .  .  .  .  .  .  .  .  .  .  .  .  .  .  .  .  .  .  .  .  .  .  .  . 34

Figures and Tables
Figure 1. China’s Electricity Mix, 2010 and Projections for 2020. .  .  .  .  .  .  .  .  .  .  .  .  .  .  .  .  .  .  .  .  . 10
Figure 2. China’s Installed Solar Hot Water Capacity, 1997–2009. .  .  .  .  .  .  .  .  .  .  .  .  .  .  .  .  .  .  .  . 11
Figure 3. Map of Solar Radiation Intensity in China. .  .  .  .  .  .  .  .  .  .  .  .  .  .  .  .  .  .  .  .  .  .  .  .  .  .  .  .  .  .  . 12
Figure 4. China’s Installed Solar Photovoltaic Capacity, 1990–2009. .  .  .  .  .  .  .  .  .  .  .  .  .  .  .  .  .  . 13
Figure 5. China’s Installed Wind Power Capacity, 1997–2010 . .  .  .  .  .  .  .  .  .  .  .  .  .  .  .  .  .  .  .  .  .  .  . 14
Figure 6. Economic Output of China’s Forestry Sector, 2006–10. .  .  .  .  .  .  .  .  .  .  .  .  .  .  .  .  .  .  .  . 20
Figure 7. Annual Forestation Area in China, 1953–2008. .  .  .  .  .  .  .  .  .  .  .  .  .  .  .  .  .  .  .  .  .  .  .  .  .  .  .  . 21
Figure 8. Jobs and Revenue from Forest Park Tourism in China, 1998–2008. .  .  .  .  .  .  .  .  .  .  . 24

Table 1. Employment and Sales in China’s Solar Photovoltaic Manufacturing Industry,
   2005–07 . .  .  .  .  .  .  .  .  .  .  .  .  .  .  .  .  .  .  .  .  .  .  .  .  .  .  .  .  .  .  .  .  .  .  .  .  .  .  .  .  .  .  .  .  .  .  .  .  .  .  .  .  .  .  .  .  .  .  .  .  .  . 13
Table 2. China’s Installed Solar Photovoltaic Capacity, Targets and Actual Capacity,
   2006–20. .  .  .  .  .  .  .  .  .  .  .  .  .  .  .  .  .  .  .  .  .  .  .  .  .  .  .  .  .  .  .  .  .  .  .  .  .  .  .  .  .  .  .  .  .  .  .  .  .  .  .  .  .  .  .  .  .  .  .  .  .  . 14
Table 3. Employment in China’s Wind Power Industry, 2006–10. .  .  .  .  .  .  .  .  .  .  .  .  .  .  .  .  .  .  .  .  . 15
Table 4. China’s Wind Turbine Manufacturing and Job Creation, 2006–10. .  .  .  .  .  .  .  .  .  .  .  .  . 15
Table 5. Job Creation Potentials in Beijing’s Urban Rail Transit, 2011–20. .  .  .  .  .  .  .  .  .  .  .  .  .  . 19
Table 6. Job Creation from Forestation Activities in China, 2005–08 . .  .  .  .  .  .  .  .  .  .  .  .  .  .  .  .  . 22
Table 7. Job Creation from Forest Management in China, 2005–10. .  .  .  .  .  .  .  .  .  .  .  .  .  .  .  .  .  .  . 23

Acknowledgments

      This report was written collaboratively by the Worldwatch Institute and the Institute for Urban & Envi-
      ronmental Studies (IUE) at the Chinese Academy of Social Sciences (CASS). The lead authors were
      Haibing Ma with Worldwatch and Dr. Jiahua Pan and Dr. Ying Zhang with CASS, with important addi-
      tional contributions from Dr. Yang Zheng, Dr. Mou Wang, Mr. Changyi Liu, Ms. Mengmei Chen, and
      Mr. Bin Zhang. The report also benefited greatly from the comments and recommendations of numer-
      ous experts on China’s green economy, with special thanks going to Professor Chenguang Pan (CASS),
      Dr. Shifa Ke (Beijing Forestry University), and Dr. Anhua Zhang for their careful review of early drafts.
         At Worldwatch, we extend our appreciation to Christopher Flavin for his insightful comments in the
      early stages of the report. Robert Engelman served as internal reviewer and helped to enhance both the
      messages of the report and the way they were presented. We are also grateful for the committed support
      of Director of Institutional Relations Mary C. Redfern, Senior Editor Lisa Mastny, Director of Publica-
      tions and Marketing Patricia Shyne, and Communications Director Russell Simon. The design and lay-
      out were completed skillfully by designer Lyle Rosbotham.
         Finally, we are indebted to the Ministry for Foreign Affairs of Finland for its generous support of this
      project. It was a pleasure to work with the Ministry on this initiative.

                                             About the Authors

      Jiahua Pan is Deputy Director of the Institute for Urban & Environmental Studies at the Chinese Acad-
      emy of Social Sciences (CASS). His research interests include the economic and social dimensions of
      sustainable development, energy and development, climate policy, and the economics of the environ-
      ment and natural resources. Dr. Pan has also worked for the United Nations Development Programme’s
      Beijing Office as an advisor on environment and development. He is a lead author of the IPCC Work-
      ing Group III Third and Fourth Assessment Reports on Mitigation. He is also a member of the China
      National Expert Panel on Climate Change, an advisor to the China State Environmental Protection
      Administration, and serves as Vice President of the Chinese Society of Ecological Economists. Dr. Pan
      received his PhD at Cambridge University in 1992 and is the author of 150 papers and articles in aca-
      demic journals, magazines, and newspapers in English or Chinese.

      Haibing Ma is China Program Manager at the Worldwatch Institute. His priority research and manage-
      ment areas at Worldwatch are clean energy and climate change, including an initiative to explore green
      economy potentials and impacts in China. Ma is the main point of contact between the Institute and
      key stakeholders in China, including energy and climate officials and industry experts. Before coming to
      Worldwatch, Ma was an International Policy Associate at the Center for Clean Air Policy (CCAP), where
      he was involved in developing mitigation scenarios and implementation plans for China’s electricity,
      iron and steel, and cement sectors; power-sector modeling; and drafting a low-carbon development plan
      for the transportation sector. Ma holds a B.A. in Public Administration from Zhejiang University in
      China and an M.A. in Public Policy Analysis from Beijing University.

      Ying Zhang is a post-doctoral scholar at the Institute for Urban & Environmental Studies at the Chinese
      Academy of Social Sciences (CASS). She is also a research fellow with Research Center of Sustainable
      Development at the Joint Laboratory of CASS and CMA in Climate Change Economics Simulation. Dr.
      Zhang’s main research interests include modeling work in climate change economics, quantitative eco-
      nomics, low-carbon development, and environmental economics. She received her doctoral and master’s
      degrees in Economics at the Institute of Quantitative and Technical Economics at CASS, and earned B.A.
      and B.S. degrees in Economics and Applied Math from Wuhan University.

4   Green Economy and Green Jobs in China                                                     w w w. w o r l dwatch.org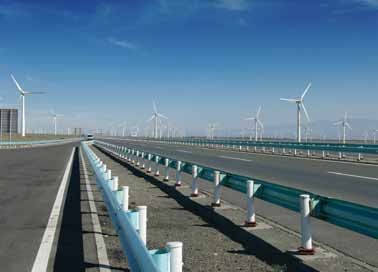
Summary

O
               ver the past decade, and especially
               during the 11th Five-Year period
               of 2006–10, China has prioritized
               green development in almost all of
its leading economic sectors. One of the greatest
promises of China’s green transition is the poten-
tial for expanded employment in industries and
economic sectors that can help slow and possibly
reduce the country’s environmental impact. This
report explores greening activities in three lead-
ing sectors of China’s economy: energy, trans-
portation, and forestry. In doing so, it aims to
shed light on the current scale of investment and
employment in these sectors and to offer esti-

                                                                                                                © btrenke
mates of potentials for 2020.
    China’s energy sector is heavily dependent on     Divided highway and wind farm in Xinjiang province.
coal. Increasing the share of renewable energy in
the country’s energy mix would contribute signif-
icantly to reducing emissions and play a vital role   Even factoring in increased productivity, China’s
in greening the energy supply. This report focuses    wind power development between 2011 and
on economic and employment prospects in three         2020 is projected to generate some 34,000 green
renewable energy sectors that are advancing rap-      jobs annually on average.
idly in China: solar hot water, solar photovoltaics       Formerly the “kingdom of bicycles,” China is
(PV), and wind power.                                 expected to add as many as 220 million new vehi-
    During the 11th Five-Year Period (2006–10),       cles between now and 2020. This report focuses
China’s solar PV power sector generated some          on economic and employment prospects in three
2,700 direct jobs and 6,500 indirect jobs annu-       green transportation subsectors: China’s alter-
ally, on average. This is projected to increase to    native-fuel vehicle industry (the development of
an average of 6,680 direct jobs and 16,370 indi-      hybrid cars and electric cars), the high-speed rail
rect jobs annually between 2011 and 2020. Given       sector, and urban rail in Beijing.
the rapid growth in China’s solar industry and            Despite its relative newness, the Chinese mar-
potential upward revisions in government projec-      ket for alternatively fueled vehicles is expanding
tions, these estimates for future green jobs could    rapidly. By mid-2010, China was home to some
increase considerably in the coming years.            5,000 such vehicles, with a combined distance
    China’s wind power industry—both the              of just over 81 million kilometers traveled. If the
power generation and turbine manufactur-              government continues to prioritize the develop-
ing sectors—created an average of 40,000 direct       ment of hybrid and electric vehicles during the
green jobs annually between 2006 and 2010.            2011–20 period, cumulative production could

www.worldwatch. o r g                                         Green Economy and Green Jobs in China         5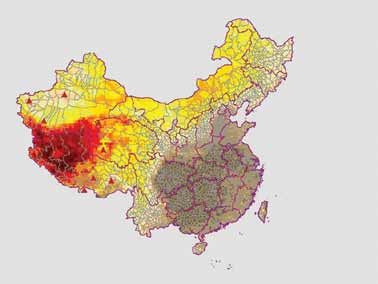
Summary
    reach 16.7 million, or an average of 1.67 million        China also has great potential to expand its
    vehicles annually. This would lead to the creation   niche sector of forest park tourism, as the coun-
    of roughly 1.2 million green jobs annually in this   try is home to more than 2,000 forest parks
    sector, on average.                                  nationwide. We estimate that by 2020, this rela-
       Already a world leader in high-speed rail         tively new green sector could provide 392,000
    (HSR) development, China aims to have 18,000         direct jobs and 607,000 indirect jobs, or nearly 1
    kilometers of HSR by 2020, which would create        million green jobs in total.
    an average of 230,000 direct and 400,000 indirect        Due to the different methodologies used to
    jobs annually during the 2011–20 period, or a        derive green jobs estimates in this report, it may
    total of 630,000 jobs annually.                      not be appropriate to simply add these estimates
       As one of the most populated cities in the        together to derive an overall green jobs figure for
    world and still growing, Beijing’s municipal         China. It can be stated with confidence, however,
    government has stepped up its urban rail ambi-       that the three sectors highlighted in the report—
    tions in recent years. Its current targets include   energy, transportation, and forestry—could
    completion of 660 kilometers of lines by 2015 (at    provide at least 4.5 million green jobs in 2020. If
    a total investment of $77 billion) and construc-     these sectors continue their rapid expansion, and
    tion of another 340 kilometers of lines during       if similar estimates could be obtained for other
    2016–20 (at a total investment of $69 billion).      emerging green sectors in China, it would be
    This could bring more than 437,000 jobs each         clear that the economy-wide potential for green
    year by 2020.                                        jobs is enormous.
       On the forest resources front, China’s for-           China has established a long-term green vision
    ests are home to more than 1,800 species of wild     and will almost certainly meet or surpass its
    animals, more than 2,000 tree species, and more      ambitious green economy goals. Yet vision alone
    than 6,000 species of bushes, hundreds of which      is not enough; attention also needs to be paid
    are found only in China. Nourishing these for-       to the actual steps being taken to achieve those
    ested areas is vital for sustaining the country’s    goals. One of the greatest lessons to be learned
    green transition. This report focuses on eco-        from the early days of China’s green transition is
    nomic and employment prospects in three non-         that building a sustainable future requires using
    timber forestry subsectors: forestation, forest      approaches and processes that are sustainable in
    management, and forest tourism.                      practice as well. To achieve that goal, the Chinese
       Although China does not have abundant for-        government needs to enhance its administra-
    est resources, government-led forestation efforts    tive efficiency and to adopt new market-based
    have led to an impressive expansion in nation-       approaches to create a supportive yet stable envi-
    wide forest cover. Based on our estimation, the      ronment for nourishing the green economy.
    forestation sector employed as many as 1.8 mil-          This report represents the most thorough
    lion full-time workers in 2010 alone, or an aver-    effort known to date to explore China’s green
    age of 1.6 million workers annually during the       economy and green jobs potentials. In the future,
    2005–10 period. To achieve its 2020 goals, Chi-      the availability of more comprehensive and more
    na’s forestation activities could offer as many as   reliable data will allow for an expansion and
    1.1 million direct and indirect jobs annually dur-   deepening of this effort, enabling Chinese policy-
    ing 2011–20. Managing the newly added forest         makers and other stakeholders to better under-
    area during this period would bring another          stand the options that are available to them in
    1 million jobs.                                      pursuing an effective green transition.

6   Green Economy and Green Jobs in China                                             w w w. w o r l dwatch.org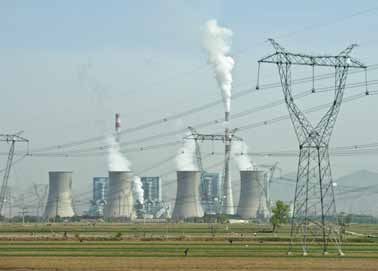
China’s Shift to a
                       Green Economy

C
            hina is in the early stages of a poten-        jobs.” † But it also reflects the need to address seri-
            tially earthshaking transition. The            ous environmental problems that have resulted
            Chinese government recognizes that             from decades of rapid economic development.
            “greening” the economy is an emerging          China’s gross domestic product (GDP) has grown
global aspiration and has embraced the strategic           by an average of 10 percent annually during the
goal of boosting the country’s economic growth             last three decades—among the fastest rates in the
while also enhancing environmental protection.             world.4 During the second quarter of 2010, China
Top Chinese political leaders have emphasized              passed Japan to become the world’s second larg-
on many occasions that their country is commit-            est economy.5 The rapid industrial development
ted to a green development path that is based on           required for this growth has left a heavy environ-
improved efficiency of energy and water use, shifts        mental toll.
to renewable energy, and other critical steps.                 Since the 1980s, China has been plagued by
    At the 17th National Congress of the Chinese           worsening air pollution from coal burning and
Communist Party in 2007, President Hu Jin-                 other industrial sources. From the late 1990s to
tao stated that “implementation of the scientific          the mid-2000s, more than 60 percent of Chinese
concept of development must rely on compre-                cities, home to two-thirds of the country’s urban
hensive, coordinated, and sustainable develop-             population, failed to meet the national Environ-
ment.”1* At other high-level occasions, includ-            mental and Air Quality Standard.6 In 2008, the
ing the 2010 APEC Summit in Yokohama, Japan,               World Health Organization listed seven Chinese
President Hu affirmed that China seeks to trans-           cities, including the capital city Beijing, as among
form its growth pattern and to engage in greener,          the “10 most polluted places” in the world.7 The
more sustainable development.2 Vice Premier Li             Chinese Academy of Social Sciences has esti-
Keqiang has similarly noted that China “must               mated that air pollution accounts for as much
nurture and strengthen a green economy, pro-               as 16 percent of the economic toll caused by the
mote green development,” and foster the neces-             country’s environmental problems.8
sary institutional arrangements to create both                 Chinese greenhouse gas emissions are rising
policy incentives and standards for doing so.3             rapidly as well. In 2006, China passed the United
    China’s shift to a greener economy provides an         States to become the world’s largest emitter of
opportunity to create new pathways for economic            carbon dioxide (CO2) from industrial sources,
growth, including through the creation of “green           primarily from fossil fuel combustion.9 Roughly
                                                           80 percent of Chinese CO2 emissions are from
                                                           the burning of coal for power generation and
* Endnotes are grouped by section and begin on page 28.
†                                                          other uses.10 One of the dirtiest fossil fuels, coal
  The terms “green economy” and “green jobs” have never
been well or precisely defined. For the purposes of this   accounts for nearly 70 percent of China’s total
report, a green economy refers to an economy that has      energy consumption and was the source of
made a significant shift toward producing economic value   80 percent of the country’s power generation
with less environmental impact; green jobs are jobs that
are brought into being entirely or largely through this    between 2002 and 2008.11
transformative economic process.                               Rapid industrialization has polluted China’s

www.worldwatch. o r g                                               Green Economy and Green Jobs in China            7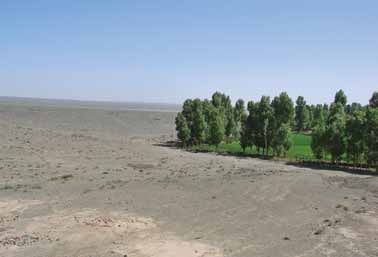
China’s Shift to a Green Economy
                               water resources. By 2005, some 59 percent of the                of China’s economy have likewise taken a toll on
                               country’s rivers were considered undrinkable,                   wildlife in the country. China is currently home
                               based on the standard set by the State Environ-                 to 156 of the 640 endangered species listed in the
                               mental Protection Agency (SEPA).12 That same                    Convention on International Trade in Endan-
                               year, more than 70 percent of inland lakes and                  gered Species of Wild Fauna and Flora (CITES).18
                               water reserves were considered heavily polluted                 Meanwhile, an estimated 15–20 percent of high-
                               and one-quarter of underground aquifers were                    elevation plants nationwide are under threat due
                               deemed polluted, with more than half of urban                   to forest loss and reduced ecosystem function.19
                               aquifers heavily polluted.13 Severe water pollution                 Overall, SEPA estimates that environmen-
                               posed health risks to more than 360 million Chi-                tal damage cost China roughly 10 percent of
                               nese in 2005.14                                                 its GDP in 2005.20 Analysts have suggested that
                                                                                               the country will need to spend at least 2 per-
                                                                                               cent of its GDP to clean up 30 years of industrial
                                                                                               waste.21 All of these environmental challenges
                                                                                               point to the need for a sweeping revision of
                                                                                               China’s development paradigm, a need now rec-
                                                                                               ognized by both the Communist Party and the
                                                                                               government that it directs.
                                                                                                   China is hardly the only country embracing
                                                                                               a green economy. Its neighbor to the east, South
                                                                                               Korea, stands out among several nations that
                                                                                               have begun to adopt “green growth” initiatives
                                                                                               or plans. Building on its success in developing
                                                                                               more eco-conscious technologies, in 2010 South
                                                                                               Korea launched a pathbreaking Green Growth
Kleineolive

                                                                                               Initiative that aims to transform the country
                                                                                               from a resource- and carbon-intensive economy
              Coal-fired power plant in Shuozhou, Shanxi province.                             to one based on the efficient use of energy and
                                                                                               resources. More than any other country in the
                                                                                               world, South Korea has elevated the attainment
                                   China’s rural environment and land-based                    of a green economy to the level of national strat-
                               ecosystems are also suffering. By 2008, heavy                   egy and launched a comprehensive institutional
                               metals, the bulk of them from industrial sources,               system for implementation.
                               were polluting one-fifth of the country’s arable                    South Korea’s green growth initiative pres-
                               land, reducing the grain yield by an average of                 ents valuable lessons for both China and the rest
                               10 million tons annually.15* With the reduction                 of the developing world. Led by president Lee
                               in arable land, China’s per capita grain stocks                 Myung-Bak, the strategy has gained broad pub-
                               dropped from 412 kilograms in 1998 to 334                       lic support, including from the major opposi-
                               kilograms in 2003.16 Between 1994 and 2009,                     tion party, and is being implemented through
                               the annual rate of desertification increased from               detailed and forceful legislation. Despite early
                               some 2,500 square kilometers to 3,500 square                    opposition from the steel and cement industries,
                               kilometers, costing the country an average of 54                the initiative has been largely embraced by South
                               billion yuan (US$8.3 billion) annually.17†                      Korea’s major companies. Firms such as Hyundai
                                   Human pressures and the explosive growth                    and Samsung have responded by creating their
                                                                                               own green growth strategies, including entering
                               * Units of measure throughout this report are metric un-        into new business areas such as solar and wind
                               less common usage dictates otherwise.                           power, electric vehicles, and zero-emission fac-
                               †
                                 All dollar and cent amounts are expressed in U.S. dollars.
                               Currencies in this report are converted at the rate of 1 U.S.   tories. The government has also created a Global
                               dollar = 6.5 Chinese yuan.                                      Green Growth Institute with the aim of scaling

                        8      Green Economy and Green Jobs in China                                                        w w w. w o r l d watch.org
China’s Shift to a Green Economy
up financial and technical support to help other surplus rural labor at more than 100 million
developing countries create their own green people.25 As agricultural productivity continues
growth strategies and policies. to rise and as China’s economy shifts away from
Although China’s strategy is not as compre- a labor-intensive model, rural unemployment is
hensive as South Korea’s, many Chinese policies expected to increase further. New job opportuni-
and actions—both ongoing and planned—are ties in China’s emerging green sectors will help
clearly in line with the green growth paradigm. relieve the social burden of unemployment in
Over the past decade, and especially during the more traditional economic sectors.
11th Five-Year planning period of 2006–10, China’s green economy plans are focused in
China has prioritized green development in three broad target areas: boosting the share of
almost all leading economic sectors. Efforts renewable energy in the country’s energy sup-
have been undertaken to boost energy efficiency ply; preserving and enhancing the country’s
in industry, transportation, and buildings; to natural assets, particularly forests; and embrac-
develop wind, solar, and other renewable energy ing new technologies to reduce the environ-
sources; to create a resource-saving “circular” mental impacts of traditionally “dirty” sectors.26
economy; and to transform traditional sectors But greening can and should occur in all sectors
through the use of energy-efficient and environ- of the economy. UNEP’s 2010 Green Economy
mentally sound technologies. Report, for example, focuses on initiatives being
Yet China’s green economy potential has taken worldwide in 11 sectors: agriculture, build-
barely been tapped. The United Nations Envi- ings, cities, energy, fisheries, forests, manufactur-
ronment Programme (UNEP) defines a green ing, tourism, transport, waste, and water.27
economy as one that “results in improved human The following analysis explores greening
well-being and social equity, while significantly activities in three leading sectors of China’s
reducing environmental risks and ecological scar- economy—energy, transportation, and for-
cities.”22 Although China should aim to meet all estry—covering activities in each of the three
of these goals, in practice it is clear that establish- target areas. These sectors are chosen both for
ing a green economy requires thinking more in their overall importance and because they offer
“shades of green” than in absolute terms. China the most data on environmentally sustainable
currently is in a transition period during which economic development in China. The report
new green sectors, such as renewable energy and sheds light on the current scale of investment
electric vehicles, co-exist with old “brown” indus- and employment in these sectors and also offers
tries, such as coal-based power. estimates of potentials for 2020.* In doing so,
One of the greatest promises of China’s green it provides the clearest picture to date of the
transition is the potential for expanded employ- implications of China’s green economy transi-
ment in industries and economic sectors that tion both for the world’s most populous coun-
promise to reduce or at least slow the country’s try and for the rest of the planet.
environmental impact. Often called “green jobs”
but ill-defined in practice, paid positions in such
industries and sectors are increasingly available to * Due to data availability, this report relies on a mix of
jobseekers in China. As elsewhere, such opportuni- methodologies to derive green jobs estimates for China.
Input-output models, which seek to capture direct and
ties are particularly important at a time of global indirect employment and to estimate net employment
economic uncertainty, when any job is an asset. impacts, are used to the extent possible, based on the
Although China’s official unemployment rate 2007 China Input-Output Table. For sectors not clearly
specified in the table, the report relies on industry surveys
has remained low—in urban areas, it has been or expert interviews. Calculations are generally based on
below 5 percent for more than two decades— a key underlying assumption, such as reaching a given
actual joblessness may be much higher.23 Accord- level of spending or achieving a specific policy goal (for
example, generating a certain share of the energy supply
ing to a report from the Chinese Academy of
from renewable sources by a target year). The methodolo-
Social Sciences, urban unemployment reached gies for each sectoral analysis are clarified in the endnotes
9.4 percent in 2008.24 Meanwhile, estimates put as necessary.
www.worldwatch. o r g Green Economy and Green Jobs in China 9Greening the
Energy Supply
C
hina’s energy sector is heavily depen- become the world’s largest energy consumer,
dent on coal, which emits more car- according to the International Energy Agency.5
bon dioxide into the atmosphere Although China aims to increase the share of
per unit of energy released than any renewable energy in its energy mix to 15 percent
other energy source. The country has vast coal by 2020, projections indicate that the country’s
reserves and relies on this fossil fuel for roughly total energy consumption will continue to rise
75 percent of its energy production and 68 per- and that coal will remain dominant. For instance,
cent of its energy consumption—much higher more than 60 percent of China’s electricity in
shares than in the rest of the world.1 Coal-fired 2020 is still expected to come from coal-fired
power generation accounted for at least 80 per- power plants.6 (See Figure 1.)
cent of the nation’s total electricity supply from Increasing the share of renewable energy
2002–08.2 sources—particularly wind and solar power—
Not surprisingly, coal also is responsible for would contribute significantly to emissions
roughly 80 percent of China’s carbon dioxide reductions and play a vital role in greening Chi-
emissions, with more than half of this coming na’s energy supply. According to the draft Devel-
from thermal power generation.3 In 2006, China opment Plan for Emerging New Energy Industry,
passed the United States to become the world’s China aims to invest some 5 trillion yuan ($770
largest emitter of industrial CO2.4 Coal is also an billion) in new energy-related sectors between
important contributor to air pollution, acid rain, 2011 and 2020.7 Of this, some 2–3 trillion yuan
and human health problems nationwide. ($308–462 billion) will be investments in renew-
In 2009, China passed the United States to able energy (excluding hydropower).8
Figure 1. China’s Electricity Mix, 2010 and Projections for 2020
2010 2020
Large
Large Hydropower
Hydropower 15.3%
14.6%
Nuclear 4.8%
Coal 2.4% Coal
73.0% 2.3% 67.4%
Natural Gas 4.3%
7.7%
Supply Gap 8.2%
Source: China Electric Power Research Institute
10 Green Economy and Green Jobs in China w w w. w o r l d watch.orgGreening the Energy Supply
A wide variety of approaches are available for
greening the energy supply, including the use of Figure 2. China’s Installed Solar Hot Water Capacity,
1997–2009
technologies such as carbon capture and stor-
200
age (CCS) to transform existing fossil fuel power Source: REN 21
generation. Due to data availability, however, this
report focuses on economic and employment
150
prospects in three renewable energy sectors that
Million Square Meters
Annual Addition
are advancing rapidly in China: solar hot water,
Cumulative Capacity
solar photovoltaics, and wind power.
100
Solar Hot Water
In a little over a decade, China has made unprec-
edented achievements in solar water heating. 50
Solar hot water accounted for half of the coun-
try’s total renewable energy use of 50 million tons
0
of coal equivalent (tce) in 2008, excluding large 1997 1999 2001 2003 2005 2007 2009
hydropower and traditional biomass.9 That year,
Chinese companies manufactured 31 million
square meters of solar water heaters, accounting cally and are also exported to Asia, Europe, and
for 76 percent of global production.10 Africa. Chinese manufacturers boast a remark-
In 2009, China added another 42 million able 90 percent of the global market for these
square meters of solar hot water, for a total of products.18
177 million square meters installed.11 (See Figure Although comprehensive data on solar hot
2.) This surpassed the national goal of 150 mil- water in China are lacking,* the 2010 Research
lion square meters by 2010 (as outlined in the Report on Development of China’s Solar Thermal
Medium-and-Long Term Development Plan for Industry provides projections for growth of the
Renewable Energy) and represented more than 80 solar thermal sector to 2020.19 According to the
percent of the world total.12 report’s medium scenario:
Solar water heating, together with other solar • Annual production of solar water heaters will
thermal applications such as solar cookstoves and reach 135 million square meters in 2015 and
solar houses, is expected to replace more than 50 273 million square meters in 2020;
million tce of China’s energy use annually.13 And • Annual production of solar water heaters will
there is significant potential for further growth. reach a nominal value of 180 billion yuan ($28
Estimates suggest that if just 20 percent of the billion) by 2015 and 380 billion yuan ($58 bil-
country’s roof area were devoted to solar water lion) by 2020;
heating systems, this would replace 340 million • Total installation of solar water heaters will
tons of coal, or 11.4 percent of China’s 2008 coal reach 400 million square meters in 2015 and
consumption.14 800 million square meters in 2020;
China is by far the world’s leading manu- • Annual exports of solar water heaters will reach
facturer of solar water heaters, with domestic $500 million by 2015 and $1 billion by 2020; and
production capacity topping 40 million square
meters in 2009.15 As of 2010, more than 2,000 * Rapid development of the solar heating industry and the
manufacturers of these systems were operating dispersive nature of installation and maintenance services
have prevented the creation of a sectorwide dataset for
at scale.16 China is positioning itself as the tech- solar hot water in China. Existing industry surveys do not
nology leader in this area. Annual production provide details on the methodology and datasets used,
of Chinese-developed vacuum-tube solar heat- and industrial associations and energy research institutes
ing systems, among the most advanced in the offer varying visions for future development. Because
the industry is primarily market-oriented, the Chinese
world, now exceeds 16 million square meters.17 government does not provide a detailed development plan
These systems are being used widely domesti- as it does for wind and solar photovoltaic.
www.worldwatch. o r g Green Economy and Green Jobs in China 11Greening the Energy Supply
• Solar thermal overall will account for 16 per- remains mostly at the demonstration stage, this
cent of total renewable energy consumption report focuses on solar PV manufacturing and
and 2 percent of total energy consumption power generation activities.
in 2020.
PV Manufacturing
Achieving these 2020 goals for solar water
heating would result in the replacement of some Since 2003, China’s solar photovoltaic manufac-
122 million tons of coal, equivalent to a reduc- turing industry has experienced rapid growth.
tion in CO2 emissions of 262 million tons.20 Domestic solar cell production reached 1.2 giga-
The employment effects of expanded solar watts (GW) in 2006, and in 2008 China overtook
water heating are less certain. So far, Chinese both Japan and Europe to become the largest PV
researchers and industry experts have not devel- manufacturer worldwide.23 With improvements
oped a reliable methodology to estimate potential in technology and newly added capacity for pro-
job creation in this sector because of the lack of ducing solar silicon materials, China is starting to
comprehensive data and continued uncertainty develop a comprehensive PV industry.24 By June
about the industry’s development path. 2008, the country was home to nearly 700 PV
manufacturing companies, of which roughly 40
Solar Photovoltaics
were focused on polysilicon materials, 70 on sili-
China is home to abundant solar resources, with con ingots, 40 on solar batteries, and more than
an annual usable capacity equivalent to 2.4 tril- 500 on PV components and other applications.25
lion tce.21 The most promising resources are In 2010, four out of the global top 10 solar PV
located in the country’s northwest, including in cell manufacturers were Chinese companies.26
Xizang, Qinghai, Xinjiang, Gansu, and Ningxia According to industry reports, China’s PV
provinces, and Inner Mongolia.22 (See Figure 3.) manufacturing industry had cumulative sales
Given the scale of this solar capital, there is sig- of 88 billion yuan ($13.5 billion) and employed
nificant potential for solar power to become an some 83,000 workers in 2007—up sharply from
important part of China’s energy mix. only 13 billion yuan ($2 billion) and 13,800
Generally speaking, there are two kinds of workers in 2005.27 (See Table 1.) Although more
solar power-generation technologies: solar pho- recent data are not available, it can be assumed
tovoltaic (PV) and solar thermal. Because the that both sales and employment have continued
latter is not yet commercialized in China and this strong growth.
Yet China’s photovoltaic manufacturing
industry faces great uncertainties, making it dif-
Figure 3. Map of Solar Radiation Intensity in China
ficult to predict future prospects. Slow develop-
ment of the country’s solar power generation
sector has stymied local demand for equip-
ment and led to the creation of a manufactur-
ing industry that is primarily export-oriented.
Overcapacity is also a concern. Since 2009, the
Kilowatt-hours per .
Square Meter per Day rapid growth in polysilicon manufacturing
worldwide has led to a global glut in both the
silicon supply and solar PV components. As a
result, the PV market is characterized by redun-
dant production capacity.
China alone had the capacity to produce more
than 70,000 tons of polysilicon in 2010, enough
to meet current global demand.28 In August 2009,
the government announced that it would estab-
Source: SWERA
lish new standards to regulate industry access
and slow rampant development in photovoltaic
12 Green Economy and Green Jobs in China w w w. w o r l dwatch.orgGreening the Energy Supply
manufacturing.29 As more countries worldwide
promote domestic renewable energy, however, Table 1. Employment and Sales in China’s Solar Photovoltaic
China’s export-oriented PV industry may face Manufacturing Industry, 2005–07
trade conflicts and other challenges that could . Employment .
(number of positions)
significantly affect the sector’s development.
Industry Subsector 2005 2006 2007
PV Power Generation
Components 2,700 9,000 25,000
PV power generation lags considerably behind
Silicon ingots/wafers 2,400 7,700 13,000
PV manufacturing in China. Whereas the coun-
try’s solar cell production increased more than Batteries 1,500 4,800 11,000
1,000 times between 1990 and 2007, the total Polysilicon 1,000 3,600 7,000
installed PV power capacity increased only 39 Systems engineering and .
2,000 2,600 3,000
times, starting from a very small base.30 China’s marketing services
installed solar PV generation capacity reached Special materials (glass, EVA, .
270 megawatts (MW) in 2009, with half of this 500 1,800 2,500
silver aluminum, etc.)
total installed that year.31 (See Figure 4.)
Balance components (inverter, .
Based on the total installed capacity for 2006– 500 1,000 1,500
battery, etc.)
10 and on projections for 2020 (see Table 2), it is
Lighting, garden lights, consumer.
possible to derive a rough estimate of job cre- 3,000 8,500 1,500
goods
ation in China’s PV power sector.32 Our estima-
tion shows that during the 11th Five-Year Period Research and development 300 500 800
(2006–10), the sector generated an average of
Total Employment 13,800 39,500 82,800
2,700 direct jobs and 6,500 indirect jobs annu-
ally.* This is projected to increase to an average of Total Industrial Sales (billion yuan) 12.8 43.3 88.2
6,680 direct jobs and 16,370 indirect jobs annually
Source: See Endnote 27 for this section.
between 2011 and 2020. Given the rapid growth
in China’s solar industry and potential upgrades
in government projections, estimates for future
green jobs could be much higher. Figure 4. China’s Installed Solar Photovoltaic Capacity,
1990–2009
Wind Power 300
Source: China Solar PV Report, ERI
Since the mid-1990s, and especially during
the 11th Five-Year Period (2006–10), China’s 250
Annual Addition
wind energy sector has expanded dramati- Cumulative Capacity
cally. The country invested more than 300 bil- 200
Megawatts
lion yuan ($46 billion) in 378 new wind energy
projects in 2010 alone.33 By the end of the year, 150
China’s grid-connected installed wind power
capacity reached 31 GW, second only to that of 100
the United States.34 If off-grid applications are
50
* Jobs here are defined as newly added one-year working
opportunities. Due to limitations with the input-output 0
method, estimates in this report capture only the employ- 1990 1997 2000 2002 2004 2005 2006 2007 2008 2009
ment opportunities created during the process of building
solar PV power generation facilities. The operation and
management share of potential employment is the subject included, this figure approaches 42 GW, making
of future studies. Direct jobs are jobs created directly in China the global leader in wind power develop-
the target sector; indirect jobs are positions created in
related sectors due to increased economic activity in the ment.35 (See Figure 5.)
target sector. China’s installed wind power capacity is
www.worldwatch. o r g Green Economy and Green Jobs in China 13Greening the Energy Supply
Wind Power Generation
Table 2. China’s Installed Solar Photovoltaic Capacity, Based on projections for China’s wind power
Targets and Actual Capacity, 2006–20 market, it is possible to estimate potential job
Annual Addition Cumulative Installed Capacity creation in the sector. Industry data indicate
Year Target Actual Target Actual
that for every megawatt of installed wind power
capacity, this requires the employment of 1.5–2
megawatts
full-time workers (defined as operations person-
2006 10 10 80 80 nel on wind farms).39 Assuming that this ratio
2007 20 26 100 106 continues to hold as installed capacity expands,
2008 40 34 140 140 this means that China’s wind power development
during 2006–10 resulted in the creation of some
2009 160 130 300 270
61,000 to 81,400 full-time positions.40 (See Table
2010 400 n/a 700 n/a
3.) In 2010 alone, China’s 16 GW of newly added
2020 — — 1,800 — wind power capacity created an estimated 24,000
Source: See Endnote 32 for this section. to 32,000 new jobs. We estimate that there may
be closer to 83,000 full-time employees working
on China’s 42 GW of installed wind turbines.
To meet its 2020 goal for wind power develop-
Figure 5. China’s Installed Wind Power Capacity,
1997–2010 ment of 120 GW, China will need to install an addi-
tional 78 GW of generation capacity between 2011
50
Source: NDRC, REN 21, IBT and 2020.41 This could result in as many as 66,000
new jobs over this period, or an average of 6,600
40 jobs annually.42 The actual number of green jobs in
Annual Addition
the sector could be far greater, however, because this
Cumulative Capacity
30 estimate represents only operations personnel on
Gigawatts
wind farms and does not include potential installa-
tion workers needed. Moreover, at the current pace
20 of wind development, China could achieve much
greater installed capacity by 2020.43
10 Using the available multipliers for indirect
employment, it can be estimated that China’s
wind power development generated an average
0
1997 1999 2001 2003 2005 2007 2009 of 32,000 indirect jobs annually between 2006
and 2010.44 The addition of 78 GW of capacity
between 2011 and 2020 would generate an aver-
expected to exceed 110 GW in 2015.36 According age of 30,000 indirect jobs annually in related
to the draft Development Plan for Emerging New sectors during this period.
Energy Industry, the country will invest up to 5
Wind Turbine Manufacturing
trillion yuan ($770 billion) in new energy-related
sectors during 2011–20, including an estimated China’s wind turbine manufacturing sector offers
1.5 trillion yuan ($231 billion) in wind power significant potential for green jobs as well. In
exclusively.37 2007, the average per-kilowatt price for a wind
This report focuses on economic and employ- turbine in China was 6,000–7,000 yuan ($924–
ment prospects in two subsectors of China’s 1,078).45 With increasing economies of scale, the
wind industry: power generation and equipment price dropped to roughly 4,000 yuan ($616) in
manufacturing.38 Additional subsectors, such as 2008 and even lower in 2010.46 Assuming an aver-
research and development (R&D), consulting, age turbine price of 6,500 yuan in 2006–07, 4,000
and other technical services, are not covered due yuan in 2008–10, and 3,500 yuan in 2011–20, it is
to limited data availability. possible to estimate the annual investment needs
14 Green Economy and Green Jobs in China w w w. w o r l dwatch.orgGreening the Energy Supply
For the 2011–20 period, based on the addition
Table 3. Employment in China’s Wind Power of 78 GW of wind capacity and assuming that 80
Industry, 2006–10 percent of equipment is produced domestically,
. Annual Addition to . an estimated 219 billion yuan will need to be
Year Installed Capacity Employment invested in China’s turbine manufacturing sector.
gigawatts positions created
This would lead to an average of 21,000 new jobs
created annually during this period.
2006 1.34 2,000–2,700
Using the available indirect employment
2007 3.4 5,200–6,900
multipliers, it can be estimated that China’s tur-
2008 6.1 9,200–12,200 bine manufacturing sector generated an average
2009 13.8 20,700–27,600 of 67,000 indirect jobs annually between 2006
2010 16.0 24,000–32,000 and 2010. Meeting the equipment demands of
Total an additional 78 GW of capacity by 2020 would
(2006–10) 40.7 61,000–81,400 require adding an average of 56,000 jobs annually
Source: See Endnote 40 for this section. to turbine manufacturing-related sectors.
In total, China’s wind power industry—both
the power generation and turbine manufactur-
and job creation in the country’s wind turbine ing sectors—created an average of 40,000 direct
industry.47 (See Table 4.) green jobs annually between 2006 and 2010. Even
Assuming that there was no significant change factoring in increased productivity, China’s wind
in China’s economic infrastructure, and assuming power development between 2011 and 2020 will
that the share of wind turbines produced domes- continue to generate an estimated 34,000 green
tically reached the government-mandated level of jobs annually on average. Although not all of
80 percent, the wind equipment manufacturing the indirect jobs associated with the wind power
sector generated an estimated 50,000 direct jobs industry can be considered green jobs, the sheer
in 2010. For the 2006–10 period, this total rises to scale of indirect employment—averaging 1 mil-
126,200 jobs. Due to the lack of reliable data on lion jobs annually for 2006–10 and 86,000 jobs
Chinese turbine exports, however, this green jobs annually for 2011–20—suggests that China’s
estimate does not capture the full employment massive wind development plans make an impor-
effect of China’s wind manufacturing industry. tant contribution to the overall economy.
Table 4. China’s Wind Turbine Manufacturing and Job Creation, 2006–10
. . Share of Turbines Turbine Capacity Investment . .
. Newly Installed Domestically Domestically . in Turbine Direct .
Year Turbine Capacity Produced Produced* Production Employment
gigawatts percent gigawatts billion yuan jobs created
2006 1.3 45 0.6 3.8 3,660
2007 3.3 58 1.9 12.4 12,010
2008 6.2 76 4.7 18.6 18,050
2009 13.8 80 11.0 44.2 42,850
2010 16.0 80 12.8 51.2 49,670
Total
(2006–10) 126,240
*Because some of China’s annual added turbine capacity is imported equipment, the table breaks out the portion of
capacity produced only by domestic manufacturers.
Source: See Endnote 47 for this section.
www.worldwatch. o r g Green Economy and Green Jobs in China 15Greening
Transportation
C
hina’s transportation sector, like its lars between now and 2020 to make the transpor-
energy sector, is undergoing a trans- tation sector more environmentally sustainable,
formation. As the average wealth of and it is adopting low-pollution strategies to both
Chinese citizens increases, the for- meet rising vehicle demand and improve public
mer “kingdom of bicycles” is experiencing a transport.
swell of motorization. In 2009, China overtook China’s rising interest in green transportation
the United States to become the world’s largest is in large part a response to the environmental
automotive market, home to some 170 million and social problems associated with the country’s
vehicles.1 The transportation sector now accounts rapid transition to a “car-and-truck” economy.
for just over one-tenth of China’s total primary Air pollution routinely cloaks many Chinese
energy consumption, although this remains well cities, and congestion of roads and highways is
below the U.S. transportation sector’s share of 28 becoming a painful fact of life. The most extreme
percent.2 As its vehicle volume continues to grow, illustration of this growing headache was a nearly
China’s energy consumption from transportation two-week traffic jam that occurred north of Bei-
will increase rapidly as well. jing in August 2010.4
Notably, this traffic jam was caused in part
by the country’s growing energy needs. In 2009,
after the Chinese government began implement-
ing coal industry reforms in Shanxi province,
China’s largest coal production base, Inner Mon-
golia became the alternative major coal supplier.
This geographical shift led to a dramatic increase
in heavy truck traffic along highways connecting
Inner Mongolia to Beijing, which were not pro-
jected to accommodate such an increase in fleet
volume until 2035.5
Although data on green transportation in
China are sparse, various analyses explore ele-
Australian cowboy
ments of this transition. Intercity and urban rail,
for example, have attracted tremendous invest-
ment in China and can be considered “green”
Traffic on Chang’an Avenue, Beijing. approaches when compared to fossil fuel-inten-
sive road and air transport. Between 2005 and
2008, investment in China’s intercity and urban
China is expected to add as many as 220 mil- rail industry jumped from 170 billion yuan ($26
lion new vehicles between now and 2020.3 Yet billion) to more than 530 billion yuan ($82 bil-
there is a green lining to this increasing mobility. lion).6 During that same period, the “green” share
The government plans to invest trillions of dol- of China’s overall transportation investment
16 Green Economy and Green Jobs in China w w w. w o r l dwatch.orgGreening Transportation
increased from 16.5 percent to 28 percent.7 electric, and fuel-cell vehicles—by 2012. To
Data on employment in China’s green trans- encourage rapid uptake, in 2009 and 2010 the
portation sector are similarly sparse, although government expanded the promotion of alterna-
estimates have been derived for certain sub- tive-fuel vehicles to private buyers and released
sectors. Assuming that intercity rail and urban a series of financial incentives for their purchase,
public transport (including urban rail as well as including a subsidy cap of 60,000 yuan ($9,200)
public buses) are green transportation options, per vehicle.14 As of October 2010, an estimated
then these sectors supported as many as 2.9 mil- 8.5 billion yuan ($1.3 billion) had been invested
lion green jobs in 2009, accounting for 62 per- in China’s electric vehicle industry through capi-
cent of total transport employment, according tal markets.15
to China’s 2010 Statistical Yearbook.8
This report focuses on economic and employ-
ment prospects in three green transportation
subsectors: China’s alternative-fuel vehicle indus-
try (the development of hybrid cars and electric
cars); the high-speed rail sector; and urban rail
in Beijing.
Alternative Fuel Vehicles
China is experiencing a boom in private vehicle
ownership. On average, the country’s vehicle fleet
increased 14.5 percent annually between 2000
and 2009.9 The number of private cars alone
more than doubled between 2005 and 2008.10
According to the China Association of Automo-
John Lloyd
bile Manufacturers, the country produced 18.3
million vehicles in 2010, and 18.1 million vehicles Brochure cover for the Benni Mini electric car.
were sold that year.11 As elsewhere, almost all cars
in China run on gasoline.
Despite its relative newness, the Chinese mar- Based on China’s total investment in devel-
ket for alternatively fueled vehicles is expanding oping and producing new energy vehicles, it is
rapidly. In January 2009, four government bod- possible to calculate potential job creation in this
ies* jointly initiated the “Ten Cities, One Thou- sector during the 2011–20 period.16 If the gov-
sand Vehicles” project to promote fuel-efficient ernment prioritizes the development of alterna-
and alternative-fuel vehicles. The goal is to deploy tive-fuel vehicles, then cumulative production of
an average of 1,000 hybrid and/or electric vehi- hybrid and electric vehicles could reach 16.7 mil-
cles for public service use in each of 10 pilot cities lion (15 percent of total vehicle production), or
annually between 2009 and 2012.12 By mid-2010, an average of 1.67 million vehicles annually. This
China was home to an estimated 5,000 alterna- would lead to the creation of roughly 1.2 mil-
tive-fuel vehicles, with a combined distance of lion green jobs annually in this sector on average.
just over 81 million kilometers traveled.13 Under a less rosy development scenario, however,
The Chinese government aims to achieve China’s alternative fuel vehicle industry would
a 10-percent market share for so-called “new- generate an average of only 640,000 jobs annually
energy vehicles”—including hybrid-electric, between 2011 and 2020.
High-Speed Rail
* The Ministry of Science and Technology (MOST), China’s first high-speed rail line was established
Ministry of Finance, National Development and Reform
Commission (NDRC), and Ministry of Industry and only in 2004, yet the country has already become
Information Technology (MIIT). the global leader in high-speed rail (HSR) devel-
www.worldwatch. o r g Green Economy and Green Jobs in China 17Greening Transportation
opment. By the end of 2010, China was home to of urban passenger transport increased from 2.4
17 HSR lines with a total operational length of percent to 3.9 percent.22 Since then, urban rail has
some 8,400 kilometers, making it the most exten- continued to expand.
sive HSR network in the world.17 According to As of 2007, 10 Chinese municipalities boasted
the country’s Long-Term Railway Network Plan, urban rail systems, with a total of 30 lines in
which was updated in 2008, China aims to have operation.23 By 2010, this total had increased to 37
18,000 kilometers of HSR by 2020.18 lines, with a combined length of 1,130 kilometers.
24
Shanghai and Beijing have the longest urban
rail networks by far, spanning 420 kilometers and
330 kilometers respectively in 2010.25 Shanghai’s
metro, which added lines during the 2010 World
Expo, has overtaken London’s to become the
world’s most extensive subway network.26
During the 10th Five-Year Period (2001–05),
China invested 200 billion yuan ($31 billion) in
urban rail construction.27 The country deployed
more than 400 kilometers of urban rail, of
which 293 kilometers are metro lines.28 Twenty-
five of China’s 48 cities with more than 1 mil-
lion residents are planning a combined total
of 5,000 kilometers of urban rail systems, at an
estimated investment cost exceeding 800 billion
© Nikada
yuan ($123 billion).29
The Shanghai Transrapid maglev train leaving the station. Although data limitations make it difficult to
estimate the employment effect of China’s urban
rail sector, specific analysis of urban rail in Bei-
To reach this goal, China will need to build jing allows for broader insight into these green
another 10,000 kilometers of HSR lines over the jobs potentials.30
coming decade. Based on the calculation that Beijing’s municipal government has stepped
building 1 kilometer of HSR costs roughly 112 up its urban rail ambitions in recent years. Cur-
million yuan ($17.3 million), this brings the total rent targets include completion of 660 kilome-
investment needed for the remaining lines to 1.11 ters of lines by 2015, at a total investment of 500
trillion yuan ($171 billion).19 Applying employ- billion yuan ($77 billion), and construction of
ment coefficients to these investment figures trans- another 340 kilometers of lines during 2016–20,
lates into an average of 230,000 direct and 400,000 at a total investment of 445 billion yuan ($69
indirect jobs created annually during the 2011–20 billion).31 These investment projections can be
period, or a total of 630,000 jobs annually.20 used to estimate the future employment effects
of Beijing’s urban rail development plan.32 (See
Urban Rail
Table 5.)
In 2006, China’s urban rail network—defined For the period from 2011 through 2015,
here as metro and light rail systems*—trans- investment in Beijing’s urban rail systems could
ported 1.8 billion passengers, twice as many as create an average of 164,000 direct jobs and close
in 2001.21 During this same period, rail’s share to 300,000 indirect jobs annually. Further devel-
opment of urban rail from 2016 through 2020
* Other urban rail formats, such as trams and those based to achieve the municipal government’s target
on magnetic levitation (“maglevs”), are not discussed in could create an average of 146,000 direct jobs and
this report due to their low prevalence in China. Only two 266,300 indirect jobs annually. Overall, from 2011
commercialized maglev lines exist in China, in Shanghai
and Beijing, and trams are found only in a few medium- through 2020, development of urban rail in Bei-
sized cities, including Dalian, Changchun, and Anshan. jing could bring more than 437,000 jobs each year.
18 Green Economy and Green Jobs in China w w w. w o r l d watch.orgYou can also read