Hydrogen Powertrains in Competition to Fossil Fuel based Internal Combustion Engines and Battery Electric Powertrains Wasserstoffantriebe im ...
←
→
Page content transcription
If your browser does not render page correctly, please read the page content below
1-

                                    Dipl.-Ing. Marc Sens,
    Dr.-Ing. Christoph Danzer, Dipl.-Ing. Carsten von Essen, Dr.-Ing. Maximilian Brauer,
       Dipl.-Ing. Ralf Wascheck, Dr.-Ing. Joern Seebode, Dipl.-Ing. Matthias Kratzsch

    Hydrogen Powertrains in Competition to Fossil Fuel based Internal
         Combustion Engines and Battery Electric Powertrains

     Wasserstoffantriebe im Wettbewerb mit Verbrennungsmotoren für
         fossile Kraftstoffe und dem batterieelektrischen Antrieb

Abstract
The achievement of future climate goals means an urgent shift towards a CO2-neutral
society. Alongside renewably generated electricity, hydrogen plays a key role in this.
Hydrogen is seen as "the" solution for a post-fossil but still flexible energy supply, particularly
because of its storage and transport capability.
Even if hydrogen is currently more being discussed as a basic material for industrial
applications or their CO2-neutral energy supply and is already being widely used in some
cases, it also represents a highly interesting energy carrier for mobility. On the one hand
side, it can be used in conventional combustion engines, but also in fuel cells for electric
powertrains.
However, this article presents how hydrogen-based powertrains compare to purely battery-
electric powertrain and diesel engine powertrains powered by fossil fuel in three different
vehicle classes. The three vehicle classes are in detail a heavy passenger car, a light
commercial vehicle and finally the heavy commercial vehicle. To classify the potential of the
powertrains in terms of TtW, WtW and also CtG CO2 intensities as well as manufacturing
costs and the TCO (Total Cost of Ownership), a techno-economic study was carried out, the
results of which are discussed in detail in this paper.
The study comes to the following main conclusions:

    1. In passenger cars, hydrogen powertrain may well be an alternative to battery electric
       powertrains, at least in the medium term, until a sufficient amount of nationally generated
       fully renewable electricity is available.
    2. For the fuel cell, it is even possible to speak of a long-term alternative in the passenger car
       sector. In this case, however, blue and turquoise hydrogen or imported green hydrogen
       must be available and used.
    3. Hybridized H2 ICE powertrains represent a real alternative to battery-electric mobility and
       the fuel cell for light commercial vehicles in the medium and long term, both from a CO2
       equivalent and TCO point of view.
    4. In heavy-duty commercial vehicles for long-haul application, hydrogen powertrains
       represent a rapid measure for achieving a CO2-free mobility, especially in the short and
       medium term. From a TCO point of view, the H2-ICE can be seen as a short-term solution
       with an advantage over the FC. This will change from 2030, when the FC will also have an
       advantage in terms of TCO. In the regional delivery sector, the BEV will prevail. For special
       applications with increased power density requirements, highly efficient diesel (e-fuel) or
       H2-ICE powertrains will also play a role in the long term.
    5. If the focus is purely on the TtW efficiency of the powertrain, the FC is basically at an
       advantage over the H2 ICE in all applications.

1                                                      42nd International Vienna Motor Symposium 2021
2-

Kurzfassung
Die Erreichung zukünftiger Klimaziele bedeutet zwingend den Schwenk hin zu einer
CO2-neutralen Gesellschaft. Neben regenerativ erzeugtem Strom kommt dem Wasserstoff
dabei eine Schlüsselrolle zu. Insbesondere aufgrund seiner Speicher- und
Transportfähigkeit wird Wasserstoff als „die“ Lösung für eine post-fossile aber weiterhin
flexible Energieversorgung angesehen.
Auch wenn Wasserstoff aktuell eher als Grundstoff für industrielle Anwendungen oder deren
CO2-neutrale Energieversorgung diskutiert wird und bereits teilweise breite Anwendung
findet, so stellt er auch für die Mobilität einen hoch interessanten Energieträger dar.
Einerseits kann er in konventionellen Verbrennungsmotoren zum Einsatz kommen,
andererseits aber auch in Brennstoffzellen für elektrische Antriebsstränge. Wie sich die
wasserstoffbasierten Antriebe im Vergleich zu rein batterieelektrischen Antrieben und den
mit fossilem Kraftstoff betriebenen dieselmotorischen Antrieben in drei verschiedenen
Fahrzeugklassen einordnen lassen, wird in diesem Beitrag erörtert. Bei den drei
Fahrzeugklassen handelt es sich im Einzelnen um einen schweren PKW, ein leichtes
Nutzfahrzeug und schließlich ein schweres Nutzfahrzeug. Zur Einordnung der Potenziale
der Antriebe in Bezug auf die TtW-, WtW- und auch CtG-CO2-Intensitäten sowie die
Herstellkosten und die Total Cost of Ownership wurde eine techno-ökonomische Studie
durchgeführt, deren Ergebnisse in der vorliegenden Arbeit detailliert diskutiert werden.
Zu folgenden Schlussfolgerungen kommt die Studie:

    1. Im PKW Fahrzeug können Wasserstoffantriebe wenigstens mittelfristig, bis eine
       ausreichende Menge an national erzeugtem regenerativem Strom zur Verfügung steht,
       durchaus eine Alternative zu batterieelektrischen Antrieben darstellen.
    2. Für die Brennstoffzelle kann im PKW-Bereich sogar von einer langfristigen Alternative
       gesprochen werden. Hierbei muss aber eben auch blauer und türkiser Wasserstoff bzw.
       importierter grüner Wasserstoff zur Verfügung stehen und genutzt werden.
    3. Hybridisierte H2 VKM-Antriebe stellen für das leichte Nutzfahrzeug mittel- und auch
       langfristig sowohl aus CO2-Äquivalente als auch TCO-Sicht eine echte Alternative zur
       batterieelektrischen Mobilität und der Brennstoffzelle dar.
    4. Im schweren Nutzfahrzeug stellen die Wasserstoffantriebe vor allem kurz- und mittelfristig
       eine schnelle Maßnahme zur Erzielung CO2-freier Mobilität im Schwerlastverkehr dar.
       Hierbei kann aus TCO-Sicht als kurzfristige Lösung die H2 VKM gegenüber der BZ im
       Vorteil gesehen werden. Dies ändert sich ab 2030, dann ist die BZ auch bezüglich TCO im
       Vorteil.
    5. Wird rein auf den TtW-Wirkungsgrad des Antriebs fokussiert, so ist die BZ grundsätzlich im
       Vorteil zur H2 VKM.

2                                                    42nd International Vienna Motor Symposium 2021
3-

Table of contents
Abstract................................................................................................................................ 1
Kurzfassung ......................................................................................................................... 2
Introduction .......................................................................................................................... 5
Comparative study of hydrogen-based powertrain systems for passenger cars and
commercial vehicles in their ecosystems ............................................................................. 6
Approach and aim of the comparative study ........................................................................ 6
      Vehicle overview, powertrain systems and H2 production paths ................................... 6
      Powertrain optimization ................................................................................................ 7
Results for passenger car .................................................................................................... 8
      Powertrain parameters and optimization ...................................................................... 8
      System specification, consumptions and CO2 footprints............................................... 9
      TCO and manufacturing costs .................................................................................... 11
      Summary Passenger Car ........................................................................................... 11
Results for light commercial vehicle ................................................................................... 12
      System specification, consumptions and CO2 footprints............................................. 12
      TCO and manufacturing costs .................................................................................... 14
      Summary light commercial vehicle ............................................................................. 15
Results for heavy-duty commercial vehicles ...................................................................... 15
      System specification, consumptions and CO2 footprints............................................. 15
      TCO and manufacturing costs .................................................................................... 19
      Summary of heavy-duty commercial vehicles ............................................................. 20
Overall comparison and conclusion ................................................................................... 20
Powertrain-specific challenges and possible technical solutions ....................................... 21
Efficiency of fuel cell and H2-ICE in comparison ................................................................ 21
Technological Challenges and Potentials in the Development of PEM Fuel Cell Systems 22
      System efficiency and power density .......................................................................... 23
      Cost reduction of fuel cell systems ............................................................................. 26
      Lifetime and durability ................................................................................................. 27
Technological challenges and potentials in the development of H2-ICE ............................ 29
      Objective..................................................................................................................... 29
      Methodology ............................................................................................................... 29
      Challenges of an H2 ICE ............................................................................................. 32
      Summary and development priorities H2-ICE ............................................................. 45
Exhaust gas aftertreatment concepts to achieve future emission regulations for H2-ICEs. 47
      Passenger cars and light commercial vehicles ........................................................... 47
      Heavy-duty vehicles.................................................................................................... 51

3                                                                        42nd International Vienna Motor Symposium 2021
4-

Hydrogen storage systems ................................................................................................ 55
      Overview hydrogen storage systems .......................................................................... 55
      CGH2 (Compressed Gaseous Hydrogen) ................................................................... 56
      LH2 (Liquid Hydrogen) ................................................................................................ 57
      CcH2 (Cryo Compressed Hydrogen)........................................................................... 57
      Selection of the most advantageous storage system ................................................. 57
Potential analysis of hybridized H2-ICE powertrains .......................................................... 58
Demand analysis and development of the necessary H2 infrastructure ............................. 63
Status of H2 infrastructure 2021 ......................................................................................... 64
H2 infrastructure in 2030: requirements and vision ............................................................ 64
      H2 demand for road transport ..................................................................................... 64
      Production and supply ................................................................................................ 64
      Type and density of the service station network ......................................................... 66
Techno-economic comparison of H2 supply pathways....................................................... 67
Summary of the study findings ........................................................................................... 70
Appendix A ........................................................................................................................ 74
Acknowledgements ............................................................................................................ 74
List of abbreviations ........................................................................................................... 74
Bibliography ....................................................................................................................... 76

4                                                                      42nd International Vienna Motor Symposium 2021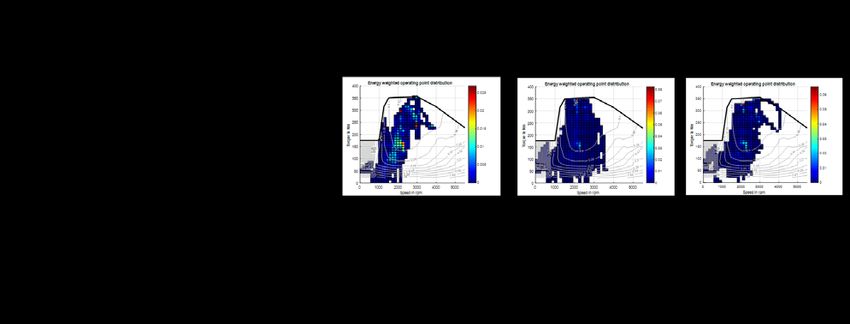
5-

Introduction
What does the optimal mobility scenario look like? This question is currently being
addressed not only by automotive manufacturers, their suppliers and development partners,
but also by policymakers. The battery-electric drive concept is expected to play a key role
here. Because it is emission-free at local level, has a high degree of drive efficiency and is
compatible with the direct use of electricity generated from renewable sources, it is also an
appealing idea to convert road traffic from internal combustion engine-based drives to a
completely battery-electric fleet. If only there were not the currently known and present weak
points of electromobility:

    1. Low storage densities of batteries compared to liquid energy sources and thus
       considerably reduced ranges per "energy filling.
    2. Limited availability of raw materials for electric machines, power electronics and batteries.
    3. Energy-intensive battery production and associated high CO2 emissions.
    4. Higher vehicle costs due to high battery costs.
    5. Foreseeable lack of CO2-free electricity for battery charging and also in the long term not
       enough to cover the energy demand in all sectors.

All of the above points repeatedly lead to controversial discussions, especially on the
question of whether pure battery electric e-mobility is the drive concept to strive for in all use
cases. The current political framework in the form of EU regulations and additionally, at least
in Germany, the high monetary incentives are currently leading to a rapidly increasing
market share of battery electric e-drives in the passenger car segment. Furthermore,
regulations have already been passed for commercial vehicles as well, which will lead to
shifts in the type of drive over the next few years. Particularly when it comes to long-distance
applications, there is controversy about the "right" drive. But where does long-distance
mobility begin and do statements then always apply to all vehicle segments? In this context,
hydrogen is repeatedly discussed as an energy carrier for mobile applications. It plays a key
role in the energy transition, and its storage and transport capabilities are decisive factors.
However, its use in road traffic is controversial: which vehicle segment should use batteries
and which hydrogen as an energy storage medium?
In order to obtain a largely objective view of the potential of hydrogen in comparison with
battery-electric electric mobility and to understand the respective influencing factors, a
techno-economic study was carried out, the results of which are reported in this paper. The
following framework covers the study, which has the year 2030 in view:

    1. techno-economic comparison of 4 drive concepts in 3 vehicles:
       •   Diesel VKM drive vs. E-drive vs. fuel cell vs. H2-VKM
       •   Each of the above powertrains is evaluated in a heavy passenger vehicle, a light
           commercial vehicle, and a heavy commercial vehicle
    2. evaluation criteria for each combination:
       •   CO2 intensity according to TtW, WtW, and CtG evaluation, with the hydrogen evaluated
           coming from different production sources (gray, turquoise, blue, and green hydrogen
           from national production are considered, as well as 100% renewable green hydrogen
           imported from the MENA region).
       •   Cost of propulsion including energy storage
       •   TCO costs for adjusted lifetime and mileage per vehicle class.

5                                                       42nd International Vienna Motor Symposium 2021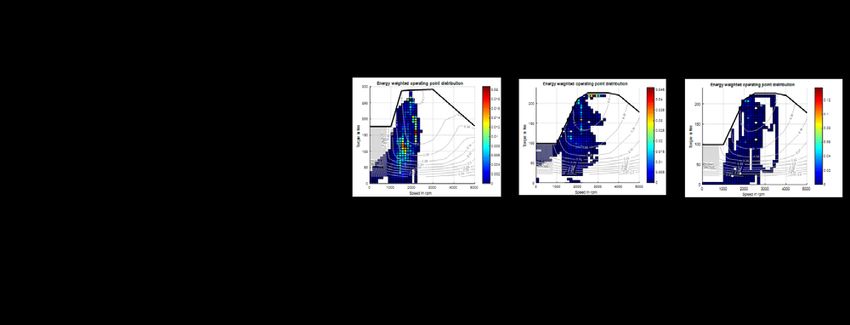
6-

In order to take into account the then prevailing boundary conditions for the various drive
systems in 2030, the study also examines the further technical development possibilities for
fuel cell drives and combustion engine drives with hydrogen as fuel. Finally, aspects of the
infrastructure required to establish hydrogen mobility are also addressed.
The following topics are presented and discussed in this paper:

    1. Techno-economic study
    2. Further development potential of the fuel cell system with a time horizon of 2030
    3. Further development potential of the hydrogen combustion engine with a time horizon of
       2030
    4. Exhaust gas aftertreatment system considerations for compliance with the strictest
       emission limits with H2 VKM drives in all 3 vehicle classes
    5. Expectation for the development of H2 storage systems
    6. Evaluation of the necessary infrastructural requirements for the realization of a nationwide
       H2 mobility scenario
    7. Techno-economic evaluation of hydrogen production/provision pathways.

Comparative study of hydrogen-based powertrain systems for
passenger cars and commercial vehicles in their ecosystems
Approach and aim of the comparative study
The objective of the comparative study is the universal evaluation of hydrogen-based
powertrain systems, including hydrogen production, and their comparison with powertrains
using fossil fuels and battery-electric powertrains. The objective comparison includes the
powertrain and the storage systems as well as the generation paths for hydrogen with
different processes and the provision of electrical energy. This Well-to-Wheel (WtW)
consideration is additionally extended by the analysis of the complete vehicle life cycle
(LCA), which enables the environmental impact of the production and recycling of the
vehicles and powertrains from Cradle to Grave (CtG). Furthermore, the economic aspects
of hydrogen production and propulsion system deployment are considered, leading to the
specification of manufacturing costs and total cost of ownership (TCO). The manufacturing
cost calculation is based on physical component models and includes material, production,
assembly and overhead costs assuming individual unit quantities.
The study was prepared with particular attention to objective comparability between the
powertrain concepts and the manufacturing paths for all vehicles and types of use. Thus, all
powertrain systems in all vehicle classes were individually optimized in their main
parameters and examined under the same operating boundary conditions. Since the
technical, ecological and economic aspects are the main focus of this study, fiscal control
elements and usability aspects (e.g. charging times und influence of ambient conditions)
were largely excluded, particularly for hydrogen and electricity generation and vehicle
operation. The result makes it possible to compare different powertrain concepts in different
vehicle classes, taking into account the generation paths of hydrogen and electrical energy,
with regard to technical, ecological and economic aspects.

Vehicle overview, powertrain systems and H2 production paths
Figure 1 schematically shows the considered H2 generation paths, the vehicle segments
and the powertrain types. For the production of hydrogen, the processes steam methane
reforming (SMR) - grey hydrogen, SMR with carbon capture and storage (CCS) - blue

6                                                     42nd International Vienna Motor Symposium 2021
7-

hydrogen, methane pyrolysis - turquoise hydrogen and water electrolysis with different
electricity mixes are considered. In addition, the import of renewable hydrogen from MENA
(Middle East North Africa) countries is considered. In addition to the feedstocks, the required
electrical energy is considered in a differentiated manner, either from the electricity mix
anticipated for 2030 [1] or exclusively from renewable generation. This differentiation is also
applied to the charging processes of the BEV´s and partly to the production of the vehicles
and powertrain components.

    Energy, H2-Production, Vehicle Production        Vehicle        Powertrain         Assessment
       SMR    CH4    Elektro- MENA-
SMR   + CCS   Pyro    lysis Import                                     H2 - ICE

                                                                     H2 - Fuel Cell

                                                                         BEV

                                                                     Diesel - ICE

Figure 1: Overview of H2-Production paths, energy supply, vehicle segments and
powertrain types

On the vehicle side, this study differentiate in passenger cars (SUV-segment) and
commercial vehicles (light and heavy). Each vehicle segment is considered with H2
combustion engine powertrain (H2-ICE), H2 fuel cell powertrain (H2-FCEV) and pure battery
powertrain (BEV). In addition, diesel combustion engines (Diesel-ICE) are used as fossil
reference systems for evaluation. For each combination of energy supply, H2 generation
pathway, vehicle and powertrain, fuel and energy consumptions, equivalent CO2 emissions
for WtW and CtG balancing, manufacturing costs of the powertrains and TCO trajectories
are calculated. The focus is on Germany in 2030. All other assumptions and detailed
information are included in Appendix A.

Powertrain optimization
To ensure comparability between the powertrain systems, systematic variation studies of
the powertrain parameters were carried out for each vehicle segment. This is based on IAV's
unique Powertrain Synthesis methodology [2], [3] with coupled life cycle and cost
assessment. This methodology enables fully combinatorial optimization of all key powertrain
parameters. Thus, depending on the type of powertrain, the transmission ratios, the power
characteristics of the electric drives and the energy capacities of the batteries are varied

7                                                    42nd International Vienna Motor Symposium 2021
8-

completely systematically. In compliance with typical requirement profiles, consumption
optimizations are then carried out to ensure the highest possible overall efficiency of the
primary converter and powertrain components. The sizing of the H2 tank systems (H2-ICE,
H2-FCEV) and the traction battery (BEV) are always range-scaled, whereby the system
efficiency directly influences the storage size and thus the cost and life cycle footprint. This
constraint enables a focused optimization on the fuel or energy consumption of the
powertrain variants. Furthermore, the vehicle-specific requirements are applied to the
complete amount of variants, allowing the optimization of the various powertrain types with
parity in performance characteristics.

Results for passenger car
Powertrain parameters and optimization
For the passenger car segment, a compact-class SUV with a range of 500 km was assumed.
For the 90 kW H2-ICE, a transmission optimization for a 6-speed dual clutch transmission
was performed. The fuel cell propulsion system was optimized in terms of HV battery energy
capacity and key axle drive parameters (EM power, EM torque, number of speeds, and
transmission ratios). The axle drive parameters were also varied for the BEV. Both
hydrogen-powered systems, as well as the battery electric powertrain, were designed to
always have the same target range. The number of powertrain concepts considered in the
passenger car thereby comprises approximately 68,300 variants. Detailed value ranges can
be found in Appendix A. Figure 2 shows two exemplary sensitivity diagrams for the FCEV
and BEV powertrains. The left figure shows the dependence of the minimum achievable
hydrogen consumption over the battery energy content, after which the value of 4.25 kWh
was optimized as optimal in the system context. The right figure shows the typical BEV
relationship between energy consumption and powertrain costs (incl. battery), according to
which particularly efficient powertrain systems also enable more cost- storage systems for
the same range.

                                            H2-FCEV                                             BEV
                                  Optimization Battery Capacity                Energy Consumption vs. Powertrain Costs
 H2-Consumption WLTP [kg/100km]

                                                                    Energy-Consumption
                                                                    WLTP [kWh/100km]

                                    Battery energy capacity [kWh]                           Production costs powertrain incl. storage

                                     Best place FCEV powertrains                                 Best place BEV powertrains

Figure 2: Optimization of the powertrain parameters for FCEV and BEV

8                                                                                        42nd International Vienna Motor Symposium 2021
9-

System specification, consumptions and CO2 footprints
The powertrain optimization results in optimum system specifications for each powertrain
type, which are shown in the Table 1. In addition to the powertrain components, this also
includes the scaled storage sizes and the tank-to-wheel (TtW) consumption for the WLTP.

Table 1: Optimized system specifications for passenger cars in 2030
     Vehicle,                                                 Passenger Car
     Range,                                          1.600 kg basic curb weight, FWD                    2030
      Cycle                                               500 km range, WLTP
                                                                                        Consumption energy for
    Powertrain    Optimal System Specification
                                                                                        WLTP, TtW [kWh/100km]*
                  ICE: H2-DI, 2.0l 90 kW, 280 Nm,
                  2-Stage VTG, Max. Efficiency = 45 %                       60
        H2
                  Transmission: 6-Speed DCT
       ICE        15.50 / 10.43 / 7.02 / 4.72 / 3.18 / 2.14                             48    -40 %    -54 %   +2 %
                                                                            50
                  Storage System: 700 bar CGH2 / 7.1 kg H2
                                                                                                                 49
                  Fuel Cell System: PEM 90 kW, Single Stack                 40
                  Max. FC-System Efficiency = 65 %
       H2         E-Motor: 170 kW Peak, 400 Nm Peak                                            29
                                                                            30
      FCEV        Transmission: 2-Speed, 15.0 / 7.5                                                     22
                  Battery: NMC, 400 V, 4.25 kWh
                  Storage System: 700 bar CGH2 / 4.3 kg H2                  20

                  E-Motor: 120 kW Peak, 300 Nm Peak
                                                                            10
      BEV         Transmission: 2-Speed, 16.5 / 8.25
                  Battery: NMC, 400 V, 120 kWh
                                                                              0
                  ICE: DI, 2.0l, 110 kW, 350 Nm                                   H2-ICE     H2-FCEV   BEV     Diesel
     Diesel
                  Transmission: 6-Speed DCT

 *Consumption values consider powertrain-individual factors for All-Seasons-Operation

The FCEV system with an optimized operating strategy achieves a consumption advantage
in the WLTP of approx. 40 % compared to the optimal H2-ICE system. Here, the fuel cell is
often operated in low power operating points with highest efficiencies. Compared to the BEV,
the energy consumption of the H2-ICE is more than twice as high. The additional
consumption potential due to hybridization for the ICE-variant is discussed separately in the
corresponding chapter. The results are based on an assumed maximum speed for the
FCEV- and ICE-systems of 180 km/h. At lower speeds of e.g. 160 km/h, depending on the
vehicle, further consumption potentials can be enabled for the FCEV [4]. By modifying the
combination of battery capacity and fuel cell power, full range extender operation can be
realized, which means operation at a few specified operating points.
Based on the results of the powertrain optimization and the H2 as well as electricity
production paths considered, the respective CO2 emissions (WtW) were determined and
compared with those of the battery- and diesel-powered vehicles. From the UBA-RESCUE
study [1] the shares of the energy production paths for the GreenEe1 scenario were used to
calculate the CO2 emissions of the future electric energy mix. From this, a CO2 burden of
220 g CO2e/kWh is derived for the 2030 electricity mix in Germany.

For a production in Germany with 2030 electricity mix, blue hydrogen represents the lowest
CO2 pathway according to well-to-wheel balances, as shown in Figure 3. With low-CO2
hydrogen from the MENA region, CO2 emissions in both hydrogen-powertrains systems
could even be reduced to about half compared to blue hydrogen from Germany. With blue
hydrogen generated with German 2030 electricity mix, a fuel cell vehicle would then be
about 10 g CO2e/km better than a battery vehicle charged with the same electricity mix and

9                                                                  42nd International Vienna Motor Symposium 2021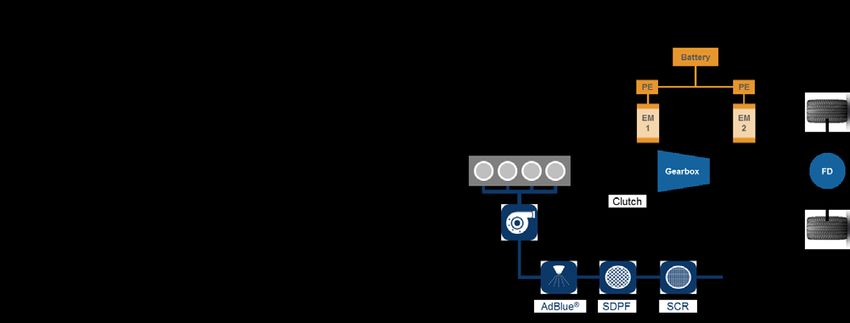
10-

33 g/km worse if it would be possible to charge the BEV with renewably generated electricity.
A vehicle with an H2 combustion engine would result in a CO2 reduction (WtW) of about 54
% with blue hydrogen compared to a diesel engine. Figure 3 also shows that hydrogen
production by electrolysis in Germany with ordinary electricity mix would cause CO2
emissions about a factor of two to three higher than production by methane pyrolysis or
steam reformation with CCS.

                               2030 Well to Wheel CO2e [g/km]                                  2030 Electricity Mix
                                                                                               220 g CO2e/kWh
 250
                                                                                               Renewable Mix
 225                                                                                           24 g CO2e/kWh
 200 182
                                                                                          Electrolysis-GER-E-Mix
 175                         168
                                                                                          Electrolysis-GER-ReNew
 150                                                                            138      CCH4-Pyrolysis-GER-E-Mix
                                                                                         CCH4-Pyrolysis-GER-ReNew
 125                                    109
                                                        101                              SSMR+CCS-GER-E-Mix
 100            87                                                                       SSMR+CCS-GER-ReNew
  75                   63                                                                SSMR-GER-E-Mix
                  55                           53
           42                                                          48                SSMR-GER-ReNew
  50
                                   30           33 38
                                          25                                              Electrolysis LH2-MENA-ReNew
  25                                                          18
                                                                         5                BEV-GER-E-Mix
     0                                                                                    BEV-GER-ReNew
                  H2-ICE                       H2-FCEV                BEV     Diesel
                                                                                          Diesel-fossil

Figure 3: CO2 emissions WtW for general and renewable electricity mix in 2030

Only if 100 % renewable electricity (assumption: 25 %-solar / 75 %-wind) can be used for
hydrogen production, electrolysis in Germany represents a considerable CO2 potential. If the
complete amount of hydrogen required for the mobility-transformation is produced in
Germany, this results in emissions that are only 7 or 12 g CO2e/km higher than if the
hydrogen is produced in MENA regions using renewable electricity.

                              2030 Cradle to Grave CO2e [g/km]                                 2030 Electricity Mix
                                                                                               220 g CO2e/kWh
 250
         229                                                                                   Renewable Mix
 225                         215                                                               24 g CO2e/kWh
 200
                                                                               175        Electrolysis-GER-E-Mix
 175                                    163                                               Electrolysis-GER-ReNew
                                                        154
 150            135                                                                      CCH4-Pyrolysis-GER-E-Mix

                                                                      115                CCH4-Pyrolysis-GER-ReNew
 125                   110                    106
                 102                                                                     SSMR+CCS-GER-E-Mix
 100      89                                    86 91                                    SSMR+CCS-GER-ReNew
                                   78    78                   72        72
  75                                                                                     SSMR-GER-E-Mix

  50                                                                                     SSMR-GER-ReNew
                                                                                          Electrolysis LH2-MENA-ReNew
  25
                                                                                          BEV-GER-E-Mix
     0                                                                                    BEV-GER-ReNew
                  H2-ICE                       H2-FCEV                BEV     Diesel
                                                                                          Diesel-fossil

Figure 4: CO2 emissions CtG for general and renewable electricity mix in 2030

10                                                                 42nd International Vienna Motor Symposium 2021
11-
Looking at the entire vehicle life cycle, Figure 4 shows that with imported MENA-H2, both
hydrogen powertrains reach almost the same CO2 level as the battery vehicle, even if this
is charged with 100 % renewable energy. It is highly likely that hydrogen can be produced
in larger quantities with renewable energy in 2030. Assuming this is the case, the considered
hydrogen powertrains would even emit about 40 g CO2 per kilometer less than a battery
vehicle, which is charged in average with ordinary electricity mix. In total, the comparison
shows that in case of using renewable electricity for the passenger cars segment, the CO2
backpack of the battery vehicles almost balances out with the additional emissions of H2
generation over the vehicle life cycle.
TCO and manufacturing costs
Figure 5 shows the production costs of the entire powertrain including exhaust gas
aftertreatment and storage system and the TCO values for 2030.
TCO – Passenger Car, 2030, Production Costs Powertrain and Storage
160 tkm, 4 years [€ct/km] 500 km range [€]
35 14000 13.130
34 33
33 33 12000
33
32 32 10000 8.460
31 7.480
8000
30 29 29
29 5.450
29 6000
28 4000
27
26 2000
25 0
H2-ICE-Electrolysis-GER H2-ICE-Electrolysis-MENA
H2-ICE H2-FCEV BEV Diesel
H2-FCEV-Electrolysis-GER H2-FCEV-Electrolysis-MENA Premises for number of units:
BEV-2030-E-Mix BEV-2030-ReNewable-Mix H2-ICE, H2-FCEV-Stack and BEV-Battery: 500 t units/year
Diesel
Figure 5: TCO and production costs for passenger cars
An annual number of 500,000 units was assumed for all powertrain systems in 2030. Despite
the larger storage volume of the H2-ICE system due to consumption, the component costs
of the FCEV systems are around 1,000 € higher. Due to the tank technology, both hydrogen
powertrains are in total about 2,000 € to 3,000 € more expensive than the diesel reference.
Looking at the TCO values for 2030, it is noticeable that when using MENA hydrogen, the
total costs are at the same level as diesel and even 3 to 4 €ct/km cheaper than with a battery
vehicle. In terms of TCO, no clear trend can be identified for either of the two hydrogen
propulsion systems.
Summary Passenger Car
The well-to-wheel CO2 potential of the examined passenger cars with hydrogen powertrains
is significant with 54 % compared to a corresponding diesel vehicle, even if the hydrogen is
produced in Germany in 2030 with ordinary electricity mix. In the considered passenger car
SUV segment, both the H2-ICE and the FCEV powertrains with blue hydrogen are on a
similar level in terms of CO2 as the battery powertrains. With MENA imported hydrogen and
fuel cell propulsion system, CO2-emissions can be reduced to only 18 g CO2e/km (WtW,
WLTP). Considering the whole vehicle life cycle, it is clear that with imported MENA-H2, both
hydrogen powertrains can reach almost the same CO2 level of a battery vehicle, even if this
11 42nd International Vienna Motor Symposium 202112-
would be charged with 100 % renewable energy. In terms of overall costs, the hydrogen
propulsion systems are even cheaper than a comparable battery vehicle. Overall, for the
passenger car segment, the fuel cell system shows the greatest potential in terms of
efficiency, cost and sustainability. The approximately 40 % higher fuel consumption of the
non-hybridized H2-ICE leads to larger tank systems, which significantly affects both the
production costs and the CO2 footprints of the vehicle and the hydrogen. The improvement
potential of hybridization concepts is therefore considered in more detail in the chapter:
Potential analysis of hybridized H2-ICE powertrains.
Results for light commercial vehicle
System specification, consumptions and CO2 footprints
The powertrain systems in the light commercial vehicle segment were also optimized in the
same way as for passenger cars. From the total concept amount of approx. 192,000
variants, the consumption-optimized systems were selected in relation to a 500 km range.
The Table 2 shows the optimal system specifications and energy consumption. According
to this, the consumption advantage of the fuel cell powertrain system is reduced to about 28
% compared to the H2-ICE. This is mainly due to the specific higher utilization of the LCV-
ICE compared to the passenger car application. In terms of consumption, a diesel powertrain
also exhibits about 14 % lower fuel consumption compared to the H2-ICE. The optimization
resulted in a capacity of 9.25 kWh as the most fuel-efficient battery size for the FCEV
systems. The predictive operating strategy (dynamic programming) assumed for the year
2030 keeps the fuel cell in the loss-favorable range for long periods at low power levels
around 11 kW. Only at higher driving power requirements does the primary converter follow
the requested DC link power, while otherwise the cycle dynamics are balanced by the HV
battery.
Table 2: Optimized system specifications LDCV in 2030
Vehicle, Light Commercial Vehicle
Range, 2.250 kg basic curb weight, RWD 2030
Cycle 500 km range, WLTP
Consumption energy for
Powertrain Optimal System Specification
WLTP, TtW [kWh/100km]*
ICE: H2-DI, 2.0l 130 kW, 350 Nm,
2-Stage VTG, Max. Efficiency = 45 % 100
H2 90 -28 % -39 % -14 %
Transmission: 7-Speed AT 90
ICE
16.50 / 11.93 / 8.63 / 6.24 / 4.51 / 3.26 / 2.36 77
Storage System: 700 bar CGH2 / 13.5 kg H2 80
70 65
Fuel Cell System: PEM 2x65 kW, Double Stack
Max. FC-System Efficiency = 65 % 60 55
H2 E-Motor: 240 kW Peak, 500 Nm Peak 50
FCEV Transmission: 2-Speed, 21.0 / 10.5
Battery: NMC, 400 V, 9.25 kWh 40
Storage System: 700 bar CGH2 / 9.8 kg H2 30
E-Motor: 170 kW Peak, 450 Nm Peak 20
BEV Transmission: 2-Speed, 23.0 / 14.4 10
Battery: NMC, 400 V, 302 kWh
0
ICE: DI, 2.0l, 150 kW, 400 Nm H2-ICE H2-FCEV BEV Diesel
Diesel
Transmission: 7-Speed AT
*Consumption values consider powertrain-individual factors for All-Seasons-Operation
12 42nd International Vienna Motor Symposium 202113-
The consideration of the WtW-CO2 balances in Figure 6 shows that in the light commercial
vehicle, the combustion engine with blue hydrogen from Germany can achieve slightly lower
WtW-CO2 emissions than an equivalent battery vehicle with 2030 electricity mix.
2030 Well to Wheel CO2e [g/km] 2030 Electricity Mix
220 g CO2e/kWh
450
Renewable Mix
400 24 g CO2e/kWh
345
350 318 Electrolysis-GER-E-Mix
300 Electrolysis-GER-ReNew
249 CCH4-Pyrolysis-GER-E-Mix
250 230 218 CCH4-Pyrolysis-GER-ReNew
200 SSMR+CCS-GER-E-Mix
166
SSMR+CCS-GER-ReNew
150 119 120 121
104 SSMR-GER-E-Mix
100 79 75 86 SSMR-GER-ReNew
58 57
42 Electrolysis LH2-MENA-ReNew
50
13 BEV-GER-E-Mix
0 BEV-GER-ReNew
H2-ICE H2-FCEV BEV Diesel
Diesel-fossil
Figure 6: CO2 emissions WtW for general and renewable electricity mix in 2030
Furthermore, it can be seen that with imported MENA hydrogen, the equivalent CO2
emissions are between a factor of two to three lower than with a battery vehicle charged with
2030 electricity mix. A H2-ICE vehicle with blue hydrogen would be approximately 50 %
lower in CO2 (WtW) than a diesel-powered vehicle.
With 100 % renewable electricity, the resulting WtW-emissions for the electrolysis and
methane pyrolysis pathways can be lowered below the level of blue hydrogen. Assuming an
all-seasons target range of 500 km, the BEV systems have a battery energy content of more
than 300 kWh, which has a significant impact on the CO2 footprint of the powertrain.
Figure 7 shows the CtG-CO2 values, which include both the electrical energy and the vehicle
production. Here, the hydrogen powertrains show a very similar level compared to the BEV
variants almost regardless of the generation path. It can be deduced from this that in case
of using renewable energy the operating emissions of the various powertrain systems and
the CO2 footprints of the components almost balance each other out in terms of the entire
life cycle. If the battery vehicle is charged with ordinary electricity mix, blue and turquoise
hydrogen result in significant CO2 potentials for the hydrogen powertrain of up to 86 g
CO2e/km assuming the predicted electricity mix for 2030.
13 42nd International Vienna Motor Symposium 202114-
2030 Cradle to Grave CO2e [g/km] 2030 Electricity Mix
220 g CO2e/kWh
450
410 Renewable Mix
400 384 24 g CO2e/kWh
350 324 Electrolysis-GER-E-Mix
305
300 Electrolysis-GER-ReNew
267
247 CCH4-Pyrolysis-GER-E-Mix
250 231
CCH4-Pyrolysis-GER-ReNew
185 195 SSMR+CCS-GER-E-Mix
200 169
145 150 161 139 SSMR+CCS-GER-ReNew
150 123 132
117 SSMR-GER-E-Mix
100 SSMR-GER-ReNew
Electrolysis LH2-MENA-ReNew
50
BEV-GER-E-Mix
0 BEV-GER-ReNew
H2-ICE H2-FCEV BEV Diesel
Diesel-fossil
Figure 7: CO2 emissions CtG for general and renewable electricity mix in 2030
TCO and manufacturing costs
The high energy content of the EV battery systems is reflected not only in a high impact on
the CO2 footprint, but also in increased production costs, which is illustrated in Figure 8.
Even assuming full carry over use of passenger car cell modules, the total cost of the
powertrain system in the LCV rises to over 30,000 €. The more powerful fuel cell, battery
and e-drive unit (EDU) compared to the passenger car increases the production costs of the
FC-powertrain by about 3,000 € compared to the H2-ICE powertrain, despite the smaller
tank system. Looking at the TCO values for 2030, it is noticeable that with MENA hydrogen
the total cost per kilometer can be reduced to below 34 €ct/km. According to Figure 8, the
scenarios with ICE propulsion are even cheaper overall than the FC-systems, despite the
additional hydrogen consumption.
TCO – LD-CV, 2030, Production Costs Powertrain and Storage
400 tkm, 4 years [€ct/km] 500 km range [€]
50 48 50
35000 31.650
45 43 30000
40
40 38 25000
34 20000
35 14.425
30 15000 11.300
30
10000
6.000
25 5000
20 0
H2-ICE-Electrolysis-GER H2-ICE-Electrolysis-MENA
H2-ICE H2-FCEV BEV Diesel
H2-FCEV-Electrolysis-GER H2-FCEV-Electrolysis-MENA Premises for number of units:
BEV-2030-E-Mix BEV-2030-ReNewable-Mix H2-ICE, H2-FCEV-Stack and BEV-Battery: 500 t units/year
Diesel
Figure 8: TCO and manufacturing costs for LDCV in 2030
14 42nd International Vienna Motor Symposium 202115- The higher H2 consumption of the ICE powertrain is also liable for the fact that those systems benefit more from the assumed decreasing of the hydrogen production costs until 2030, which is especially true for hydrogen from the MENA region. Nevertheless, in terms of cost, diesel is the cheapest propulsion system at 30 €ct/km. Assuming that the high production costs of the battery systems are passed on to the sales prices in the same way as for the other powertrains, the BEV systems represent the most expensive mobility scenario for this vehicle segment at around 48 to 50 €ct/km. Summary light commercial vehicle For the light commercial vehicle, there is particular potential for the H2-ICE powertrain. Compared to passenger cars, the combustion engine has a higher specific load, which means that the consumption gap to the FCEV powertrains are smaller in this vehicle segment. This results in a relatively compact and cost-efficient system settings. Both the FC- and ICE-powertrain offer lower WtW-CO2 emissions per kilometer in 2030 using blue hydrogen compared with a BEV using German electricity mix. Another CO2 and cost potential is possible by using renewable MENA hydrogen, where in terms of TCO the H2- ICE is even the cheapest scenario among the low-CO2 systems. Only fossil diesel is still expected to be about 4 €ct/km cheaper in 2030 without any fiscal intervention. Accordingly, the FC-powertrain and the H2-ICE are interesting alternatives to fossil and battery electric powertrains under all evaluation criteria. Based on the premises made, there are slight advantages for the H2-ICE powertrain type in the LCV segment. Results for heavy-duty commercial vehicles System specification, consumptions and CO2 footprints Due to the variance of application scenarios, the heavy-duty commercial vehicles segment is characterized by a high degree of diversification in the requirements placed on the powertrain system. In addition, legal requirements, in particular exhaust emission and CO2 legislation, determine the powertrain layout. The CO2 legislation of the European Union (EU), which stipulates a CO2 reduction in the heavy on-highway sector of 15 % by 2025 and 30 % by 2030 compared to 2019, is particularly noteworthy here. In addition, entry bans for inner cities with internal combustion engines are to be expected, which means that electric drives will come into focus, especially in the heavy regional delivery sector. Furthermore, attractive total cost of ownership (TCO) forms the basis for the marketability of a technological solution. This is currently given above all for zero-emission powertrains by the current incentives. The reasons listed above result in widely differing solutions for application-specific optimum powertrain layout. In this study, the focus is on the application in heavy-duty long-haul commercial vehicles. Heavy delivery trucks are discussed comparatively. The optimum system layout in each case was determined using IAV's own optimization tools and subjected to a complete vehicle simulation. The resulting optimum powertrain system configurations are shown separately for the years 2025 and 2030 in the Table 3. For the long-haul application, the BEV has the lowest energy consumption, followed by H2- FCEV, Diesel and H2-ICE. This basic picture does not change in 2030. However, the percentage improvements in consumption between 2025 and 2030 differ between the powertrain types. For Diesel, an efficiency increase of about 10 % is possible with the help of a high-efficiency concept. This includes waste heat recovery, phase change cooling, friction optimization, an optimized injection system and intelligent thermal management. 15 42nd International Vienna Motor Symposium 2021
16-

Table 3: Optimized system specifications HDCV in 2025 and 2030
     Vehicle,                                  Heavy Duty Commercial Vehicle
     Range,                                       Tractor vehicle, 35 t Simulation mass,              2025
      Cycle                                       800 km range, Vecto Long-haul cycle
                                                                                   Consumption energy for
 Powertrain     Optimal System Specification
                                                                               Vecto LH, TtW, 2025 [kWh/100km]
                ICE: H2-LPDI, 12.5l, 310 kW
                Max. Efficiency = 44 %                                   350
        H2      Transmission: 12-Speed AMT                                        307      -14 %     -59 %   -7 %
       ICE      14.93 / 11.64 / 9.02 / 7.04 / 5.64 / 4.40 /              300
                3.39 / 2.65 / 2.05 / 1.60 / 1.28 / 1.00                                                       285
                Storage System: 700 bar CGH2 / 81 kg H2                  250                263
                Fuel Cell System: PEM 2x110 kW                           200
                Max. FC-System Efficiency = 62 %
      H2        E-Motor: 600 kW Peak, 700 Nm Peak
                                                                         150                          127
     FCEV       Transmission: 4-Speed, 65.0 / 39.4 / 23.8 / 14.4
                Battery: NMC, 400 V, 70 kWh
                                                                         100
                Storage System: 700 bar CGH2 / 69 kg H2
                E-Motor: 650 kW Peak, 700 Nm Peak                         50
      BEV       Transmission: 4-Speed, 75.0 / 45.4 / 27.5 / 16.7
                Battery: NMC, 800 V, 1,120 kWh                             0
                                                                                 H2-ICE    H2-FCEV    BEV    Diesel
                ICE: DI, 12.5l, 320 kW, 2,400Nm
     Diesel
                Transmission: 12-Speed AMT

                                                                                                      2030
                ICE: H2-LPDI, 12.5l, 310 kW
                Max. Efficiency = 46 %                                   350
        H2      Transmission: 12-Speed DCT                                        299      -21 %     -58 %   -9 %
       ICE      13.40 / 10.33 / 8.02 / 6.19 / 4.77 / 3.68 /              300
                2.81 / 2.16 / 1.68 / 1.30 / 1.00 / 0.77
                Storage System: 700 bar CGH2 / 79 kg H2                  250                237               271

                Fuel Cell System: PEM 2x110 kW                           200
                Max. FC-System Efficiency = 65 %
      H2        E-Motor: 600 kW Peak, 700 Nm Peak
                                                                         150                          126
     FCEV       Transmission: 4-Speed, 65.0 / 39.4 / 23.8 / 14.4
                Battery: NMC, 400 V, 70 kWh
                Storage System: 700 bar CGH2 / 63 kg H2
                                                                         100

                E-Motor: 650 kW Peak, 700 Nm Peak                         50
      BEV       Transmission: 4-Speed, 75.0 / 45.4 / 27.5 / 16.7
                Battery: NMC, 800 V, 1,110 kWh                             0
                                                                                 H2-ICE    H2-FCEV    BEV    Diesel
                ICE: DI, 12.5l, 320 kW, 2,400Nm
     Diesel
                Transmission: 12-Speed DCT

The hydrogen variants also improve significantly towards 2030, the FCEV benefiting more
than the H2-ICE truck, thanks to the application of an intelligent and predictive operating
strategy and the resulting higher recuperation potential. One way to leverage further
efficiency potential of the H2-ICE is a corresponding hybridization. This was not considered
because it is not currently taken into account in VECTO.

In addition to efficiency, technological maturity is crucial for market penetration. It is
expected that the H2-ICE can go into series production as early as 2024, thus offering a
short term CO2 reduction potential. In this way, the H2-ICE powertrain will become a pioneer
of establishing a suitable hydrogen infrastructure for the transportation sector. Fuel cell
technology currently does not yet meet all the robustness requirements of a long-haul
application and must be operated with high-purity hydrogen. In the long term, however, the

16                                                                  42nd International Vienna Motor Symposium 2021
17-
H2-FCEV offers the optimal long-haul propulsion system. A highly efficient Diesel is
attractive to leverage CO2 potential in the short term in combination with zero emission
vehicles in the fleet, and only offers full potential in the long term if e-fuels are approved as
zero emission fuels by future legislation. A long-haul BEV should be seen as a solution for
selected and appropriate use cases. Even with further development of the battery
technology, the geometric integration of the cell modules, as well as charging infrastructure
and reduction of the payload remain as challenges.
The Heavy Regional Delivery sector presents a differentiated picture. As described at the
beginning, however, the application profiles of the applications and the needs of the fleet
operators differ. Due to political and public pressure, the BEV is coming to the fore here. It
enables locally emission-free, CO2-free and low-noise operation, combined with the lowest
energy consumption of all compared powertrains.
Despite the high energy efficiencies of the BEV and H2-FCEV, they are not suitable for all
applications. This is especially true for vehicles with multiple auxiliary power outputs or
applications that do not have access to high-purity hydrogen or corresponding charging
infrastructure. For these applications, the robust H2-ICE powertrain or, if necessary, a highly
efficient Diesel drive is the optimal CO2-free or low-CO2 solution.
The analysis of the WtW-CO2 balances in Figure 9 shows that the blue hydrogen pathway
is CO2 favorable in the heavy-duty vehicle as well, if the H2 generation in Germany with
ordinary electricity mix is assumed. Furthermore, a vehicle with H2 combustion engine with
blue hydrogen would offer about 45 % lower CO2 emissions (WtW) than a diesel powertrain.
2030 Well to Wheel CO2e [g/km] 2030 Electricity Mix
220 g CO2e/kWh
1400
Renewable Mix
24 g CO2e/kWh
1200 1142
1054
Electrolysis-GER-E-Mix
1000 906 Electrolysis-GER-ReNew
836
CCH4-Pyrolysis-GER-E-Mix
800 720
CCH4-Pyrolysis-GER-ReNew
549 SSMR+CCS-GER-E-Mix
600
435 SSMR+CCS-GER-ReNew
395
400 343 SSMR-GER-E-Mix
313 278
262 272 SSMR-GER-ReNew
191 208
200 151 Electrolysis LH2-MENA-ReNew
31 BEV-GER-E-Mix
0 BEV-GER-ReNew
H2-ICE H2-FCEV BEV Diesel
Diesel-fossil
Figure 9: CO2 emissions WtW for general and renewable electricity mix in 2030
For 2030, centralized generation of hydrogen with renewable electricity mix is foreseeable,
which significantly reduces equivalent emissions for the electrolysis and methane pyrolysis
processes. With blue hydrogen, the two hydrogen powertrains produce an additional CO2e-
consumption of 35 to 117 g/km compared to a battery vehicle charged with German 2030
electricity mix. Furthermore, it can be seen in Figure 9 that with renewably produced MENA
hydrogen, the equivalent WtW-CO2 emissions can be between 87 and 127 g/km lower than
17 42nd International Vienna Motor Symposium 202118-
for a battery vehicle charged with ordinary electricity mix, depending on the powertrain
system. Only if the BEV is also charged locally with real renewable electricity the WtW-CO2
emissions be reduced to values of about 30 g/km, which is unattainable for any hydrogen
application. It can also be stated, that already in TtW the H2-FCEV has an advantage in
comparison to the H2-ICE.
The Figure 10 shows the CtG-CO2 values for the entire life cycle, which include the
emissions for hydrogen production as well as for the production of the vehicle and powertrain
system and their operation. The basic influences from the WtW-analysis remain also for the
CtG view.
2030 Cradle to Grave CO2e [g/km] 2030 Electricity Mix
220 g CO2e/kWh
1400
Renewable Mix
1190 24 g CO2e/kWh
1200 1102
Electrolysis-GER-E-Mix
1000 962
892 Electrolysis-GER-ReNew
756 CCH4-Pyrolysis-GER-E-Mix
800
CCH4-Pyrolysis-GER-ReNew
597 SSMR+CCS-GER-E-Mix
600
492 SSMR+CCS-GER-ReNew
442
391 369 373
400 328 SSMR-GER-E-Mix
310
238 264 SSMR-GER-ReNew
207
200 126 Electrolysis LH2-MENA-ReNew
BEV-GER-E-Mix
0 BEV-GER-ReNew
H2-ICE H2-FCEV BEV Diesel
Diesel-fossil
Figure 10: CO2 emissions CtG for general and renewable electricity mix in 2030
Thus, the use of grey hydrogen without CCS is still to be avoided from a CO2 point of view.
The combination of those fuels with any hydrogen powertrain is neither with WtW nor CtG
balancing better than a fossil-fueled diesel, which is due to the fossil base and the
occurrence of CO2 in electricity generation. Assuming a target range of 800 km, the BEV
systems have a required battery capacity of over 1,100 kWh, which has a significant impact
on the CO2 footprint. However, since the heavy-duty vehicles have much higher mileage
compared to the LCV and passenger cars, the CO2 impact from the large battery systems
is relativized over the lifetime. Depending on the electricity mix used to charge the BEV, the
hydrogen powertrains may have higher or lower CO2 emissions. If the battery vehicles are
charged with ordinary electricity mix, CtG-emissions increase to 373 g CO2e/km. Only with
domestically produced blue hydrogen and FC-propulsion this CO2 level can be undercut for
the same electricity mix. In contrast, MENA hydrogen can reach significantly reduced CtG-
CO2 emissions compared to BEV's. Only if the battery vehicles are charged with renewable
electricity, these propulsion systems would be the best option in terms of CO2 according to
both WtW and CtG balancing. Looking at the H2-FCEV it can be seen, that also in CtG there
is an advantage to the H2-ICE.
18 42nd International Vienna Motor Symposium 202119-
TCO and manufacturing costs
For the TCO calculation the vehicle retail prices were used as well as for the other vehicles.
The pure manufacturing costs of the powertrains are also shown in the Figure 11. Another
input condition relates to energy and fuel consumption, which was calculated on a tank-to-
wheel basis. Additional charging and refueling losses were not taken into account in the
TCO due to the technology improvements assumed up to 2030.
Due to the ongoing increase in efficiency, the expected additional costs for exhaust
aftertreatment systems, and rising fuel prices (CO2 tax in Germany from 2021), a reduction
in costs for Diesel vehicles cannot be expected. Nevertheless, Diesel powertrains will remain
the most attractive mobility solution from a TCO perspective at least until 2030. Only
purchase incentives, toll reductions and further increasing prices, which were not considered
in this study, can cause a cost advantage for long-haul trucks with hydrogen or battery
powertrain.
TCO – HD-LH, 600 tkm, 5 years [€/km] Production Costs Powertrain and Storage
HD-LH, 800 km range [€]
1,4
2025 2025
1,32 250000
1,29
1,3 1,23 1,25 209.200
1,21
1,18 200000
1,2
1,1
150000
1
100.000
0,9 100000
0,81 66.800
0,8
50000
21.800
0,7
0,6 0
1,4
2030 2030
250000
1,3 1,24
1,2 200000
1,08
1,1 1,02 150000
1 0,94 105.600
0,9 0,91
0,9 0,85 100000
49.750 57.000
0,8
50000 25.200
0,7
0,6 0
H2-ICE-Electrolysis-GER H2-ICE-Electrolysis-MENA H2-ICE H2-FCEV BEV Diesel
H2-FCEV-Electrolysis-GER H2-FCEV-Electrolysis-MENA Premises for number of units:
BEV-2030-E-Mix BEV-2030-ReNewable-Mix H2-ICE: 10 t units/year
H2-FCEV-Stack and BEV-Battery: 500 t units/year
Diesel
Figure 11: TCO and manufacturing costs for HDCV in 2025 and 2030
The additional price of the H2-ICE compared to the Diesel powertrain comes in particular
from the costs of the 700 bar CGH2 storage system. Here, an LH2 tank from 2025 onwards
could possibly reduce the cost difference. The FCEV system is the most expensive, but its
purchase price will fall sharply by 2030. The main reason for this are the scaling effects that
will then set in due to the use of passenger car fuel cells in a modular concept. In BEV
systems, the powertrain costs are mainly driven by the battery size. Due to the range-scaled
1,110 kWh battery, the vehicle price is correspondingly high.
19 42nd International Vienna Motor Symposium 202120- The TCO curve of H2-ICE and H2-FCEV over time in 2025 shows an advantage of 3-5 €ct per km for the H2-ICE. This advantage for the H2-ICE is expected to reverse into a TCO advantage for the H2-FCEV, depending on the rate of decrease of the prices for the FC-systems. The timing of this reversal will also be partly determined by the price of hydrogen over the period 2025-2035. In total, H2-FCEV and BEV are on a similar TCO level in the period 2025-2030. Cheap electricity (< 20 €ct/kWh) and a hydrogen price > 6 €/kg could give the BEV a benefit in TCO. Summary of heavy-duty commercial vehicles In the long-haul sector, the H2-ICE powertrain must go into series production as early as possible in order to be able to leverage a high CO2 reduction potential in the short term at acceptable additional costs compared to Diesel systems. The presumably rapidly decreasing price of the FC powertrains, as well as the further consumption potential, will lead to a widening of the TCO gap between H2-ICE and H2-FC powertrain after 2025. The main focus here is on tank technology, the LH2 technology will offer a significant cost potential. An H2-ICE with mild hybrid and waste heat recovery could close the efficiency gap to the H2-FC powertrain to some extent. The CO2 analysis for WtW and full life cycle shows that hydrogen powertrains can undercut fossil powertrains by a factor of three to four. The hydrogen powertrains are also competitive with the BEV. In terms of CO2, and depending on the electricity mix, both the H2-ICE and the H2-FC even offer a significant potential compared to the BEV powertrains. The TCO balance of this constellation in the period 2025- 2035 will depend on how fast the prices for the FC-systems will fall and how expensive hydrogen can be produced in large scale. For heavy-duty regional delivery tasks, the BEV systems will become more prevalent. Special applications also will benefit in the long term from the largely infrastructural independence of a highly efficient Diesel powertrain and the robustness of ICE´s in general (H2 and Diesel). Overall comparison and conclusion Hydrogen powertrains offer a huge potential to contribute economically and ecologically to a sustainable mobility sector. In 2030 blue hydrogen produced with ordinary electricity mix in Germany has a WtW-CO2 potential of 54 % (H2-ICE) and 72 % (H2-FC) compared to diesel powertrains in the passenger car segment. Analyzing the WtW and full life cycle CO2 emissions, it can be seen that in the passenger car segment, both H2-ICE and H2-FC powertrains can achieve similar levels as BEV´s. With green hydrogen imported from MENA countries, WtW-CO2 emissions can even be reduced to 18 g CO2e/km for the FC system and 30 g CO2e/km for the H2-ICE powertrain. This corresponds to approximately one and two thirds less emissions, compared to a BEV charged with German 2030 electricity mix. Also in terms of TCO, both H2 propulsion systems are 2030 likely even cheaper compared to the battery electric system and almost at the same level as a diesel powertrain. In total, for passenger cars the fuel cell powertrain is the more balanced system, as it can convince with a significantly lower consumption and a smaller tank system both in terms of equivalent CO2 emissions of hydrogen production, as well as with a comparatively low component footprint. Under consideration of the total life cycle emissions, hydrogen powertrains can reach the same CO2 level as an equivalent BEV already in 2030, even if the BEV would be charged with 100 % renewable energy. The advantage of the battery powertrains becomes clear for small and medium vehicle sizes, where excellent life cycle emissions can be achieved with competitive total costs. The challenges are the provision of local renewable charging energy and to improve the environmental impact of the battery system. 20 42nd International Vienna Motor Symposium 2021
You can also read