The Southern Ocean Observing System 2021-2025 Science and Implementation Plan
←
→
Page content transcription
If your browser does not render page correctly, please read the page content below
The Southern Ocean Observing System
        2021-2025 Science and Implementation Plan

The Southern Ocean Observing System is an initiative of the Scientific Committee on Oceanic Research (SCOR) and
                           the Scientific Committee on Antarctic Research (SCAR)

                                                                                                              1
Louise Newman1, Sian Henley2, Eileen Hofmann3, Mike Williams4, Phillippa Bricher1, Alyce Hancock1, Stephen
Ackley5, Joana Beja6, Jilda Caccavo7, Steve Diggs8, Sarah Fawcett9, Peter Fretwell10, Sarah Gille8; Petra Heil11,12,
Laura Herraiz Borreguero13,14, Juan Höfer15, Petra ten Hoopen16, Stefan Kern17, Johnathan Kool18, Delphine
Lannuzel19, Rob Massom11, Matt Mazloff8, Andrew Meijers10, Sebastien Moreau20, Burcu Ozsoy21, Luciano Ponzi
Pezzi22, Benjamin Pfeil23, Marcel du Plessis24, Marilyn N. Raphael25; Jean-Baptiste Sallee26; Oscar Schofield27, Irene
Schloss28, Elizabeth H. Shadwick12,13,14, Sebastiaan Swart24, Esmee van Wijk12,13, Katie Altieri9, Andrés Barbosa29,
Sandra Barreira30, Giorgio Budillon31, Florence Colleoni32, Kim Currie4, Markus Frey10, Santiago Gassó33, Svenja
Halfter19, Kate Hendry34, Will Hobbs12, Rodrigo Kerr35, Piotr Kukliński36, Karen Casciotti37, Torge Martin38, Clive R.
McMahon39, Carlos R. B. Mendes35, Lisa Miller40, Patricia Miloslavich41, Eugene Murphy10, Jun Nishioka42, Antonio
Novellino43, Bastien Y. Queste24, Paola Rivaro44; Andreas Schiller13, Walker Smith45, Craig Stevens4, Zhaomin Wang46

1
 SOOS International Project Office, Institute for Marine and Antarctic Studies, University of Tasmania, Australia;
2School  of GeoSciences, University of Edinburgh, United Kingdom;
3Old Dominion University, Norfolk, VA, USA;

4National Institute of Water and Atmospheric Research, New Zealand;

5
 NASA-CAMEE. UTSA, San Antonio, TX USA,
6Flanders Marine Institute, Belgium;

7Alfred Wegener Institute, Germany;

8Scripps Institution of Oceanography, University of California San Diego, USA;

9Department of Oceanography, University of Cape Town, South Africa;

10British Antarctic Survey, Cambridge, United Kingdom;

11
  Australian Antarctic Division, Australia;
12Australian Antarctic Programme Partnership, University of Tasmania, Australia;

13Commonwealth Scientific and Industrial Research Organization, Australia;

14Centre for Southern Hemisphere Oceans Research, Australia;

15
  Center for Dynamic Research on High Latitude Marine Ecosystems, Chile;
16UK Polar Data Centre, British Antarctic Survey, Cambridge, United Kingdom;

17Integrated Climate Data Center, Center for Earth System Research and Sustainability, University of Hamburg, Hamburg, Germany;

18
  Australian Antarctic Data Centre, Australian Antarctic Division, Australia;
19
  Institute for Marine and Antarctic Studies, Hobart, Australia;
20Norwegian Polar Institute, Tromso, Norway;

21The Scientific and Technological Research Council of Turkey, Polar Research Institute, Turkey;

22Laboratory of Ocean and Atmosphere Studies, Earth Observation and Geoinformatics Division, National Institute for Space Research, São José

   dos Campos, SP, Brazil;
23University of Bergen, Norway;

24Department of Marine Sciences, University of Gothenburg, Sweden;

25
  University of California Los Angeles, Department of Geography, Los Angeles, California;
26Institute Pierre Simon Laplace, National Centre for Scientific Research France, France;

27Department of Marine and Coastal Sciences, Rutgers University, NJ, USA;

28Instituto Antártico Argentino, Centro Austral de Investigaciones Científicas, Universidad Nacional de Tierra del Fuego, Ushuaia, Tierra del

   Fuego, Argentina;
29Natural History Museum, Spanish Research Council, Madrid, Spain;

30Argentine Navy Hydrographic Service-Argentine Navy Meteorology and Marine Glaciology Service;

31Università degli Studi di Napoli Parthenope, Italy;

32National Institute of Oceanography and Applied Geophysics, Italy;

33University of Maryland/NASA, USA;

34University of Bristol, United Kingdom;

35Instituto de Oceanografia, Universidade Federal do Rio Grande - FURG, Rio Grande, RS, Brazil;

36Institute of Oceanology Polish Academy of Sciences, Sopot, Poland;

37
  Department of Earth System Science, Stanford University, Stanford, CA, USA;
38GEOMAR Helmholtz Centre for Ocean Research Kiel, Germany;

39Sydney Institute of Marine Science, New South Wales, Australia;

40Institute of Ocean Sciences, Fisheries and Oceans Canada,

41Scientific Committee on Oceanic Research, College of Earth, Ocean and Atmosphere, University of Delaware, Newark, DE, USA;

42Institute of Low Temperature Science, Hokkaido University, Japan;

43
  EMODnet Physics, Italy;
44University of Genova, Italy;

45School of Oceanography, Shanghai Jiao Tong University, Shanghai, China;

46College of Oceanography, Hohai University, Nanjing, China

                                                                                                                                            2
3
Executive Summary

The Southern Ocean plays a central role in the Earth System by connecting the Earth’s ocean basins, and
is a crucial global link between the deep ocean, surface ocean and atmosphere. As a result, the ongoing
changes in the Southern Ocean impact global climate, the stability of the Antarctic ice sheet (AIS) and
thus sea level, ocean-atmosphere interactions, biogeochemical cycles and ecological systems. Yet,
understanding of the causes and consequences of these changes is limited by the short and incomplete
nature of observations.

To address this issue, sustained, integrated and multidisciplinary observations are needed. This requires
international agreement on the priority observations to be collected, and also internationally
coordinated data management and delivery. The Southern Ocean Observing System (SOOS) was
initiated in 2011 to support these efforts. In the last decade, SOOS has enhanced regional coordination
and observing system capabilities through network development, data curation and publication,
developed data discovery and coordination tools, and provided strong advocacy mechanisms for the
Southern Ocean community.

However, significant data gaps remain in observations of the ice-affected ocean, sea-ice habitats, the
ocean at depths >2000 m, the air-ocean-ice interface, biogeochemical and biological variables, and for
seasons other than summer. Four core Science Themes (1-4) and one Cross-Cutting Theme (5) have
been identified, each encompassing a number of Key Science Challenges, which provide a framework for
coordination of international data collection and delivery efforts that will contribute to understanding
and quantifying the state and variability of:

    1.   Southern Ocean cryosphere
    2.   Southern Ocean circulation
    3.   Southern Ocean carbon and other biogeochemical cycles
    4.   Southern Ocean ecosystems and biodiversity
    5.   Southern Ocean air-sea-ice fluxes

Addressing the data gaps across these inherently interconnected themes, sustainably and systematically
requires parallel advances in coordination networks, cyberinfrastructure and data management tools,
observational platform and sensor technology, and development of internationally agreed sampling and
analytical standards and requirements of key variables. In recognition of this, SOOS has also identified a
number of Foundational Capabilities that require support in the coming years.

This Science and Implementation Plan articulates the scientific priorities that will be used to focus SOOS
efforts over the next five years (2021-2025), with emphasis on observational capabilities required to
support data collection and delivery, and the implementation objectives and actions that SOOS will
support and undertake to achieve these objectives.

                                                                                                         4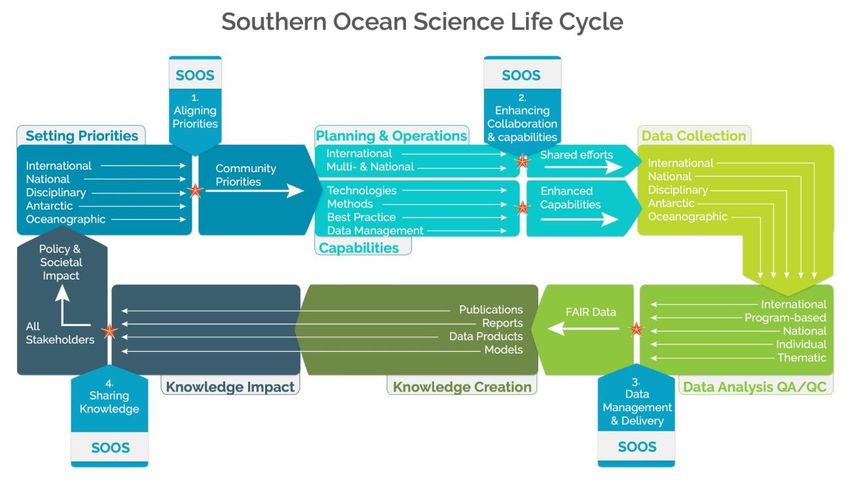
Introduction
The importance of the Southern Ocean in the operation of the Earth System has been clearly recognised
(e.g., IPCC, 2019; Meredith et al., 2019). The Southern Ocean occupies a central position in the global
ocean circulation system and is critical for the mixing, storing and distribution of ocean heat, salt and
dissolved constituents throughout Earth’s ocean basins, influencing ocean processes at the global scale.
Air-sea fluxes of momentum, heat and freshwater, carbon dioxide and other dissolved gases across the
Southern Ocean regulate global climate and oceanic processes on short and long timescales. The
Antarctic cryosphere (comprising sea ice and its snow cover, the ice sheet and icebergs) exerts a strong
control on Southern Ocean physics, chemistry and biology, as well as large-scale atmospheric processes
and the Earth’s radiative heat budget. Southern Ocean ecosystems are globally important for resident
and migratory organisms, in global biogeochemical cycles and productivity, and contribute to global
ocean health, biodiversity, and ecosystem services.

The Southern Ocean is changing in response to climate change and variability and is also modulating this
climate change and variability through a series of complex ice-ocean-atmosphere-ecosystem feedbacks.
Warming atmospheric and oceanic temperatures, melting ice, and subsequent ocean freshening are
modifying ocean circulation and structure; these changes, coupled with changes in nutrient distributions
and light availability, are impacting the productivity and functioning of marine ecosystems. Short-term
variability and longer-term changes in air-sea carbon dioxide (CO2) fluxes are altering ocean chemistry
and driving ocean acidification, with profound implications for marine ecosystems within and beyond
the Southern Ocean.

The critical role of the Southern Ocean in the Earth System highlights the need for a coordinated
approach to designing and implementing sustained, integrated observing systems for the delivery of
data and data products to all stakeholders, through a data management system that follows FAIR data
principles (i.e. Findable, Accessible, Interoperable, Reusable; Wilkinson et al., 2016). These data and
observational needs provided the basis for establishing the Southern Ocean Observing System (SOOS) as
a coordinating body to enhance and ensure the delivery of Southern Ocean data across nations,
organizations, programs and stakeholders, and to provide the infrastructure for organization of
community networks to develop sustained observing systems and syntheses of existing Southern Ocean
data sets.

SOOS is a joint initiative of the Scientific Committee on Oceanic Research (SCOR) and the Scientific
Committee on Antarctic Research (SCAR). The myriad of programs that focus on particular aspects of the
Southern Ocean is extensive and covers both the Antarctic community (traditionally focused south of
60ºS and coordinated predominantly by SCAR and the Antarctic Treaty System (ATS)), and the
oceanographic community (traditionally focused north of 60ºS and coordinated predominantly by SCOR
and the Intergovernmental Oceanographic Commission (IOC)). SOOS bridges these two communities
and builds networks that integrate across the historical boundaries.

SOOS was officially launched in August 2011 with the opening of the International Project Office (IPO),
hosted by the Institute of Marine and Antarctic Studies at the University of Tasmania, Australia. Since
then, SOOS has built a strong global network of community-driven initiatives and tools that combine to
deliver a system of sustained observations for the Southern Ocean.

                                                                                                          5
SOOS Achievements
 SOOS builds collaborative networks and products that align priorities, support shared resources and remove
 barriers, in order to enhance the delivery of Southern Ocean observational data. Towards this end, over the last
 decade SOOS has worked with the broader community to:

 Align, advocate and support scientific and observational priorities through publications, research
 endorsement, alignment of observing system requirements and other advocacy actions:
 Delivered 63 peer-reviewed scientific publications (1257 citations); held 70 international SOOS workshops and
 meetings; and presented at over 150 international meetings; Endorsed 32 successfully funded research
 programs; delivered workshops and publications on observing system design

 Ensuring the management and delivery of observational data by connecting data repositories,
 rescuing unpublished data, and encouraging the use of FAIR data principles:
 Provided direct access to over 49,200 individual datasets; increased single-point access to conductivity,
 temperature, depth (CTD) data by over 18,000 deployments; aggregated metadata for 800 Southern Ocean
 moorings; acted as a unique connector of polar and oceanographic data communities

 Enhancing collaboration and observational capabilities by building integrative networks, developing
 collaborative tools, supporting capacity development opportunities, and facilitating efficiencies in
 sensor, platform and data technologies:
 Delivered 23 international networks (> 1,100 members from 33 nations) with strong ECP engagement in SOOS
 (32% of members); delivered ECP leadership opportunities (14 since 2011); engaged with 85% of nations with
 DAP; SCAR defined); ensured DAP representation in leadership positions (17 positions); Delivered products and
 networks for collaboration (e.g, DueSouth, 17 newsletters, and National Networks); Provided information on
 over 380 Southern Ocean voyages; Connected SOOS with analogous communities (e.g,. atmospheric, fishing,
 tourist, modelling, Arctic); supported the advancement of sensor-based networks (e.g., NECKLACE, AUV),
 publication of platform-based priorities (e.g., Pope et al., 2016) and development of best practice documentation
 (e.g., POLDER TT)

 Sharing knowledge within the Southern Ocean community and beyond, to provide visibility and
 enhance the impact of Southern Ocean research and the knowledge created from it, through
 communication strategies, workshops, publications and community coordination efforts:
 Delivered into 6 policy documents; Provided data and knowledge for the Intergovernmental Whaling
 Commission; Collaborated with Commission for the Conservation of Antarctic Marine Living Resources (CCAMLR)
 on data and observational efforts; advocated oceanic flux variables for Global Climate Variables in the Global
 Climate Observing System; contributed to UN Sustainable Development Goals 13 and 14; Coordinated
 development of the Southern Ocean contribution to the UN Decade for Ocean Sciences; and supported the
 Marine Ecosystem Assessment of the Southern Ocean

The scientific focus of SOOS was defined in the Initial Science and Implementation Strategy (Rintoul et
al., 2012) published nearly a decade ago. More recent community efforts (e.g., Newman et al., 2019;
Tanhua et al., 2019a) have updated and refined SOOS priorities. The start of three new SCAR Science
Research Programs also makes it timely for SOOS to update its Science Plan. Aligned with this, the 2016-
2020 SOOS Implementation Plan is concluded, requiring the development of the 2021-2025
Implementation Plan.

                                                                                                                     6
Rather than continue with separate science and implementation plans, a single Science and
Implementation Plan (SIP) is presented here to guide SOOS over the next five years (2021-2025). This SIP
articulates the scientific priorities of the Southern Ocean community, including scientific data and
network requirements, and articulates the role of SOOS in coordinating and delivering these to address
scientific priorities. The important collaborations with external communities and the implementation
pathways required to facilitate activities are outlined. The Strategic Plan included in the SIP defines the
trajectory of actions required to achieve the overall SOOS vision:

“Sustained observations of dynamics and change of the physics, chemistry, biology, and geology of the
     Southern Ocean system should be readily accessible to provide a foundation for enabling the
international scientific community to advance understanding of the Southern Ocean and for managers
                                to address critical societal challenges”

This SIP has been developed by the SOOS Scientific Steering Committee (SSC), working groups and
broader Southern Ocean community members, and includes inputs from SCAR and SCOR projects, as
well as a community of international reviewers.

Mission and Values of SOOS
The SOOS mission is to facilitate the sustained collection and delivery of essential observations of the
Southern Ocean to all stakeholders, through the design, advocacy, and implementation of cost-effective
observing and data delivery systems.

Central to this mission is a set of values that are shared by SOOS and form the basis for our
collaborations with and recommendations to the broader community.

SOOS commits to:
   1. Support and advocate for active engagement with all interested nations, programs,
       organisations and projects across all relevant disciplines, industries, and stakeholders, including
       under-represented groups.
   2. Appropriately invest resources, time, and effort to ensure engagement with and representation
       of the broader Southern Ocean community in SOOS, and actively contribute to efforts to
       improve equity, diversity and inclusion (EDI) in that community.
   3. Contribute to and advocate for the development, adoption, and continual improvement of best
       practices in ocean observing and data management, including sharing of resources and
       knowledge and championing open and FAIR access to data and data products.

                                                                                                         7
Figure 1: The role of SOOS in the Southern Ocean observing life cycle, indicating the value that SOOS delivers to the
community (stars)
The SOOS Science Plan
Overview
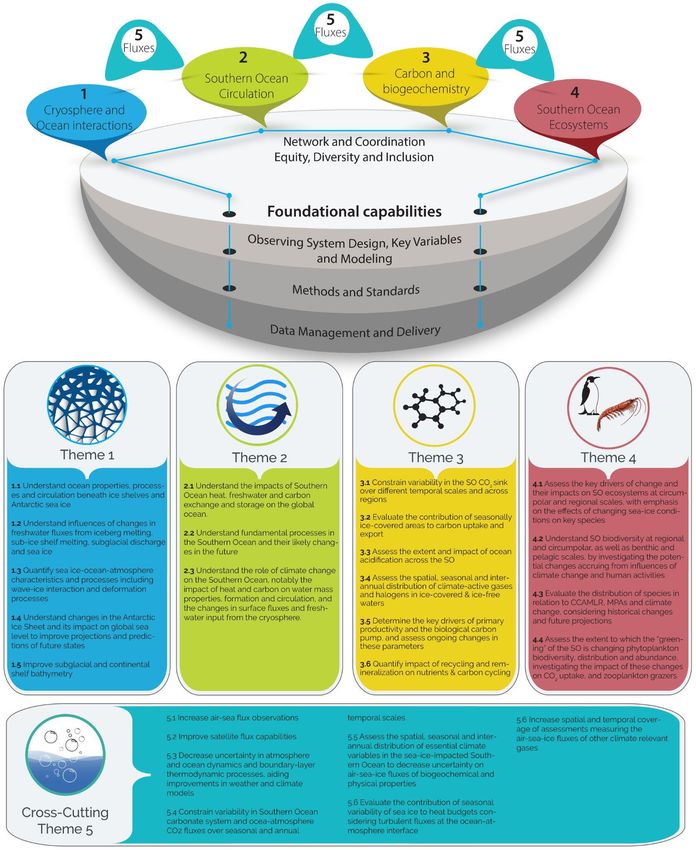
To focus SOOS activities over the next five years, the updated SOOS science structure (Figure 2) includes
five community-agreed Science Themes, which encompass the previous SOOS science priorities to
provide a balanced and integrated framework for coordination, collection and delivery of Southern
Ocean data. For each SOOS Science Theme, Key Science Challenges are identified that articulate specific
priorities of the SOOS community over the next 5 - 10 years and encompass the scientific drivers of a
Southern Ocean observing system. Delivery of the knowledge and scientific outputs that will address
these Challenges is carried out not only by SOOS working groups, but by many community efforts,
including the programs and projects of SCAR and SCOR, among others. SOOS will not duplicate the
efforts of these programs, but will support them where appropriate, to enhance the collection and
delivery of the required data. Acronyms used in the Challenges tables are defined in Appendix 1.
8Figure 2: 5 Science Themes (coloured circles), the key foundational capabilities (grey base layers), including the
SOOS equitable and diverse networks (blue line), all of which are required in order to collect and deliver the data
needed by the scientific community to address the key Challenges encompassed by the Themes.
9Science Themes and Challenges
Theme 1: Understanding and quantifying the state and variability of the Southern Ocean
cryosphere
The Southern Ocean cryosphere comprises sea ice and snow cover, icebergs, marine terminating glaciers
draining the Antarctic Ice Sheet, and ice shelves. Current climate projections of future sea-level rise to
2100 range from 0.45 m (Edwards et al., 2019) to 1.7 m (DeConto and Pollard, 2016), and more accurate
future projections require better understanding of ice shelf-ocean interactions. Observations indicate an
increase in ocean-driven ice-shelf basal melt during the last decade (e.g. Paolo et al., 2015; Rignot et al.,
2013; 2019). As ice shelves melt (thin) and/or decrease in area, their mechanical buttressing of tributary
glaciers is reduced, leading to greater discharge of grounded ice-sheet mass to the ocean (e.g. Fürst et
al., 2016; Reese et al., 2018). The five largest ice shelves in the Amundsen Sea (West AIS) have already
lost around 15% of their volume (Shepherd et al., 2018), modulated by the Amundsen Sea Low (Dotto et
al., 2019) and its connection to tropical Pacific atmospheric variability (Paolo et al., 2018; Dotto et al.,
2019). Contributions of the East AIS to global sea level appear to have accelerated (Rignot et al., 2019),
yet the processes responsible are not clear. The increased glacial meltwater input to the Southern
Ocean has consequences for its stratification, sea-ice cover and heat transport onto the continental
shelves (e.g. Bronselaer et al., 2018; Golledge et al., 2019).
Sea ice, which covers an area of the Southern Ocean ranging seasonally from about 3 million km2 to 19
million km2 (Parkinson, 2019), is key to modulating ocean-atmosphere fluxes; impacts glacial ice
discharge and ice shelf stability (Massom et al., 2018); mediates biogeochemical processes; allows the
formation of water masses that are key for ocean uptake of anthropogenic heat and carbon (Pellichero
et al, 2018); and provides a habitat for marine species (Kennicutt et al., 2019; Newman et al., 2019). The
unprecedented decrease of Antarctic sea-ice extent in 2016, followed by recovery to above historic
mean values in 2020, exemplifies the complexity of the ocean-sea ice-atmosphere system, which is not
represented adequately in forecast nor climate models (Hobbs et al., 2016; Holmes et al., 2019; Beadling
et al., 2020). Several studies identified the atmosphere as the main driver (Holland et al., 2018; Schemm,
2018; Schlosser et al., 2018; Wang et al., 2019; Silvano et al., 2020), while others suggest substantial
oceanic influence (Kusahara et al., 2018; Meehl et al., 2019).
Observing interactions of the ocean with the base of ice shelves is logistically difficult. The lack of
bathymetric data, knowledge of ice-shelf draft, observations of ice-ocean interactions, and ocean
current measurements, limit the characterization of the ocean dynamics, long-term trends (e.g., ocean
warming) and variability. It places a higher dependency on models to understand change and project the
future state of the AIS. Knowledge gaps in sea-ice thickness, motion, deformation, floe-size distribution,
snow depth, and feedback between sea-ice variability and glacial ablation, inhibit reliable quantification
and modelling of the relevant interaction processes impacting the Southern Ocean and the Antarctic Ice
Sheet. This in turn reduces confidence in current model projections of Antarctic sea-ice distribution and
thickness in coming decades (NAS, 2017). Large-scale estimates of Antarctic sea-ice thickness and snow
cover depth are emerging from satellite altimeter data (e.g., Fons and Kurtz, 2019; Kacimi and Kwok,
2020), but these require validation using observations from multiple regions and seasons (Webster et
al., 2018; Boisvert et al., 2020). Relevant feedback processes between ice shelves, icebergs and sea ice
need improved description and quantification (Nihashi and Ohshima, 2015; Merino et al., 2016; Fraser
et al., 2019).
10Advances in understanding drivers of ice-shelf melt (Kennicutt et al., 2014) require direct observations
of basal melt rates, ocean stratification, high resolution bathymetry on continental shelves and within
ice-shelf cavities, ice-shelf draft, and basal topography/roughness. In addition, continuous and multi-
decadal time-series (>10 years) that resolve seasonal and intra-annual water mass and current
variability near ice shelves and under sea ice are needed. Increased use of autonomous technologies
and satellite transmission of the data will decrease the effort and cost involved in monitoring the
transport of ocean heat toward ice-shelf bases. Regular repeat observations of parameters required for
deriving accurate sea-ice volume by autonomous under-ice vehicles, in situ sensors within the sea ice
and snow, and air-borne sensors underneath altimeter overflights are needed to allow routine
evaluation of satellite-derived products using targeted measurements of physical ice and snow
properties.
Table 1: Theme 1 Southern Ocean Cryosphere Key Science Challenges
Challenges International Initiatives Addressing
Challenges
1.1: Understand ocean properties, processes and NECKLACE, FRISP, Argo, ASPeCt,
circulation beneath ice shelves and Antarctic sea ice with INSTANT, AniBOS, SORP, SOFLUX,
emphasis on: SOLAS, CMEMS, AntClimNOW, OASIIS,
● Space and time variability INSTANT, CLIVAR
● Modulation by sea ice and the role of polynas
● Ice loss and ice sheet mass balance
● Heat transfer and freshwater flux between sea
ice/ice shelf and ocean
1.2: Understand influences of changes in freshwater INSTANT, Argo, ASPeCt, BEPSII,
fluxes from iceberg melting, sub-ice shelf melting, CMEMS, AntClimNOW, SORP
subglacial discharge and sea ice
1.3: Quantify sea ice-ocean-atmosphere characteristics ASPeCt, AFIN, Argo, AntClimNOW, CliC,
and processes including wave-ice interaction and CLIVAR, CMEMS, SORP
deformation processes to understand:
● Processes that drive change and variability in the
volume, properties, floe-size and distribution of
Antarctic sea ice and consequent impacts on
atmospheric and oceanic properties and
circulations
● Changes in sea-ice area and volume over
seasonal, annual, decadal, and millennial
timescales
● Dynamics of the Antarctic fast-ice belt and its
role in protecting glacier / ice shelf fronts,
polynya formation/maintenance and water-mass
modification
1.4: Understand changes in the Antarctic Ice Sheet and IODP and ice-sheet drilling projects;
its impact on global sea level to improve projections and IMBIE; ice sheet mass balance
predictions of future states estimates; grounding line retreat rates;
modelling community; INSTANT
111.5: Improve subglacial and continental shelf bathymetry Bedmap3; BedMachine, SOOS AUV TT,
Seabed2030, IBCSO, AniBOS, Argo
(grounded shelf floats)
Theme 2: Understanding and Quantifying the State and Variability of the Southern Ocean
Circulation
The Southern Ocean regulates the global climate by controlling heat, carbon dioxide and other
greenhouse gas exchanges between the atmosphere and the ocean (Rintoul, 2018). Yet, little is known
about the net exchange rates or underlying processes. The central element that impedes our
understanding and our ability to project decadal-to-centennial scale variability and change of ocean heat
and carbon uptake and storage is our lack of understanding of the rate at which waters are ventilated,
i.e. the rate at which water, especially from the deep ocean, reaches the surface and can exchange heat
and carbon with the atmosphere (Marshall and Speer, 2012). The Southern Ocean provides a
preferential pathway for ventilation, with more than 70% of the world’s ocean waters having had their
last contact with the atmosphere in this region (Frölicher et al., 2015). Carbon and heat ventilation
involve two main steps: air-ice-sea fluxes at the ocean surface, and water-mass circulation associated
with the horizontal and vertical currents that form a three-dimensional overturning circulation. Both
processes are sensitive to a range of complex dynamical processes as well as to perturbations of
Southern Hemisphere winds, sea-ice dynamics and glacial melt patterns.
Major advances have been made in developing a sustained observation system of the upper 2000 m of
the northern region of the Southern Ocean, which have led to important progress in documenting
temperature and salinity changes and circulation dynamics, as well as in understanding and attributing
those changes (Meredith et al., 2019). However, many unknowns remain in documenting changes in the
subpolar ocean, on the Antarctic continental shelf and at great depth, below 2000 m, and more
generally in understanding processes controlling the overturning circulation, such as interior mixing,
subduction/upwelling processes and the role of mesoscale/submesoscale eddies. In particular, many
important processes between the ocean and the cryosphere have been identified and highlighted as
central in controlling Southern Ocean water-mass properties and circulation, but these remain poorly
observed and understood (Abernathey et al., 2016; Haumann et al., 2016).
New satellite sensors and autonomous surface, airborne and subsurface instruments promise synoptic
time-series observations of aspects of the freshwater balance, including snow and ice thickness, ice-
shelf basal melt, and ocean circulation, which will provide substantial new information to advance our
understanding of the Southern Ocean environment and fill in existing data gaps (Newman et al., 2019).
However, these observations, particularly satellite-based ones, require validation and calibration against
in situ observations. More generally, they must also be integrated into a holistic observing system
combining ocean hydrographic structure, ocean currents, and air-sea fluxes of heat, carbon, and
momentum. Understanding and predicting the Southern Ocean circulation requires sustained and
widespread observations of temperature, salinity, stratification, and ventilation that enable detection of
changes in the overturning in response to changes in atmospheric forcing. The observations need to
span the entire water column, including under-ice environments, and need to include carbon, oxygen
and other tracers.
12Table 2: Theme 2 Southern Ocean Circulation Key Science Challenges
Challenges International Initiatives Addressing
Challenges
2.1: Understand the impacts of Southern Ocean heat, Argo, BGC-Argo, Deep Argo, GO-
freshwater and carbon exchange and storage on the SHIP, AniBOS, DBCP, SOOP,
global ocean. This includes: OceanSITES, CLIVAR, SORP, SOFLUX,
● Production and export of bottom water SOLAS, IBCSO, CMEMS,
● Upwelling of deep water Seabed2030, AntClimNOW, AniBOS,
● Formation and subduction of mode and SOCONet, OASIIS, SOCCOM, SOCAT
intermediate waters
2.2: Understand fundamental processes in the Southern Argo, BGC-Argo, Deep Argo, GO-
Ocean and their likely changes in the future. This SHIP, AniBOS, DBCP, SOOP,
includes: OceanSITES, CLIVAR, SORP, IBCSO,
● Interior water mass transformation due to Seabed2030, CMEMS, AntClimNOW,
iso/diapycnal mixing OASIIS
● Processes and forcing mediating
upwelling/subduction from the mixed layer
● Role of mesoscale and submesoscale eddies in
setting water mass properties and mediating the
overturning circulation
● Stability of the upper ocean overturning
circulation in response to changes in winds,
increased ice melt and surface warming.
● Response of the ocean circulation to atmospheric
variability (wind, air-sea heat and freshwater
fluxes)
● Stability, variability and future trends in frontal
positions
2.3: Understand the role of climate change on the Argo, BGC-Argo, Deep Argo, GO-
Southern Ocean, notably the impact of heat and carbon SHIP, AniBOS, DBCP, SOOP,
on water mass properties, formation and circulation, and OceanSITES, CLIVAR, SORP, SOLAS,
the changes in surface fluxes and freshwater input from SOFLUX, IBCSO, Seabed2030,
the cryosphere CMEMS, AntClimNOW, AniBOS,
OASIIS
Theme 3: Understanding and quantifying the state and variability of Southern Ocean carbon
and biogeochemical cycles
The Southern Ocean is the Earth’s largest oceanic sink for natural and anthropogenic CO2 (Khatiwala et
al, 2009) and exerts a strong control on global climate and ocean fertility through solubility and
biological carbon pump mechanisms (e.g., Sarmiento and Toggweiler, 1984; Sarmiento et al., 2004). It
additionally regulates the uptake and emission of other climate-active gases such as methane (CH4),
nitrous oxide (N2O) and dimethyl-sulphide (DMS) (e.g., Curran and Jones, 2000; Nevison et al., 2005;
Römer et al., 2014).
13Despite the importance of the Southern Ocean in global biogeochemical cycles and climate, major
uncertainties persist in our understanding of its carbon budget (e.g., Bushinsky et al., 2019). Several
studies suggest that Southern Ocean CO2 uptake declined in recent decades (e.g., Yoshikawa-Inoue and
Ishii, 2005; Le Quéré et al., 2007; Takahashi et al., 2012; Lenton et al., 2013), followed by a
reinvigoration in 2012 (Landschützer et al., 2015). How the Southern Ocean CO2 sink will evolve in the
future remains an open question, especially considering the importance of Antarctic coastal zones as
summer carbon sinks (Monteiro et al., 2020) and winter outgassing south of the Polar Front (Gray et al.,
2018). The full impact of decreased ocean pH (ocean acidification) resulting from enhanced CO2 uptake
is also unclear. Carbonate undersaturation events and their deleterious effects on shelled organisms
have already been observed in the Southern Ocean (Bednaršek et al., 2012) and are predicted to
become more frequent (McNeal and Matear, 2009). Models indicate the shoaling of the aragonite
saturation depth to the surface in some areas of the Southern Ocean by the end of the century
(Negrete-García et al., 2019). Beyond CO2, a benchmark assessment of how biogenic gases, such as CH4,
N2O and DMS, will respond to environmental and biological changes is currently lacking.
Sea ice and glacial meltwater rates will impact biogeochemical processes differently depending on the
region of the Southern Ocean considered (Arrigo et al., 2015; Hernando et al., 2015). Sea ice restricts
light but enhances iron availability. As a consequence, light rather than iron generally limits primary
productivity at the coast, in contrast to offshore waters. That said, increased ice melt will enhance
surface stratification, at least in the short-term, possibly increasing the exposure of phytoplankton to
light. While earlier studies suggested that iron-rich glacial meltwaters supply substantial amounts of iron
to coastal areas (Arrigo et al., 2015; Herraiz-Borreguero et al., 2016), recent studies highlight sediment
resuspension and Circumpolar Deep Water as primary sources of iron to some regions (Dinniman et al.,
2020; St-Laurent et al., 2017). Away from the coast, large-scale ongoing changes driven by changes in
iron and light availability (anong other drivers) are already evident, such as in the Subantarctic Zone and
Permanently Open Ocean Zone where productivity appears to be increasing (i.e., “greening”) (Del
Castillo et al., 2019; Henley et al. 2020; Pinkerton et al., 2021). How the mode, magnitude and bio-
availability of the iron supply to Antarctic waters may change in the future is unknown and needs
quantification.
The biological carbon pump (BCP) is a key mechanism driving the carbon and nutrient cycles at higher
latitudes. How primary productivity (e.g., Leung et al., 2015) and carbon export (Cabré et al., 2015;
Moore et al., 2018) will vary spatially and seasonally remains unclear, especially in ice-covered areas;
this uncertainty is further complicated by knowledge gaps related to the (re-)cycling of nutrients within
the seasonally varying mixed layer (e.g., Fourquez et al., 2020; Mdutyana et al., 2020) and potential
shifts in phytoplankton dynamics (Deppeler and Davidson, 2017). The microbial carbon pump (MCP) also
contributes to carbon sequestration and food-web fluxes (Jiao et al., 2010), yet the response of nutrient
recycling and the MCP to Southern Ocean warming and acidification is uncertain, as is how interactions
between the BCP and MCPs are likely to change (Jiao et al., 2010; Legendre et al., 2015).
Autonomous platforms have greatly enhanced the availability and quality of the carbon and
biogeochemical data available for the Southern Ocean, including for the winter when observations are
particularly scarce. Combined with shipboard observations, data from autonomous instruments have
been used to better constrain the air-sea flux of CO2 and remove potential biases (e.g., T Bushinsky et
al., 2019; Sutton et al., 2021). However, the deployment and recovery of equipment in the Southern
14Ocean, particularly in the seasonal ice zone, is challenging, and only a few long-term observing platforms
have been established in ice-covered areas (e.g., the Palmer Long-Term Ecological Research program).
Marine biogeochemistry still relies heavily on vessel-based observations, which, while critical, yield only
snapshots of system functioning. The BGC-Argo program (Johnson et al., 2017a), ice-capable floats
(Johnson et al., 2017b), tagging of marine mammals by the Marine Mammals Exploring the Oceans Pole
to Pole (MEOP) program (Roquet et al., 2014), and uncrewed surface vehicles (Saildrone; Sutton et al.,
2021), have vastly increased the number and timing of the available observations; their continued and
expanded deployment is critical for observing short- and long-term changes in Southern Ocean carbon
cycling and biogeochemistry. The development and improvement of new satellites (e.g., Sentinel-3) and
in situ sensors (e.g., for nutrients) are necessary to enhance the quantity and quality of Southern Ocean
data. Ship-based programs like Global Ocean Ship-Based Hydrographic Investigations Program (GO-SHIP)
and GEOTRACES also remain essential, both for calibrating autonomous platforms and sensors, making
measurements not currently feasible by sensor or satellite, and for monitoring the Southern Ocean
response to climate change.
Table 3: Theme 3 Southern Ocean Carbon and Biogeochemistry Key Science Challenges
Challenges International Initiatives
Addressing Challenges
3.1: Constrain variability in the Southern Ocean CO2 sink over Global Carbon Project, GO-SHIP,
different temporal scales and across regions IMOS-SOTS, SOFLUX, SOCAT,
SORP, SOLAS, IOCCP
3.2: Evaluate the contribution of seasonally ice-covered areas to IOCCG, BEPSII, BGC-Argo,
carbon uptake and export SOCCOM, SOLAS, IOCCP
3.3: Assess the extent and impact of ocean acidification across GOA-ON, IOCCP
the Southern Ocean
3.4: Assess the spatial, seasonal and interannual distribution of BEPSII, SOLAS, CATCH
climate-active gases and halogens in ice-covered and ice-free
waters
3.5: Determine the key drivers of primary productivity and the GO-SHIP, GEOTRACES, BGC-
Biological Carbon Pump (light, stratification, circulation, and Argo, SOCCOM, SOCLIM, IOCCG,
supply of micro- and macronutrients) and assess ongoing AniBOS
changes in these parameters
3.6: Quantify the impact of recycling and remineralization, GEOTRACES, BGC-Argo, SOCLIM,
including via the Microbial Carbon Pump, on nutrients and SOCCOM
carbon cycling
15Theme 4: Understanding and quantifying the state and variability of the Southern Ocean
ecosystems and biodiversity
The circumpolar Southern Ocean is strongly affected by the seasonal advance and retreat of sea ice,
which in turn contributes to the regional heterogeneity of Southern Ocean food webs (Ducklow et al.,
2006; 2013; Massom and Stammerjohn, 2010). During the past few decades, the oceanic and
cryospheric characteristics of the Southern Ocean have changed with consequences for ecosystems,
such as decreased Antarctic krill abundance in the Atlantic sector (Atkinson et al., 2004; 2019; Meredith
et al., 2019), and changes in primary production and phytoplankton size structure and composition
along the Antarctic Peninsula (Montes-Hugo et al., 2008; 2009; Mendes et al., 2013; 2018; Schloss et al.,
2014; Moreau et al., 2015; Schofield et al., 2017; Ferreira et al., 2020), which have also affected top
predator populations (Trivelpiece et al., 2011; Barbosa et al. 2012,). Such changes have contributed to
regional increases in oceanic CO2 uptake (Brown et al., 2019). Variability in the physical environment can
lead to changes in productivity through biogeochemical linkages (e.g., see Theme 3).
Accurate estimates of biomass in all trophic levels are essential to assess the impacts of climate change
(Murphy et al., 2012; Rogers et al., 2020), as models have already pointed towards cascading impacts on
dependent predators (Xavier et al., 2013) from reduced growth rates in keystone species such as krill
due to warming (Klein et al., 2018). Improved observations of key mid-trophic level species that have a
major influence on food web structure and biogeochemical processes is fundamental for projecting
impacts of change (Murphy et al., 2016). Observations of top predators as sentinels of change (Bestley
et al., 2020) remain critical to assess changes in community structure derived from environmental
stressors, using measures such as diet composition, foraging success, habitat use, reproductive success,
phenology, growth rates, and population stability (e.g., Ducklow et al., 2013; Hinke et al., 2017;
Colominas-Ciuró et al., 2021). Indeed, regional diversity of environmental stressors and their impacts
creates a complex field of “winners and losers” with respect to faunal abundance and distributions
(Clucas et al., 2014).
The challenges posed under this Theme focus on understanding responses of Southern Ocean
ecosystems to climate change and human activities. Past and current harvesting of Southern Ocean
living resources and subsequent recovery of some species further introduce confounding effects in
determining cause and direction of change (e.g., Murphy, 1995). Addressing these challenges requires
sustained observations that capture population trajectories of key species, main components of food
webs, their spatio-temporal changes and/or the overall structure and function of food webs. Increased
observing efforts of mid-trophic level groups, for which major data gaps persist, will require better
standardization of net sampling (Kaartvedt et al., 2020), as well as improved models to convert acoustic
backscatter data (Proud et al., 2019). Key gaps to be addressed in biological observations further include
production beneath sea ice and habitat characteristics, temporal expansion of observations (year-round
and winter series), co-located and co-incident sampling (e.g., net sampling, acoustics, profiles, predator
observations), and measures of diversity and relative biomass of key taxa, links and flux rates.
Monitoring of biodiversity in areas subjected to high variations of both terrestrial and marine
environmental settings is crucial for understanding the impact of rapidly progressing changes.
Observation systems must be integrated end-to-end, from virus, bacteria, archaea and primary
producers to top predators, to provide a quantitative understanding of the impacts of change on
Southern Ocean ecosystems. Such observation systems are integral for developing and constraining
models for Southern Ocean ecosystems.
16Table 4: Theme 4 Southern Ocean Ecosystems and Biodiversity Key Science Challenges
International Initiatives Addressing
Challenges
Challenges
4.1: Assess the key drivers of change and their impacts on CCAMLR, BGC Argo (SOCCOM,
Southern Ocean ecosystems (food webs and SOCLIM), Ant-ICON, ICED, SO-CPR,
biogeochemical cycling) at circumpolar and regional scales, KRILLBASE, MAPPPD, MEASO, AniBOS,
with emphasis on the effects of changing sea-ice AntOBIS/SCAR Antarctic Biodiversity
conditions on key species (e.g., Antarctic krill, upper Portal, SKAG, EG-BAMM
trophic level species)
4.2: Understand Southern Ocean biodiversity at regional Ant-ICON, SO-CPR, MAPPPD, CMEMS,
and circumpolar, as well as benthic and pelagic scales, by AniBOS, AntOBIS/SCAR Antarctic
investigating the potential changes accruing from Biodiversity Portal, EG-BAMM, ICED
influences of climate change and human activities
4.3: Evaluate the distribution of species in relation to SOOS, CCAMLR, ICED, Ant-ICON, SO-
CCAMLR, MPAs and climate change, considering historical CPR, AniBOS, AntOBIS/SCAR Antarctic
changes and future projections Biodiversity Portal, EG-BAMM, ICED
4.4: Assess the extent to which the “greening” of the SO-CPR, AntOBIS/SCAR Antarctic
Southern Ocean is changing phytoplankton biodiversity, Biodiversity Portal, ICED
distribution and abundance, investigating the impact of
these changes on CO2 uptake, and zooplankton grazers
Cross-Cutting Theme 5: Understanding and Quantifying the state and variability of Southern
Ocean Air-Sea-Ice Fluxes
Theme 5 integrates across the other Themes through its focus on fluxes across the ice-ocean-
atmosphere interfaces and the implications for physical, biogeochemical and biological exchanges.
These fluxes manifest in each of Theme 1-4, as well as throughout this Cross-Cutting Theme, reflecting
the integrated nature of the system. Southern Ocean fluxes of heat, freshwater, carbon and important
climate-relevant gases (such as CO2) are key components of the global ocean and climate system. The
Southern Ocean heat uptake now accounts for 75±22% of the total oceanic heat uptake and ~40% of the
global oceanic uptake of anthropogenic CO2 (Frölicher et al., 2015).
Attribution of the processes leading to increased Southern Ocean heat uptake is currently lacking
(Meredith et al., 2019), mainly because in situ measurements of the ocean-atmosphere turbulent fluxes
are sparse and often non-existent (Garzoli et al., 2013; Swart et al., 2019). As a consequence, accurate
estimates of turbulent heat fluxes are difficult to obtain (Villas Bôas et al., 2015; Santini et al., 2020),
which leads to large differences among existing satellite-reanalysis heat flux products (Bourassa et al.,
2013; Pinker et al., 2014; Swart et al., 2019). This has led to a knowledge gap that increases uncertainty
in atmosphere and ocean dynamics and boundary-layer thermodynamic processes, retarding
improvements in weather and climate models (Swart et al., 2019). No less important is understanding
17how the fluxes of CO2 and other climate-relevant trace gases (e.g., N2O, CH4, DMS and isoprene) behave
at the ocean-ice-atmosphere interface of the Southern Ocean. Considerable uncertainty remains, due to
the lack of measurements spatially and temporally and the variety of methodologies used to obtain the
fluxes. Accurate flux measurements also contribute to the reduction of uncertainties in the global
balances of heat and climate relevant gases such as CO2. Major challenges exist to understand the
behavior of turbulent fluxes and reduce the uncertainties in knowledge obtained through studies based
on physical parameterizations and through satellite data. Many of the transfer coefficients used in these
flux parameterizations are from studies based on in situ measurements (Hackerott et al., 2018; Bharti et
al., 2019; Santini et al., 2020). Furthermore, the short time- and length-scale variability of air-sea fluxes
makes quantifying exchanges challenging (Lenton et al., 2006; Monteiro et al., 2015), particularly in
regions with varying ocean-atmosphere dynamics including boundary currents (e.g., Agulhas Return
Current, Villas-Bôas et al., 2015), regions of higher energetics (e.g., Drake Passage), and the sea-ice zone
(Mazloff et al., 2018; Swart et al., 2020).
Progress in addressing these challenges depends on international agreement of effective and best
practice methodologies, priorities on observations (essential climate variables and sites) and
observational strategies (Swart et al., 2019). It is essential to have a robust observation system
operating year round as many observation points are made only during spring and summer. The
absence of a year-round observational system greatly reduces the chances of sampling the seasonal
behavior of fluxes and essential climate variables, as well as the extreme events often missed by bulk
formulas for the Southern Ocean, which, ultimately, will reduce bias between direct observations and
bulk formulas (Santini et al., 2020). Improved flux estimates across both the ice-free and ice-covered
Southern Ocean will need to identify and improve observing system design (e.g., Mazloff et al., 2018;
Wei et al., 2020) as well as take advantage of ships, coastal research stations, surface moorings, and the
growing capabilities of autonomous platforms such as Saildrones and Wave Gliders (Monteiro et al.,
2015; Sutton et al., 2021). These technological advancements have created the opportunity for process
studies under various atmospheric conditions and at times of the year otherwise not suited for ship
expeditions. These comparatively low cost platforms justify targeted field campaigns that measure flux
variables at length scales of order 1 km and time scales of hours (e.g., Swart et al., 2020).
Table 5: Cross-Cutting Theme 5 Southern Ocean Fluxes Key Science Challenges
Challenges International Initiatives
Addressing Challenges
5.1: Increase air-sea flux observations with emphasis on: SOFLUX, OASIS, CMEMS,
● Varying conditions imposed by wind patterns, storms SORP, CATCH, SOLAS,
and sea state OceanSITES, SOOP
● Regions and times (winter) of high uncertainty in
reanalysis products
● Areas covered by sea ice and influenced by
polynyas/leads
5.2: Improve satellite flux capabilities to SOFLUX, Satellite Programs,
● Develop reliable retrievals of turbulent heat fluxes, CMEMS, SOLAS
especially in high winds and sea state
18● Improve freshwater flux retrievals for regions with
variable ice-induced freshwater inputs
5.3: Decrease uncertainty in atmosphere and ocean dynamics WCRP, OASIS, CMEMS,
and boundary-layer thermodynamic processes, aiding AntClimNOW, AniBOS, SOLAS
improvements in weather and climate models
5.4: Constrain variability in Southern Ocean carbonate system SOCCOM, BGC-Argo, SOLAS,
and ocean-atmosphere CO2 fluxes over seasonal and annual SOOS task group on
temporal scales acidification, OASIS, CMEMS,
SORP
5.5: Assess the spatial, seasonal and interannual distribution of BEPSII, OASIS, SOLAS, SOFLUX,
essential climate variables in the sea-ice-impacted Southern CMEMS, ASPeCt,
Ocean (e.g., the marginal sea-ice zone) to decrease uncertainty AntClimNOW, AniBOS, SORP,
on air-sea-ice fluxes of biogeochemical and physical properties CATCH
5.6: Evaluate the contribution that seasonal variability of sea WCRP, AntClimNow, OASIS,
ice makes to heat budgets, considering turbulent fluxes at the SOFLUX, CMEMS, ASPeCt,
ocean-atmosphere interface AniBOS, SOLAS
5.7: Increase spatial and temporal coverage of assessments SOLAS, AntClimNow, WCRP,
measuring the air-sea-ice fluxes of climate relevant gases OASIS, SOFLUX, CMEMS,
(other than CO2, e.g., N2O, CH4, DMS, halogens, Isoprene) BEPSII, ASPeCt, CATCH
Societal Impact
Addressing the SOOS Science Themes and the Challenges within and across Themes will lead to tangible
societal impacts, including delivering into the UN Sustainable Development Goals and the Vision, Key
Societal Outcomes and Key Priority Areas of the UN Decade of Ocean Science for Sustainable
Development. SOOS activities will also support evidence-based decision-making within the ATS, in
particular its Committee for Environmental Protection (CEP) and the Commission for the Conservation of
Antarctic Marine Living Resources (CCAMLR). Maximising connections to the SOOS governing bodies,
SOOS objectives are well-aligned with the vision and priorities arising from the SCAR Horizon Scan
(Kennicutt et al., 2014), and the overarching purpose and defined functions of SCOR, both of which have
a strong focus on delivering science for global societal benefit. SOOS activities also support national
priorities in Southern Ocean observing, science and environmental management. The broad,
multidisciplinary and integrated approach promoted and coordinated by SOOS will continue to facilitate
the efficient and effective delivery of high-priority observational data and translation of science outputs
into genuine societal outcomes. These outcomes will be delivered from each of the SOOS Science
Themes, and will include, for example, the role of Southern Ocean ecosystems in global biodiversity and
food security, Southern Ocean processes in global climate regulation, and the Antarctic cryosphere in
the functioning of the Earth System.
19Implementation Framework
Foundational Capabilities
In addition to defining science priorities, SOOS recognises the importance of enhancing our ability to
collect, manage and use observational data. The SOOS Foundational Capabilities (shown in Figure 2)
provide the framework to enable these efforts.
Observing System Design, Key Variables and Modelling
Observing System Design
Methods exist to design and prioritize an observing system in order to determine the minimum number
of observations required to constrain a given quantity of interest (e.g., Observing System Simulation
Experiment, OSSE). These tools provide a quantitative estimate of the value of ocean observations with
respect to how well they deliver the goals of the observing system. This information is important to
prioritise allocation of data collection resources, justify required funding, and ensure delivery of the
knowledge required from the observations collected. In the five years covered by this SIP, the SOOS
Observing System Design working group (OSD WG) will coordinate and deliver SOOS contributions to
advance this Foundational Capability.
The OSD WG aims to advance the knowledge and tools used in designing optimal observing systems,
and to consult with stakeholders to assess current inadequacies in the observing system and prioritize
instrumentation. Activities include assessment of correlation scales, mapping methods, and times of
emergence. Activities also consist of planning and carrying out OSSEs, including assessments of the
“nature” model run used in these experiments as the quality of these nature runs limits the value of the
OSSE results. This working group also plays an advisory role within SOOS and the broader Southern
Ocean community, providing guidance on OSD methodologies and capabilities (e.g., the role of OSD WG
in the Animal-Borne Ocean Sensor (AniBOS - previously MEOP) network (GOOS-252) or engaging in
research efforts that further the use, impact or uptake of OSD methods (e.g., Wei et al., 2020). The aim
of the working group is to gather data through the methods described above to be combined with
human intuition and experience to make maximum use of our human and material resources.
Key Variables
The Framework for Ocean Observing (Lindstrom et al., 2012) provided an internationally agreed
collaborative mechanism for prioritising and integrating efforts to observe the global oceans. Over the
last decade, the global oceanographic community (led by the Global Ocean Observing System, GOOS)
has worked to identify essential ocean variables (EOVs) that are relevant to addressing key societal
issues (e.g., climate, operational ocean services, ocean health), technically feasible to observe using
proven methods, and are cost effective to collect, manage and deliver through existing data archiving
processes (Tanhua et al., 2019b). SOOS was involved in several of these efforts; providing input into
global surveys, workshops and advocating for inclusion of air-sea flux variables into the Essential Climate
Variables (ECVs) scheme that aligns with EOVs. Many of the GOOS-derived EOVs are also central to
20SOOS, however, the global scale of the GOOS perspective means some Southern Ocean-specific aspects
are missing. This is especially true for ecosystem variables and resulted in a SOOS-led initiative to
identify a process for determining ecosystem EOVs for the Southern Ocean (e.g., Constable et al., 2016).
Looking forward, SOOS will prioritise its support for data collection, management and delivery around a
set of key variables that are required to address the science themes, which will include the GOOS EOVs,
the global ECVs and some Southern Ocean specific variables. These key variables will be identified
through iterative, community engagement, driven predominantly by the SOOS working groups. The
current key variables are shown in Appendix 2.
Modelling
Over the past decades, the ocean modelling community has made significant advances in simulating
Southern Ocean processes and systems. High-resolution circulation models coupled with sea-ice and ice-
shelf models have been implemented at regional (Graham et al., 2016; Naughten et al., 2018) and
circumpolar scales (Mazloff et al., 2010; Dinniman et al., 2020). Biogeochemical models, coupled with
circulation models, have been implemented at regional (Salmon et al., 2020; Twelves et al., 2021) and
circumpolar scales (Lovenduski et al., 2015; Verdy and Mazloff, 2017). These models have been used to
project regional circulation and biogeochemical responses to changes in environmental forcing (e.g.
Gwyther et al., 2014; Smith et al., 2014; Dinniman et al., 2018). However, even with advances in
dynamical understanding and increased observations, many processes in these models remain poorly
represented, such as mesoscale and sub-mesoscale eddy fluxes, bottom water formation and export,
and oceanic circulation and basal melting within ice shelf cavities (Utolia et al., 2017; Beadling et al.,
2020). The regional and circumpolar circulation models have also provided the basis for simulating
population connectivity (Pinones et al., 2013; Pinones et al., 2016; Thorpe et al., 2019) and for assessing
projected changes (Pinones and Federov, 2016). Coupling food webs, especially upper trophic levels,
with circulation to accurate physical and biogeochemical models remains to be done (Murphy et al.,
2012). Modelling of Southern Ocean food webs tends to focus on regional implementations because of
the heterogeneity of these systems and because of the extensive data requirements of these models
(Murphy et al., 2012; Constable et al., 2014).
Even with the many advances in models developed for Southern Ocean systems, understanding of key
coupled physical, chemical and biological drivers of change and their impacts is limited or lacking.
Understanding and quantifying the impacts of multiple and synergistic drivers are critical for
parameterization, calibration and validation of modelling studies (Constable et al., 2016; Asay-Davis et
al., 2017; Russell et al., 2018; Malyarenko et al.,2020). While the mandate of SOOS does not explicitly
include model development and implementation, SOOS recognizes the critical need to integrate
observations with models.
To this end, SOOS’s role is to enhance and expand observational capability and deliver observations in a
manner to support modelling studies, especially those that focus on projections of future states. Thus,
the provisioning of observations with sufficient space and time resolution to validate process
parameterizations, constrain models, and to develop scenarios is a priority for SOOS in its next phase.
Further, SOOS recognises the potential for model findings to be used to guide observational needs and
to optimise OSD. SOOS will continue to work with programs such as ICED (Integrated Climate and
Ecosystem Dynamics) and SORP (CliC/CLIVAR/SCAR Southern Ocean Regional Panel), and other
21You can also read