Phytoplankton and dimethylsulfide dynamics at two contrasting Arctic ice edges
←
→
Page content transcription
If your browser does not render page correctly, please read the page content below

Biogeosciences, 17, 1557–1581, 2020
https://doi.org/10.5194/bg-17-1557-2020
© Author(s) 2020. This work is distributed under
the Creative Commons Attribution 4.0 License.

Phytoplankton and dimethylsulfide dynamics at two
contrasting Arctic ice edges
Martine Lizotte1 , Maurice Levasseur1 , Virginie Galindo2 , Margaux Gourdal1 , Michel Gosselin2 ,
Jean-Éric Tremblay1 , Marjolaine Blais3 , Joannie Charette4 , and Rachel Hussherr1
1 Département   de biologie, Québec-Océan, Université Laval, Québec, Quebec, G1V 0A6, Canada
2 Institutdes sciences de la mer de Rimouski (ISMER), Université du Québec à Rimouski, Rimouski,
Quebec, G5L 3A1, Canada
3 Maurice Lamontagne Institute, Fisheries and Oceans Canada, Mont-Joli, Quebec, G0J 2L0, Canada
4 Fisheries and Oceans Canada, Winnipeg, Manitoba, R3T 2N6, Canada

Correspondence: Martine Lizotte (martine.lizotte@qo.ulaval.ca)

Received: 19 October 2019 – Discussion started: 25 October 2019
Revised: 7 February 2020 – Accepted: 12 February 2020 – Published: 26 March 2020

Abstract. Arctic sea ice is retreating and thinning and its rate   DMSP (< 16 nmol L−1 ), and DMS (< 0.4 nmol L−1 ), de-
of decline has steepened in the last decades. While phyto-         spite the nutrient-replete conditions characterizing the sur-
plankton blooms are known to seasonally propagate along            face waters. The increase in autotrophic biomass and methy-
the ice edge as it recedes from spring to summer, the substi-      lated sulfur compounds took place several kilometers (ca.
tution of thick multiyear ice (MYI) with thinner, ponded first-    100 km) away from the MYI edge, suggesting the requisite
year ice (FYI) represents an unequal exchange when consid-         for ice-free, light-sufficient conditions for a phytoplankton
ering the roles sea ice plays in the ecology and climate of        bloom to fully develop and for sulfur compound dynamics
the Arctic. Consequences of this shifting sea ice on the phe-      to follow and expand. In light of the ongoing and projected
nology of phytoplankton and the associated cycling of the          climate-driven changes to Arctic sea ice, results from this
climate-relevant gas dimethylsulfide (DMS) and its precursor       study suggest that the early onset of autotrophic blooms un-
dimethylsulfoniopropionate (DMSP) remain ill constrained.          der thinner, melt-pond-covered ice may have vast implica-
In July–August 2014, two contrasting ice edges in the Cana-        tions for the timing and magnitude of DMS pulses in the
dian High Arctic were explored: a FYI-dominated ice edge in        Arctic.
Barrow Strait and a MYI-dominated ice edge in Nares Strait.
Our results reveal two distinct planktonic systems and asso-
ciated DMS dynamics in connection to these diverging ice
types. The surface waters exiting the ponded FYI in Barrow         1   Introduction
Strait were characterized by moderate chlorophyll a (Chl a,
 < 2.1 µg L−1 ) as well as high DMSP (115 nmol L−1 ) and           The rapid warming of the Arctic represents one of the most
DMS (12 nmol L−1 ), suggesting that a bloom had already            conspicuous impacts of global change driven by human ac-
started to develop under the markedly melt-pond-covered            tivities (IPCC, 2013). This warming has already translated
(ca. 40 %) FYI. Heightened DMS concentrations at the FYI           into widespread and profound modifications in hydrological
edge were strongly related to ice-associated seeding of DMS        and ecological systems including, but not limited to, those
in surface waters and haline-driven stratification linked to ice   related to sea ice dynamics. Reductions in snow cover, in the
melt (Spearman’s rank correlation between DMS and salin-           minimum sea ice cover in summer and in the occurrence of
ity, rs = −0.91, p < 0.001, n = 20). However, surface wa-          multiyear (MYI) ice are afoot and hastening (Rothrock et al.,
ters exiting the MYI edge at the head of Nares Strait were         1999; Serreze et al., 2007; Stroeve et al., 2007, 2008; Comiso
characterized by low concentrations of Chl a (< 0.5 µg L−1 ),      et al., 2008; Serreze and Stroeve, 2015; Bokhorst et al., 2016;
                                                                   AMAP, 2017). If warming continues unmitigated, a summer

Published by Copernicus Publications on behalf of the European Geosciences Union.
1558                                                  M. Lizotte et al.: Arctic phytoplankton and dimethylsulfide dynamics

ice-free Arctic Ocean is predicted to occur during the sec-       isms, however, and has also been found in marine bacterio-
ond half of this century (Wang and Overland, 2012). In po-        plankton which can both produce it and break it down (Cur-
lar regions, primary production is driven by light and nutri-     son et al., 2017). DMSP holds several roles in unicellular
ent availability (Loeng et al., 2005; Arrigo, 2014), which are    algae including osmoregulation, cryoprotection, scavenging
heavily influenced by the presence of sea ice. Seasonally, the    of free radicals, and overflow of carbon and sulfur (Stefels
first autotrophic organisms to benefit from the vernal increase   et al., 2007). The production of DMSP by unicellular algae
in light in the Arctic are ice algae that develop mainly in the   is highly species-specific with Bacillariophyceae and Dino-
bottom ca. 2–5 cm of the ice (Gradinger, 2009; Galindo et         phyceae/Prymnesiophyceae being lesser and greater produc-
al., 2014; van Leeuwe et al., 2018). During this period, light    ers, respectively (Keller et al., 1989). The DMSP-to-DMS
intensities under thick ice are commonly too low to allow         conversion involves the entire microbial food web, and part
phytoplankton growth; however blooms may develop in ice-          of the DMS is produced directly by phytoplankton while an-
free waters in long narrow bands (20–100 km) trailing along       other part is produced indirectly via the release of DMSP
the ice edge (Sakshaug and Skjoldal, 1989). These ice-edge        in the aqueous environment and its subsequent degradation
blooms could account for up to 50 % of the annual primary         by bacterioplankton (Kiene et al., 2000; Simó, 2001; Stefels
production in the Arctic Ocean (Perrette et al., 2011) and        et al., 2007). The relative importance of these processes is
represent the greatest supply of energy to the marine Arc-        unclear; however abiotic stressors involving sudden modifi-
tic ecosystem (Wassmann et al., 2008). Later in the growing       cations in light intensity, salinity, and temperature may all
season, phytoplankton blooms can also develop under the ice       contribute to the enhanced direct and indirect production of
as light penetration through the ice pack is heightened due       DMS by plankton communities (Sunda et al., 2002; Toole
to snow melting, ice thinning, and the development of melt        and Siegel, 2004).
ponds (Fortier et al., 2002; Mundy et al., 2007; Arrigo et al.,      In the Arctic, peaks in atmospheric methane sulfonic acid
2012; Galindo et al., 2014). The gradual loss of perennial        (MSA, a DMS proxy) have frequently been measured in
sea ice, induced by climate change, is thus expected to in-       spring and in midsummer (Sharma et al., 2012). The spring
fluence the phenology of ice-edge blooms and the associated       peaks have been attributed to phytoplankton blooms at low
biogeochemical cycling of elements such as carbon, nitro-         latitudes while the midsummer peaks have been related to
gen, and sulfur. Based on data from an under-ice bloom from       more localized high-latitude ice-edge blooms (Sharma et al.,
the Chukchi Sea (Arrigo et al., 2012), a modeling study by        2012; Becagli et al., 2016, 2019). This interpretation is con-
Palmer et al. (2014) shows that a 10 % melt pond cover at the     sistent with the elevated DMS concentrations generally mea-
surface of the ice pack could provide sufficient light to sus-    sured at or close to ice edges in association with develop-
tain the growth of shade-adapted algae under the ice. While       ing phytoplankton blooms in the North Atlantic and Euro-
conditions required for under-ice blooms were likely scarcer      pean sectors of the Arctic (Matrai and Vernet, 1997; Galí
no more than 20 years ago, another modeling study found           and Simó, 2010; Park et al., 2018). The high DMS concen-
that nearly 30 % of the ice-covered Arctic Ocean may now          trations measured at ice edges have been associated with a
support the formation of under-ice blooms during the month        combination of factors including (1) an increase in phyto-
of July (Horvat et al., 2017).                                    plankton biomass and hence DMSP concentrations, (2) the
   Ice-covered seas not only shape marine food webs but they      selective growth of strong DMSP and DMS producers such
also influence ocean–atmosphere exchanges of energy, par-         as the Prymnesiophyceae Phaeocystis, (3) a physiological
ticles, and gases, including the climate-cooling compound         stimulation of DMS production due to the increase in irra-
dimethylsulfide (DMS) (Levasseur, 2013; Gabric et al.,            diance, and (4) an increase in bacterial activity (Galí and
2018). In the remote marine atmosphere, ocean-originating         Simó, 2010). In the eastern Canadian High Arctic, only a
DMS represents the greatest gaseous precursor of sulfur-          fragmented picture of summer oceanic DMS distributions
containing aerosols (Bates et al., 1992; Andreae and Crutzen,     was available until recently and none of the snapshots cap-
1997). Sulfate aerosols may play an important role in the         tured the presumably most biologically productive time of
Earth’s radiative budget as they scatter incoming shortwave       July–August: average of 1.1 nmol DMS L−1 in the North Wa-
radiation and influence cloud formation and precipitation         ter and Nares Strait in June (Bouillon et al., 2002), average
by operating as cloud condensation nuclei (CCN) (Andreae,         of 1.3 nmol DMS L−1 in northern Baffin Bay and Lancaster
1990; Curran and Jones, 2000; Liss and Lovelock, 2007).           Sound in September (Motard-Côté et al., 2012), and range
The potential importance of oceanic DMS emissions in driv-        of 0.05 to 0.8 nmol DMS L−1 in the Canadian High Arctic
ing climate cooling is greatest in regions characterized by       in October–November (Luce et al., 2011). In spite of the
low burdens of airborne particulates such as in the Arctic dur-   recurring midsummer atmospheric MSA peak measured at
ing summer (Chang et al., 2011; Browse et al., 2012; Carslaw      Alert, evidence of high oceanic DMS concentrations asso-
et al., 2013; Leaitch et al., 2013).                              ciated with summer phytoplankton blooms remained scarce
   DMS increases in great part from the degradation of the        for this part of the Arctic until very recently (Mungall et al.,
algal compound dimethylsulfoniopropionate (DMSP). The             2016; Collins et al., 2017; Jarníková et al., 2018; Abbatt et
biosynthesis of DMSP is not restricted to eukaryotic organ-       al., 2019).

Biogeosciences, 17, 1557–1581, 2020                                                    www.biogeosciences.net/17/1557/2020/
M. Lizotte et al.: Arctic phytoplankton and dimethylsulfide dynamics                                                      1559

   The rapid shifting of the Arctic icescape bears conse-         study area, a large lead developed south of Griffith Island
quences for Arctic primary production and associated DMS          (south of Cornwallis Island), pushing the detached part of
dynamics that are still poorly understood. While observa-         the ice pack slightly eastward (Fig. 2). The BS transect was
tions from the field are sparse (Wassmann et al., 2011) and       conducted along the ice edge in this lead. In Barrow Strait,
challenging due the remoteness and harshness of the envi-         the net surface circulation is predominantly eastward at 10–
ronment as well as the dynamic nature of ice and its mar-         15 cm s−1 in midsummer on the south shore with a mild
gins (Sakshaug and Skjoldal, 1989), it is critical that impacts   westward current of ca. 5 cm s−1 on the north shore (Lemon
of ongoing physical changes on the dynamics of bloom-             and Fissel, 1982; Prinsenberg and Bennett, 1987; Pettipas et
forming microorganisms and their production of DMS be             al., 2008; Michel et al., 2015). This region stands as an im-
better constrained. The main objective of this study was to       portant waterway for the transport of fresher Pacific waters,
assess and compare midsummer (July–August) phytoplank-            originally from the inflow through Bering Strait, towards the
ton and DMS dynamics at two contrasting ice edges in re-          North Atlantic (Jones et al., 2003). The water sampled across
gions of the eastern Canadian Arctic: the ice edge dominated      this transect was thus mostly exiting the ice pack which ex-
by Barrow Strait first-year ice (FYI) and the ice edge domi-      tended several kilometers westwards.
nated by Nares Strait multiyear ice (MYI). The opportunity           In July 2014, an ice arch formed in the Kennedy Chan-
was also taken to investigate the ice-free waters of Lancaster    nel of Nares Strait leaving Kane Basin, and the North Water
Sound and North Water (northern Baffin Bay) contiguous to         region to the south was largely ice-free. The comparison of
the Barrow Strait and Nares Strait ice-edge regions, respec-      the position of the ice arch in July 2014 with a decade of
tively. Our results reveal two distinct planktonic systems and    remotely sensed data (1997–2007) shows that it formed that
ensuing DMS dynamics related to the presence of dissimilar        year approximately 130 km north of a median historical posi-
icescapes.                                                        tion (near 79◦ N) in southern Kane Basin (Kwok et al., 2010),
                                                                  in line with recent trends (2006–2010) of more northern ice
                                                                  bridge formation in the area (Ryan and Münchow, 2017). By
2     Methods                                                     the time of the sampling (3–6 August), it had retreated to the
                                                                  head of Kennedy Channel (Fig. 2a), leaving a 350 km stretch
2.1    Ice conditions and sampling strategy                       of open water north of Smith Sound (Burgers et al., 2017).
                                                                  As expected for this part of the Arctic Ocean, the ice pack
The sampling took place between 17 July and 6 August 2014         north of the ice arch was composed of MYI (Fig. 2c). Pres-
on board the Canadian Coast Guard Ship (CCGS) Amund-              ence of MYI (5+ years) north of Nares Strait, near Robeson
sen as part of the joint ArcticNet–NETCARE (Network on            Channel, was confirmed by the EASE-Grid Sea Ice Age, Ver-
Climate and Aerosols: Addressing Key Uncertainties in Re-         sion 3 data set (Tschudi et al., 2016), which compiles weekly
mote Canadian Environments) campaign. Thirty-three sta-           estimates of sea ice age in the Arctic between 1978 and 2017.
tions were sampled; most of them were located on four strate-     Data from 2014, week 31 (28 July–3 August) and week 32
gic and historical ArcticNet transects: Barrow Strait, Lan-       (4–10 August), were consulted for the purpose of this study.
caster Sound, Nares Strait, and North Water (Table 1, Fig. 1).    Beyond the MYI and to the south, a band of thick (> 1.2 m)
The other stations were situated in Dease Strait, Victoria        FYI, without any melt ponds, was also present (Canadian Ice
Strait, M’Clintock Channel, and Franklin Strait in the Cana-      Service (CIS) analysis, Fig. 2b). Because Nares Strait repre-
dian Arctic Archipelago (CAA) and Baffin Bay. The Bar-            sents a major outflow path for water exiting the Arctic Ocean
row Strait (BS) transect was sampled opportunistically and        (Jones et al., 2003; Münchow et al., 2007; McGeehan and
aimed to capture seawater flowing eastward as it exited the       Maslowski, 2012), the water sampled along the NS transect
ponded ice pack in Barrow Strait. The Lancaster Sound (LS)        was exiting the northern MYI edge as it flowed southbound
transect captured the water masses coming in and out of the       towards Baffin Bay.
sound. The Nares Strait (NS) transect aimed at capturing the
progression of biochemical processes as the water flowed          2.2   Physical, chemical, and biological measurements
southward away from the northern ice arch. The North Water
(NOW) transect captured the exchanges between the north-          Water samples were collected at five to nine depths from
ern part of Baffin Bay and Nares Strait.                          the surface down to a maximum of 100 m depth with 12 L
   The two straits (Barrow and Nares) were characterized by       Niskin-type bottles mounted on a General Oceanics 24-bottle
distinct and well-defined ice edges at the time of sampling       Rosette. The rosette sampler was equipped with a Sea-Bird
(Fig. 2). In Barrow Strait, the ice edge was located at the       911plus conductivity–temperature–depth (CTD) probe and
western end of Lancaster Sound, perpendicular to the chan-        a sensor for the measurement of fluorescence (Seapoint).
nel, between Devon Island and Somerset Island (Fig. 2a).          The in vivo fluorescence data were calibrated against ex-
The ice pack was mostly composed of ca. 1 m thick FYI cov-        tracted chlorophyll a (Chl a) concentration. Data process-
ered by melt ponds at approximately 40 % of total surface         ing was performed through the “Sea-Bird SBE Data Pro-
(Fig. 3 picture of melt ponds). Soon after our arrival in the     cessing program”, and quality control (based on UNESCO

www.biogeosciences.net/17/1557/2020/                                                    Biogeosciences, 17, 1557–1581, 2020
1560                                                      M. Lizotte et al.: Arctic phytoplankton and dimethylsulfide dynamics

Figure 1. (a) Locations of the sampling stations in the eastern Canadian Arctic during the joint ArcticNet–NETCARE campaign in July–
August 2014. Stations included in the four transects in Barrow Strait (b), Lancaster Sound (c), northern Baffin Bay (North Water, d), and
Nares Strait (e) are represented by closed circles. Both closed and open circles are included in global observations of surface concentrations
of DMS found in Fig. 8. Major oceanic surface currents (in grey) are shown in (a).

algorithms) was performed using a MATLAB toolbox de-                     ments on the filter were extracted in 90 % acetone and stored
veloped at the Maurice Lamontagne Institute (Fisheries and               at 4 ◦ C in the dark during a period of 18–24 h. Fluorescence
Ocean Canada) (Guillot, 2007; Pascal Guillot, unpublished                of extracted pigments was then measured using a Turner De-
data). Water for nutrient analysis was filtered using a luer-            signs fluorometer 10 AU after the acidification method de-
lock syringe combined with an Acrodisc filter (0.7 µm) into              scribed by Parsons et al. (1984). Chl a concentrations were
15 mL acid-washed polyethylene tubes. Samples were imme-                 calculated from the equation published in Holm-Hansen et
diately analyzed for nitrate (NO−               −
                                3 ), nitrite (NO2 ), phosphate           al. (1965).
    3−                                                                      Samples for phytoplankton taxonomy were collected at the
(PO4 ), and silicic acid (Si(OH)4 ) using a Bran+Luebbe
AutoAnalyzer III after the colorimetric method adapted                   surface and at the subsurface chlorophyll maximum (SCM)
from Hansen and Koroleff (1999) (detection limit for NO−    3:
                                                                         and preserved in an acidic Lugol’s solution (final concentra-
            −1     −              −1       3−
0.03 µmol L ; NO2 : 0.02 µmol L ; PO4 : 0.05 µmol L ).    −1             tion of 0.4 % v : v; Parsons et al., 1984). Identification and
   Water for Chl a concentration analysis was collected in               enumeration of cells > 2 µm were conducted with a Zeiss
1 L brown polyethylene bottles (Nalgene) and then passed                 Axiovert 10 inverted microscope following the Utermöhl and
onto a 25 mm filter (Whatman GF/F). Phytoplankton pig-                   Lund method (Lund et al., 1958; Parsons et al., 1984). A min-

Biogeosciences, 17, 1557–1581, 2020                                                             www.biogeosciences.net/17/1557/2020/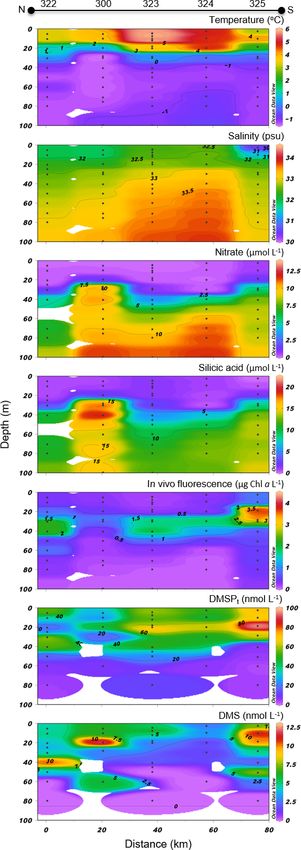
M. Lizotte et al.: Arctic phytoplankton and dimethylsulfide dynamics                                                                                        1561

Table 1. Physicochemical characteristics of the surface waters sampled during the ArcticNet–NETCARE campaign during July–August 2014
grouped within different regions of the Arctic. The surface mixed-layer depth is denoted as MLD. Nitrate (NO−
                                                                                                            3 ), silicic acid (Si(OH)4 ), and
phosphate (PO3− 4 ) are also shown. Ice-covered stations are marked with an asterisk. Stations in bold are included in the vertical cross section
transect figures (Figs. 4 to 7). Values that were not available are noted as “NA”

  Region      Station            Latitude             Longitude     Date           Sampling   MLD    Temp     Salinity         NO−
                                                                                                                                 3       Si(OH)4         PO3−4
                                                                    (yyyy-mm-dd)      depth    (m)    (◦ C)    (PSU)     (µmol L−1 )   (µmol L−1 )   (µmol L−1 )
                                                                                        (m)
  Barrow      305A        74◦ 120 59.400 N         94◦ 120 5400 W   2014-07-22          2.0    NA    −0.70      30.41          0.13          3.45          0.69
  Strait      305B       74◦ 130 44.0400 N     95◦ 540 28.0800 W    2014-07-23          1.6    NA    −1.41      30.50          0.64          5.96          0.77
              305C       74◦ 210 34.5600 N     95◦ 480 36.3600 W    2014-07-23          1.9    NA    −1.51      31.18          2.18          9.53          0.87
              305D       74◦ 270 22.6800 N     95◦ 420 10.0800 W    2014-07-23          1.5    NA    −1.50      31.46          2.08         10.57          0.85
              305E       74◦ 350 19.3200 N      95◦ 30 42.8400 W    2014-07-23          1.6    NA    −1.37      31.04          2.10         10.47          0.86
              305∗        74◦ 190 6.2400 N     94◦ 540 23.0400 W    2014-07-22          1.8     15   −0.99      30.60          0.14          4.29          0.81
              304∗      74◦ 140 45.99600 N     91◦ 310 4.00800 W    2014-07-20          1.8     23   −1.39      29.52          0.01          3.75          0.71
              346∗       74◦ 80 57.98400 N    91◦ 310 55.99200 W    2014-07-20          2.0    NA    −1.52      30.60          0.02          4.53          0.73
  Lancaster   322       74◦ 290 53.01600 N         80◦ 310 3000 W   2014-07-18          5.3     13    3.31      31.96          0.11          0.76          0.35
  Sound       300       74◦ 180 42.08400 N    80◦ 290 53.01600 W    2014-07-18          5.3    NA     3.87      31.88          0.12          0.78          0.44
              323        74◦ 90 21.99600 N    80◦ 280 26.00400 W    2014-07-17          4.5     16    5.68      32.35          0.13          1.31          0.27
              324             73◦ 590 600 N   80◦ 280 26.97600 W    2014-07-18          2.6    NA     4.83      32.51          0.13          0.86          0.23
              325        73◦ 490 0.98400 N     80◦ 290 52.9800 W    2014-07-19          2.4     14    2.99      30.46          0.58          0.08          0.48
              301         74◦ 60 8.35200 N    83◦ 220 36.37200 W    2014-07-19          2.2     15    2.84      31.16          0.02          0.79          0.46
  North       101       76◦ 220 59.98800 N          77◦ 240 000 W   2014-08-01          2.5    6.0    2.44      30.39          0.15          0.85          0.31
  Water       105             76◦ 190 300 N   75◦ 450 32.00400 W    2014-08-01          2.1    44     4.19      32.51          0.03          1.33          0.30
              108       76◦ 160 13.00800 N         74◦ 350 6000 W   2014-07-31          2.1    11     3.69      32.52          0.04          0.96          0.27
              111       76◦ 180 24.01200 N         73◦ 120 5400 W   2014-07-31          2.0    33     3.56      32.39          0.26          0.25          0.25
              115       76◦ 190 54.98400 N    71◦ 110 57.01200 W    2014-07-30          1.9    25     2.40      32.78          0.36          1.50          0.25
  Nares       KEN1      81◦ 210 36.25200 N    63◦ 570 21.67200 W    2014-08-03          2.1     58   −1.33      30.73           1.4          6.02          0.53
  Strait      KEN3      80◦ 470 43.72800 N     67◦ 180 4.03200 W    2014-08-04          1.7     18   −0.66      30.21          0.22          3.34          0.38
              KANE1     79◦ 590 35.01600 N    69◦ 460 38.17200 W    2014-08-04          1.8     10   −0.26      29.97          0.20          0.66          0.34
              KANE3     79◦ 200 46.03200 N    71◦ 510 28.15200 W    2014-08-05          1.7     17    1.87      30.46          0.17          0.99          0.28
              KANE5       79◦ 00 5.50800 N    73◦ 120 16.45200 W    2014-08-06          1.7     13    1.49      30.29          0.26          0.96          0.31

imum of 400 cells were enumerated to be statistically signif-                        til analysis in laboratory. DMSP concentrations were quanti-
icant.                                                                               fied over the course of two periods using two analytical sys-
   Samples of DMS were collected in 23 mL serum vials                                tems. A first series of DMSPt samples (stations 323, 322,
and allowed to gently overflow, avoiding any bubbling, be-                           325, 301, 304, 305, 305A, 305B, 305C, 305D, and 305E)
fore capping. Concentrations of DMS were determined on                               were analyzed in the laboratories of Laval University us-
board within 2 h of collection using purging, cryotrapping,                          ing a purge and trap system coupled to a Varian 3800 GC
and sulfur-specific gas chromatography (GC, Varian 3800)                             PFPD as described above. DMSPt samples were hydrolyzed
as described by Lizotte et al. (2012) and further modifica-                          with a 5 N NaOH solution in order to convert DMSP into
tions described here. Briefly, 15 to 20 mL subsamples of                             DMS, which was purged from the samples via an ultra-high-
DMS were gently filtered through a GF/F syringe filter and                           purity (UHP) helium stream, cryo-trapped, and analyzed via
immediately injected into a sparging vessel. The DMS was                             gas chromatography (Lizotte et al., 2012). For these DMSP
stripped from the liquid samples using a constant flow of                            samples, the GC was calibrated with milliliter injections of a
ultra-high-purity (UHP) helium (He) prepared using a per-                            100 nmol L−1 solution of hydrolyzed DMSP (Research Plus
meation tube (certified calibration by KIN-TEK Laborato-                             Inc.).
ries Inc.) maintained at 40 ◦ C and volatile DMS was trapped                             The analytical detection limit on the Varian GC system
in a Teflon loop held in liquid N2 . Gaseous samples were                            was 0.1 nmol L−1 for all sulfur compounds and the analyti-
then analyzed using a Varian 3800 gas chromatograph (GC),                            cal precision (CV) for triplicate measurements of DMS and
equipped with a pulsed flame photometric detector (PFPD)                             DMSP was better than 10 %. After shortcomings with the
and a capillary column (DB-5ms, 60 m × 320 µm × 1 µm).                               aforementioned GC system, a second series of DMSPt sam-
The samples were calibrated against microliter injections of                         ples (stations 300, 324, 346, 115, 111, 108, 105, 101, KEN1,
DMS diluted with UHP He (certified calibration by KIN-                               KEN3, KANE1, KANE3, 314, 312, 310, 335, 210, 204, 200,
TEK Laboratories Inc.) maintained at 40 ◦ C. Duplicate tubes                         and 120) were determined using an automated purge and trap
for total DMSP (DMSPt ) samples were filled with 3.5 mL of                           system (Atomx XYZ, Teledyne Tekmar Inc.) coupled with a
unfiltered water. For conservation purposes, 50 µL of 50 %                           GC–MS (gas chromatograph–mass spectrometer, model GC
sulfuric acid (H2 SO4 ) was added in each 3.5 mL liquid sam-                         Intuvo 9000-MS 5977B, Agilent Inc.). Before analysis on the
ple of DMSPt . All tubes were stored at 4 ◦ C in the dark un-                        GC–MS, DMS derived from NaOH-hydrolyzed DMSPt sam-

www.biogeosciences.net/17/1557/2020/                                                                            Biogeosciences, 17, 1557–1581, 2020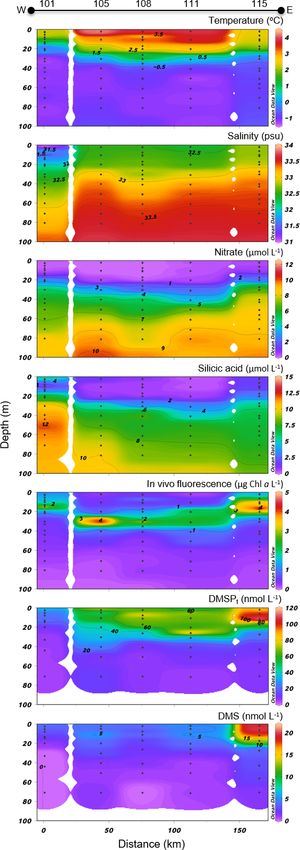
1562                                                     M. Lizotte et al.: Arctic phytoplankton and dimethylsulfide dynamics

Figure 2. Ice charts adapted from the Canadian Ice Services (CIS) of Environment Canada showing the presence of ice edges in (a) Lancaster
Sound with 9–10 / 10 ice concentrations (> 15 cm) extending from Devon Island into the Prince Regent Inlet between Somerset and Baffin
islands (22 July 2014); and in (b) Nares Strait with 9–10 / 10 ice concentrations near Petermann Glacier (1 August 2014); (c) shows the
presence of MYI (2 to 5+ years) at the entrance of Robeson Channel as well as a band of FYI (1) (EASE-Grid Sea Ice Age, Version 3 data
set; Tschudi et al., 2016). See the Canadian Ice Services Archives website for more details about sea ice characteristics. Note that Nares
Strait includes Smith Sound, Kane Basin, Kennedy Channel, Hall Basin, and Robeson Channel.

ples was purged from the seawater in the Atomx sparge ves-             compounds were ionized and directed to the mass selective
sel for 11 min with UHP He at a flow rate of 40 mL min−1 .             quadrupole of the MS. The detector was adjusted to count
Purged DMS was trapped on a U-shaped trap for volatile or-             target ions at m/z 62. Resulting peak areas were retrieved
ganic compounds (Teledyne Tekmar Stamp 9 Trap). A high-                using the MassHunter workstation software. DMSP concen-
voltage current was then used to heat the trap to 250 ◦ C, des-        trations were calculated against six- to seven-point calibra-
orbing DMS and sending it to the elution column of the GC at           tion curves obtained by processing standard DMSP solutions
a flow rate of 300 mL min−1 . Once separated by the GC cap-            of known concentration, between 1 and 100 nmol L−1 , in the
illary column (DB-5ms, 30 m × 250 µm × 0.25 µm), volatile              same fashion as DMSP samples. Potential degradation of

Biogeosciences, 17, 1557–1581, 2020                                                          www.biogeosciences.net/17/1557/2020/
M. Lizotte et al.: Arctic phytoplankton and dimethylsulfide dynamics                                                         1563

                                                                   3     Results

                                                                   3.1    Overview of the sea surface physicochemical and
                                                                          biological characteristics

                                                                   The main physical and chemical characteristics of the sea
                                                                   surface water at the sampling stations are presented in Ta-
                                                                   ble 1 for stations located in the four regions of interest. Sur-
                                                                   face temperature varied between −1.5 and 5.7 ◦ C, with the
                                                                   lowest and highest values measured under the ice in Barrow
                                                                   Strait and in the open waters of Lancaster Sound, respec-
                                                                   tively. Salinities ranged from 29.5 to 32.8, with the lowest
                                                                   and highest values measured in Barrow Strait and in north-
                                                                   ern Baffin Bay (North Water), respectively. Nitrate concen-
                                                                   trations were generally lower than 0.5 µmol L−1 in the stud-
                                                                   ied area, except at three ice-edge stations located in Barrow
Figure 3. Picture of ponded FYI at the western end of Lancaster    Strait (> 2 µmol L−1 ) and one station close to the ice arch in
Sound on 20 July 2014. Also see Gourdal et al. (2018) for more     Nares Strait (1.4 µmol L−1 ). Silicic acid exhibited the same
pictures of melt pond cover in the same region and same period.
                                                                   general spatial distribution with concentrations lower than
                                                                   1.5 µmol L−1 at most stations and greater than 3 µmol L−1
                                                                   in the ice-covered Barrow Strait and close to the ice arch
DMSPt samples through time was corrected by calculating            in Nares Strait. Phosphate concentrations varied between 0.2
the loss in standard solutions of DMSP (100 nmol L−1 ) kept        and 0.9 µmol L−1 , again with maximum values found in the
in the same preservation conditions as the samples (4 ◦ C in       ice-covered Barrow Strait. Chlorophyll a concentrations in
the dark). Our analysis shows an average loss of 9 % in the        surface waters varied between 0.2 and 2.3 µg L−1 (Table 2),
DMSPt samples between times of sampling and analysis.              indicating that the summer bloom was in an advanced stage
   MODIS images, as well as ice charts produced by CIS,            at most stations, except in the ice-covered Barrow Strait
were used to visually assess the presence of ice edges. CIS        and close to the ice arch in Nares Strait. Surface DMSPt
ice charts, based on RADARSAT-2 and NOAA-18 images,                concentrations spanned an order of magnitude from 13.5 to
show ice properties including stage of development, concen-        114.7 nmol L−1 , while DMS concentrations varied between
tration, and form of the ice (Environment Canada, 2005).           0.37 and 19.5 nmol L−1 , with the highest values measured in
Color schemes of the CIS ice chart were modified using             the ice-covered Barrow Strait and near the Greenland shelf in
Adobe Illustrator CS6. A FYI edge appears in Lancaster             northern Baffin Bay (Table 2). At a broad scale, and consider-
Sound as a curved line between Devon Island and Somerset           ing only sea surface data from all regions under investigation
Island on 22 July (Fig. 2a). The presence of MYI appears at        in this study, Spearman’s rank correlation tests (n = 33) re-
the northern extremity of Nares Strait, i.e., at the entrance of   veal no significant relationships between DMS and abiotic or
Robeson Channel between Ellesmere Island and Greenland,            biotic variables presented in Tables 2 and 3.
on 1 August (Fig. 2c). The MYI was contiguous to a band of            Beyond sea surface data, water column vertical profiles
thick (> 1.2 m) FYI descending into Nares Strait (Fig. 2b).        were also plotted as cross sections in order to identify key
   The surface mixed-layer depth (Zm ) was estimated as the        features associated with ice dynamics and bloom develop-
depth at which the gradient in density (σt ) between two suc-      ment in certain regions of the CAA and Baffin Bay. Informa-
cessive depths was greater than 0.03 kg m−4 following the          tion is presented below and grouped as a function of targeted
threshold gradient method of Thomson and Fine (2003) with          transects.
adaptations from Tremblay et al. (2009). Oceanic vertical
cross sections and contour plots were drawn using weighted         3.2    Barrow Strait (BS) transect
averaging gridding and linear mapping using Ocean Data
View 5.1.5 MacX software (Schlitzer, 2018), and schematic          Variables measured across the BS transect are presented in
models of FYI and MYI dynamics were constructed in                 Fig. 4. Seawater temperatures ranged from −1.6 to −1.2 ◦ C,
Adobe Illustrator CS6. Statistical analysis was conducted us-      with the lowest values found at intermediate depths (ca. 40–
ing SYSTAT 13.2 software, as well as JASP 0.9.2.0 computer         60 m). Surface water temperatures were below −1.4 ◦ C at
software, an open-source project supported by the University       all stations. Salinity varied between 30.4 and 33.0 across
of Amsterdam (JASP Team, 2018). Variables were tested for          the transect, with the lowest and highest surface values
normality using the Shapiro–Wilk test with a 0.05 signifi-         measured at the north and south extremities of the tran-
cance level, and Spearman’s rank correlations (rs ) were used      sect, respectively. Nitrate concentrations ranged from 0.6 to
to assess the strength of association between variables.           11.0 µmol L−1 , with the lowest and highest values measured

www.biogeosciences.net/17/1557/2020/                                                      Biogeosciences, 17, 1557–1581, 2020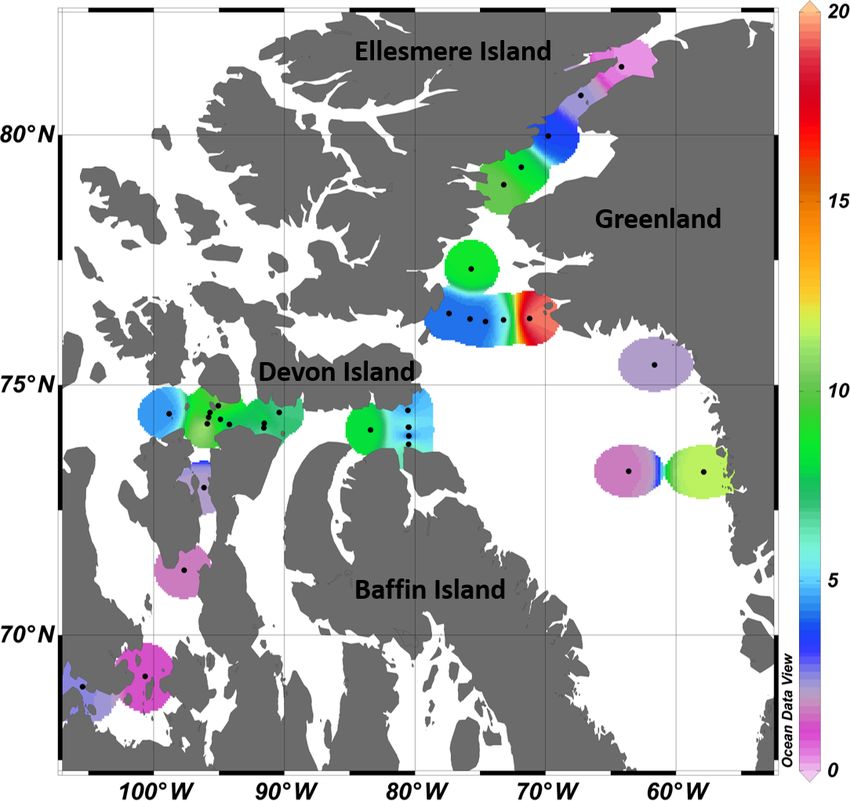
1564                                                                    M. Lizotte et al.: Arctic phytoplankton and dimethylsulfide dynamics

Table 2. Biogeochemical characteristics (including concentrations of DMSPt and DMS) of the surface waters sampled during the ArcticNet–
NETCARE campaign during July–August 2014 grouped within different regions of the Arctic. Chlorophyll a is denoted as Chl a, and
values in italic and parentheses represent in vivo fluorescence. Percentage of dominant phytoplankton taxa is shown for stations where it was
available. Ice-covered stations are marked with an asterisk. Stations in bold are included in the vertical cross section transect figures (Figs. 4
to 7). Values that were not available are denoted as “NA”.

  Region        Station   Latitude              Longitude            Date           Sampling        Chl a       DMSPt              DMS          Dominant
                                                                     (yyyy-mm-dd)      depth     (µg L−1 )   (nmol L−1 )      (nmol L−1 )       phytoplankton
                                                                                         (m)                                                    taxa (percent of total cells)
  Barrow        305A      74◦ 120 59.400 N      94◦ 120 5400 W       2014-07-22          2.0   1.14 (0.99)         44.9              7.2
  Strait        305B      74◦ 130 44.0400 N     95◦ 540 28.0800 W    2014-07-23          1.6   0.19 (0.19)         25.2             12.2
                305C      74◦ 210 34.5600 N     95◦ 480 36.3600 W    2014-07-23          1.9   0.83 (0.72)         42.8              9.4
                305D      74◦ 270 22.6800 N     95◦ 420 10.0800 W    2014-07-23          1.5   1.05 (1.06)         56.1              7.6
                305E      74◦ 350 19.3200 N     95◦ 30 42.8400 W     2014-07-23          1.6   0.83 (0.39)        114.7             10.9        Pennate diatoms (29 %)
                305∗      74◦ 190 6.2400 N      94◦ 540 23.0400 W    2014-07-22          1.8   0.90 (0.62)         45.6              7.6        Pennate diatoms (65 %)
                304∗      74◦ 140 45.99600 N    91◦ 310 4.00800 W    2014-07-20          1.8   2.29 (0.27)         71.6              8.7        Pennate diatoms (69 %)
                346∗      74◦ 80 57.98400 N     91◦ 310 55.99200 W   2014-07-20          2.0    NA (0.94)          63.5              5.8
  Lancaster     322       74◦ 290 53.01600 N    80◦ 310 3000 W       2014-07-18          5.3   0.23 (0.26)           54.6               4.6     Flagellates (24 %)
  Sound         300       74◦ 180 42.08400 N    80◦ 290 53.01600 W   2014-07-18          5.3    NA (0.14)            29.8               6.3
                323       74◦ 90 21.99600 N     80◦ 280 26.00400 W   2014-07-17          4.5   0.14 (0.10)           59.6               5.3     Flagellates (37 %)
                324       73◦ 590 600 N         80◦ 280 26.97600 W   2014-07-18          2.6    NA (0.19)            50.4               2.5
                325       73◦ 490 0.98400 N     80◦ 290 52.9800 W    2014-07-19          2.4   0.64 (0.59)           70.6               7.2     Centric diatoms (37 %)
                301       74◦ 60 8.35200 N      83◦ 220 36.37200 W   2014-07-19          2.2   1.16 (0.26)           53.1               8.2     Centric diatoms (41 %)
  North         101       76◦ 220 59.98800 N    77◦ 240 000 W        2014-08-01          2.5   1.21 (0.40)           34.5            4.1        Centric diatoms (41 %)
  Water         105       76◦ 190 300 N         75◦ 450 32.00400 W   2014-08-01          2.1   0.29 (0.22)           70.5            4.2        Flagellates (31 %)
                108       76◦ 160 13.00800 N    74◦ 350 6000 W       2014-07-31          2.1   0.48 (0.14)           64.2            3.9        Centric diatoms (43 %)
                111       76◦ 180 24.01200 N    73◦ 120 5400 W       2014-07-31          2.0   0.30 (0.21)           54.8            5.3        Centric diatoms (33 %)
                115       76◦ 190 54.98400 N    71◦ 110 57.01200 W   2014-07-30          1.9   1.69 (1.14)           88.1           19.5        Flagellates (21 %)
  Nares         KEN1      81◦ 210 36.25200 N    63◦ 570 21.67200 W   2014-08-03          2.1   0.32 (0.38)           13.5           0.37        Flagellates (28 %)
  Strait        KEN3      80◦ 470 43.72800 N    67◦ 180 4.03200 W    2014-08-04          1.7   1.90 (0.97)           26.8           2.33        Centric diatoms (65 %)
                KANE1     79◦ 590 35.01600 N    69◦ 460 38.17200 W   2014-08-04          1.8   1.57 (0.61)           22.4           3.61        Centric diatoms (73 %)
                KANE3     79◦ 200 46.03200 N    71◦ 510 28.15200 W   2014-08-05          1.7   0.76 (1.15)           16.0           8.12        Centric diatoms (67 %)
                KANE5     79◦ 00 5.50800 N      73◦ 120 16.45200 W   2014-08-06          1.7   0.84 (0.93)           23.8           0.78        Centric diatoms (72 %)

Table 3. Number of observations (Obs.), mean, median, minimum, maximum, standard deviation (SD), and interquartile range (IQR, 25th to
75th percentiles) of surface DMS concentrations from the Canadian Arctic Archipelago (CAA) and Baffin Bay biogeographic sectors from
spring to autumn. DMS observations from this study include the transect stations (BS, LS, NS, and NOW) as well as other stations in the
CAA and Baffin Bay sampled during the ArcticNet–NETCARE campaign (see Fig. 8 for DMS spatial distribution map).

   Biogeographic region              Date             Obs.      Mean    Median      Minimum    Maximum          SD      IQR 25–75             Study
                              Month            Year         n                            (nmol L−1 )
   Baffin Bay                 Apr              1998     56       0.17       0.13          nd          0.72    0.15                            Bouillon et al. (2002)
                              May              1998     53       0.65       0.33        0.07          6.74    1.02
                              Jun              1998     55       1.08       0.70        0.04          4.59    1.11
   Baffin Bay and CAA         Oct–Nov          2007     20                              0.05          0.08                                    Luce et al. (2011)
   Baffin Bay and CAA         Sep              2008     15       1.27       0.80        0.50          4.80    1.09                            Motard-Côté et al. (2012)
   Baffin Bay and CAA         Jul–Aug          2015    165       3.29       2.47        0.04         17.58    2.72          1.62–3.89         Jarníková et al. (2018)
   Baffin Bay and CAA         Jul–Aug          2014     33       5.39       4.35        0.23         19.53    3.87          2.39–7.91         This study

nd – not determined.

close to the surface and at depth, respectively. The nitra-                           est values measured in the upper 30 m of the water column
cline was located at ca. 30 m. Close to the surface, nitrate                          and toward the northern tip of the transect. Phytoplankton
concentrations were low at the south end of the transect                              identification and enumeration were conducted at one station
(0.6 µmol L−1 at station 305B) and increased northward to                             on the BS transect (stations 305E) and at two stations located
reach 2.1 µmol L−1 at station 305E. Silicic acid concentra-                           in the vicinity under the ponded ice cover (see stations 304
tions showed a similar pattern, with a positive south–north                           and 305 in Fig. 1 and Table 2). The phytoplankton assem-
gradient ranging from 3.5 to 10.5 µmol L−1 in the upper 30 m                          blages at these three stations were similar, dominated by the
and high values at depth (up to 29.2 µmol L−1 ). Chl a con-                           pennate diatoms Fossula arctica and Pseudo-nitzschia spp.
centrations varied between 0.2 and 2.1 µg L−1 with the high-                          (delicatissima group), the two taxa responsible for 29 % to

Biogeosciences, 17, 1557–1581, 2020                                                                             www.biogeosciences.net/17/1557/2020/
M. Lizotte et al.: Arctic phytoplankton and dimethylsulfide dynamics 1565
71 % of the total phytoplankton abundance (Table 2). An-
other abundant pennate species at these stations was Fragi-
lariopsis oceanica.
Concentrations of DMSPt were highest in the top 20–30 m
of the water column across the FYI edge, from stations 305B
to 305E, with the highest value of DMSPt (115 nmol L−1 at
2 m depth) observed at the northern extremity of the transect.
DMS concentrations were maximal in the upper 30 m of the
water column across the BS transect. DMS concentrations
in surface waters varied from 7.2 to 12.2 nmol L−1 with the
highest concentrations measured at both extremities of the
transect.
3.3 Lancaster Sound (LS) transect
Variables measured across the LS transect are presented in
Fig. 5. Surface temperatures were at least 3 times warmer
than those measured across the BS transect, with values rang-
ing between 3.0 and 4.1 ◦ C. Surface salinities varied between
30.7 and 32.4, with the highest values measured at stations
323 and 322 towards the north shore. Concentrations of ni-
trate and silicic acid exhibited no particular cross-channel
pattern in the surface mixed layer, with values below 0.5
and 2 µmol L−1 in the upper 20 m of the water column, re-
spectively. Maximum Chl a concentrations were in the same
range as in the BS transect (between 1.5 and 2.5 µg L−1 ) but
exhibited a different vertical distribution. Across the BS tran-
sect, Chl a concentrations were generally highest in the sur-
face mixed layer (SML) while they formed a SCM at ca. 30–
40 m at the stations located across the LS transect, suggesting
a more advanced bloom stage in the LS area. The two tran-
sects also showed distinct phytoplankton assemblages (Ta-
ble 2). Station 325 located close to the south shore of the
LS transect was characterized by a phytoplankton assem-
blage dominated by the centric diatoms Chaetoceros spp. (5–
10 µm), Chaetoceros gelidus, Chaetoceros spp. (10–20 µm),
and Chaetoceros spp. (2–5 µm). At stations located in the
middle (323) and near the north shore (322), assemblages
were dominated by unidentified flagellates, Prasinophyceae,
and Dinophyceae. In contrast to assemblages found at the BS
transect, pennate diatoms represented at most 7 % of the phy-
toplankton counts in Lancaster Sound.
Concentrations of DMSPt varied between 17 and
96 nmol L−1 in the top 40 m, with a pronounced subsurface
peak at ca. 20 m at the southern end of the transect cor-
responding to the SCM. DMS concentrations were as high
across the LS transect (values above 10 nmol L−1 measured
at stations 322, 300, and 325) as those measured across the
BS transect. However, while the high DMS values were re-
stricted to the first 25 m in the BS transect, concentrations
exceeding 2.5 nmol L−1 were measured down to ca. 70 m in
the LS transect. Across the LS transect, DMS concentrations
were elevated (> 4 nmol L−1 ) in the nutrient-impoverished Figure 4. Barrow Strait (BS) cross section of the vertical distribu-
low-Chl a SML as well as in the SCM. Three distinctive tions of temperature, salinity, nitrate, silicic acid, in vivo fluores-
cence, DMSPt , and DMS.
www.biogeosciences.net/17/1557/2020/ Biogeosciences, 17, 1557–1581, 20201566 M. Lizotte et al.: Arctic phytoplankton and dimethylsulfide dynamics
peaks were observed at stations 322 (10 nmol L−1 at 40 m),
322 (12 nmol L−1 at 20 m), and 325 (11 nmol L−1 at 10 m).
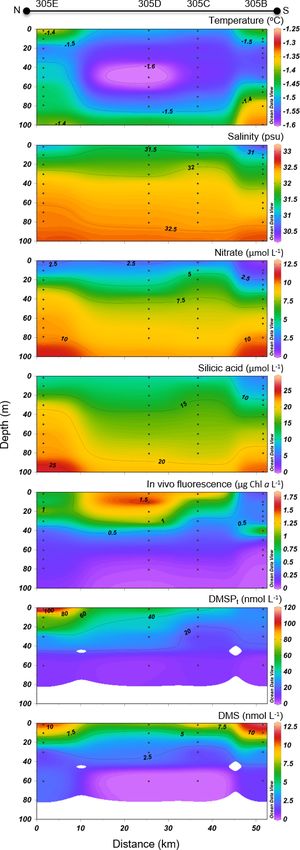
3.4 Nares Strait (NS) transect
Variables measured across the NS transect are presented in
Fig. 6. Sea surface temperatures started at ca. −1.3 ◦ C at the
ice edge and increased more or less regularly southward to
reach 2 ◦ C at the last station (KANE5) of the transect. In con-
trast, sea surface salinities were relatively constant at 30.5
along the transect. Nitrate and silicic acid concentrations in
surface waters near the ice arch were ca. 1.5 and 6 µmol L−1 ,
respectively. In the upper 20 m of the water column, con-
centrations of nitrate and silicic acid decreased with distance
from the ice arch as a first algal bloom developed (see below),
reaching 0.4 and 1.9 µmol L−1 , respectively, at the southern-
most station (KANE5). The silicic acid drawdown along the
transect was indicative of a strong diatom dominance (see
Table 2).
Chl a concentrations exiting the MYI pack were ca.
0.3 µg L−1 in the top 20 m of the water column and in-
creased southward, reaching a first surface peak of 2 µg L−1
at KEN3 which then continued in subsurface waters. A SCM
of 2.8 µg L−1 was already present at ca. 24 m depth at KEN3,
while Chl a concentrations reached 10 µg L−1 at ca. 20 m
depth at KANE5. The abundance of phytoplankton was low
in surface waters near the MYI edge, and unidentified flag-
ellates and Prymnesiophyceae (Table 2) dominated the com-
munity. The bloom which developed further south of the ice
arch was dominated by the centric diatoms Chaetoceros spp.
(5–20 µm) and Chaetoceros gelidus, a composition similar to
the blooming assemblage described in the LS transect.
At the northernmost station near the ice arch (KEN1),
DMSPt concentrations were relatively low throughout the
water column (< 16 nmol L−1 ), with the highest values
near the surface. The near-surface maximum increased to
27 nmol L−1 at station KEN3 while a distinct subsurface
maximum of DMSPt was present at ca. 20 m depth in
the three southernmost stations of the transect (KANE1
to KANE5). A high value of 59 nmol L−1 was reached at
KANE5 (20 m depth). Near-surface DMS concentrations
were below 0.4 nmol L−1 at the station closest to the ice arch
(KEN1) and were the highest in association with the develop-
ing bloom, reaching 10 nmol L−1 at KANE5. The maximum
concentrations of DMS were mostly restricted to the upper
20 m of the water column, within or above the SCM when
present.
3.5 North Water (NOW) transect
Variables measured across the NOW transect are presented
in Fig. 7. Sea surface temperatures were 1.0 ◦ C in the west-
ern part of the transect, were between 3.5 and 4.0 ◦ C in the
Figure 5. Lancaster Sound (LS) cross section of the vertical distri-
central part, and decreased to 2.3 ◦ C at the easternmost sta-
butions of temperature, salinity, nitrate, silicic acid, in vivo fluores-
cence, DMSPt , and DMS. tion (115). Sea surface salinity varied between 31.3 and 32.8
Biogeosciences, 17, 1557–1581, 2020 www.biogeosciences.net/17/1557/2020/M. Lizotte et al.: Arctic phytoplankton and dimethylsulfide dynamics 1567
with the highest values measured on the eastern edge of the
transect, closest to Greenland. Nitrate concentrations in sur-
face water were below 0.04 µmol L−1 across the whole tran-
sect, indicating post-bloom conditions similar to those found
in the LS transect. Surface silicic acid concentrations var-
ied between 0.3 and 6.5 µmol L−1 with the lowest and high-
est values recorded at stations 111 and 101, respectively.
Chl a concentrations showed a subsurface peak at all sta-
tions with maximum values found at ca. 18 m depth at sta-
tion 115 (4.7 µg L−1 ) and at ca. 30 m depth at station 105
(4.3 µg L−1 ). As observed further south at the mouth of Lan-
caster Sound, the phytoplankton assemblage was dominated
by the centric diatom Chaetoceros gelidus and two unidenti-
fied Chaetoceros species at three stations of the transect (111,
108, and 101). Stations 115 and 105 were, for their part,
numerically dominated by flagellates. Station 115 was also
characterized by the presence of the prymnesiophyte Phaeo-
cystis pouchetii (palmelloid stage) with an abundance reach-
ing 503 700 cells L−1 , representing 9 % of total cell counts at
this station. Pennate diatoms were present across the transect,
with concentrations increasing from west (16 425 cells L−1 at
station 101) to east (877 820 and 737 300 cells L−1 at stations
111 and 115, respectively).
Concentrations of DMSPt were highest in the first 20–
30 m of the water column, ranging from 34 to 88 nmol L−1 at
the near surface, with a distinct positive gradient from west
to east. A subsurface peak was observed in the three east-
ernmost stations (108, 111, and 115) with the highest con-
centrations of DMSPt (112 nmol L−1 , station 115) measured
at 12 m depth. DMS concentrations in the near-surface wa-
ters were relatively high and stable at 4.1–5.3 nmol L−1 be-
tween stations 101 and 111 and reached 19.5 nmol L−1 at sta-
tion 115, the highest value measured during this campaign.
4 Discussion
During the joint ArcticNet–NETCARE cruise, summertime
DMS distributions were studied in two regions of the High
Canadian Arctic characterized by distinct ice edges: a first
one featuring mainly ponded FYI and a second one com-
posed mainly of MYI. Both Barrow and Nares straits, as well
as the contiguous regions of Lancaster Sound and North Wa-
ter (northern Baffin Bay), embody significant oceanic gate-
ways for Pacific-originating waters towards the North At-
lantic (Jones et al., 2003). The results from the four transects
conducted in these regions reveal distinctive features in DMS
dynamics. The highlights of this study are discussed in the
context of a predicted warmer Arctic, loss of perennial sea
ice, and increase in the prevalence of seasonal FYI (Nghiem
et al., 2007; Kwok and Rothrock, 2009; Overland and Wang,
2013; AMAP, 2017).
Figure 6. Nares Strait (NS) cross section of the vertical distributions
of temperature, salinity, nitrate, silicic acid, in vivo fluorescence,
DMSPt , and DMS.
www.biogeosciences.net/17/1557/2020/ Biogeosciences, 17, 1557–1581, 20201568 M. Lizotte et al.: Arctic phytoplankton and dimethylsulfide dynamics
4.1 Broad regional sea surface distributions of DMS
Over the entire study area, the distribution of sea sur-
face concentrations of DMS (Fig. 8) ranged from 0.2 to
19.5 nmol L−1 , with a median of 4.4 nmol L−1 and interquar-
tile range of 2.5 nmol L−1 (25th) and 8.2 nmol L−1 (75th)
(Table 3, n = 33). These values are similar to the measure-
ments (range from 0.04 to 17.6 nmol L−1 and a median of
2.47 nmol L−1 ) conducted by Jarníková et al. (2018) at the
same time of year (July–August) and in the same broad
biogeographic sectors of the CAA and Baffin Bay. Alto-
gether, these results show that previous measurements con-
ducted in Baffin Bay and CAA earlier (April to June) or
later (September–October) in the potentially productive sea-
son may not have been representative of summer conditions
(see studies referenced in Table 3). These findings also bring
further support to the hypothesis that local DMS sources ex-
plain the midsummer peaks of atmospheric MSA, a DMS
proxy, in the High Arctic (Sharma et al., 2012; Becagli et
al., 2019). Not surprisingly, considering our limited sea sur-
face data set (n = 33) and the overall complexity of the DMS
cycle, no significant relationships were found between broad
regional sea surface concentrations of DMS and biotic or abi-
otic variables. Global empirical relationships between DMS
and other biogeochemical and physical variables are often
inconsistent and difficult to establish (Kettle et al., 1999).
The Arctic, in particular, displays important patchiness in
drivers of DMS dynamics (Galí and Simó, 2010; Galindo
et al., 2014; Jarníková et al., 2018), associated in great part
with the presence of ice and its role in seeding under-ice algal
blooms. The melt of sea ice and snow covers also influences
surface water stratification and the ensuing shifts in salinity,
temperature, and solar radiation doses experienced by poten-
tial DMS-producing communities. The inherent heterogene-
ity that characterizes spatial distributions of DMS in the Arc-
tic as well as the presence of sea ice as a potentially critical
driving force of these patterns warrants further investigations
into underlying mechanisms.
4.2 The FYI edge in Barrow Strait and the adjacent
Lancaster Sound
The seasonal sea ice zone (SIZ) in the Arctic is modulated by
large interannual variability (Parkinson and Comiso, 2013;
Simmonds, 2015; Comiso et al., 2017; Serreze and Meier,
2019). Correspondingly, the position of the ice edge in the
Barrow Strait and Lancaster Sound area during spring may
vary yearly from the mouth of the sound to the east (80◦ W)
to Lowther Island in Barrow Strait to the west (97◦ W) as
revealed by the analysis of CIS ice charts by Peterson et
al. (2008). On 17 July 2014, the ice edge was located ap-
proximately in the middle of this historical spatial range near
the longitude of Prince Leopold Island (90◦ W; see Fig. 2a).
Figure 7. North Water (NOW) cross section of the vertical distri-
Satellite imagery reveals that this distinct ice edge was al-
butions of temperature, salinity, nitrate, silicic acid, in vivo fluores-
ready present a month prior to the arrival of the icebreaker
cence, DMSPt , and DMS.
Biogeosciences, 17, 1557–1581, 2020 www.biogeosciences.net/17/1557/2020/M. Lizotte et al.: Arctic phytoplankton and dimethylsulfide dynamics 1569
Bay and Resolute Passage. The relatively high nitrate con-
centrations measured in the upper 20 m (ca. 2.5 µmol L−1 )
suggest that the bloom was still in its development phase.
The maximum phytoplankton biomass measured in the lead
and under the ice in adjacent stations (ca. 2 µg Chl a L−1 )
was lower than the maximum value of ca. 10 µg L−1 reported
by Galindo et al. (2014) during under-ice blooms at the end
of June 2011. The 5-times-higher biomass measured during
Galindo’s study suggest that turbulent mixing could bring ad-
ditional nutrients to the under-ice bloom closer to shore. In
stations of the BS transect however, a strong halocline had
persisted at ca. 20 m, restricting the vertical input of nutri-
ents to the upper part of the water column. Our results also
indicate that the upwelling conditions which led to the forma-
tion of a massive under-ice bloom in the Chukchi Sea (Arrigo
et al., 2012; Cooper et al., 2016; Selz et al., 2018) were not
present across the BS transect during our study. The domi-
nance of the phytoplankton assemblage by pennate diatoms
in the Barrow Strait region (BS transect station 305E as well
as stations 304 and 305; see Fig. 1) suggests that the release
Figure 8. Surface DMS concentrations (nmol L−1 ) measured at 33
of ice-associated algae (sympagic) likely contributed to the
stations across the Canadian Arctic, during July–August 2014.
seeding of the under-ice bloom, as observed during similar
under-ice blooms in the Barrow Strait region (Fortier et al.,
2002; Galindo et al., 2014). These results agree with stud-
CCGS Amundsen in the area and that the eastern part of Lan- ies emphasizing the importance of ice algal communities as
caster Sound (east of 90◦ W) was already mostly ice-free by a seeding source during spring over oceanic regions when al-
16 June 2014 (data from CIS not shown). The ice cover in gal abundance in the water column is low (e.g., Arctic Ocean
Barrow Strait, west of the ice edge, was composed mostly of north of Svalbard by Kauko et al., 2018; Frobisher Bay in
FYI ca. 1 m thick covered with melt ponds at ca. 40 % of its Davis Strait by Hsiao, 1992). The presence of species en-
surface. On 20 July, part of the ice diverged towards the east, demic to Arctic sea ice such as Nitzschia frigida, Fragilar-
creating a small lead in the FYI near the northern tip of Som- iopsis cylindrus and Fragilariopsis oceanica (Poulin et al.,
erset Island (Fig. 2a). The opportunity was taken to sample 2011) in the surface waters of the Barrow Strait region brings
the western border of the lead, very close to the newly formed further support to the ice origin of this under-ice bloom.
ice edge in order to capture the outflow of under-ice waters. The taxonomic composition of the drifting under-ice
The predominantly eastward transport of water in the south- bloom at station 305E was also dominated by pennate
ern portion of the strait is estimated at 14±4 cm s−1 annually diatoms, but with lower total cell abundance (0.48 ×
and is strongest in late summer at 27 ± 8 cm s−1 (Hamilton 106 cells L−1 at 305E) compared to the two other Barrow
et al., 2013), suggesting that the residence time of seawa- Strait stations (> 2.00 × 10⁶ cells L−1 at 304 and 305, data
ter in the lead was short lived. Biogeochemical characteris- not shown), as well as slightly different species. The phy-
tics of the surface waters sampled on 22–23 July along the toplankton assemblage at 305E was similar to the one pre-
BS transect, particularly its southern area, thus likely reflect viously described by Galindo et al. (2014) for the under-
conditions prevailing in the ice-covered western portion of ice bloom developing at a shallow station (50 m) in Allen
the strait. Bay in 2011, located ca. 15 km west of 305E. In both stud-
Vertical profiles from the BS transect (Fig. 4) in proximity ies, the under-ice bloom was dominated by pennate diatoms,
to the newly formed ice edge indicate that an under-ice phy- with Fossula arctica and Fragilariopsis oceanica contribut-
toplankton bloom had developed in the ice-covered Barrow ing 8.2 % and 7.8 %, respectively, to the total protist abun-
Strait area and was captured during our sampling as it exited dance at station 305E.
the ice. This under-ice bloom coincided with relatively low In the ice-free area of Lancaster Sound, the lower Chl a
salinities (ca. 31.5) and temperatures (ca. −1.5 ◦ C) within (0.2 to 1.2 µg L−1 ) and nutrient concentrations measured in
the surface waters. These results suggest that the bloom was the 13–16 m depth SML as well as the presence of an SCM
linked to the development of a fresher water lens below the (Fig. 5) suggest that the bloom had reached a more advanced
ice, likely resulting from the melting of snow and ice cov- stage of development with part of the phytoplankton cells
ers. Events were also likely associated with an increase in produced at the surface accumulating near the nitracline. Ni-
light transmission through the ice, as observed by Galindo et trate and silicic acid concentrations in the SML were lim-
al. (2014) for the 2010 and 2011 under-ice blooms in Allen iting, with values below 0.6 and 0.9 µmol L−1 , respectively,
www.biogeosciences.net/17/1557/2020/ Biogeosciences, 17, 1557–1581, 20201570 M. Lizotte et al.: Arctic phytoplankton and dimethylsulfide dynamics indicating that most of the nutrients, initially present in the concentrations in these waters characterized by mixed algal surface, had already been consumed by the primary produc- populations. The above results are not unexpected seeing as ers. The exhaustion of nitrate in surface waters, the deepen- the nature of DMSP synthesis itself is highly species-specific ing of the nitracline, and the development of a SCM are typ- (Keller et al., 1989) and subject to physiological up- or down- ical features of summer conditions in several regions of the regulation and excretion linked to environmental stressors Arctic as demonstrated by a host of comprehensive investi- (see review by Stefels et al., 2007). Assuming that almost gations (Tremblay et al., 2008; Mundy et al., 2009; Martin et all DMSPt was particulate (see Kiene and Slezak 2006), the al., 2010; Ardyna et al., 2013; Brown et al., 2015; Steiner et DMSPt : Chl a ratio can serve as an indicator for intracel- al., 2015). lular DMSP concentration. Averaged over the first 20 m of The striking difference between the phytoplankton assem- the water column, DMSPt : Chl a ratios were 60 nmol µg−1 blages in Lancaster Sound, dominated by centric diatoms, at the four Barrow Strait stations and almost 3 times as high and Barrow Strait, dominated by pennate diatoms, suggests at the five Lancaster Sound stations (170 nmol µg−1 ). This that the bloom in Lancaster Sound likely developed under distinctive pattern could have resulted from differences in ice-free conditions with no significant seeding from ice al- community composition or in physiological status of the al- gae. This could indicate that part of the FYI pack broke and gal communities, as well as their bloom development phase. was flushed out of the eastern portion of the sound before The numerical dominance of flagellates at certain stations of ice and snow conditions, as well as the potential presence of the LS transect (stations 322 and 323) and their presence in melt ponds, would have allowed the formation of an under- relatively high proportions at station 325 (second highest at ice bloom. This interpretation is supported by MODIS im- 14 %) suggest that the bloom was further along in its devel- ages revealing that much of Lancaster Sound was ice-free opment than in the BS transect. This difference may help ex- a month prior to the ship’s arrival (16 June, CIS data not plain the large differences in Chl a-normalized DMSPt be- shown). These results agree with findings from Hsiao (1992) tween the two regions. However, in light of the scarcity of showing a dominance of pennate diatoms in the ice algae and available information, the exact role played by community phytoplankton communities during spring in Frobisher Bay composition and cell physiology in shaping DMSPt : Chl a (Davis Strait) and a dominance of centric diatoms in open ratios remains an open question. waters in summer post ice melt. Notwithstanding the lower DMSPt : Chl a ratios in the BS The Barrow Strait–Lancaster Sound FYI area was charac- transect, DMS levels were high in surface waters, ranging terized by different vertical DMSP distributions in the two from 7.2 to 12 nmol L−1 , and revealed two hot spots at ei- regions of the biogeographic sector under study, likely re- ther end of the sampled transect (Fig. 4): one in association lated to the distinctive phases of bloom development dis- with a peak in DMSPt (115 nmol L−1 , 305E) and a second cussed above. In the newly formed lead of Barrow Strait, in conjunction with relatively low DMSPt (ca. 25 nmol L−1 , accumulation of DMSPt was highest in the surface waters 305B) and Chl a (0.83 µg L−1 ) at station 305B. Statistical with a peak of 115 nmol L−1 at the northern edge of the lead analysis suggests that, in the waters exiting the FYI pack (station 305E, depth of 2 m). This high value is in the same in Barrow Strait, variability in DMS concentrations was sig- range as the under-ice water column concentrations of par- nificantly associated with that of its precursor DMSPt (rs = ticulate DMSP (DMSPp of 99 and 185 nmol L−1 ) observed 0.76, p < 0.001, n = 20) but was most strongly associated by Galindo et al. (2014) in nearby Allen Bay. Despite seem- with fluctuations in salinity. The highly significant nega- ingly varying vertical distribution patterns of in vivo flu- tive correlation (Fig. 9) found between DMS and salinity orescence and DMSPt (see Fig. 4), the broad fluctuations (rs = −0.91, p < 0.001, n = 20) in the upper ca. 80 m of the of these two biologically mediated variables displayed sig- water column in this region suggests a strong physical control nificant correlation (rs = 0.80, p < 0.001, n = 20), suggest- of DMS distributions associated with ice and snow melting ing that the bulk of DMSPt was intimately linked to algal processes. The generally sunny forecast in the days prior to biomass. In contrast, across much of the LS transect, particu- the sampling excludes heavy rain as a significant contribu- larly towards its southern portion, concentrations of DMSPt tor to this signal. During the thawing season, the increase in were highest near the nitracline, deeper in the water column ice permeability and basal melting may trigger important re- (peak of 96 nmol L−1 at 20 m, station 325). The role played leases of DMS in the waters just below the ice cover (Trevena by environmental drivers, such as nutrients, in the accumula- and Jones, 2006; Kiene et al., 2007; Tison et al., 2010; Car- tion of DMSP-rich organisms at this depth was substantiated nat et al., 2014). The formation of an upper fresher water by the significant correlation found between water column “lens” associated with the FYI melt may also have led to distributions of NO− 3 and DMSPt (rs = −0.59, p < 0.001, a certain accumulation of DMS following its release from n = 36). However, contrary to patterns observed in the BS the sea ice. Furthermore, it cannot be totally excluded that transect, concentrations of DMSPt bore no significant asso- the stratification of the upper water column ensuing from ciation with in vivo fluorescence of chlorophyll in this part the melting ice could have entailed higher and longer expo- of the study area, suggesting that the bulk of algal biomass sures of phytoplankton communities to solar radiation with was not necessarily responsible for the variability in DMSPt enhanced DMS production as a coping mechanism against Biogeosciences, 17, 1557–1581, 2020 www.biogeosciences.net/17/1557/2020/
You can also read