First direct observation of sea salt aerosol production from blowing snow above sea ice
←
→
Page content transcription
If your browser does not render page correctly, please read the page content below
Atmos. Chem. Phys., 20, 2549–2578, 2020
https://doi.org/10.5194/acp-20-2549-2020
© Author(s) 2020. This work is distributed under
the Creative Commons Attribution 4.0 License.

First direct observation of sea salt aerosol production from blowing
snow above sea ice
Markus M. Frey1 , Sarah J. Norris2 , Ian M. Brooks2 , Philip S. Anderson3 , Kouichi Nishimura4 , Xin Yang1 ,
Anna E. Jones1 , Michelle G. Nerentorp Mastromonaco5 , David H. Jones1,a , and Eric W. Wolff6
1 Natural Environment Research Council, British Antarctic Survey, Cambridge, UK
2 School  of Earth and Environment, University of Leeds, Leeds, UK
3 Scottish Association for Marine Science, Oban, UK
4 Graduate School of Environmental Studies, Nagoya University, Nagoya, Japan
5 IVL Swedish Environmental Institute, Stockholm, Sweden
6 Department of Earth Sciences, University of Cambridge, Cambridge, UK
a now at: Neptec, UK Ltd., Oxford, UK

Correspondence: Markus M. Frey (maey@bas.ac.uk)

Received: 18 March 2019 – Discussion started: 3 April 2019
Revised: 8 January 2020 – Accepted: 21 January 2020 – Published: 2 March 2020

Abstract. Two consecutive cruises in the Weddell Sea,            crease in aerosol concentrations with wind speed was much
Antarctica, in winter 2013 provided the first direct obser-      larger above sea ice than above the open ocean, highlighting
vations of sea salt aerosol (SSA) production from blowing        the importance of a sea ice source in winter and early spring
snow above sea ice, thereby validating a model hypothesis to     for the aerosol burden above sea ice. Comparison of absolute
account for winter time SSA maxima in the Antarctic. Blow-       increases in aerosol concentrations during storms suggests
ing or drifting snow often leads to increases in SSA during      that to a first order corresponding aerosol fluxes above sea
and after storms. For the first time it is shown that snow on    ice can rival those above the open ocean depending on parti-
sea ice is depleted in sulfate relative to sodium with respect   cle size. Evaluation of the current model for SSA production
to seawater. Similar depletion in bulk aerosol sized ∼ 0.3–      from blowing snow showed that the parameterizations used
6 µm above sea ice provided the evidence that most sea salt      can generally be applied to snow on sea ice. Snow salinity, a
originated from snow on sea ice and not the open ocean or        sensitive model parameter, depends to a first order on snow-
leads, e.g. > 90 % during the 8 June to 12 August 2013 pe-       pack depth and therefore was higher above first-year sea ice
riod. A temporally very close association of snow and aerosol    (FYI) than above multi-year sea ice (MYI). Shifts in the ratio
particle dynamics together with the long distance to the near-   of FYI and MYI over time are therefore expected to change
est open ocean further supports SSA originating from a local     the seasonal SSA source flux and contribute to the variabil-
source. A mass budget estimate shows that snow on sea ice        ity of SSA in ice cores, which represents both an opportunity
contains even at low salinity (< 0.1 psu) more than enough       and a challenge for the quantitative interpretation of sea salt
sea salt to account for observed increases in atmospheric        in ice cores as a proxy for sea ice.
SSA during storms if released by sublimation. Furthermore,
snow on sea ice and blowing snow showed no or small de-
pletion of bromide relative to sodium with respect to sea-
water, whereas aerosol was enriched at 2 m and depleted at       1   Introduction
29 m, suggesting that significant bromine loss takes place in
the aerosol phase further aloft and that SSA from blowing        Atmospheric aerosol represents the largest source of uncer-
snow is a source of atmospheric reactive bromine, an impor-      tainty in global climate predictions (Boucher et al., 2013)
tant ozone sink, even during winter darkness. The relative in-   and includes sea salt aerosol (SSA), which is the main back-
                                                                 ground aerosol above the oceans. In general global climate

Published by Copernicus Publications on behalf of the European Geosciences Union.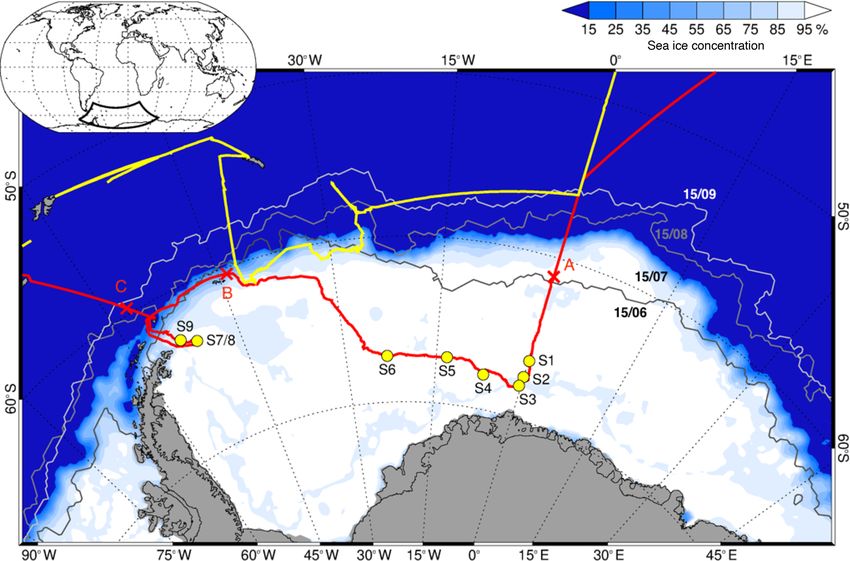
2550                                                                  M. M. Frey et al.: Sea salt aerosol from blowing snow

and aerosol models strongly under-predict Aitken and accu-        enough in space and time to produce large enough quanti-
mulation mode particle concentrations compared to observa-        ties of SSA. A more recent hypothesis based on a numerical
tions (Mann et al., 2014) and do not capture the winter max-      model suggests that salty blowing snow that undergoes subli-
imum of SSA observed at several locations in the Arctic and       mation may be a significant source of SSA with a production
Antarctica (e.g. Huang and Jaeglé, 2017). A quantitative un-      per unit area equal to or larger than that above the open ocean
derstanding of SSA sources is critical since SSA influences       (Yang et al., 2008). Indeed, model agreement with SSA win-
radiative forcing and therefore climate both directly by ab-      ter maxima observed at a number of locations in the polar
sorbing and scattering sunlight and indirectly by modifying       regions is much improved when a SSA source from blowing
the reflectivity, lifetime and extent of clouds (O’Dowd et al.,   snow based on the parameterization of Yang et al. (2008) is
1997; DeMott et al., 2016). Uncertainties in cloud properties     included in the model (Huang and Jaeglé, 2017; Yang et al.,
explain much of the spread in the modelled climate sensitiv-      2019). A recent observational study in the Ross Sea sector
ity (Flato et al., 2013) and are due in large part to lacking     of coastal Antarctica also shows a significant association be-
knowledge about aerosol sources. SSA plays also an impor-         tween increased SSA and high wind speed, suggesting a link
tant role in polar tropospheric ozone and halogen chemistry       to blowing snow above sea ice as a source (Giordano et al.,
through the release of active bromine in polar spring con-        2018).
tributing to ozone depletion events (ODEs) (e.g. Yang et al.,        However, the blowing-snow hypothesis and mechanism
2010; Kalnajs et al., 2013; Choi et al., 2018). Furthermore,      lack validation by direct observation. In particular, the ap-
SSA is easily measured in polar ice cores, but its use as a       plicability of the scheme used by all model studies to date
quantitative proxy of past sea ice conditions is complicated      (Huang and Jaeglé, 2017; Rhodes et al., 2017; Yang et al.,
by uncertainties related to SSA source contributions and pro-     2019) for sea ice is not known, because model parameter-
cesses as well as transport meteorology (Abram et al., 2013;      izations are based on blowing-snow measurements above
Levine et al., 2014; Rhodes et al., 2017), and more recently      ice sheets (Budd, 1966; Mann et al., 2000; Nishimura and
in the case of bromide Br− (e.g. Spolaor et al., 2013) also to    Nemoto, 2005) and the Canadian Prairies (Déry and Yau,
post-depositional processing associated with the bromine ex-      2001, and references therein). In this study we report the first
plosion chemistry of ODEs (Simpson et al., 2005; Pratt et al.,    direct observations of sea salt aerosol from within the Antarc-
2013).                                                            tic sea ice zone during winter, when the blowing-snow source
   Globally most SSA originates from the open ocean, where        is expected to be most active. We discuss the chemical frac-
sea spray is produced by wave breaking and bubble bursting        tionation in aerosol and snow as well as SSA variability and
generating film and jet drops (de Leeuw et al., 2011). How-       origin during and after blowing-snow events supported by a
ever, previous observations in Antarctica provide twofold ev-     unique set of measurements of physical and chemical prop-
idence of the existence of a significant SSA source associ-       erties of atmospheric aerosol, snow particles and the snow-
ated with sea ice. First, SSA exhibits maxima during win-         pack on sea ice. We then critically evaluate the current model
ter/spring in the atmosphere (Rankin and Wolff, 2003; Jour-       parameterization of sea salt aerosol production from blow-
dain et al., 2008; Legrand et al., 2017) and in seasonally        ing snow based on the in situ observations and discuss the
resolved ice core records (e.g. Frey et al., 2006); in deep       mass budget of sea salt aerosol above sea ice. A comparison
ice cores the highest values are seen during glacial periods      between our observations and a global chemistry transport
(Wolff et al., 2003). Thus the highest values are observed        model is described in a companion study (Yang et al., 2019).
when sea ice is at its seasonal or long-term maximum. And,
second, SSA in the lower atmosphere above coastal Antarc-
tica is strongly depleted in sulfate (SO2−4 ) compared to sea-    2   Methods
water (Wagenbach et al., 1998) as are also brine and frost
flowers in the sea ice nearby (Rankin et al., 2000). Frac-        Two consecutive Antarctic expeditions were carried out in
tionation of SO2−  4 and to a much lesser extent of sodium        the Weddell Sea aboard the German icebreaker RV Po-
(Na+ ) in sea ice occurs during the cooling of sea ice brine      larstern in 2013, the Antarctic Winter Ecosystem Climate
down to its eutectic point due to precipitation of the mineral    Study (AWECS), ANT-XXIX/6 between 8 June and 12 Au-
mirabilite (Na2 SO4 · 10 H2 O) at temperatures below −6.4 ◦ C     gust (Lemke, 2014), and the spring expedition ANT-XXIX/7
resulting in ion ratios in liquid and solid phase that are dif-   between 14 August and 16 October (Meyer, 2014) (Fig. 1).
ferent compared to seawater (Butler et al., 2016). At first it    We report mainly on results from ANT-XXIX/6, which pro-
had been thought that observed fractionated SSA originates        vided a significantly more extensive dataset. Atmospheric
mostly from highly saline frost flowers, which exhibit a sim-     measurements and sampling were carried out continuously
ilar sulfate depletion (Rankin et al., 2000). However, recent     from the crow’s nest of RV Polarstern and on the sea ice
laboratory (Roscoe et al., 2011; Yang et al., 2017) and model     during nine 3–104 h long ice stations (Table 1). Ice station
(Huang and Jaeglé, 2017) studies indicate that frost flow-        S3 was occupied for 3 h (Table 1), allowing only for collec-
ers likely play only a minor role in producing SSA because        tion of snow samples. Instruments were set up on the sea
they do not become easily airborne and do not occur widely        ice typically at 0.8 to 1.5 km distance from the ship. Sea

Atmos. Chem. Phys., 20, 2549–2578, 2020                                            www.atmos-chem-phys.net/20/2549/2020/
M. M. Frey et al.: Sea salt aerosol from blowing snow                                                                          2551

ice thickness measurements during ANT-XXIX/6 (Arndt and            and divided by sampling area A to obtain particle number
Paul, 2018) showed that ice stations S1–6 in the eastern sec-      flux F in units of per square metre per minute (m−2 min−1 ).
tor of the Weddell Sea were on first-year sea ice, whereas ice     Snow particle number densities for the diameter range 46–
stations S7–S9 near the Antarctic Peninsula were on multi-         478 µm, N46−478 , are then computed using N46−478 = F U −1
year sea ice (Fig. 1). This is in agreement with the obser-        with horizontal wind speed U and are reported at ambient
vation that persistent multi-year sea ice in the Weddell Sea       temperature, pressure and relative humidity in units of per
occurs only east of the Antarctic Peninsula due to a circulat-     cubic metre (m−3 ). Wind speeds measured near the crow’s
ing ocean current. The distance to the nearest open water was      nest at 39 m by the ship’s meteorology observatory (see
∼ 600–1000 km for ice stations S1–6 and ∼ 200–400 km for           Sect. 2.5) and on the sea ice at 2 m by a sonic anemometer
ice stations S7–9 (Fig. 1, Table 1). Sea ice concentrations in     (see Sect. 2.5) were extrapolated to the respective instrument
mid-July 2013 derived from Nimbus-7 satellite microwave            heights. To do this a logarithmic wind profile U (z) is as-
radiometer measurements (Comiso, 2017) show areas with             sumed given by U (z) = u∗ /κ ln(z/z0 ) (e.g. Li and Pomeroy,
85 %–95 % ice cover near ice stations S2–3 and S7–9 indi-          1997), with measurement height z, the von Kármán con-
cating that open leads may be present (Fig. 1). As RV Po-          stant κ (= 0.4), friction velocity u∗ and the surface rough-
larstern travelled south, day lengths decreased until the sun      ness length of momentum z0 set to 5.6×10⁻⁵ m as measured
remained entirely below the horizon between 23 June and            very consistently above snow at Halley (King and Anderson,
7 July, providing only a few hours of twilight per day. All        1994). Wind speed at the instrument level is then derived us-
times are in UTC. A summary of instrumentation and tem-            ing U (z2 ) = U (z1 ) ln(z2 /z0 )/ ln(z1 /z0 ). It should be borne
poral coverage is given in Table 2, and experimental details       in mind that the distortion of flow caused by the ship may
for each measurement are described below.                          mean that speed at 39 m is not representative of flow in the
                                                                   far field at that height and, further, that the turbulent field
2.1   Airborne snow particles                                      strength, which governs the gradient of the logarithmic pro-
                                                                   file, may be a residual from a different, likely lower, height.
Size-resolved number densities of airborne snow particles          Thus, we suggest care when interpreting the data and esti-
in the diameter range 36–490 µm were measured at a mean            mate that the conversion from particle counts to number den-
height of ∼ 0.16 m (range 0.07–0.37 m) on the sea ice and at       sity be seen as an estimate suitable for comparison rather than
29 m from the crow’s nest of RV Polarstern using an open-          quantitative with a well behaved uncertainty.
path snow particle counter (SPC-95, Niigata Electric Co.,
Ltd.) described previously (Nishimura and Nemoto, 2005;            2.2   Atmospheric aerosol
Nishimura et al., 2014). In brief, the SPC is a single-slit sen-
sor with a laser diode and measures diameter and number            Size-resolved number densities of SSA sized particles were
of drifting-snow particles by detecting their shadows. The         measured at mean heights of 0.19 m (range 0.13–0.25 m) and
SPC is mounted on a self-steering wind vane, and, hence,           2.16 m (range 1.98–2.2 m) on the sea ice and at 29 m from the
the sampling area A (2 × 10−3 m × 25 × 10−3 m) and volume          crow’s nest of RV Polarstern using a Compact Lightweight
(A × 0.5 × 10⁻³ m) are maintained perpendicular to the pre-        Aerosol Spectrometer Probe (CLASP) (Hill et al., 2008; Nor-
vailing wind direction. Electric pulse signals resulting from      ris et al., 2008). The CLASP is a closed-path optical par-
snow particles passing through the sampling volume are sent        ticle spectrometer, which aspirates sample air at a nomi-
to a transducer and an analysing data-logging system. As-          nal flow rate Q of ∼ 3 STP L min−1 , which is actively con-
suming that the detected particle size is the equivalent di-       trolled by onboard electronics and recorded to allow subse-
ameter dp of a sphere, each signal is classified into 1 of 64      quent correction of the particle spectra for any minor flow
mean particle diameter classes between 36 and 490 µm. The          variations. An improved version of the CLASP instrument
SPCs were calibrated by the manufacturer in Japan at −10           as used by Norris et al. (2012) was deployed, which mea-
and −30 ◦ C for particle diameters 137, 229, 314, 399 and          sures a 16-channel size spectrum covering particle diame-
449 µm, respectively. The instrument output at the calibra-        ters dp in the range of 0.36–11.62 µm at ambient humidity
tion temperature of −10 ◦ C, close to the ANT-XXIX/6 me-           at a sampling rate SR of 1 Hz. The CLASP pump and scat-
dian of −11.8 ◦ C, showed very good agreement with the ex-         ter cell were calibrated in the lab before and after the cruise.
pected representative particle diameter. Therefore, no tem-        Particle losses to inlet walls are minimized by using a short
perature corrections were applied. Particle counts from the        and straight inlet tube of 0.3 m length similar to the origi-
smallest diameter class (dp = 36 µm) have large uncertain-         nal configuration (Hill et al., 2008, Fig. 9). We assume as
ties due to the instrument’s detection limit, whereas par-         an upper limit of particle losses those estimated previously
ticle counts from the largest diameter class (dp = 490 µm)         for a similar inlet configuration (Norris et al., 2012), which
showed frequent spikes due to the detection of precipitating       amount to 43 % at dp = 11.32 µm, 19 % at dp = 6.06 µm and
snow. Particle counts from the smallest and largest diameter       0.1 % at dp = 0.44 µm. With an estimated cut-off diameter
class were therefore discarded. Particle counts h measured         of > 11 µm, all but the coarsest SSA particles are expected
at a sampling rate SR of 1 Hz are integrated to 1 min values       to be detected. Number densities N0.4−12 are computed from

www.atmos-chem-phys.net/20/2549/2020/                                               Atmos. Chem. Phys., 20, 2549–2578, 2020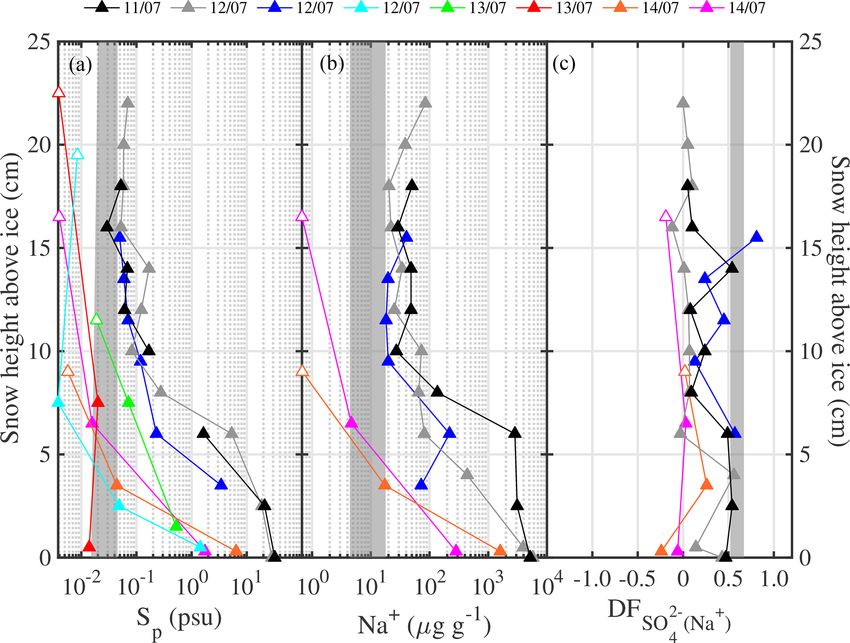
2552                                                                                              M. M. Frey et al.: Sea salt aerosol from blowing snow

Figure 1. Cruise tracks of RV Polarstern in the Weddell Sea for the winter expedition ANT-XXIX/6 from 8 June to 12 August 2013 (red line)
and the spring expedition ANT-XXIX/7 from 14 August to 16 October 2013 (yellow line). Circles indicate the location of ice stations S1–9
(Table 1). Crosses show ship positions when entering the sea ice on 17 June (A), reaching the marginal sea ice zone (MIZ) on 22 July (B)
and returning to the open ocean on 9 August (C). Sea ice concentrations on 15 July 2013 are shown as areas shaded in white to blue, and sea
ice extent on 15 June, 15 August and 15 September 2013 is shown as solid grey lines, all based on Nimbus-7 satellite microwave radiometer
measurements (Comiso, 2017).

Table 1. Overview of duration 1t, mean position, distance to the nearest open water 1x and meteorology (ambient temperature, Ta ; wind
speed, U39 m ; and wind direction, wdir, at 39 m) for ice stations S1–S9 during ANT-XXIX/6 (8 June to 12 August 2013).

     Station IDa                Beginning to end                                          1t                     Lat/long        1x b            Ta       U39 m        wdir
                                (UTC)                                                     (h)                          (◦ )      (km)         (◦ C)     (m s−1 )        (◦ )
     S1 (PS81/0493-2)           21 Jun 2013 14:23 to 22 Jun 2013 00:29                    10          −66.445/0.116              607       −20.6              8.2       207
     S2 (PS81/0496-1)           24 Jun 2013 08:23 to 24 Jun 2013 18:18                    10        −67.470/ − 0.033             721       −12.6             12.5        51
     S3 (PS81/0497-1)           26 Jun 2013 11:20 to 26 Jun 2013 14:20                     3        −68.049/ − 0.340             786        −3.4             13.2        19
     S4 (PS81/0500-5)           3 Jul 2013 08:32 to 5 Jul 2013 20:52                      60        −67.909/ − 6.762             993       −23.2              5.2       200
     S5 (PS81/0503-2)           8 Jul 2013 11:50 to 8 Jul 2013 23:39                      12       −67.192/ − 13.225             913       −14.0              3.8       251
     S6 (PS81/0506-1)           11 Jul 2013 09:38 to 15 Jul 2013 12:41                    99       −67.203/ − 23.165             803       −16.8              6.3       167
     S7 (PS81/0515-1)           26 Jul 2013 11:30 to 27 Jul 2013 00:00                    13       −63.415/ − 51.246             381       −19.6             13.9       246
     S8 (PS81/0517-2)           29 Jul 2013 12:35 to 2 Aug 2013 20:24                    104       −63.400/ − 51.170             379       −25.2              6.8       208
     S9 (PS81/0518-3)           4 Aug 2013 13:44 to 5 Aug 2013 20:18                      31       −62.918/ − 53.265             214        −7.8              9.1       273
   a Station ID used in this paper (Figs. 1, 2); RV Polarstern nomenclature is shown in brackets. b Horizontal distance to the nearest open water on the ice station longitude
   based on sea ice extent on 15 June for S1–S3, on 15 July for S4–S7 and 15 August for S8–S9 (Fig. 1).

particle counts h with N0.4−12 = hSRQ−1 at IUPAC stan-                                      ative wind direction was in the 135–225◦ sector encompass-
dard temperature (273.15 K) and pressure (1 bar) and then                                   ing the ship’s engine stack. A total of 21 % of the available
averaged to 1 min means. Due to pump failure of the CLASP                                   1 s data were removed from the crow’s nest data.
unit in the crow’s nest, usable data at the 29 m level are only
available from 8 June to 26 July 2013. Raw aerosol number                                   2.3     Aerosol chemical composition
concentrations at the crow’s nest showed significant spikes,
when air came from the direction of the ship’s engine stack,                                Aerosol was collected on filters via continuous low-volume
whereas no evidence of pollution was detected in the obser-                                 sampling using open-face filter holders protected by a wind
vations on the sea ice. Pollution spikes were effectively fil-                              shield following the approach from a previous study in
tered out prior to averaging by excluding all data when rel-                                coastal Antarctica (Wolff et al., 1998). One sampling unit
                                                                                            was deployed on the sea ice for the duration of each ice

Atmos. Chem. Phys., 20, 2549–2578, 2020                                                                             www.atmos-chem-phys.net/20/2549/2020/
M. M. Frey et al.: Sea salt aerosol from blowing snow 2553
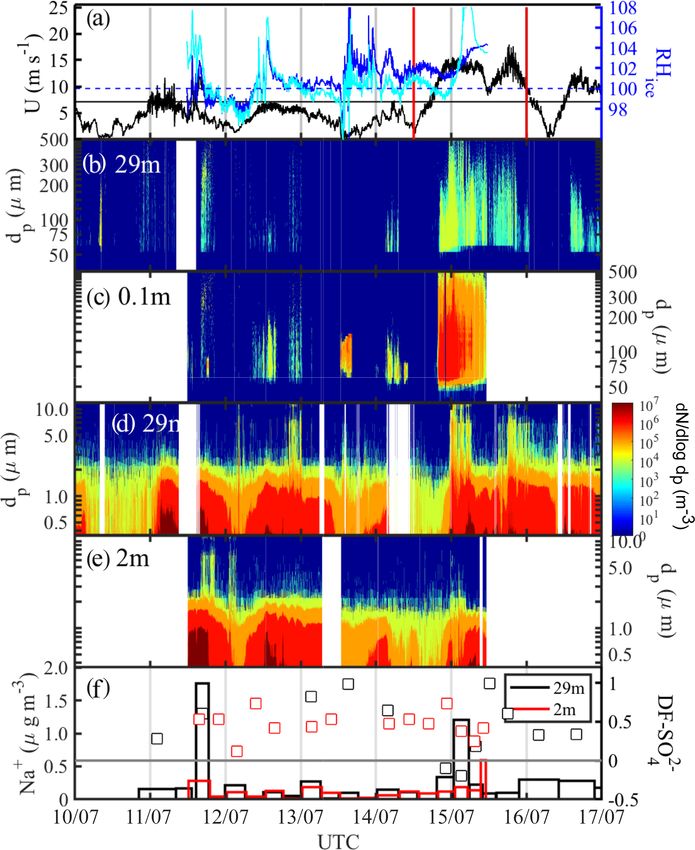
Figure 2. Overview of atmospheric observations in the Weddell Sea from 8 June to 12 August 2013 (ANT-XXIX/6): (a) horizontal wind
speed U at 39 m; time periods at ice stations S1–9 (Table 1) are highlighted in red. (b) Ambient temperature Ta and relative humidity with
respect to ice RHice at 29 m; red symbols refer to RV Polarstern positions shown in Fig. 1, indicating when the ship entered the sea ice on
17 June (A), reached the marginal sea ice zone (MIZ) on 22 July (B) and returned to the open ocean on 9 August (C). (c) Total number
densities N46−478 of airborne snow particles at 29 m with grey shaded areas indicating periods with observed drifting or blowing snow.
(d) Total number densities N0.4−12 of aerosol at 29 m. (e) Aerosol Na+ concentrations and (f) sulfate depletion factor DFSO2− , both at 29
4
and 2 m.
station, and another one was operated continuously from lead-acid battery (12-5000X, Sunlyte) with an average flow
the crow’s nest of RV Polarstern. Aerosol filters were poly- rate of 9.8 STP L min−1 , whereas the crow’s nest unit had a
tetrafluoroethylene (PTFE) 1.0 µm pore membrane filters 220 VAC diaphragm vacuum pump (420 W, model no. DOA-
of 37 mm diameter (Zefluor® P5PL037, Pall Lab.) with an P725-BN, GAST, Michigan, USA) with a mean flow rate
aerosol retention of > 99.99 % as stated by the manufacturer. of 8.8 STP L min−1 . Total sample air volume was measured
Filters were pre-mounted prior to the expedition in three- upstream of the pump using a diaphragm gas meter (KG-2-
piece styrene acrylonitrile (SAN) filter holders onto porous G1.6, BES), which was not temperature compensated. How-
cellulose support pads (Pall International Sarl). At the head ever, gas meter temperature continuously recorded with a
of each sampling unit, the filter holder was mounted, open Tinytag logger (RS, Gemini) and atmospheric pressure avail-
face downward, inside an upturned polyethylene jar intended able from the ship’s meteorology observatory (see Sect. 2.5)
to prevent blowing snow blocking the filter. On the sea ice the allowed us to determine the total air sample volume at IU-
jar was attached to a metal mast at ∼ 2 m above the snow- PAC standard temperature and pressure. Rotameters with a
pack and on the crow’s nest to a horizontal metal arm at glass float (Cole-Parmer) installed upstream of the gas me-
∼ 29 m above the sea ice surface, and it was free to swing ter were used to manually check flow rates one to two times
in the wind, aiding the removal of snow and rime. An air daily. Post-season lab tests confirmed accuracy of the crow’s
pump was attached with PFA tubing ∼ 10 m downstream of nest gas meter, whereas the sea ice gas meter showed a nega-
the sampling head to pull ambient air through the filters. The tive bias of 30 %, which is accounted for in the computation
sea ice unit had a 12 VDC diaphragm vacuum pump (22 W, of final atmospheric concentrations. Filter sampling intervals
N815-KNDC, KNF Neuberger) powered by a rechargeable were on average 6 h (range 1.5–8.6 h) at 2 m and 12 h (range
www.atmos-chem-phys.net/20/2549/2020/ Atmos. Chem. Phys., 20, 2549–2578, 2020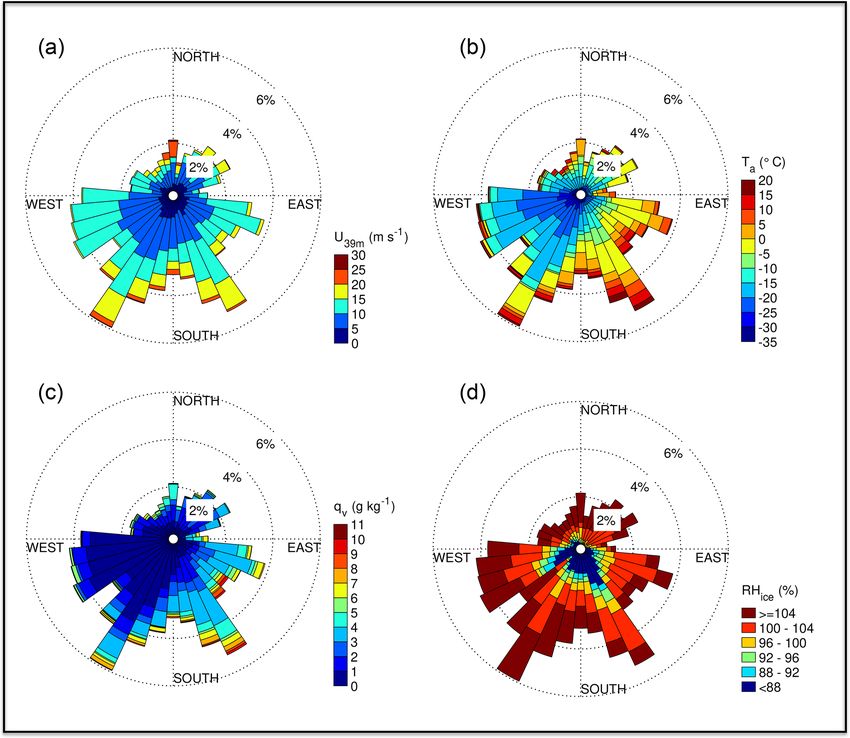
2554                                                                                            M. M. Frey et al.: Sea salt aerosol from blowing snow

Table 2. Overview of observed parameters, instruments used, and reported data resolution 1t during ANT-XXIX/6 (ANT6) from 8 June to
12 August 2013 and during ANT-XXIX/7 (ANT7) from 14 August to 16 October 2013.

     Parameter                                                                   Instrument                                     1t                  ANT6         ANT7
     1. Crow’s nest (height 29 m)                                                Continuous
     Snow particle number density, N46−478 (dp 46-478 µm)                        Snow particle countera                         1 min                  X               X
     Aerosol number density, N0.4−12 (dp 0.36-11.62 µm)                          CLASPb                                         1 min                  X
     Bulk aerosol chemistry (Na+ , Cl− , SO2−    −
                                           4 , Br )                              Low-volume filter samples                      3–48 h                 X               X
     Meteorology (T , p, RH, U , wdir)                                           RV Polarstern observatoryc                     1 min                  X               X
     2. Sea ice (height 0.07–2.0 m)                                              During ice stations
     Snow particle number density, N46−478 (dp 46–478 µm)                        Snow particle countera                         1 min                  X
     Aerosol number density, N0.4−12 (dp 0.36–11.62 µm)                          CLASPb                                         1 min                  X
     Bulk aerosol chemistry (Na+ , Cl− , SO2−     −
                                           4 , Br )                              Low-volume filter samples                      3–48 h                 X
                                    2−
     Snow chemistry (Na+ , Cl− , SO4 , Br− , Sp )                                Ion chromatography, salinometerd               hour to days           X
     3-D wind field (u, v, w)                                                    Sonic anemometere                              1 min                  X
     T , RH                                                                      Temperature/humidity probef                    1 min                  X
   a SPC-95, Niigata Electric Co., Ltd. (Nishimura et al., 2014). b Compact Lightweight Aerosol Spectrometer Probe (CLASP) (Hill et al., 2008; Norris et al., 2008).
   c Details in König-Langlo (2013a, b). d SensIon 5, Hach. e METEK USA-1. f Vaisala HMP45.

3.5–31 h) at 29 m, with more frequent filter changes applied                              overnight in UHP water, followed by four UHP-water rinses
during storms. The resulting sample air STP volumes were                                  and 5 min microwaving. Filter holders were then dried in the
3.3 (0.8–5.1) m3 at 2 m and 6.4 (1.8–17.3) m3 at 29 m.                                    incoming, filtered airflow of the class 100 laboratory. Fil-
   Filters were estimated to collect aerosol in the diameter                              ter units were assembled in the class 100 laboratory, sealed
range ∼ 0.3 µm to less than 6 µm. The lower end of the range                              airtight with plugs and then bagged in 2 layers of polyethy-
is based on previous measurements of collection efficiencies                              lene bags. In Antarctica, filter units were removed from the
of PTFE filters as a function of particle size (Soo et al., 2016).                        bags, mounted onto the sampling head by removing one plug
The upper end, the cut-off diameter of the air intake system,                             and then opened to give open-face sampling. Field blanks
which critically controls the observed aerosol load, is esti-                             were collected at regular intervals by placing a filter onto
mated as follows. Previously a cut-off diameter of 6 µm was                               the head and leaving it for a few minutes without pump-
empirically estimated for a similar sampling setup with fil-                              ing. After sampling, the procedure was reversed, and filter
ter face velocities of 1.1 m s−1 (Wagenbach et al., 1998). In                             units were shipped in a freezer (−20 ◦ C) back to the United
this study average filter face velocities were 0.15 m s−1 , im-                           Kingdom and kept frozen until prior to extraction. Filters
plying a cut-off diameter smaller than 6 µm. Since isokinetic                             were transferred in the class 100 laboratory into 10 mL pre-
sampling could not be applied, sea salt aerosol concentra-                                cleaned polystyrene sample vials (Dionex AS-AP Autosam-
tions are expected to be generally underestimated, especially                             pler vial). Pre-cleaning of the vial, lid and septum involved
during high wind speeds. The low filter bias for sea salt is                              UHP-water rinsing followed by 3 min microwaving repeated
found to depend weakly on wind speed and is on average                                    five times, soaking overnight in UHP water, repeating the
26 % compared to median values during filter sampling in-                                 same set of UHP-water rinsing, and microwaving before dry-
tervals derived from CLASP measurements as discussed in                                   ing and double-bagging. Filters were then extracted in 8 mL
Sect. 3.5.                                                                                of UHP water by repeated shaking and immersion into an ul-
   Filter units, consisting of filters, support pads and fil-                             trasonic bath for > 30 min. Samples were analysed using ion
ter holders, were cleaned and assembled prior to shipping                                 chromatography (IC) as described in the following section.
to Antarctica in a class 100 clean laboratory in Cambridge                                The field blank, mostly due to the filter itself with contri-
(United Kingdom). Filters and support pads were soaked                                    butions from field and extraction procedures, was significant
overnight in methanol (ACS > 99.9 %, Fisher Scientific) in                                for all ions (Table 3). A mean value has been subtracted from
batches of 25, rinsed four times with ultra-high-purity wa-                               all concentrations leading in some cases to negative values.
ter (UHP, electric resistivity 18.2 M cm), microwaved for                                The combination of small air sample volumes and high field
3 min and then rinsed once more with UHP water. Filters                                   blanks led to relatively high limits of detection (LODs) de-
were dried on their support pads under vacuum in a clean                                  fined here as 2 times the standard deviation of the field blank
dessicator. Filter holders were rinsed with UHP water, placed                             (Table 3).
for 10 min into an ultrasonic bath, rinsed with UHP wa-                                      Chemical fractionation of ion x (= SO2−       −      +
                                                                                                                                     4 , Br , Na ) rela-
                                                                                                                +      −
ter three times and microwaved for 5 min, and then soaked                                 tive to ion y (= Na or Cl ) in aerosol and snow with re-

Atmos. Chem. Phys., 20, 2549–2578, 2020                                                                           www.atmos-chem-phys.net/20/2549/2020/
M. M. Frey et al.: Sea salt aerosol from blowing snow                                                                                            2555

Table 3. Overview of mean aerosol filter procedure blanks and resulting limit of detection (LOD): (1) ultra-high-purity (UHP) water, (2) filter
extraction, (3) cleaned and unused filter, and (4) field blank (see text). Field blank values are used to correct the raw filter ion concentration.

                          Parameter                                                          Na+        Cl−      SO2−
                                                                                                                   4         Br−        Na
                          (a) Aerosol filter procedure blank
                          1. UHP (electric resistivity 18.2 M cm) (ng g−1 )                   0.4       4.0         4.5      0.0       85
                          2. extraction (ng g−1 )                                              3.6       4.8         8.6      3.4       14
                          3. filter (ng g−1 )                                                  2.3       9.5         8.5      0.0        8
                          4. field (ng g−1 )                                                   6.0      16.8         9.1      0.5       10
                          Ratio field blank : sample mean (%)                                  3.1       4.9        20.3     34.3      183
                          (b) Limit of detection (LOD)
                          LOD (ng g−1 )b                                                      13.4      27.9        17.1       1.0      10
                          LOD (ng m−3 )c                                                      22.6      47.2        29.0       1.7     141
                        a Sample size. b Defined as 2 × 1 − σ of the field blank. c Based on crow’s nest mean sample air STP volume (6.4 m3 );
                        mean sample air STP volume for filters deployed on the sea ice was 3.3 m3 , increasing respective LODs by a factor of
                        1.6.

spect to seawater is evaluated based on the depletion fac-                            and DFBr− (R = −0.37, p < 0.01), suggesting that enrich-
tor DFx = 1 − Rspl /RRSW , with R being the x : y mass ra-                            ment in sulfate (and bromide) may be more likely during pol-
tio in sample (spl) and reference seawater (RSW) follow-                              luted conditions. The bulk aerosol chemistry observations on
ing Millero et al. (2008). Throughout, DFSO2− (Na+ ) and                              the sea ice showed no evidence of pollution. Thus, in the case
                                                  4
DFBr− (Na+ ) refer to sulfate and bromide depletion relative                          of sulfate we cannot rule out that some of the sulfate enrich-
to Na+ , and DFNa+ (Cl− ) refers to sodium depletion rela-                            ment in atmospheric aerosol observed at the crow’s nest may
tive to Cl− . DFx between 0 and 1 indicates 0–100 % deple-                            be due to ship exhaust rather than presence of mirabilite. It
tion, whereas DFx < 0 indicates enrichment. For example,                              follows that estimates of sea ice contributions to total SSA
DFx = −1.5 or 150 % enrichment means the respective ion                               inferred from depletion factors in this study have to be con-
concentration is 2.5 times that in reference seawater. A to-                          sidered as lower bounds of true values.
tal of six (=∼ 6 % of all crow’s nest samples) DFSO2− val-
                                                       4                              2.4     Snow chemical composition
ues were below that of pure mirabilite (= −7.3) and are at-
tributed either to sulfate contamination from the ship’s en-                          In order to determine the snow chemical composition, a to-
gine emissions discussed below or measurement error. We                               tal of 24 snow pits was sampled at nine ice stations dur-
therefore removed all ion concentrations of the correspond-                           ing ANT-XXIX/6, between one and two snow pits at shorter
ing filter samples from the dataset. Propagation of the ana-                          ice stations, and up to eight snow pits at the multi-day ice
lytical error yields mean uncertainties in DFx of 0.03–0.04.                          stations S6 and S8 (Table 1). Snow pit profiles were sam-
   About 7 % (10 out of 151) of all filters collected at the                          pled at 2 cm depth resolution with a custom-built, cylin-
crow’s nest during June to September 2013 were visibly                                drical, stainless-steel sampling tool yielding a sample vol-
grey from exposure to ship exhaust and therefore not anal-                            ume of ∼ 60 cm3 . Blowing or drifting snow was collected
ysed in order to protect the IC columns. In order to assess                           at approximately 0.3, 0.9 and 1.6 m above the snow sur-
the impact of potential pollution on reported bulk aerosol                            face using modified Mellor gauges with a clear thermoplas-
chemistry from filters collected at the crow’s nest, we cal-                          tic body (Schmidt et al., 1984) referred to as rocket traps.
culated for each filter sample the fraction of the total filter                       Snow samples were transferred into 50 mL polypropylene
run time during which relative wind direction was within                              tubes with screw caps (Corning CentriStar), which prior to
the 135–225◦ sector encompassing the ship’s engine stack.                             field deployment had been rinsed with UHP water and dried
Considering all filters sampled from June to September 2013                           in a class 100 clean laboratory in Cambridge. One set of
(N = 141) the fraction of total filter run time with winds                            snow samples was melted on board RV Polarstern to mea-
from the polluted sector was on average 9.5 %. Polluted                               sure aqueous conductivity using a conductivity meter (Sen-
time fraction and atmospheric concentrations of Na+ and                               sIon 5, Hach) with a measurement range of 0–200 mS cm−1
Cl− were uncorrelated (R < 0.05, p > 0.1), which did not                              and a maximum resolution of 0.1 µS cm−1 at low conduc-
suggest any impact of pollution on the respective ion con-                            tivities (0–199.9 µS cm−1 ). The conductivity meter has an
centration. Weak but significant correlations were found be-                          automatic non-linear temperature compensation based on a
tween polluted time fraction and SO2−4 (R = 0.21, p < 0.05),                          NaCl solution and reference temperature of 25 ◦ C and was
DFSO2− (R = −0.44, p < 0.01), Br− (R = 0.17, p < 0.06)                                calibrated with a standard salt solution (12.880 mS cm−1
      4

www.atmos-chem-phys.net/20/2549/2020/                                                                          Atmos. Chem. Phys., 20, 2549–2578, 2020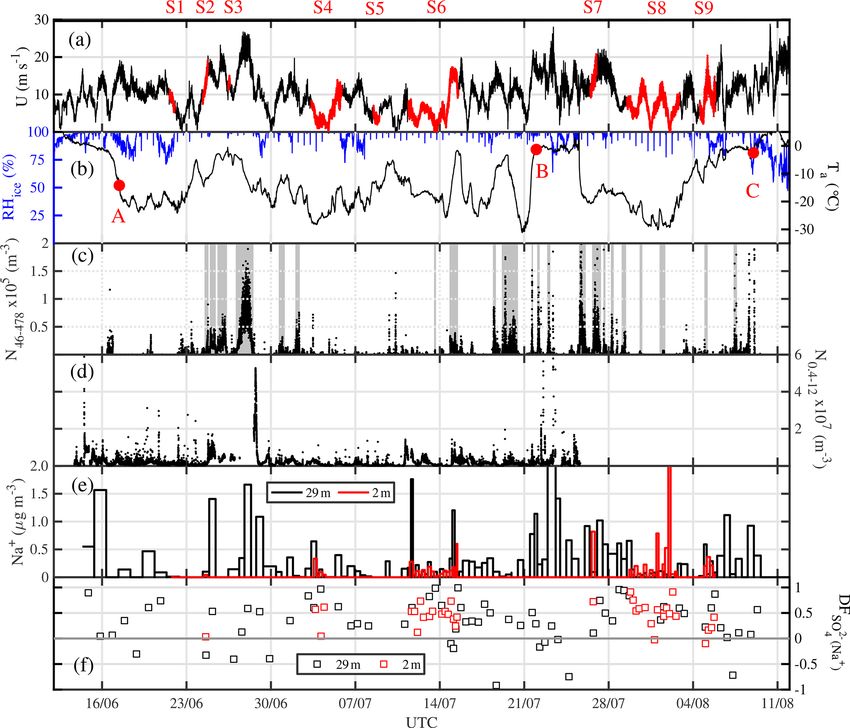
2556                                                                    M. M. Frey et al.: Sea salt aerosol from blowing snow

at 25.1 ◦ C), certified and traceable to NIST (REAGECON           RHice from the HMP45 was further corrected following An-
product no. CSKC12880, lot no. CS1288012K1). Conduc-              derson (1994) to extend the calibrated temperature range to
tivity values were converted into practical salinity Sp using     Ta < −20 ◦ C. Based on the available data the calibration of
the Gibbs SeaWater (GSW) Oceanographic Toolbox (Mc-               RHice is most accurate for the −40 to −20 ◦ C range and
Dougall and Barker, 2011), which applies the algorithm of         has greater uncertainty in RHice in near-freezing conditions.
the Practical Salinity Scale of 1978 (PSS-78) (Unesco, 1981,      Accurate correction of the HMT337 output was not possi-
1983) with an extension to salinities Sp < 2 psu (Hill et al.,    ble since available RHaq values are biased as they had been
1986). Sp is reported in psu (practical salinity unit), approx-   post-processed by accepting only values up to 105 % and
imately equivalent to the weight of dissolved inorganic mat-      setting any values > 100 % to 100 %. In general, measuring
ter in grams per kilogram of seawater, and has an accuracy        RHice during blizzards is very difficult, and its estimated non-
as stated by the manufacturer of ±0.001 psu at low salinities     systematic error of ∼ 5 % limits its use for blowing-snow cal-
(< 1 psu).                                                        culations. We therefore discuss only RHice trends below.
   The other snow samples were shipped frozen back to Cam-
bridge and only melted prior to analysis in spring 2014 and
December 2016. Elevated salinities required dilution of sam-      3     Results and discussion
ples with UHP water, typically by a factor of 100 for most
snow samples and a factor of 10 000 for sea ice and frost         The presentation and discussion of results in the sections be-
flower samples. Samples were analysed for major ions using        low are organized as follows. An overview of observed me-
Dionex ICS2000 ion chromatography systems with reagent-           teorology and particle concentrations (Sect. 3.1) is followed
free eluent generation. Cation analysis was performed with        by the discussion of chemical fractionation of aerosol and
a CS12A separator column with isocratic methylsulfonic            snow and size spectra of aerosol above sea ice (Sect. 3.2).
acid elution and a 250 µL sample loop. Anion analysis was         Blowing-snow events are then described in detail during two
performed using an AS17 separator column, gradient elu-           time periods (Sect. 3.3). We then evaluate the current model
tion with potassium hydroxide and a 250 µL sample loop.           mechanism proposed by Yang et al. (2008, 2019) for SSA
Measurement accuracies were evaluated using European ref-         production from blowing snow (Sect. 3.4) and finally dis-
erence materials ERM-CA408 (simulated rain water) and             cuss the air–snow budget of sea salt aerosol above sea ice
CA616 (groundwater) and were all within 5 % and respective        (Sect. 3.5).
LODs ∼ 2 ng g−1 . Here we only report and discuss concen-
trations of ions relevant to this study: Na+ , Cl− , SO2−4 and    3.1    Overview of atmospheric observations
Br− .
                                                                  Near-zero or positive ambient temperatures Ta in degrees
2.5    Ancillary measurements                                     Celsius occurred when RV Polarstern was in the open ocean
                                                                  at the start and end of ANT-XXIX/6, as well as from the
General meteorology measurements were taken from RV Po-           22 July 2013 onwards, when the ship had moved into the
larstern onboard sensors described in detail elsewhere (https:    marginal sea ice zone (MIZ) closer to open water (marker B
//spaces.awi.de/display/EFPW/Weather+Station; last access:        in Figs. 1, 2b). After entry into the sea ice zone on 17 June
January 2020) and include ambient temperature Ta and rela-        2013 (marker A in Fig. 1) Ta decreased to below −20 ◦ C but
tive humidity with respect to water RHaq at 29 m (HMT337,         showed thereafter frequent increases associated with storms
Vaisala, Finland), wind speed U and direction at 39 m (Sonic      (Figs. 1, 2a, b). The correlation between Ta and U39 m is
2D, Thies, Germany), and global radiation (Pyranometer            weak but significant (R = 0.37, p < 0.05). Winter storms
CM11, Kipp & Zonen, Netherlands). Still images recorded           occurred frequently with wind speeds ranging between 10
every minute by a webcam in the crow’s nest provided fur-         and 20 m s−1 , occasionally exceeding 20 m s−1 (Fig. 2a), and
ther qualitative information on the presence of airborne snow     coincided often with snowfall based on the ship’s 3-hourly
particles, when light conditions were adequate. During ice        weather report, occasional webcam images and presence of
stations the three-dimensional wind components (u, v, w)          clouds (data not shown). Bearing in mind that wind direction
were measured above the sea ice at 25 Hz with an unheated         and origin of air mass depend on the ship’s position relative
sonic anemometer (Metek USA-1) that was mounted on a              to the path of a low- or high-pressure system, the following
mast at ∼ 2 m. Processing of raw sonic data in 1 min blocks       is observed: the most of frequent winds were from the W
included temperature crosswind correction and a double co-        to SSW, advecting cold (−15 to −30 ◦ C) air of a low wa-
ordinate rotation to force mean w to zero (Kaimal and Finni-      ter load with specific humidities qv < 3 g kg−1 (Fig. 3). The
gan, 1994; Van Dijk et al., 2006), followed by computation of     second most frequent were winds from the SSE to SE, ad-
friction velocity u∗ . Ta and RHaq were also measured above       vecting relatively warm air often between −5 and 0 ◦ C with
the sea ice on a 2 m mast at approximately 0.6, 1.2 and 2.0 m     higher qv values often between 3 and 5 g kg−1 (Fig. 3), in-
using temperature–humidity probes (HMP45, Vaisala). RHaq          dicating origin from lower latitudes. And the third most fre-
was converted to relative humidity with respect to ice RHice .    quent were winds from the N coinciding with the highest

Atmos. Chem. Phys., 20, 2549–2578, 2020                                             www.atmos-chem-phys.net/20/2549/2020/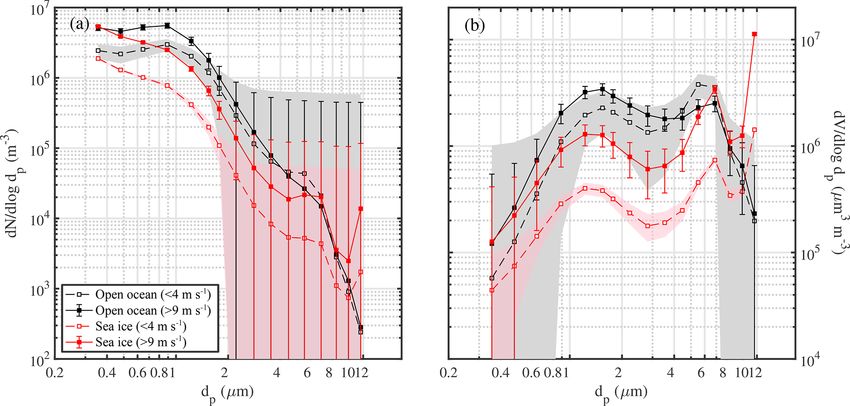
M. M. Frey et al.: Sea salt aerosol from blowing snow                                                                       2557

wind speeds (Fig. 3). The air was (super)saturated with re-       Non-zero DFSO2− values suggest throughout a significant
                                                                                   4
spect to ice most of the time (RHice > 100 %), with increased     contribution to the total SSA burden from a fractionated sea
frequency of subsaturation (RHice < 100 %) when the winds         ice source (Table 4, Fig. S1e). Conversely, when in open wa-
were from the SE (Fig. 3d). Horizontal wind speed at 2            ter, at the beginning and end of ANT-XXIX/6 Na+ concen-
and 39 m correlated well with friction velocity u∗ (R = 0.9,      trations of bulk aerosol were relatively large but with small
p < 0.05) (Fig. S1 in the Supplement), indicating a well-         or no sulfate depletion, consistent with the open ocean as the
mixed near-neutral turbulent boundary layer above the sea         main SSA source, except for the very first and last sample
ice during blowing snow (Nishimura and Nemoto, 2005; Ja-          (Fig. 2e).
cobson, 2005).
   Airborne snow particle concentrations at 29 m showed           3.2     The sea ice source of aerosol
strong variability and a weak but significant correlation with
wind speed (R = 0.27, p < 0.01) (Fig. 2a, c). During most         Below we discuss aerosol properties characteristic for a sea
storms, measured snow particle concentrations have contri-        ice source from blowing snow, including the chemical frac-
butions from both blowing snow from the sea ice and precipi-      tionation of SO2−         −
                                                                                  4 and Br as well as aerosol size distribu-
tation from above as further discussed in Sect. 3.4.2. At 29 m,   tions observed above sea ice.
mean total number densities N46−478 were 8.7 × 10³ m−3
during ANT-XXIX/6 and very similar 7.2 × 10³ m−3 dur-             3.2.1    Chemical fractionation of SO2−
                                                                                                       4
ing ANT-XXIX/7 (Table S1 in the Supplement, Fig. S2c).
Near the sea ice surface snow particles were measured for         In non-summer months when biogenic non-sea-salt SO2−        4 is
a total sampling time of 6 d and showed a mean N46−478 of         at a minimum, Antarctic aerosol was observed to be depleted
2.6 × 10⁵ m−3 , on average ∼ 60 times the number density          in SO2−                   +            +                 −
                                                                        4 (relative to Na ) and in Na (relative to Cl ) (Wa-
observed during the same time at 29 m.                            genbach et al., 1998; Legrand et al., 2017). Similar fractiona-
   Aerosol concentrations N0.4−12 at 29 m showed strong           tion in brine and frost flowers in the sea ice nearby attributed
variability with many but not all increases associated with       to precipitation of the mineral mirabilite (Na2 SO4 · 10 H2 O)
storms and blowing snow (Fig. 2d), illustrated by a weak          suggested that the observed SSA must originate from the sea
but significant correlation with wind speed (R = 0.18, p <        ice and not from the open ocean (Wagenbach et al., 1998;
0.01). At 29 m, mean total number densities N0.4−12 were          Rankin et al., 2000). Here we show for the first time that
2.1 × 10⁶ m−3 during ANT-XXIX/6 (Table S2, Fig. 2d).              snow on sea ice is depleted in sulfate (Fig. 4a). DFSO2− of
                                                                                                                              4
N0.4−12 mean values at 2.0 and 0.2 m during ice stations were     most snow samples was positive, showing large scatter and
1.4 × 10⁶ and 1.7 × 10⁶ m−3 , respectively, about the same as     no particular dependence on snowpack depth or sea ice age
the number densities observed during the same time at 29 m        (Fig. 4a). Negative DFSO2− suggests presence of mirabilite
(Table S2). The median aerosol particle diameters dp at the                                    4
                                                                  precipitated during freezing. The median volume-integrated
measurement heights 0.2, 2.0 and 29 m ranged between 0.60
                                                                  DFSO2− in snow ranged between 0.24 and 0.35 (Table 5),
and 0.66 µm (Table S2), showing dominance of submicron-                 4
sized particles in atmospheric aerosol below the instrument       overlapping with the sulfate depletion found in aerosol dur-
particle size cut-off (> 11 µm).                                  ing the period the snow was sampled (ANT6) with median
   Descriptive statistics of the aerosol chemistry are summa-     DFSO2− ranging between 0.29 and 0.48 (Table 4). Consider-
                                                                        4
rized in Table 4. The Na+ concentrations of bulk aerosol          ing all DFSO2− values, no statistical difference is detected be-
                                                                                4
showed strong variability, with most increases coinciding         tween snow and aerosol based on the Wilcoxon rank-sum test
with storms and aerosol number density N0.4−12 peaks              (p < 0.01). The similarity of sulfate depletion in both snow
(Fig. 2e). Note that as discussed in Sect. 3.5 the correlation    and aerosol strongly suggests that snow sea ice in the Wed-
between atmospheric sea salt concentrations estimated based       dell Sea is the dominant source of regional sea salt aerosol.
on filters and N0.4−12 is weak but significant (R = 0.32, p <        The sulfate depletion observed in aerosol and snow
0.01), indicating that CLASP captures some SSA variabil-          (Figs. 2f, 4a) is consistent with mirabilite precipitation. Mean
ity. Na+ and sea salt concentrations were in general higher       temperatures during all ice stations except S3 were below the
at 29 m than at 2 m (Table 4) except during S8 (Fig. 2e).         −6.4 ◦ C threshold of mirabilite precipitation (Table 1). And a
DFSO2− values of aerosol at 29 and 2 m showed strong vari-        recent lab study found that mirabilite precipitation results in
       4
ability ranging most of the time between values near 0 (small     DFSO2− of 0.93 in seawater brine cooled down to −20.6 ◦ C
                                                                        4
depletion) and close to 1 (strong depletion), with occasional     (Butler et al., 2016). Conversely, DFSO2− < 0 in snow or
                                                                                                             4
DFSO2− < 0 indicating enrichment (Fig. 2e). Median DFSO2−
       4                                                     4    aerosol suggests contributions from non-sea-salt SO2−   4 or
values at 29 m were similar during ANT-XXIX/6 (= 0.29)            crystallized mirabilite, which has a DFSO2− of −7.3. The
and ANT-XXIX/7 (= 0.21) but larger near the sea ice surface                                                    4
                                                                  latter is supported by the observation that most DFSO2− < 0
(= 0.48), although vertical differences were not statistically                                                           4

significant based on the Wilcoxon rank-sum test (p < 0.01).       values occur in or near the sea ice surface, where most of the
                                                                  partitioning between brine and mineral is expected to have

www.atmos-chem-phys.net/20/2549/2020/                                               Atmos. Chem. Phys., 20, 2549–2578, 2020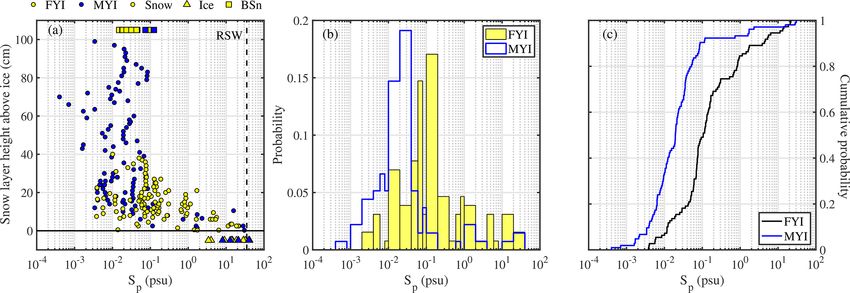
2558                                                                                         M. M. Frey et al.: Sea salt aerosol from blowing snow

Figure 3. Wind rose plots for the position of RV Polarstern during ANT-XXIX/6 (8 June–12 August 2013): (a) horizontal wind speed U at
39 m, (b) ambient temperature Ta , (c) specific humidity of air qv and (d) relative humidity with respect to ice RHice (b–d at 29 m).

Table 4. Descriptive statistics of the aerosol chemistry during ANT-XXIX/6 (ANT6) and ANT-XXIX/7 (ANT7) with mean and median
values weighted by the filter sampling interval. Ion and sea salt concentrations are in units of nanograms per cubic metre (ng m−3 ). See
Sect. 2.3 for definition of depletion factors (DF).

            Parameter                                              ANT6                                                              ANT7
                                            at 2 m                                      at 29 m                                      at 29 m
                                  mean ±σ         median        Na             mean ±σ         median        Na       mean ±σ              median        Na
            Sea saltb          707 ± 1500         336           43         1253 ± 2319         639           106      559 ± 486            425           28
            Na+                 217 ± 460         103           43           384 ± 711         196           106      171 ± 149            130           28
            Cl−                 379 ± 765         179           43          656 ± 1225         302           106      311 ± 282            232           27
            SO2−
               4                 28c ± 61         19c           38            75 ± 152         45             84      33 ± 30              23c           28
            Br−                  2.0 ± 1.0        1.9           42           1.5c ± 3.0        0.7c           98      0.5c ± 0.6           0.5c          23
            DFSO2−             0.29 ± 0.57        0.48          38          0.07 ± 0.94        0.29           74      0.12 ± 0.60          0.21          27
                   4
            DFNa+            −0.08 ± 0.29         −0.03         43       −0.46 ± 2.29          −0.04          97      −0.02 ± 0.19         −0.01         27
            DFBr−            −4.59 ± 7.92         −1.93         42      −1.44 ± 17.36          0.36           93      0.05 ± 1.26          0.49          23
          a Sample size. b Sea salt concentration is derived by multiplying the Na+ concentration by 3.262 based on the Na+ mass fraction in reference seawater
          following Millero et al. (2008). c Below the estimated LOD (Table 3).

occurred during freezing (Fig. 4a). If the partitioning of crys-                        (NaCl · 2 H2 O) once ambient temperature drops below the
tallized Na2 SO4 · 10 H2 O between brine and the snow–ice                               threshold of −22.9 ◦ C (e.g. Butler et al., 2016), which oc-
matrix is the dominating SO2− 4 fractionation process, then                             curred here during some periods of time (Fig. 2b, Table 1).
Na+ should be depleted as well in the brine. Further Na+                                In the analysis below, however, we consider only the pre-
depletion may arise from the precipitation of hydrohalite                               cipitation of mirabilite. Following the approach of Wagen-

Atmos. Chem. Phys., 20, 2549–2578, 2020                                                                        www.atmos-chem-phys.net/20/2549/2020/
M. M. Frey et al.: Sea salt aerosol from blowing snow 2559
Figure 4. Chemical fractionation of snow on sea ice in the Weddell Sea during austral winter 2013. Panel (a) shows sulfate depletion factors
DFSO2− (relative to Na+ ) of snow on first-year sea ice (FYI, yellow symbols) at ice stations S1–6 and multi-year sea ice (MYI, blue symbols)
4
at ice stations S7–9 in the Weddell Sea as a function of snow layer height above the sea ice surface. For comparison, DFSO2− of the sea ice
4
surface (triangles) and blowing snow at 1–17 cm above the snowpack (squares) are shown as well. Panel (b) shows the same but for bromide
depletion factors DFBr− (relative to Na+ ). The sample statistics are summarized in Table 5.
Table 5. Descriptive statistics of the volume-integrated snow chemistry during ANT-XXIX/6 on first-year sea ice (FYI) at ice stations
S1–S6, on multi-year sea ice (MYI) at ice stations S7–9 and for snow layers within 10 cm of the snow surface (TOP10). Ion and sea salt
concentrations are in units of microgram per gram (µg g−1 ). See Sect. 2.3 for definition of depletion factors (DF).
Parameter FYI MYI TOP10
mean ±σ median Na mean ±σ median Na mean ±σ median Na
Snow depth (cm) 20.9 ± 8.3 19.0 17 50.0 ± 32.2 33.0 7 – – –
Sp (psu) 1.40 ± 3.99 0.11 110 0.82 ± 4.31 0.02 104 0.31 ± 0.90 0.06 96
Sea saltb 1176 ± 3518 83 86 590 ± 3157 22 95 249 ± 729 58 80
Na+ 361 ± 1079 26 86 181 ± 968 7 95 76 ± 223 18 80
Cl− 680 ± 2035 48 87 305 ± 1842 13 98 141 ± 415 34 81
SO2−
4 61 ± 182 6 87 30 ± 166 1 98 17 ± 62 3 81
Br− 4.28 ± 12.23 0.18 85 1.76 ± 10.92 0.07 90 1.01 ± 3.72 0.12 78
DFSO2− 0.19 ± 0.41 0.24 86 0.33 ± 0.44 0.35 94 0.27 ± 0.39 0.27 80
4
DFNa+ 0.01 ± 0.38 0.06 86 −1.09 ± 8.88 0.07 94 −0.11 ± 0.99 0.06 80
DFBr− −0.33 ± 1.22 0.05 84 −0.37 ± 1.43 −0.01 87 −0.30 ± 1.25 0.04 77
a Sample size. b Sea salt concentration is derived by multiplying the Na+ concentration by 3.262 based on the Na+ mass fraction in reference seawater
following Millero et al. (2008).
bach et al. (1998) we take Cl− as the reference species for to Na+ ) is derived and compared to observations (Fig. 5).
bulk seawater and find from a mass balance calculation that The observed fractionation is largely in agreement with the
the Cl− to Na+ mass ratio would then be linearly related model prediction. Snow on sea ice follows closely the theo-
to the SO2− +
4 to Na ratio with a slope of −0.98 and an retical mirabilite fractionation line, whereas aerosol shows
intercept of 2.04. From that a theoretical relationship be- large scatter and a tendency to apparent Na+ enrichment
tween DFNa+ (with respect to Cl− ) and DFSO2− (with respect with respect to Cl− of up to 20 %, equivalent to Cl− deple-
4
tion with respect to Na+ of 17 % (Fig. 5). Dechlorination of
www.atmos-chem-phys.net/20/2549/2020/ Atmos. Chem. Phys., 20, 2549–2578, 20202560 M. M. Frey et al.: Sea salt aerosol from blowing snow
shown to be the dominant source of sea salt aerosol. Wa-
genbach et al. (1998) reported sulfate depletion in aerosol
corresponding to DFSO2− of 0.72 at Halley (75◦ S, 26◦ W),
4
of 0.76 at Neumayer (70◦ S, 85◦ W) and of 0.62 at Dumont
d’Urville (66◦ S, 140◦ E). The main cause of smaller DFSO2−
4
observed in aerosol above the Weddell Sea in winter 2013
appears to be the snow source being less depleted in sulfate
during that particular year. In summary, DFSO2− in Antarctic
4
winter aerosol can be used as a tracer to estimate sea ice SSA
fractions of the total aerosol burden at a specific location (e.g.
Legrand et al., 2017); however, temporal and spatial variabil-
ity in DFSO2− of the sea ice source introduce additional un-
4
certainty if not accounted for.
3.2.2 Chemical fractionation of Br−
Modelling studies suggest that sea salt may be an important
source of atmospheric bromine species in the mid- to high
southern latitudes and that SSA from blowing snow releases
Figure 5. Theoretical relationship between depletion factors of bromine (Yang et al., 2008, 2010), driving ozone depletion
sodium DFNa+ (relative to Cl− ) and of sulfate DFSO2− (rela- events observed during or after snow storms (Jones et al.,
4
2009). One of a number of processes identified to cause halo-
tive to Na+ ) in freezing seawater if mirabilite (Na2 SO4 · 10 H2 O)
is progressively precipitated and instantaneously removed (red gen release from aerosol or ice surfaces involves the reaction
line). When all sulfate is removed (DFSO2− = 1) sodium depletion of HOBr with halides (Br− and Cl− ) on acidic ice surfaces
4 forming BrCl and Br2 , which are subsequently photolysed to
reaches its theoretical maximum (DFNa+ = 1.1204). See Sect. 2.3
for definition of depletion factors (DF), which are zero in reference form reactive halogen atoms (Abbatt et al., 2012, and refer-
seawater (RSW) (dashed black lines). Data refer to all observations ences therein). This is a multi-phase process which, depend-
from this study in snow (solid symbols) and aerosol at 2 and 29 m ing upon the substrate, may or may not proceed faster under
above the sea ice surface (open symbols). acidic conditions (Abbatt et al., 2012), and associated un-
certainties are currently still significantly limiting the mod-
elling of impacts on tropospheric halogen chemistry (Sander
et al., 2003; Long et al., 2014). Multi-phase bromine chem-
sea salt aerosol observed in Antarctica has a maximum in istry models use observed sea salt aerosol depletion of bro-
spring/summer, when gaseous acidic species (nitric, sulfu- mide relative to sodium (or chloride) with respect to sea-
ric and methanesulfonic acid) are available to replace chlo- water composition, i.e. bromide depletion factors DFBr− , to
ride on sea salt aerosol (Wagenbach et al., 1998; Rankin and estimate the bromine flux from sea salt aerosol (e.g. Yang
Wolff, 2003; Legrand et al., 2017). Acidic sulfur species are et al., 2008; Long et al., 2014). However, to date observations
close to zero during winter in coastal Antarctica, e.g. at Neu- of bromide aerosol depletion are only available from north
mayer (Weller et al., 2011), whereas nitric acid is low but of 55◦ S (Sander et al., 2003, and references therein), with
non-zero, e.g. 1–2 pptv, at Halley (Jones et al., 2011). Thus, the exception of two recent pioneering studies in Antarctica
nitric-acid-induced Cl− loss from sea salt is a plausible ex- (Legrand et al., 2016; Hara et al., 2018). Below we discuss
planation for the observed Cl− depletion either in airborne bromine chemistry observations above the Weddell Sea dur-
SSA or as a sampling artefact from sea salt already accumu- ing this study.
lated on the filter surface as suggested previously (Wagen- Bulk aerosol concentrations of bromide ranged between
bach et al., 1998; Legrand et al., 2017). Unfortunately no us- < 1 and 19 ng m−3 (Fig. 6a), showing occasional large in-
able filter data of aerosol nitrate are available from this study creases to levels seen elsewhere in coastal Antarctica only
to further test the association between nitrate and sea salt due during summer (Legrand et al., 2016). However, median
to a very high lab procedure blank. It is noted that if all sul- bulk aerosol concentrations of Br− (Table 4) were similar
fate is removed by mirabilite precipitation (DFSO2− = 1) then to coastal observations at Dumont d’Urville during winter
4
sodium depletion reaches a theoretical maximum of ∼ 12 % (Legrand et al., 2016). It should be borne in mind that the
(DFNa+ = 0.1204) (Fig. 5). bromide aerosol concentrations were often below the esti-
The median DFSO2− values of bulk aerosol observed dur- mated LOD due to the short filter exposure times employed
4
ing this study were smaller than previous winter observa- (Fig. 6a). Median bromide concentrations in snow ranged be-
tions at coastal Antarctic sites, where the sea ice surface was tween 0.07 and 0.18 µg g−1 (Table 5). Median DFBr− values
Atmos. Chem. Phys., 20, 2549–2578, 2020 www.atmos-chem-phys.net/20/2549/2020/M. M. Frey et al.: Sea salt aerosol from blowing snow 2561 show that aerosol at 29 m was strongly depleted in bromide relative to sodium with respect to seawater, whereas aerosol near the sea ice surface at 2 m showed mostly strong en- richment (Table 4, Fig. 6b). Median DFBr− in the snowpack ranged between −0.01 and 0.05, suggesting overall no or small depletion in bromide (Table 5). However, examination of individual snow layers as well as blowing-snow samples shows large scatter with both positive and negative DFBr− , suggesting both bromide depletion and enrichment (Fig. 4b). The sea ice surface below the snow was with the exception of one sample always enriched in bromide (Fig. 4b). During the storm on 14–15 July (see Sect. 3.3.2) it is found that the me- dian DFBr− in blowing snow collected on 15 July at < 1 m was close to zero but 0.39 in aerosol at 29 m sampled over the same time interval. These observations are in agreement with previous studies in coastal Antarctica: Legrand et al. (2016) were the first to report year-round bromide depletion in aerosol at Dumont d’Urville (DDU), including during win- ter months except June. At Syowa Station, Hara et al. (2018) also observed bromide depletion in aerosol year-round, but not in blowing snow, which was enriched. They concluded that heterogeneous chemistry driving bromine activation oc- curs on sea salt aerosol and not on blowing snow. Lieb- Lappen and Obbard (2015) observed bromide depletion in Figure 6. Aerosol bromine chemistry above sea ice observed in the blowing snow near McMurdo station but only at > 5 m above Weddell Sea during austral winter/spring 2013. (a) Aerosol Br− the surface. concentrations at 29 and 2 m with the dashed line indicating the From this study it is concluded that air–ice recycling of theoretical LOD (Table 3); (b) depletion factors of bromide DFBr− bromine occurs on surface snow, airborne snow and aerosol (relative to Na+ ) in aerosol at 29 and 2 m and global radiation to particles. However, the vertical gradient in DFBr− (Na+ ) ob- indicate light conditions. served in aerosol suggests that significant net bromine re- lease must take place in the aerosol phase between 2 and 29 m above the sea ice surface. The bromine net release from due to precipitation of mirabilite as done by Legrand et al. large snow particles is expected to be reduced compared to (2016). For comparison, at DDU DFBr− in bulk aerosol in- aerosol due to a combination of shorter atmospheric lifetime creased gradually from a minimum in June (0.04) to interme- and smaller specific surface area limiting diffusional out- diate values in July to September (0.22–0.39) to a maximum gassing. The bromine release from SSA produced by blow- in October (0.42) (Legrand et al., 2016). Increasing DFBr− ing snow may be more efficient because it has a large fraction is consistent with enhanced bromine loss from aerosol as in- of micron- to submicron-sized particles (see Sect. 3.2.3) and cident radiation increases concurrent with activation of the resides at the well-ventilated top of the blowing-snow layer. reactive bromine (BrOx ) cycle (Fig. 6b). Assuming that ob- Thus sea salt aerosol from blowing snow provides an addi- served DFBr− is representative of SSA with median particle tional bromine reservoir, which is readily depleted. Detailed diameters dp of ∼ 0.60–0.66 µm (Table S2), it is also found measurements of participating bromine species in air, snow that the observed bromide depletion is larger than that re- and aerosol are needed to further understand relevant pro- ported by Sander et al. (2003), who state a maximum of 0.4 cesses and constrain the mass budget. for a dp of 1.3 µm, dropping to 0.1 at 10 µm. Models assume a dependence of DFBr− on season and Contrary to expectation bromide depletion of aerosol was aerosol diameter (Yang et al., 2008; Sander et al., 2003). significant even during winter darkness from mid-June to The observed DFBr− of aerosol showed a weak but signif- mid-July (Fig. 6b), whereas previous observations at DDU icant trend (R = 0.19, p < 0.05) from winter into spring showed a similar trend but less bromide depletion and none largely due to less frequent negative values during August in June (Legrand et al., 2016). Light conditions are unlikely and September (Fig. 6b, Table 4). This becomes more evi- a cause of differences in bromide depletion, since DDU dent considering monthly median DFBr− values of aerosol at is located at a similar latitude (66◦ 400 S) to the area cov- 29 m, which increased from June (0.25) to July (0.43), to Au- ered by this study. However, the early laboratory study by gust (0.50) and into September (0.59). DFBr− values would Oum et al. (1998) has shown that HOBr required for Br− be even higher had they been referenced to a seawater ra- oxidation can be chemically produced in darkness through tio adjusted for the maximum possible removal of sodium the reaction of ozone with bromide, a reaction which takes www.atmos-chem-phys.net/20/2549/2020/ Atmos. Chem. Phys., 20, 2549–2578, 2020
You can also read