The Bouraké semi-enclosed lagoon (New Caledonia) - a natural laboratory to study the lifelong adaptation of a coral reef ecosystem to extreme ...
←
→
Page content transcription
If your browser does not render page correctly, please read the page content below
Biogeosciences, 18, 5117–5140, 2021
https://doi.org/10.5194/bg-18-5117-2021
© Author(s) 2021. This work is distributed under
the Creative Commons Attribution 4.0 License.

The Bouraké semi-enclosed lagoon (New Caledonia) – a natural
laboratory to study the lifelong adaptation of a coral reef ecosystem
to extreme environmental conditions
Federica Maggioni1 , Mireille Pujo-Pay2 , Jérome Aucan1,3 , Carlo Cerrano4 , Barbara Calcinai4 , Claude Payri1 ,
Francesca Benzoni5 , Yves Letourneur1 , and Riccardo Rodolfo-Metalpa1
1 ENTROPIE,   IRD, Université de la Réunion, CNRS, IFREMER, Université de Nouvelle-Calédonie,
Nouméa 98800, New Caledonia
2 CNRS, UMR 7621, Laboratoire d’Océanographie Microbienne, Observatoire Océanologique de Banyuls,

Sorbonne Université, Paris, France
3 Pacific Community Center for Ocean Science (SPC), Nouméa, New Caledonia
4 Department of Life and Environmental Sciences (DiSVA), Polytechnic University of Marche, Ancona, Italy
5 Red Sea Research Center, Division of Biological and Environmental Science and Engineering,

King Abdullah University of Science and Technology, 23955-6900 Thuwal, Saudi Arabia

Correspondence: Federica Maggioni (federica.maggioni@ird.fr)

Received: 7 April 2021 – Discussion started: 3 May 2021
Revised: 19 July 2021 – Accepted: 10 August 2021 – Published: 17 September 2021

Abstract. According to current experimental evidence, coral        macroalgae). The data revealed that most physical and chem-
reefs could disappear within the century if CO2 emissions          ical parameters are regulated by the tide, strongly fluctuate
remain unabated. However, recent discoveries of diverse and        three to four times a day, and are entirely predictable. The
high cover reefs that already live under extreme conditions        seawater pH and dissolved oxygen decrease during falling
suggest that some corals might thrive well under hot, high-        tide and reach extreme low values at low tide (7.2 pHT and
pCO2 , and deoxygenated seawater. Volcanic CO2 vents,              1.9 mg O2 L−1 at Bouraké vs. 7.9 pHT and 5.5 mg O2 L−1
semi-enclosed lagoons, and mangrove estuaries are unique           at reference reefs). Dissolved oxygen, temperature, and pH
study sites where one or more ecologically relevant param-         fluctuate according to the tide by up to 4.91 mg O2 L−1 ,
eters for life in the oceans are close to or even worse than       6.50 ◦ C, and 0.69 pHT units on a single day. Furthermore, the
currently projected for the year 2100. Although they do not        concentration of most of the chemical parameters was 1 to 5
perfectly mimic future conditions, these natural laboratories      times higher at the Bouraké lagoon, particularly for organic
offer unique opportunities to explore the mechanisms that          and inorganic carbon and nitrogen but also for some nutri-
reef species could use to keep pace with climate change. To        ents, notably silicates. Surprisingly, despite extreme environ-
achieve this, it is essential to characterize their environment    mental conditions and altered seawater chemical composi-
as a whole and accurately consider all possible environmen-        tion measured at Bouraké, our results reveal a diverse and
tal factors that may differ from what is expected in the future,   high cover community of macroalgae, sponges, and corals
possibly altering the ecosystem response.                          accounting for 28, 11, and 66 species, respectively. Both en-
   This study focuses on the semi-enclosed lagoon of               vironmental variability and nutrient imbalance might con-
Bouraké (New Caledonia, southwest Pacific Ocean) where a           tribute to their survival under such extreme environmental
healthy reef ecosystem thrives in warm, acidified, and deoxy-      conditions. We describe the natural dynamics of the Bouraké
genated water. We used a multi-scale approach to character-        ecosystem and its relevance as a natural laboratory to inves-
ize the main physical-chemical parameters and mapped the           tigate the benthic organism’s adaptive responses to multiple
benthic community composition (i.e., corals, sponges, and          extreme environmental conditions.

Published by Copernicus Publications on behalf of the European Geosciences Union.
5118                                                  F. Maggioni et al.: The Bouraké semi-enclosed lagoon (New Caledonia)

1   Introduction                                                    scriptors makes it difficult to unequivocally identify the main
                                                                    driver(s) of the biological response among the primary fac-
Atmospheric carbon dioxide (CO2 ) has steadily increased            tors (i.e., acidification, warming, and/or deoxygenation), the
over the industrial period (Gattuso et al., 2015), leading to       potential secondary factors (e.g., pollution, water flow, tide,
ocean warming, acidification, and deoxygenation. Although           seawater nutrient and organic content, turbidity, etc.), and
the extent to which these stressors will affect marine life is      their combination. For instance, at CO2 seeps, pH variabil-
still debated, there is no doubt that their combination will        ity can unexpectedly go beyond projected future values (e.g.,
negatively affect a range of marine organisms (e.g., Kroeker        Hall-Spencer et al., 2008; Kerrison et al., 2011), and the po-
et al., 2011; Wittmann and Pörtner, 2013; Hughes et al.,            tential emission of toxic compounds, such as sulfur, arsenic,
2018). Coral reefs are among the most productive and biodi-         and metal trace elements (Vizzini et al., 2013), compromises
verse marine ecosystems on Earth. Their survival is expected        the attribution of specific responses to ocean acidification.
to be compromised by climate change, whose impacts on               Water temperature, pH, and dissolved oxygen can also co-
reef structures and associated communities span from bio-           vary negatively or positively and combine with other sec-
diversity loss to ecosystem shift (e.g., Fabricius et al., 2013;    ondary factors, acting synergistically or antagonistically with
Sunday et al., 2017; Agostini et al., 2018).                        unknown effects on benthic community responses. Their ex-
   Marginal and extreme environments, where some species            treme values and the extent to which organisms are exposed
persist under suboptimal environmental conditions, have be-         are crucial in shaping biological responses (Boyd et al., 2016;
come a precious tool to investigate the potential resilience of     Rivest et al., 2017). For instance, early studies suggest that
marine organisms in the face of climate change (Camp et al.,        temperature fluctuations due to diel or tidal variations could
2017, 2018). These sites may be used as natural laboratories        expose corals to stressful temperatures long enough to in-
where at least one or more environmental parameters natu-           duce acclimatization or adaptation but short enough to avoid
rally mimic extreme environmental conditions over a large           coral mortality (Craig et al., 2001; Oliver and Palumbi, 2011;
area of the ecosystem. They provide an opportunity to si-           Castillo et al., 2012; Palumbi et al., 2014; DeCarlo et al.,
multaneously investigate changes in species responses and           2019). Coral reef organisms from such thermally variable
their ability to acclimatize and adapt to global environmental      environments are expected to respond positively to future
changes (Soares, 2020; Kurihara et al., 2020). Shallow-water        heat events (Rivest et al., 2017). Besides, corals naturally
volcanic CO2 seeps, low pH springs, semi-enclosed bays,             subjected to high pCO2 variability have shown immune de-
mangrove habitats, shallow sheltered-bay reefs, macrotidal          fenses when experimentally exposed to high temperatures,
environments, and low-pH upwelling areas are all poten-             thus buffering the magnitude of thermal stress during heat
tial study systems where the surrounding seawater is sub-           waves (Wall et al., 2021). The extreme tidal range in the
ject to a localized or widespread increase in either pCO2           Kimberley region (northwest of Australia) exposes corals to
or temperature and eventually a decrease in dissolved oxy-          short-term temperature maxima of up to 37 ◦ C and fluctua-
gen (DO; Camp et al., 2018). At these sites, general ob-            tions of up to 7 ◦ C daily. Despite the high temperature, also
servations suggest ecosystem-level consequences of lifelong         combined with strong currents and turbid waters, diverse and
exposure to extreme conditions, such as reduced biological          probably resilient coral reefs have been described there (Dan-
diversity, especially among calcifying organisms, decreased         dan et al., 2015; Schoepf et al., 2015).
rates of coral calcification, and high rates of bioerosion (e.g.,      Overall, only parts of these natural laboratories’ physi-
Hall-Spencer et al., 2008; Manzello et al., 2008; Fabricius et      cal and biogeochemical parameters have been quantified and
al., 2011; Crook et al., 2013; Kroeker et al., 2011; Iglesias-      only during short periods of fieldwork due to logistic con-
Prieto et al., 2014; Milazzo et al., 2014; Paytan et al., 2014).    straints. Long-term monitoring of seawater parameters and
However, some natural laboratories can host very rich reef          their fluctuation is essential to better understand the mecha-
communities. Examples of such sites have been documented            nisms used by resilient reef organisms in these natural labo-
in Palau (Golbuu et al., 2016; Barkley et al., 2017; Sham-          ratories and interpret how marine taxa will respond to future
berger et al., 2018; Kurihara et al., 2021), Papua New Guinea       biogeochemical changes in the environment.
(Pichler et al., 2019), the Kimberley region, Australia (Dan-          The semi-enclosed lagoon of Bouraké (New Caledonia,
dan et al., 2015; Schoepf et al., 2015), mangrove lagoons           southwest Pacific Ocean) has been considered one of the
of New Caledonia (Camp et al., 2017), and the US Virgin             most suitable natural laboratories for future extreme environ-
Islands (Yates et al., 2014). These natural laboratories have       mental conditions (Camp et al., 2019). In a preliminary study,
become a common experimental asset in climate change re-            Camp et al. (2017) reported a series of compelling short-term
search. However, the lack of empirical characterization of the      data of seawater carbonate chemistry and a general survey of
physical and biogeochemical conditions, including diurnal           the coral populations. In this first assessment of the Bouraké
and seasonal fluctuations, have been argued to bias the in-         lagoon, the authors measured diel fluctuations of tempera-
terpretation of the biological mechanisms that trigger the re-      ture (ranging from 25.9 to 33.1 ◦ C), pH (ranging from 7.24 to
sponses of organisms (e.g., Vizzini et al., 2013; Camp et al.,      7.91 pHT units) and DO (ranging from 1.80 to 6.97 mg L−1 )
2018; Aiuppa et al., 2021). Using limited environmental de-         regulated by a 1 m tide. They revealed that about 20 species

Biogeosciences, 18, 5117–5140, 2021                                                   https://doi.org/10.5194/bg-18-5117-2021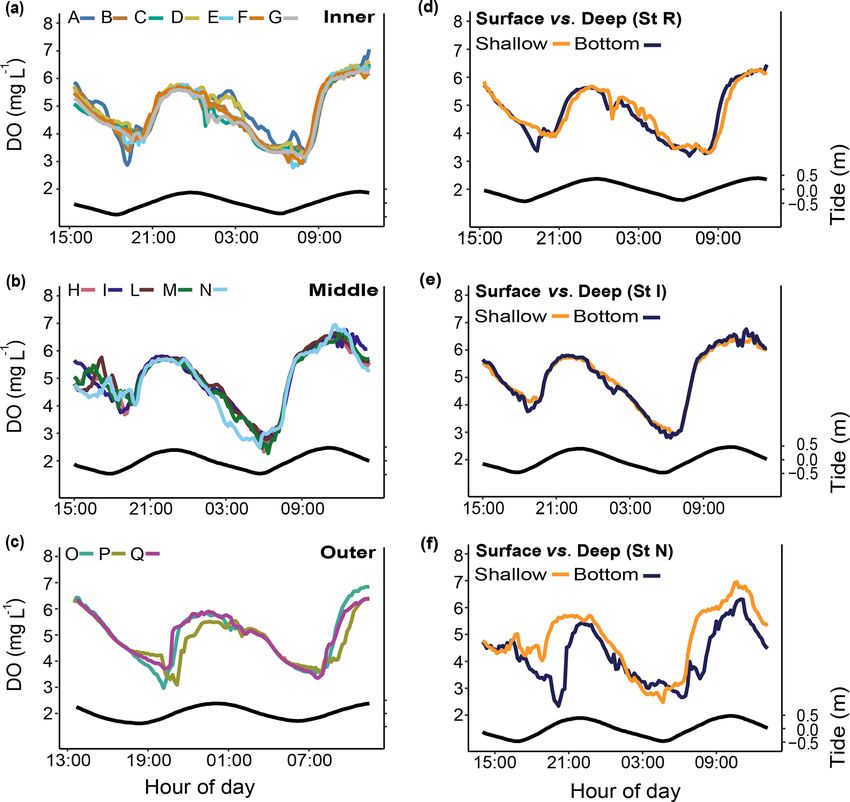
F. Maggioni et al.: The Bouraké semi-enclosed lagoon (New Caledonia)                                                        5119

of corals were exposed 44 % of the time to a pHT of 7.7–         reference reefs, namely R1, a typical fringing reef, and R2,
7.8 and 71 % of the time to temperatures predicted for the       a semi-enclosed shallow and relatively large bay. Both reefs
end of the century under the Intergovernmental Panel on Cli-     are located 4.8 and 3.2 km from the entrance of the Bouraké
mate Change (IPCC) scenario RCP4.5 (IPCC, 2014). These           lagoon, respectively.
striking preliminary findings qualified the Bouraké lagoon as
a unique site where potentially adapted corals withstand ex-     2.2     Environmental monitoring
treme environmental conditions.
   The extent to which the Bouraké species are exposed to        2.2.1    Oceanographic sensors deployment and short- to
suboptimal conditions remains unclear. We believe that the                long-term measurements
best way to assess these very encouraging findings is to start
with fully characterizing the main environmental parame-         From February 2016 to December 2020 up to eight YSI 600
ters and the daily and seasonal fluctuations to which reef       OMS-M loggers, three Seabird SeaFETTM pH loggers, and
species have been subjected during their entire life. Here we    four Hobo Water Temperature Pro V2 loggers were set at
used a multi-scale approach to map and describe the benthic      10 min logging intervals and used individually or in com-
community living in the Bouraké lagoon and report on new         bination to assess short-, medium-, or long-term variations
evidence based on 3 years of data. Because of the size of        across depth (as a proxy of the tide), temperature (◦ C), dis-
the area, the proximity of a dense mangrove forest, and the      solved oxygen concentration (DO, mg L−1 ), seawater pHT
demonstrated tide effect on the local environmental condi-       (total scale), and salinity (see Table S1 in the Supplement
tions, we hypothesize that (1) environmental conditions fluc-    for a summary of data collected during the duration of this
tuate regularly but are spatially heterogeneous throughout the   study). YSI dissolved oxygen optical sensors were calibrated
Bouraké lagoon and (2) only a limited number of species can      against zero and 100 % saturated seawater at 25 ◦ C. Two
resist the extreme physical and chemical conditions at the       SeaFETs were calibrated by the manufacturer, while the third
study site when compared to adjacent bay-sheltered reefs.        was corrected before deployment by measuring its deviation
                                                                 from the two others in the same seawater.
                                                                    Short-term (i.e., 24 h) spatial and depth-related variations
2     Methods                                                    in pH and DO were simultaneously measured at several sta-
                                                                 tions in the Bouraké lagoon in March and April 2018 (Fig. 1).
2.1    Study sites                                               Spatial variations were assessed (i) within the inner (Stations,
                                                                 Sts, A–C for pH and A–G for DO), the middle (Sts H–N for
Starting in February 2016, we studied the semi-enclosed          DO), and the outer (Sts O–Q for DO) reefs, (ii) between the
coral reef lagoon of Bouraké (South Province, Grande Terre,      outer and the inner reefs (Sts B1 and B2 for pH), and (iii)
New Caledonia) and adjacent reference reefs (Fig. 1). The        between the outer and the reef outside the semi-enclosed la-
mangrove forest of Bouraké is located in a semi-arid geo-        goon (St U vs. T for pH). In the Bouraké lagoon, we recorded
graphical area, and it lacks river input typical of mangrove     differences between the surface (shallow) and the bottom wa-
estuaries.                                                       ter: (i) at the outer reef (St S for pH), (ii) at the middle reef
   In Bouraké, a channel of more than 80 m wide and 0.5 to       (Sts I and N for DO), and (iii) at the inner reef (St R for pH
6 m deep penetrates a dense mangrove forest made up of Avi-      and DO). Salinity was measured in July 2019 (Sts R1, R2,
cennia marina and Rhizophora stylosa. It expands into side       B1, and B2) and December 2020 (Sts R1, R2, T, and B2).
pools and a large reservoir in the inner part of the mangrove       Medium-term measurements (i.e., 2–3 weeks) of the DO
system. A preliminary calculation of the surface and seawa-      and pH were recorded at the reference (Sts R1 and R2) and
ter volume of the main area (i.e., without the large seawa-      Bouraké reefs (Sts B1 and B2) between 2016 and 2019.
ter reservoir covered by the mangrove forest) using the 3ds         Long-term measurements (> 1 year) of seawater tempera-
Max Model gives underestimated values of 192 100 m2 and          ture were recorded at R1 and R2 starting from January 2019
246 060 m3 , respectively. Terraces extend from the mangrove     and September 2017, respectively, and at B1 and B2 from
forest on both sides of the channel and form diverse and com-    October 2018 and September 2017, respectively. Only tem-
pact reefs at their ends. Coral species are less abundant and    perature data between October 2018 and April 2020 were
diverse near the mangrove roots, where the bottom substrate      compared between sites.
is composed of fine sediment and mud. There, reefs are ex-          Short-term pH and DO data and long-term temperature
posed to air only at low tide during the spring tides (1.1 m     data were compared between stations using general linear
maximum tidal range). We subdivided the lagoon into three        modeling (GLM), and the Tukey’ HSD (honestly significant
main areas: an external, an intermediate, and an inner reef      difference) post hoc test was used when significant factor
(hereafter called outer, middle, and inner reefs; Fig. 1a and    effects were found. When data did not conform to normal-
b). A series of sampling stations were selected, and some of     ity or homogeneity of variance, the Kruskal–Wallis test fol-
the main seawater chemical and physical environmental pa-        lowed by the Dunn’s multiple comparisons test (Bonferroni-
rameters were measured at the study site and two adjacent        adjusted) or the Wilcoxon test were performed. Statistical

https://doi.org/10.5194/bg-18-5117-2021                                                 Biogeosciences, 18, 5117–5140, 2021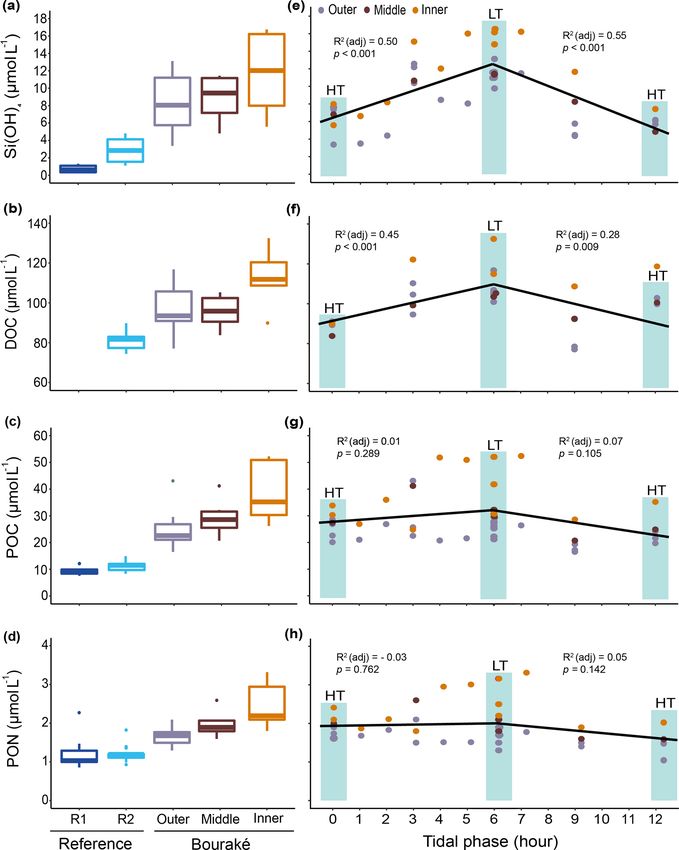
5120                                                    F. Maggioni et al.: The Bouraké semi-enclosed lagoon (New Caledonia)

Figure 1. Map of the study site (top panel) showing the semi-enclosed mangrove lagoon of Bouraké and reference reefs (R1 and R2). Photos
(a) and (b) are aerial pictures (taken at 130 m above the Bouraké lagoon) of the inner (bottom) and middle reefs (a) and the outer reef (b).
White dots and yellow squares indicate the sampling stations used for physical and chemical environmental monitoring, respectively. Georep
New Caledonian database (https://georep.nc/, last access: January 2021) and QGis software were used to build the figure (top panel).

analyses were carried out using either Statistica® or R ver-            of these tidal phases. Similarly, the data were averaged for
sion 3.4.4 (R Core Team, 2018), the latter using “stats”,               each hour of the day (24 h). Because tides at sea are a se-
“FSA”, and “MASS” packages.                                             quence of sinusoidal harmonic components that are different
                                                                        for each location, we performed a harmonic tidal analysis
2.2.2   Phase-averaged and tidal harmonic analyses for                  on the DO and pH data. We used the “UTide”-ut_solv tidal
        diurnal and semidiurnal oscillations                            analysis package (Codiga, 2011) with the principal semidiur-
                                                                        nal lunar constituent (M2 ), principal semidiurnal solar con-
Medium-term pH and DO changes were investigated by av-                  stituent (S2 ), and solar diurnal constituent (S1 ). For each pa-
eraging time and tidal phases for diurnal and semi-diurnal              rameter, the amplitudes of the tidal harmonics M2 (12.4 h),
oscillations. To do this, all data were overlaid on a daily             S2 (12 h), and S1 (24 h) were calculated with a 95 % confi-
period and a tidal phase. First, we calculated a predicted              dence interval based on the 200 Monte-Carlo simulations.
tide for the study area using the Nouméa harbor tide (50 km
south of our study site) modified with coefficients from the            2.2.3    Diel cycles of carbonate chemistry and chemical
Naval Hydrographic and Oceanographic Service (SHOM;                              parameters
http://data.shom.fr, last access: February 2021). The pre-
dicted tide was used to assign a semidiurnal tidal phase (12 h)         Surface water samples were collected across a diel cycle in
to each sampling time, and the data were averaged for each              June 2017 and July 2019 for pH, total alkalinity (AT ), dis-

Biogeosciences, 18, 5117–5140, 2021                                                         https://doi.org/10.5194/bg-18-5117-2021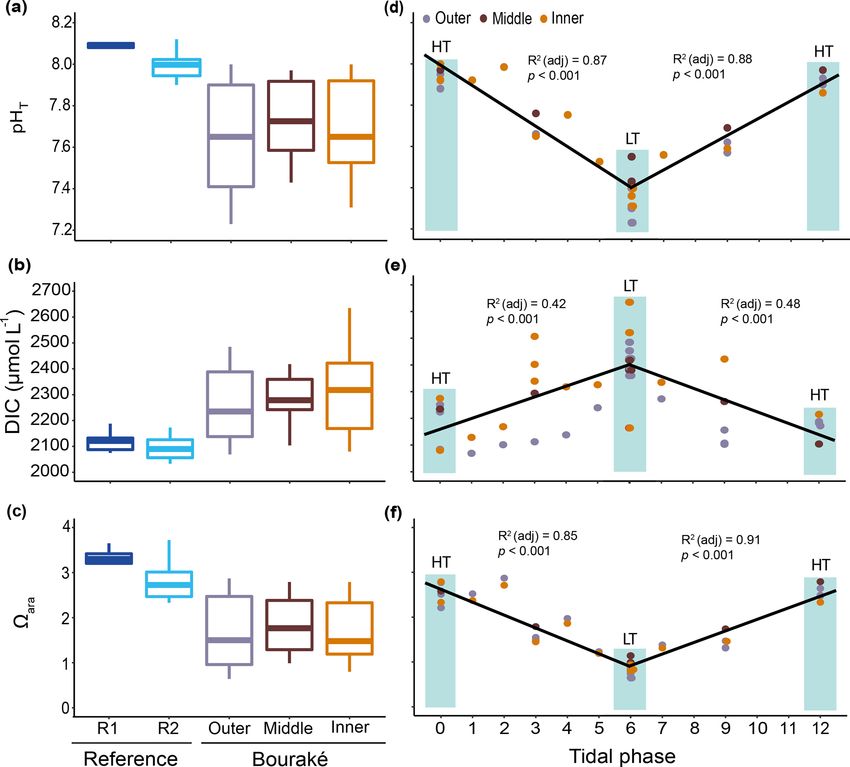
F. Maggioni et al.: The Bouraké semi-enclosed lagoon (New Caledonia)                                                           5121

solved inorganic carbon (DIC), nutrients (orthosilicic acid        ately closed, the absence of bubbles was visually checked,
[Si(OH)4 ], nitrogen oxide [NOx ] (i.e., the sum of NO−   2 and    and the samples were stored in the dark at room tempera-
NO−  3 ), ammonium    [NH 4 ]+ , phosphate [PO ]3− ), dissolved
                                               4                   ture for later analysis on a Shimadzu TOC-L analyzer (non-
organic carbon (DOC), particulate organic carbon (POC),            dispersive infrared, NDIR). Typical analytical precision was
and particulate organic nitrogen (PON) (see Table S2 for a         less than ± 2 µmol kg−1 . The accuracy was verified using
summary of data collected). Dissolved inorganic nitrogen           regular measurements of reference material (CRM) from A.
(DIN) and total organic carbon (TOC) were calculated as            Dickson’s laboratory.
[NOx ]+[NH4 ]+ and DOC+POC, respectively. The most im-                 Seawater samples for DOC were collected in two pre-
portant ratios were calculated (e.g., DOC : TOC; Si(OH)4 :         combusted (4 h at 450 ◦ C) glass ampoules filled with water
DIN) and contrasted between stations to evaluate the avail-        filtered using a glass syringe filtration system (SGETM ) with
ability of nutrients and organic matter in the Bouraké lagoon      two pre-combusted 25 mm WhatmanTM GF/F filters. Sam-
(Jacquet et al., 2006; Leopold et al., 2017).                      ples were then acidified with ultrapure orthophosphoric acid
    In 2017, during 3 consecutive days (from 31 May to 2           (H3 PO4 ), sealed, and stored in the dark at room tempera-
June), seawater was sampled six times: twice during both           ture for later analysis by high-temperature catalytic oxida-
high and low tides and once at both rising and falling tides. In   tion (HTCO) (Sugimura and Suzuki, 1988; Cauwet, 1994)
total, we sampled one reference station (R2), three stations at    on a Shimadzu TOC-L analyzer. Typical analytical preci-
the outer reef of the Bouraké lagoon (outer: Sts B01–B03),         sion was ± 0.1–0.5 µM C (SD). Consensus reference materi-
one at the middle reef (middle: St B04), and one at the in-        als (http://www.rsmas.miami.edu/groups/biogeochem/CRM.
ner reef inside the lagoon (inner: St B05) (Fig. 1). The whole     html, last access: March 2021) were injected every 12 to 17
collection lasted about 30 min.                                    samples to ensure stable operating conditions. DOC concen-
    In 2019, during 3 consecutive days (from 16 to 18 July),       trations are only available for the 2017 sampling because of
sampling was carried out every hour from 08:00 to 15:00 LT.        a sample’s pollution in 2019.
We sampled B1 and B2 on the first day, R1 on the second                Finally, 1 L of unfiltered seawater was collected in a
day, and R2 on the third day.                                      borosilicate glass bottle and stored on ice during sampling
    During diel cycles, at each station and sampling time,         for later measurement of POC and PON contents. In the
pH and temperature were measured at the surface (0.5 m             lab, particulate matter was collected on pre-combusted (4 h
deep) using a portable pH meter (913, Metrohm) calibrated          at 450 ◦ C) WhatmanTM GF/F filters using a Nalgene® vac-
with tris buffer (Dickson Lab, batch no. T28). A subsam-           uum system. The filters were dried at 60 ◦ C in the oven for
ple (50 mL) was filtered through 0.45 µm WhatmanTM Pu-             24 h and stored in airtight glass vials at 4 ◦ C in the dark until
radisc CA filters using a syringe and poisoned with 20 µL sat-     analysis on a CHN PerkinElmer 2400.
urated HgCl2 to further measure AT . Two 20 mL subsamples              All glass bottles and vials used were pre-combusted,
were analyzed using an auto titrator (Eco Titrator, Metrohm),      washed with HCl solutions (10 %), and rinsed using Milli-
and AT was calculated from the Gran function. Results were         Q water.
corrected against AT standards (Andrew G. Dickson, batch               Seawater chemistry data were pooled by sampling
no. 155, Scripps, USA). The seawater carbonate parameters          area (R1, R2, outer, middle, and inner), and differences
pCO2 , CO2− 3 , and aragonite saturation state (ara ) were then   were tested using the Kruskal–Wallis test followed by
calculated from the pHT , AT , temperature, and mean salinity      the Conover test of multiple comparisons (Benjamini–
(35) using the free-access CO2 SYS package (Pierrot et al.,        Hochberg-adjusted). We focused on the effect of the tidal
2006).                                                             phases (i.e., falling and rising tide) on the seawater chem-
    Ammonium concentration was determined on a 40 mL               ical composition in the Bouraké lagoon only by attributing
subsample of unfiltered seawater, collected using a 60 mL          each sample a tidal phase between 0 (high tide) and 6 h (low
Schott bottle, and stored in the dark. Samples were processed      tide) and between 6 and 12 h (high tide). Multiple linear re-
using a fluorimeter (Turner Designs) between 6 and 18 h af-        gression was used to assess the adjusted R 2 and significance
ter 2 mL of OPA reagent (o-phthaldialdehyde) was added             (p < 0.05) of the data from 0 to 6 h (falling tide) and from
(Holmes et al., 1999).                                             6 to 12 h (rising tide) separately. Statistical analyses were
    The sampling of nutrients was performed using two repli-       performed using either Statistica® or R (version 3.2.4; R
cate 20 mL polypropylene vials, rinsed three times using           Core Team, 2018), the latter using the “FSA”, “stats”, and
filtered seawater (WhatmanTM Puradisc CA syringe filters           “Conover.test” packages.
0.45 µm), filled with the sample, and immediately poisoned
with 20 µL saturated HgCl2 . Measurements of PO3−      4 , NOx ,   2.3   Benthic community characterization and
and Si(OH)4 nutrients were performed by colorimetry (Seal                distribution
Analytical).
    Seawater samples for DIC were collected in two repli-          The benthic community and bottom substrate of the Bouraké
cate glass vials (20 mL), filled with unfiltered water, and poi-   lagoon, referred hereafter as biotic and abiotic descriptors,
soned with 10 µL saturated HgCl2 . The vials were immedi-          respectively, were assessed in April 2018. A total of 24

https://doi.org/10.5194/bg-18-5117-2021                                                    Biogeosciences, 18, 5117–5140, 2021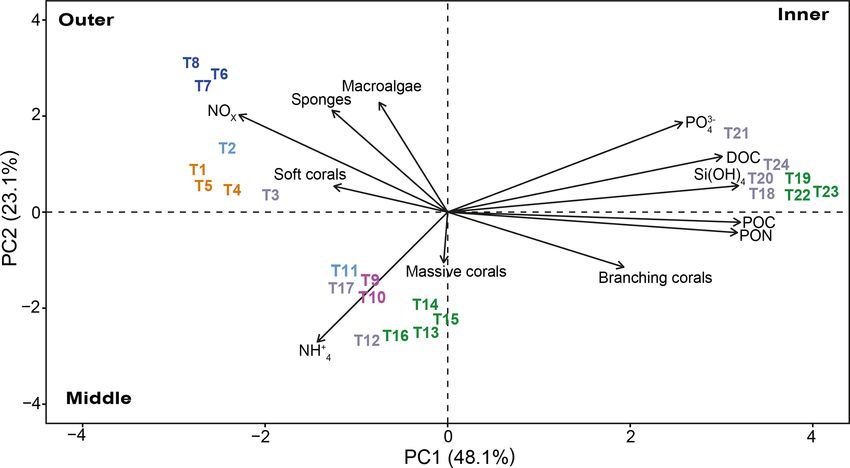
5122                                                  F. Maggioni et al.: The Bouraké semi-enclosed lagoon (New Caledonia)

30 m long georeferenced transects (T1–T24) were laid in                Abiotic and biotic cover percentages averaged per transect
the lagoon along the terraces’ edge at similar depths (i.e.,        and species richness, calculated as the number of species
∼ 1 m), targeting coral-dominated benthic assemblages. On           in the transect, were plotted using non-metric multidimen-
each transect, a 0.5 × 0.5 m PVC quadrat was placed every           sional scaling (nMDS) based on Bray–Curtis dissimilarities
meter, and a picture was taken with a waterproof photo cam-         (“vegan” package in R) of square-root-transformed data. Fi-
era (Nikon AW130) parallel to the substrate. We made a gen-         nally, the best number of clusters for the whole Bouraké la-
eral description of the bottom (i.e., the various substrates)       goon was determined using the gap statistic method (“clus-
and a list of the most common and identifiable sessile species      ter” and “factorextra” packages in R) and used for the hier-
for each transect. For each of the 835 pictures collected, we       archical clustering representation (Ward, 1963). The cluster
estimated the cover of abiotic (i.e., mud, sand, rock, rub-         separation was verified with a two-way ANOSIM (ANalysis
ble, dead corals, and unreadable) and biotic descriptors (i.e.,     Of Similarities). Within each cluster, the benthic community
branching, massive and soft corals, sponges, macroalgae,            and bottom substrate were averaged between transects, and
and “others”) with photoQuad software both by automatic             the dominant biotic and abiotic descriptors were selected and
multi-scale image segmentation regions and manual grid cell         used to define the cluster.
counts when necessary.                                                 Principal component analysis (PCA) was used to visualize
   We used the photos of quadrats, the many other pictures          the correlation between environmental parameters and the
collected during fieldwork, and laboratory morphological ob-        benthic descriptors of transects inside the Bouraké lagoon.
servations on collected samples to produce a non-exhaustive         The analysis was performed in R (package “FactorMineR”,
species list of corals, macroalgae, and sponges. Corals were        version 3.2.4; R Core Team, 2018) using data of biotic de-
comprehensively sampled throughout the Bouraké lagoon               scriptors (averaged per transect) and the seawater parameters
and at the reference reef R2, while dominant macroalgal and         averaged for each sampling area (i.e., outer, middle, and in-
sponge species were collected in the Bouraké lagoon alone           ner reefs).
and only if they were encountered at least three times along
a transect, likely leading to an underestimation of their diver-
sity. Coral diversity was assessed through photographic and         3     Results
sampling during time-based open-search swims and scuba
                                                                    3.1    Variability in physical environmental parameters
dives (Hill and Wilkinson, 2004). Whenever possible, scle-
ractinian corals were identified to species level in situ by        Tidal phases. The predicted tide in the study area (SHOM
photographic sampling only. When identification was doubt-          data) is close to what we measured at R1 and R2 (Fig. 2). It
ful in vivo, or when taxa were characterized by small coral-        is semidiurnal with a diurnal inequality (M2 = 0.44 m, S2 =
lite size (< 1 mm in diameter) and required additional mor-         0.16 m) and has a small diurnal component (S1 = 0.15 m).
phological examination of the skeleton to confirm identifica-       It varies between 0.4 and 1.7 m, depending on the phase of
tion (e.g., genera Acropora, Montipora, and Porites), a frag-       the moon, with a mean of 1.1 m. The tidal range inside the
ment of the colony was collected, tagged, cleaned in sodium         Bouraké lagoon is lower and varies between 0.4 and 1.2 m,
hypochlorite overnight, rinsed in freshwater, and dried. The        with a mean of 0.9 m. At B1 and B2, the tidal signal has an
reference collection is housed at the Institut de Recherche         average lag in the predicted and measured tides at the refer-
pour le Développement (IRD), Nouméa. Microscopic exam-              ence stations of 1.5 h for low tide and up to 45 min for high
ination of the skeletal features allowed species-level identifi-    tide.
cation following the reference literature (Veron and Wallace,          Temperature. Our results indicate that the water temper-
1984; Wallace, 1999; Veron, 2000). Sponges were identified          ature has an annual cycle with lower values during winter
based on their spicules’ morphological characteristics (i.e.,       (May–October) and higher values in summer (November–
shape, length, and width) or using a series of morphologi-          April). Daily averaged temperatures at R2, B1, and B2 were
cal descriptors (e.g., shape, size, color, texture, surface orna-   not significantly different, while the temperature at R1 was
mentations, fibers) for species without spicules. In the lab,       cooler in summer and warmer in winter (Fig. 3a; Table 1)
a subsample of the collected sponges was immediately di-            compared to the other stations. On a weekly basis, the av-
gested using HNO3 , and spicules were measured with an op-          eraged diel temperature variation was significantly different
tical stereomicroscope. For species without spicules, hand-         between stations: 1.34 ± 0.39 ◦ C at R1 and 3.73 ± 0.74 ◦ C at
cut sections of the choanosome and ectosome were observed           B2 (Fig. 3b; Table 1). In a single day, we recorded tempera-
under a stereomicroscope. Species were identified using the         ture fluctuations of up to 3.4 ◦ C at R1 and 6.5 ◦ C at B2.
taxonomical keys of Rützler (1978), Hooper and Van Soest               Seawater pH. During the entire study period, pH was mea-
(2002), and Pons et al. (2017). Macroalgae and coral identifi-      sured during 22, 72, 31, and 72 semidiurnal tidal cycles at R1,
cation was based on morphological and anatomical observa-           R2, B1, and B2, respectively. We overlaid all data at a single
tions following the dedicated literature and referring to spec-     tidal phase of a 12 h (Fig. 4a) and a 24 h cycle (Fig. 4b).
imens housed at IRD Nouméa.

Biogeosciences, 18, 5117–5140, 2021                                                   https://doi.org/10.5194/bg-18-5117-2021
F. Maggioni et al.: The Bouraké semi-enclosed lagoon (New Caledonia) 5123
Figure 2. Temporal shift between the averaged tides recorded at the
reference (Sts R1 and R2) and at the Bouraké (Sts B1 and B2) reefs
and the predicted tide calculated for the study area (see SHOM: http:
//data.shom.fr, last access: February 2021, for the Nouméa harbor).
Figure 4. Seawater pHT (a, b) and dissolved oxygen (DO) (c, d)
variations recorded at the reference (Sts R1 and R2) and Bouraké
(Sts B1 and B2) reefs. Data were overlaid at a single tidal phase
(12 h) (a, c) and at a 24 h cycle (b, d). Data are 22, 72, 31, and 72
semidiurnal tidal cycles for pH and 36, 79, 34, and 42 semidiurnal
tidal cycles for DO, for R1, R2, B1, and B2, respectively.
mum of 8.06 at B2 at low and high tides, respectively (data
not shown). The pH oscillations were mainly semidiurnal
(M2 = 0.27±0.01 and S2 = 0.05±0.01 pHT units for B1 and
M2 = 0.24±0.01 and S2 = 0.09±0.01 pHT units for B2). At
stations R1 and R2, pH changed on average by about 0.1 pHT
units and was mostly dependent on the 24 h cycle (Fig. 4b;
S1 = 0.058±0.004 and S1 = 0.049±0.007 pHT units for R1
and R2, respectively). Simultaneous short-term pH measure-
Figure 3. Long-term temperature monitoring from October 2018 to ments showed significant spatial differences (Fig. 5; Table 1)
April 2020 at the reference (Sts R1 and R2) and Bouraké (Sts B1 between (i) stations A and C, (ii) stations B1 and B2, and (iii)
and B2) reefs. Data are plotted using weekly averaged temperature the outer reef in the Bouraké lagoon (St U) and the station
(a) and weekly averaged diel (b) changes. outside the system (St T). There were also significant depth-
related differences between shallow reefs and bottom water
at stations R and S. In both spatial and depth-related anal-
The pH differed significantly between stations. During yses, differences were approximately 0.05 to 0.1 pHT units,
the studied period, we recorded means of 8.01 ± 0.04 and and we found the lowest values at stations C and B2 and the
7.89 ± 0.08 pHT units at R1 and R2 and 7.80 ± 0.22 and bottom of the channel (Sts R and S).
7.67 ± 0.23 pHT units at B1 and B2, respectively. At both Dissolved oxygen (DO). DO was measured during 36, 79,
B1 and B2, pH was strongly correlated with the tidal cycle 34, and 42 semidiurnal tidal cycles at R1, R2, B1, and B2,
(Fig. 4a; 82 % and 73 % of the total variance were explained respectively. We overlaid all data at a single tidal phase of
by the tidal harmonic analysis, respectively). In contrast, it a 12 h (Fig. 4c) and a 24 h cycle (Fig. 4d). As with pH, the
was only marginally correlated with the 24 h cycle (Fig. 4b). mean diel DO was higher at the reference reefs than in the
During each tidal phase, the pH changed on average by Bouraké lagoon. During the studied period, mean DO values
about 0.6 units and reached a minimum of 7.23 and a maxi- were 4.89 ± 1.18 and 5.23 ± 0.89 mg L−1 at B1 and B2, re-
https://doi.org/10.5194/bg-18-5117-2021 Biogeosciences, 18, 5117–5140, 20215124 F. Maggioni et al.: The Bouraké semi-enclosed lagoon (New Caledonia)
Figure 6. Spatial and depth-related short-term measurements (24 h)
of dissolved oxygen (DO) at stations in the Bouraké lagoon (see
Fig. 1 for the location of the stations). Spatial variations were as-
sessed at (a) the inner reef (Sts A–G), (b) the middle reef (Sts H–N),
and (c) the outer reef (Sts O–Q). Depth-related variations between
shallow reefs and bottom water within the Bouraké lagoon were as-
sessed (d) at the inner reef (St R) and (e, f) at the middle reef (Sts I
and N). Tide (black line) refers to St B2.
and B2, respectively) and higher at high tide (Fig. 4c; 6.0
Figure 5. Spatial and depth-related short-term changes (24 h) in and 6.1 mg L−1 at B1 and B2, respectively). The minimum
pHT at stations in the Bouraké lagoon (see Fig. 1 for the station (1.89 mg L−1 ) and the maximum (7.24 mg L−1 ) DO values
locations). Spatial variations were assessed (a) within the inner reef were both measured at B1 during low and high tides, respec-
(Sts A–C); (b) between the inner and the outer reefs (Sts B1 and tively (data not shown). During a 24 h cycle, DO was lower in
B2); (c) between the outer reef (but still inside the Bouraké lagoon) the early morning (Fig. 4d; 4.0 and 4.3 mg L−1 at B1 and B2,
and the reef outside the semi-enclosed lagoon (St U vs. T). Depth-
respectively) and higher in the middle of the day (Fig. 4d; 5.8
related variations were assessed between shallow reefs and the bot-
tom of the channel (d) at the inner reef (St R) and (e) at the outer
and 5.4 mg L−1 at B1 and B2, respectively). In a single day,
reef (St S). Tide (black line) refers to St B2. we recorded DO fluctuations of up to 6.37 mg L−1 at R1 and
4.91 mg L−1 at B2. At stations R1 and R2, DO was mostly
dependent on the 24 h cycle (S1 = 1.34 ± 0.06 mg L−1 and
S1 = 1.53 ± 0.09 mg L−1 for R1 and R2, respectively) with
spectively, and 6.45±0.95 and 6.48±1.05 mg L−1 at R1 and lower values during the night (Fig. 4d; 5.5 mg L−1 at both
R2, respectively. stations) and higher values in the middle of the day (Fig. 4d;
At stations B1 and B2, DO was strongly correlated 7.8 mg L−1 at both stations).
with the tidal cycle (Fig. 4c; 82 % and 72 % of the total Simultaneous short-term DO measurements (Fig. 6; Ta-
DO variance were explained by the tidal harmonic analy- ble 1) did not show significant differences over a 24 h cycle
sis, respectively) and only marginally with the 24 h cycle at the inner (Sts A–G; except for some specific deviations,
(Fig. 4d). DO oscillations were mainly semidiurnal (M2 = e.g., St A), the middle (Sts H–N), or the outer (Sts O–Q)
1.17 ± 0.08 mg L−1 and M2 = 0.83 ± 0.09 mg L−1 for B1 reef. Dissolved oxygen did not change on a vertical gradient
and B2, respectively) with a substantial diurnal component at stations R and I, but the bottom DO was significantly lower
(S1 = 1.12 ± 0.04 mg L−1 and S1 = 0.681 ± 0.04 mg L−1 for at station N.
B1 and B2, respectively). During a semidiurnal tidal cycle, Salinity (S). Salinity was measured only during two short-
DO was lower at low tide (Fig. 4c; 3.7 and 4.6 mg L−1 at B1 term periods in winter 2019 and summer 2020 (Fig. 7).
Biogeosciences, 18, 5117–5140, 2021 https://doi.org/10.5194/bg-18-5117-2021F. Maggioni et al.: The Bouraké semi-enclosed lagoon (New Caledonia) 5125
Table 1. Summary of the statistical analyses applied to the seawater physical and chemical parameters collected between 2016 and 2020 at
the Bouraké lagoon (Sts B1, B2, A–R, outer, middle, and inner) and at reference reefs (Sts R1 and R2). Differences in temperature, salinity,
and chemical parameters between the Bouraké lagoon and reference reefs and spatial and vertical differences in pH and DO inside the
Bouraké lagoon. K–W: Kruskal–Wallis’s test; W: Wilcoxon test; GLM: general linear model; D: Dunn’s test; T: Tukey’s test; C: Conover’s
test.
Parameters (n) K–W W GLM p Post hoc (test)
Seawater temperature (Sts R1, R2, B1, and B2)
Daily means 2968 68.46 < 0.001 (D) p < 0.001; R1 < R2 = B1 = B2
Weekly oscillations 305 234.63 < 0.001 (D) p < 0.01; R1 < R2 < B1 < B2
Seawater pH (stations)
Spatial inner (A–C) 711 5.320 0.005 (T) p < 0.01; A < C
Spatial (B1 vs. B2) 1820 17.620 < 0.001
Spatial (U vs. T) 7280 189.800 < 0.001
Surface vs. deep (R) 664 26.880 < 0.001
Surface vs. deep (S) 692 41.480 < 0.001
Seawater DO (stations)
Spatial inner (A–G) 1031 1.145 0.330
Spatial middle (H–N) 700 0.636 0.636
Spatial outer (O–Q) 399 1.636 0.196
Surface vs. deep (I) 280 0.000 0.994
Surface vs. deep (N) 280 22.050 < 0.001
Surface vs. deep (R) 258 0.443 0.839
Seawater salinity (stations)
Winter (R1, R2, B1, B2) 1732 463.500 < 0.001 (T) p < 0.01; R1 < R2 < B1 < B2
Summer (R1, R2, T, B2) 5105 1583.000 < 0.001 (T) p < 0.01; R1 < R2 < T < B2
Winter vs. summer (R1) 1872 287 264 < 0.001
Winter vs. summer (R2) 1728 253 060 < 0.001
Winter vs. summer (B2) 1872 150 175 < 0.001
Seawater carbonate chemistry (Sts R1, R2, outer, middle, and inner)
pHT 66 36.48 < 0.001 (C) p < 0.05; R1 > R2 > Inn = Mid = Out
pCO2 66 36.48 < 0.001 (C) p < 0.01; R1 = R2 < Inn = Mid = Out
CO2−
3 66 33.54 < 0.001 (C) p < 0.05; R1 > R2 > Inn = Mid = Out
ara 66 33.27 < 0.001 (C) p < 0.05; R1 > R2 > Inn = Mid = Out
DIC 66 25.95 < 0.001 (C) p < 0.01; R1 = R2 < Inn = Mid = Out
AT 66 20.94 < 0.001 (C) p < 0.05; All 6= but Mid = R1; Mid = R2; Out = Inn; R1 = R2
Seawater chemical parameters (Sts R1, R2, outer, middle, and inner)
SiOH4 66 45.37 < 0.001 (C) p < 0.05; R1 < R2 < Out = Mid = Inn; Inn > Out
NOx 66 26.46 < 0.001 (C) p < 0.05; R1 < R2 = Inn = Mid; Inn < Out; Out > R1; Out > R2
NH+4 66 26.46 < 0.001 (C) p < 0.01; R1 < Inn = Mid = Out = R2
PO3−
4 66 29.43 < 0.001 (C) p < 0.05; All 6=; R2 = Mid
DOC 36 16.12 0.001 (C) p < 0.05; All 6=; Mid = Out
POC 66 52.46 < 0.001 (C) p < 0.05; R1 = R2 < Out < Mid < Inn
PON 66 43.79 < 0.001 (C) p < 0.05; R1 = R2 < Out < Mid < Inn
DIN 66 20.13 < 0.001 (C) p < 0.01; R2 < R1 < Inn = Mid = Out
TOC 36 19.48 < 0.001 (C) p < 0.01; All 6 =; Mid = Out
DIC : DIN 66 17.40 < 0.001 (C) p < 0.01; R1 > R2 = Inn = Mid = Out
POC : PON 66 44.87 < 0.001 (C) p < 0.01; R1 = R2 < Inn = Mid = Out
POC : DOC 36 18.47 < 0.001 (C) p < 0.05; All 6 =; Inn = Mid
DOC : TOC 36 18.21 < 0.001 (C) p < 0.01; R2 < Out < Inn < Mid; Inn = Mid; Inn = Out
Si(OH)4 : DIN 66 43.77 < 0.001 (C) p < 0.01; R2 < Inn > Mid; Mid = Out; R1 = R2
DIN : DIP 65 24.59 < 0.001 (C) p < 0.05; R1 < R2 > Inn; R2 = Out = Mid; Inn = Mid
Si(OH)4 : DIP 65 36.62 < 0.001 (C) p < 0.01; R1 < R2 < Inn = Mid = Out
https://doi.org/10.5194/bg-18-5117-2021 Biogeosciences, 18, 5117–5140, 20215126 F. Maggioni et al.: The Bouraké semi-enclosed lagoon (New Caledonia)
Figure 8. Seawater carbonate chemistry measured (pHT ) and cal-
culated (DIC and ara ) during diel cycles in 2017 and 2019 (pooled
data; see also Fig. S1) at R1, R2, and the Bouraké reefs (outer, mid-
dle, and inner) (a–c). Boxes (n = 6–14) represent the interquartile
range (25th and 75th percentiles); the horizontal line is the me-
dian, and the whiskers represent the data range (i.e., minimum and
maximum). Changes are illustrated across a 12 h tidal phase in the
Figure 7. Short-term salinity monitoring during (a) the winter of Bouraké lagoon (d–f). Linear regression lines are plotted for each
2019 (from 15 to 18 July 2019) at the reference (Sts R1 and R2) falling (HT to LT) and rising (LT to HT) tide. Shaded boxes have
and Bouraké (Sts B1 and B2) reefs and (b) the summer of 2020 only a graphical significance and only suggest the tide changes dur-
(from 29 November to 4 December 2020) at the reference (Sts R1 ing measurements.
and R2) and Bouraké (Sts T and B2) reefs. Tide (black line) refers
to St B2.
3.2 Diel cycles of carbonate chemistry and chemical
parameters
Salinity variations in the Bouraké lagoon were strongly
correlated with the tidal cycle, and the highest mean val- We monitored diel cycles in June 2017 and July 2019 at
ues were measured during both winter and summer. Salin- two reference reefs and three reefs within the semi-enclosed
ity was lower at reference reefs during both the winter and lagoon of Bouraké (i.e., the outer, the middle, and the in-
summer seasons (Fig. 7a and b). The mean salinity during ner reefs). The seawater carbonate chemistry differed signif-
the winter of 2019 was 35.49 ± 0.04 at R1, 35.67 ± 0.10 at icantly between the reference and the Bouraké lagoon reefs
R2, 36.00 ± 0.35 at B1, and 36.17 ± 0.47 at B2 with sig- (Figs. 8a–c and S1 in the Supplement; Tables 1 and 2).
nificant differences between stations (Table 1). Salinity in The reference reefs R1 and R2 had higher pH, CO2− 3 ,
the Bouraké lagoon peaked at 37.22 at B2 during low tide, and ara and lower DIC and pCO2 than the outer, mid-
while it was 35.65 at R1. During the summer of 2020, the dle, or inner reefs in the Bouraké lagoon. The range of val-
mean salinity increased significantly in the Bouraké lagoon, ues in the lagoon was similar to our previous measurements
at 37.22±0.53 at B2 reaching 39.37, while it remained lower (see above), with levels of pCO2 > 2000 µatm and levels of
at R1 at 35.42 ± 0.10 and R2 at 35.71 ± 0.16. During sum- ara < 1. By assigning a tidal phase (from 0 to 12 h) to each
mer 2020, we also measured short-term variations in salinity sample taken in the Bouraké lagoon (all reefs combined),
at station T, which is outside the Bouraké system. Despite its our diel measurements showed significant regressions, ei-
distance from the lagoon entrance, the water mass discharged ther positive or negative, depending on the seawater carbon-
during falling tide increased seawater salinity also at this sta- ate parameter and the tidal phase (Figs. 8d–f and S1; Ta-
tion where we measured a maximum value of 37.33 during ble S3). For example, the DIC reached the highest value of
low tide. 2635 µmol L−1 during low tide at the inner reef with an av-
erage of 2315.1 ± 168.1 µmol L−1 , while CO2− 3 reached the
lowest value of 50.10 µmol kg−1 during low tide at the inner
reef with an average of 109.02 ± 45.59 µmol kg−1 .
Biogeosciences, 18, 5117–5140, 2021 https://doi.org/10.5194/bg-18-5117-2021F. Maggioni et al.: The Bouraké semi-enclosed lagoon (New Caledonia) 5127
between the Bouraké lagoon and the reference reefs (Ta-
bles 1 and 2) with higher average POC : PON, POC : DOC,
Si(OH)4 : DIN, Si(OH)4 : DIP (DIN and DIP signify dis-
solved inorganic nitrogen and phosphorus), and DIN : DIP
(PO3−
4 ) and lower average DIC : DIN and DOC : TOC in the
Bouraké lagoon compared to reference reefs.
3.3 Benthic community distribution and species
identification
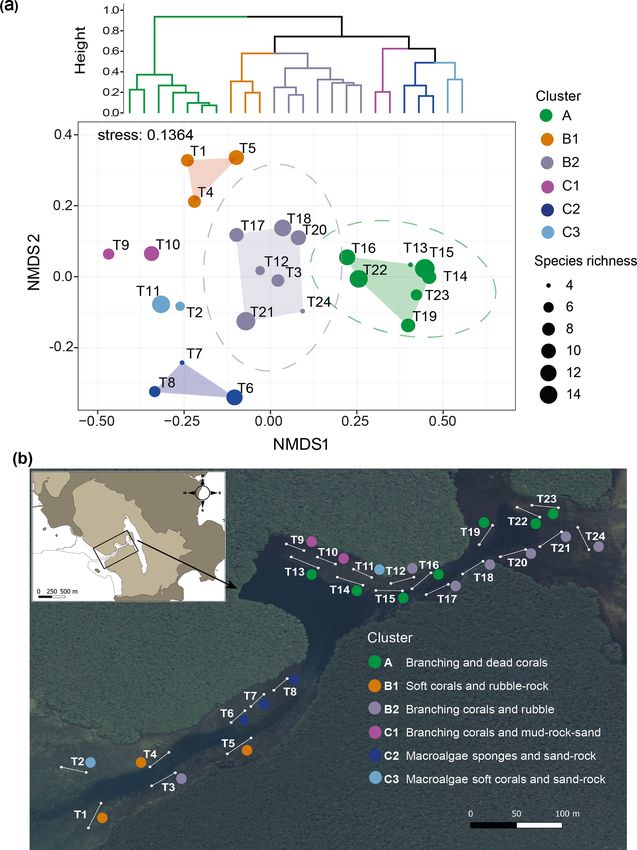
Benthic community distribution. The cluster analysis and
nMDS allowed the 24 transects in the Bouraké lagoon to be
grouped in six clusters corresponding to habitat descriptors,
namely clusters A, B1, B2, C1, C2, and C3 (Fig. 10a; see
Fig. S3 for details of the community descriptors and Table S4
for transect averaged data). The nMDS produced an exhaus-
tive representation of the Bouraké lagoon’s benthic com-
munities and abiotic features (2-dimensional stress = 0.136)
confirmed by ANOSIM (global R = 0.948, p = 0.001). For
the benthic community distribution, a clear separation (95 %
confidence interval represented by the ellipse in Fig. 10a)
was found for cluster A and B2, including most transects lo-
cated at the middle and inner reefs (Fig. 10b).
For both, branching corals were the dominant biotic de-
scriptor with an average of 81 % and 31 % coverage, respec-
tively (Fig. S3), with a maximum of 96 % in cluster A (T23;
Figure 9. Orthosilicic acid, organic carbon, and nitrogen parameters Table S4). Among branching corals, the two most abundant
measured during diel cycles in 2017 and 2019 (pooled data; see also genera were Acropora and Montipora (data not shown). For
Fig. S2) at R1, R2, and the Bouraké reefs (outer, middle, and inner) the abiotic features of the substrate, dead corals and rubble
(a–d). Boxes (n = 6–14) represent the interquartile range (25th and characterized transects in clusters A and B2, respectively.
75th percentiles); the horizontal line is the median, and the whiskers Species richness (Fig. 10a) was high in all transects of the
represent the data range (i.e., minimum and maximum). Changes Bouraké lagoon except T13 and T24, both found at the mid-
are illustrated across a 12 h tidal phase in Bouraké (e–h). Linear dle and inner reefs’ limits. The abiotic substrate of cluster C1
regression lines are plotted for each falling (HT to LT) and rising
was characterized by 66 % mud, 12 % rocks, and 10 % sand
(LT to HT) tide. Shaded boxes have only a graphical significance
(see Table S4 for detailed cover data per transect). Only a few
and only suggest the tide changes during measurements.
branching corals (< 10 %) were found, but species richness
was relatively high (6 at T9 and 10 at T10). Cluster C2 was
distinct, which is not surprising due to its location in a rela-
Most of the chemical parameters were, in general, more tively shallow convergence zone that divides the lagoon into
concentrated (up to 5 times) in the Bouraké lagoon than at two parts. There, the substrate is made of coarse sand (13 %)
the reference reefs R1 and R2, and they increased from the and rocks (12 %) and is mainly colonized by macroalgae and
outer to the inner reef (Figs. 9a–d and S2; Tables 1 and 2). sponges (31 % and 32 %, respectively). Species richness in
In addition, despite the Bouraké lagoon receiving new the area was heterogeneous and ranged from 4 to 12. Dic-
seawater during the rising tide, only Si(OH)4 concentra- tyota spp. and Halimeda discoidea were the main macroal-
tions related to the change in tide showed either a positive gal species, while Rhabdastrella globostellata was the dom-
or negative correlation with the falling and the rising tide inant sponge species in the area. Cluster B1, located at the
(Figs. 9e–h and S2; Table S3). It reached the highest value outer reef, is characterized by an abundance of soft corals
of 16.74 µmol L−1 during low tide at the inner reef with an (48 %) and rubble (21 %), as well as high biological richness
average of 11.93 ± 4.27 µmol L−1 and the lowest value of (Fig. 10a). Cluster C3 is characterized by coarse sand (49 %),
3.38 µmol L−1 during high tide at the outer reef with an aver- rocks (17 %), and a few benthic organisms such as macroal-
age of 8.35 ± 3.14 µmol L−1 , 3 to 6 times higher than at the gae (10 %) and soft corals (8 %).
reference stations R2 and R1. The lack of a clear effect of Principal component analysis (PCA) reduced the multi-
the tide for the other chemicals causes their accumulation in- collinearity problem and the first two principal components
side the lagoon system. Ratios of organic and inorganic car- accounted for a cumulative 71.2 % of the dataset variance. In
bon, nitrogen, and nutrients showed significant differences particular. The PCA plot (Fig. 11) allowed us to assign the
https://doi.org/10.5194/bg-18-5117-2021 Biogeosciences, 18, 5117–5140, 20215128 F. Maggioni et al.: The Bouraké semi-enclosed lagoon (New Caledonia)
Figure 10. Benthic community and bottom substrate characterization in the Bouraké lagoon. Hierarchical Ward’s method cluster dendrogram
(a) and non-metric multidimensional scaling (nMDS) of abiotic and biotic percent cover and species richness per transect (T1–T24) (a).
Colored circles represent clusters of transects identified in the dendrogram; circle size corresponds to species richness. Ellipses represent
95 % confidence intervals. Dominant biotic and abiotic descriptors were used to describe the benthic community and bottom substrate for
each cluster in (b). The satellite image is from Georep New Caledonian database (https://georep.nc/), and the QGis software was used for
transect georeferencing.
transects to three distinct groups depending on their position Terre, with some of them typically found in turbid coastal
in the study area. environments such as Pseudosiderastrea tayamai and Helio-
The distinction among transect groups in the biplot is fungia actiniformis. They were not encountered at the refer-
clear, and they are grouped based on their location at the ence site. Remarkably, two New Caledonian endemic coral
outer, middle, or inner lagoon reefs. The outer reef sites are species, Cantharellus noumeae and Polycyathus fulvus, both
characterized by sponges, macroalgae, and soft corals, which described from coastal habitats characterized by terrigenous
appear to correlate with NOx . Conversely, branching corals sediment inputs (Nouméa lagoon and Prony Bay, respec-
are the shared and characteristic feature of the middle and in- tively), were common at the innermost reef of the Bouraké
ner reef sites. However, these two reef groups differ in their lagoon. The Bouraké lagoon also had 28 species of macroal-
major correlation to NH+ 4 for middle reef sites and POC, gae (14 Phaeophyceae, 9 Chlorophyta, and 5 Rhodophyta),
3− including the crustose coralline algae Lithothamnium sp.,
DOC, Si(OH)4 , and PO4 for the inner sites.
Species identification. A total of 66 coral species were Lithophyllum sp., and Hydrolithon reinboldii, and 11 sponge
identified from the Bouraké lagoon (Table S5). Most of species belonging to eight families of the class Demospon-
the species belong to the family Acroporidae (17 Acropora giae (Tables S5 and S6), which were found mainly in the
species, 2 Anacropora, and 4 Montipora) and Merulinidae coral matrix and sediment.
(15 species). In total, 58 species were identified from the ref-
erence reef R2, 29 of which were also found in the Bouraké
lagoon. Overall, the hard coral fauna within the lagoon was
characterized by species commonly found around Grande
Biogeosciences, 18, 5117–5140, 2021 https://doi.org/10.5194/bg-18-5117-2021F. Maggioni et al.: The Bouraké semi-enclosed lagoon (New Caledonia) 5129
Figure 11. Principal component analysis (PCA) between benthic community (macroalgae, sponges, corals, branching corals, and massive
corals) data and environmental parameters (PON, POC, DOC, Si(OH)4 , PO3− +
4 , NOx , and NH4 ) measured for each transect (n = 24). The
length of the vectors indicates the contribution of each parameter. The first dimension explains 48.1 % of the variance, and the second
dimension explains 23.1 % of the variance. Colors refer to the cluster subdivision (Fig. 10).
4 Discussion 4.1 Physical and chemical characteristics of the
Bouraké lagoon
Marginal and extreme natural environments are increasingly
used to predict the future of reefs in a changing world (Camp
et al., 2018). In these environments, one or the combination The Bouraké lagoon covers an estimated area of ca. 20 ha
of more environmental conditions differ from present-day that penetrates a mangrove forest, which is large enough to
values, providing an opportunity to assess the resilience of assess the combined effects of extreme environmental con-
organisms and to study their adaptive mechanisms in a nat- ditions at an established coral reef ecosystem. Our multi-
ural environment. Coral reefs, exposed to seawater pH and scale approach confirmed previous findings (Camp et al.,
temperature values that are close to or even worse than those 2017), showing that the Bouraké lagoon is hottest (ranging
expected for the future, have likely developed physiological from 17.5–33.8 ◦ C), more deoxygenated (ranging from 1.87–
trade-offs and expressed molecular changes that allow them 7.24 mg L−1 ), and more acidic (ranging from 7.23–8.10 pHT
to survive suboptimal and extreme conditions (Kurihara et units) when compared to neighboring reefs. Besides, we
al., 2021). When using these natural laboratories to predict found that salinity was significantly higher than at the ref-
species responses to future environmental conditions, it is erence reefs during both winter and summer (with maxima
essential to take a multi-scale approach that incorporates the of 37.22 and 39.37, respectively).
spatial and temporal variability in the key physical and chem- We found several marked differences in the environmen-
ical parameters characterizing the study site (e.g., Vizzini tal conditions between the Bouraké lagoon and the reference
et al., 2013; Camp et al., 2018; Aiuppa et al., 2021). Here, reefs, both in the absolute range and in the variability in the
we mapped the spatial and temporal variability in the physi- measured environmental parameters.
cal and chemical parameters in the semi-enclosed lagoon of First, the seawater temperature is higher in summer in
Bouraké, which is likely one of the most suitable natural lab- the Bouraké lagoon (Fig. 3), but it is also colder during
oratories to study the adaptation of corals to the combination winter, resulting in an annual temperature range of 17.5–
of acidification, warming, and deoxygenation (Camp et al., 33.8 ◦ C. We compared temperatures recorded at Bouraké la-
2017). There, we found an unprecedented number of benthic goon to those of the reference St R2, which showed the
species, including two New Caledonian endemics, thriving most typical temperature range for shallow water tempera-
under chronic suboptimal conditions that fluctuate with the tures in the south of New Caledonia (i.e., 22–28 ◦ C; Varil-
tide. While the exact mechanisms explaining their resilience lon et al., 2021). We notice that in Bouraké, temperatures
remains to be discovered, our study provides a compelling were 40 % of the time above 28 ◦ C during the summer of
basis and fundamental baseline for using this site as a natural 2020, while winter temperatures were on average 46.5 % of
laboratory to investigate species’ responses to a combination the time lower than 22 ◦ C. While warming is considered the
of stresses in their natural environment. main threat for coral reefs, low temperatures (< 20 ◦ C) can
cause coral bleaching by inducing responses similar to high
https://doi.org/10.5194/bg-18-5117-2021 Biogeosciences, 18, 5117–5140, 20215130 F. Maggioni et al.: The Bouraké semi-enclosed lagoon (New Caledonia) temperatures, including a reduction in the Symbiodiniaceae cause the water that resided in the mangrove area gradually cell density and chlorophyll a content (e.g., Saxby et al., drains out of the system. This takes about 6 h, during which 2003; Hoegh-Guldberg and Fine, 2004; Hoegh-Guldberg et the vast reservoir of shallow mangrove water continues to be al., 2005; Kemp et al., 2011; Bellworthy and Fine, 2021). chemically altered, becoming increasingly acidic, oxygen- The negative effect of cold temperatures is even more sub- depleted, and hot. As a result, we measured significant spatial stantial during neap tides when colonies on the reef crest differences in pH between the outer reef (the entry of the la- are exposed to air for hours at low temperatures during cold goon) and the inner reef (near the mangrove forest), as well winters. For example, Porter et al. (1982) and Davis (1982) as a considerable delay in the synchronization of the tidal reported > 90 % coral mortality in shallow (< 2 m) reefs of shift (Fig. 5b). Interestingly, because the volume of seawater the Dry Tortugas following the winter of 1976–1977 when discharged in 6 h is so large, it affects also the area outside temperatures reached 14 ◦ C. This is consistent with our ob- the system where we measured similar seawater conditions servations (data not shown) during the cold winter of 2019 as inside, even if it mixes with the main lagoon’s water (see when we found that the upper 12–20 cm of several massive Fig. 5c, St U vs. St T). It means that the area (and the or- and branching corals had died. ganisms) affected by the suboptimal parameters is larger than Second, in the Bouraké lagoon, benthic assemblages are previously thought. The species living in this area have likely continuously exposed to large fluctuations in the main en- developed specific mechanisms to withstand the drastically vironmental parameters toward suboptimal values. Some of fluctuating environmental conditions, and as such, they war- these environmental fluctuations are entirely predictable. For rant further attention. instance, marine organisms are exposed to a temperature Since the fluctuations are linked to tidal phases, it could fluctuation of about twice the reference reefs’ amplitude (up be argued that organisms living in the Bouraké lagoon may to 6.5 vs. 3.5 ◦ C) in a single day. Dissolved oxygen fluctua- benefit from periods of normal conditions at high tide, during tions were similar between stations but in a significantly dif- which they can recover from the stress they have experienced ferent range: 3.7 to 6.8 mg L−1 at B2 and 5.4 to 7.8 mg L−1 at low tide (e.g., Rivest et al., 2017). While this could be at the reference stations. According to the organisms toler- partially the case for species living on the outer reef, close ance to DO fluctuation, which is quite unknown in corals, to the main lagoon, the environmental conditions inside the low DO concentrations can change fish tidal migration in the Bouraké lagoon rarely reach normal values (Fig. 8a–c) and mangrove (Dubuc et al., 2019). Besides, our tidal modeling persist longer as the low tide is delayed by 1.5 h compared to revealed that, at the reference reefs, pH, DO (Fig. 4), and the reference reef (Fig. 2). temperatures (data not shown) slightly increased in the af- Preliminary results from a hydrodynamic model of the ternoon and decreased during the night. This finding agrees study site suggest that tide-associated water mass movements with what should be expected from reef metabolic activities are spatially heterogeneous and likely to play an essential and daily cycles, but, in the Bouraké lagoon, these parame- role in shaping coral resilience to extreme conditions (see ters, including salinity (Fig. 7), are entirely driven by tides. discussion below). Indeed, one can imagine a single water Here, seawater pH and DO varied between extremely low mass moving with the same physical characteristics from the values at low tide and close-to-normal values during high tide mangrove area towards the outer reefs or in the opposite di- (see also Fig. 8a–c for pH). Finally, we found that the timing rection depending on the tide. However, the complex geo- of the tide was out of phase between sites, with a delay of morphology of the Bouraké lagoon, its bottom topography, about 45 min at high tide and 1.5 h at low tide in the Bouraké and the complex web of coral reefs and mangrove trees on lagoon (Fig. 2). the edges deviate and probably change the seawater’s physi- The unique environmental conditions measured in the cal and chemical properties. We measured significant spatial Bouraké lagoon are linked to its unique topographical and differences in pH within each reef area (inner, middle, and geomorphological characteristics, the resulting water circula- outer reefs; Fig. 5a and b), as well as throughout the water tion, and the direction of the tide. New water from the lagoon column (i.e., between the surface and the bottom; Fig. 5d enters through the channel at each rising tide and flows into and e). In general, bottom seawater was 0.1–0.2 pHT units the semi-enclosed lagoon towards the large mangrove area lower than the surface probably due to a pumping mechanism behind it. This water initially had ambient values of pH, tem- by the water mass of more acidic pore water from the sedi- perature, and dissolved oxygen, but, during the trip, it mixes ments. The pH also differed spatially within the inner reef by with the acidic, warm, and deoxygenated water in the system up to 0.3 pHT units (for instance St A vs. C; Fig. 5a), per- and the mangrove area, therefore gradually changing from its haps due to the influence of stagnant water on the mangrove original values. Inside the mangrove forest, we hypothesize edges or a more intense metabolic activity by the local ben- that the water chemistry further changes due to the metabolic thic community. Dissolved oxygen concentrations between reactions in the sediments and mangrove roots (e.g., Alongi the surface and the bottom were only significantly different et al., 2004; Bouillon et al., 2007; Gleeson et al., 2013; Call at St N at the middle reef (Fig. 6f). This station is mainly et al., 2015). Conversely, for a falling tide, the seawater be- characterized by mud as the current is lower than anywhere comes gradually more acidic, hot, and oxygen-depleted be- else in the Bouraké lagoon. Here, the sediment’s biological Biogeosciences, 18, 5117–5140, 2021 https://doi.org/10.5194/bg-18-5117-2021
You can also read