Global in situ Observations of Essential Climate and Ocean Variables at the Air-Sea Interface
←
→
Page content transcription
If your browser does not render page correctly, please read the page content below
REVIEW
                                                                                                                                               published: 30 August 2019
                                                                                                                                          doi: 10.3389/fmars.2019.00419

                                            Global in situ Observations of
                                            Essential Climate and Ocean
                                            Variables at the Air–Sea Interface
                                            Luca R. Centurioni 1* , Jon Turton 2 , Rick Lumpkin 3 , Lancelot Braasch 1 ,
                                            Gary Brassington 4 , Yi Chao 5 , Etienne Charpentier 6 , Zhaohui Chen 7 , Gary Corlett 8 ,
                                            Kathleen Dohan 9 , Craig Donlon 10 , Champika Gallage 6 , Verena Hormann 1 ,
                                            Alexander Ignatov 11 , Bruce Ingleby 12 , Robert Jensen 13 , Boris A. Kelly-Gerreyn 4 ,
                                            Inga M. Koszalka 14 , Xiaopei Lin 7 , Eric Lindstrom 15 , Nikolai Maximenko 16 ,
                          Edited by:        Christopher J. Merchant 17 , Peter Minnett 18 , Anne O’Carroll 19 , Theresa Paluszkiewicz 20† ,
                         Minhan Dai,        Paul Poli 21 , Pierre-Marie Poulain 22 , Gilles Reverdin 23 , Xiujun Sun 7 , Val Swail 24 ,
              Xiamen University, China      Sidney Thurston 25 , Lixin Wu 7 , Lisan Yu 26 , Bin Wang 27 and Dongxiao Zhang 28
                         Reviewed by:       1
                                              Scripps Institution of Oceanography, University of California, San Diego, San Diego, CA, United States, 2 Met Office, Exeter,
                           Scott Doney,     United Kingdom, 3 NOAA’s Atlantic Oceanographic and Meteorological Laboratory, Miami, FL, United States, 4 Bureau
   University of Virginia, United States    of Meteorology, Melbourne, VIC, Australia, 5 Remote Sensing Solutions, Barnstable, MA, United States, 6 World
                          Nadia Pinardi,    Meteorological Organization, Geneva, Switzerland, 7 Ocean University of China, Qingdao, China, 8 EUMETSAT, Darmstadt,
            University of Bologna, Italy    Germany, 9 Earth and Space Research, Seattle, WA, United States, 10 European Space Agency, Paris, France, 11 Center
                   *Correspondence:         for Satellite Applications and Research (STAR), NOAA, College Park, MD, United States, 12 European Centre
                    Luca R. Centurioni      for Medium-Range Weather Forecasts, Reading, United Kingdom, 13 Engineer Research and Development Center,
                 lcenturioni@ucsd.edu       Vicksburg, MS, United States, 14 Department of Meteorology, Stockholm University (MISU), Stockholm University Baltic Sea
                 † Present address:         Centre, Stockholm, Sweden, 15 National Aeronautics and Space Administration, Washington, DC, United States,
                                            16
                                               International Pacific Research Center, School of Ocean and Earth Science and Technology, University of Hawai’i, Honolulu,
             Theresa Paluszkiewicz,
                                            HI, United States, 17 Department of Meteorology, University of Reading, Reading, United Kingdom, 18 Rosenstiel School
     Octopus Ocean Consulting LLC,
                                            of Marine and Atmospheric Science, University of Miami, Miami, FL, United States, 19 European Organization
          Oak Hill, VA, United States
                                            for the Exploitation of Meteorological Satellites, Darmstadt, Germany, 20 Office of Naval Research, Arlington, VA,
                                            United States, 21 Météo-France, Toulouse, France, 22 Istituto Nazionale di Oceanografia e di Geofisica Sperimentale, Trieste,
                   Specialty section:
                                            Italy, 23 UMR 7159 Laboratoire d’Océanographie et du Climat: Expérimentations et Approches Numériques, Paris, France,
         This article was submitted to      24
                                               Environment and Climate Change Canada, Gatineau, QC, Canada, 25 National Oceanic and Atmospheric Administration,
                   Ocean Observation,
                                            Washington, DC, United States, 26 Woods Hole Oceanographic Institution, Woods Hole, MA, United States, 27 National
               a section of the journal
                                            Marine Technology Center, Tianjin, China, 28 Pacific Marine Environmental Laboratory (NOAA), Seattle, WA, United States
          Frontiers in Marine Science
         Received: 30 October 2018
            Accepted: 05 July 2019          The air–sea interface is a key gateway in the Earth system. It is where the
         Published: 30 August 2019          atmosphere sets the ocean in motion, climate/weather-relevant air–sea processes
                              Citation:     occur, and pollutants (i.e., plastic, anthropogenic carbon dioxide, radioactive/chemical
                Centurioni LR, Turton J,
                 Lumpkin R, Braasch L,
                                            waste) enter the sea. Hence, accurate estimates and forecasts of physical and
Brassington G, Chao Y, Charpentier E,       biogeochemical processes at this interface are critical for sustainable blue economy
           Chen Z, Corlett G, Dohan K,
                                            planning, growth, and disaster mitigation. Such estimates and forecasts rely on
     Donlon C, Gallage C, Hormann V,
        Ignatov A, Ingleby B, Jensen R,     accurate and integrated in situ and satellite surface observations. High-impact uses of
 Kelly-Gerreyn BA, Koszalka IM, Lin X,      ocean surface observations of essential ocean/climate variables (EOVs/ECVs) include
            Lindstrom E, Maximenko N,
  Merchant CJ, Minnett P, O’Carroll A,
                                            (1) assimilation into/validation of weather, ocean, and climate forecast models to
  Paluszkiewicz T, Poli P, Poulain P-M,     improve their skill, impact, and value; (2) ocean physics studies (i.e., heat, momentum,
            Reverdin G, Sun X, Swail V,
                                            freshwater, and biogeochemical air–sea fluxes) to further our understanding and
 Thurston S, Wu L, Yu L, Wang B and
          Zhang D (2019) Global in situ     parameterization of air–sea processes; and (3) calibration and validation of satellite
     Observations of Essential Climate      ocean products (i.e., currents, temperature, salinity, sea level, ocean color, wind, and
   and Ocean Variables at the Air–Sea
      Interface. Front. Mar. Sci. 6:419.
                                            waves). We review strengths and limitations, impacts, and sustainability of in situ
       doi: 10.3389/fmars.2019.00419        ocean surface observations of several ECVs and EOVs. We draw a 10-year vision

Frontiers in Marine Science | www.frontiersin.org                                   1                                                August 2019 | Volume 6 | Article 419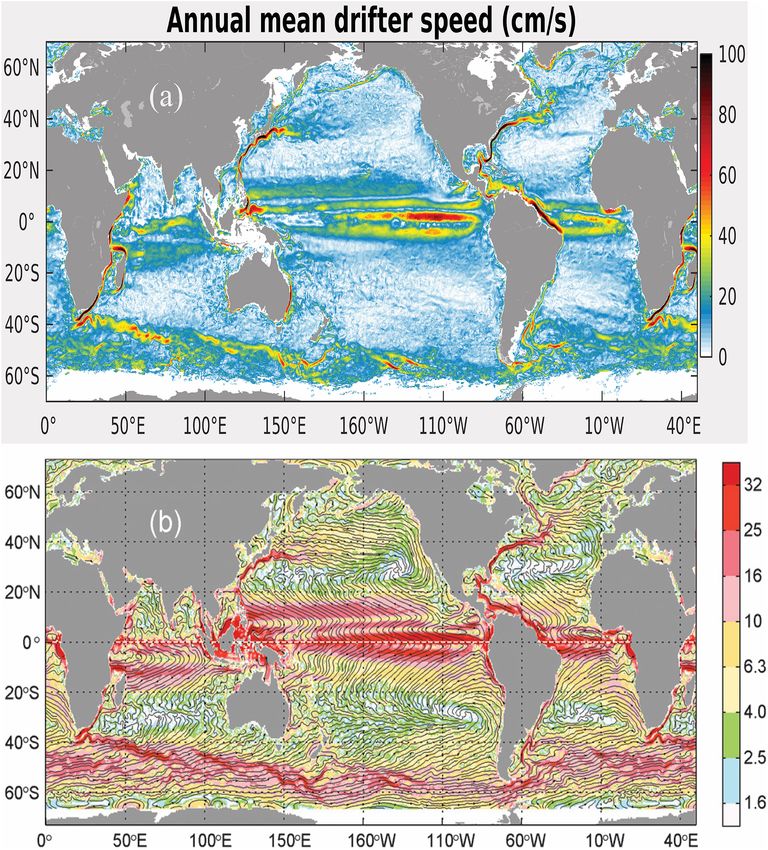
Centurioni et al.                                                                                                                      Global ECV and EOV Observations

                                            of the global ocean surface observing network for improved synergy and integration
                                            with other observing systems (e.g., satellites), for modeling/forecast efforts, and for
                                            a better ocean observing governance. The context is both the applications listed
                                            above and the guidelines of frameworks such as the Global Ocean Observing System
                                            (GOOS) and Global Climate Observing System (GCOS) (both co-sponsored by the
                                            Intergovernmental Oceanographic Commission of UNESCO, IOC–UNESCO; the World
                                            Meteorological Organization, WMO; the United Nations Environment Programme,
                                            UNEP; and the International Science Council, ISC). Networks of multiparametric
                                            platforms, such as the global drifter array, offer opportunities for new and improved
                                            in situ observations. Advances in sensor technology (e.g., low-cost wave sensors),
                                            high-throughput communications, evolving cyberinfrastructures, and data information
                                            systems with potential to improve the scope, efficiency, integration, and sustainability of
                                            the ocean surface observing system are explored.
                                            Keywords: global in situ observations, air-sea interface, essential climate and ocean variables, climate variability
                                            and change, weather forecasting, SVP drifters

INTRODUCTION                                                                           In situ observations at the air–sea interface are currently
                                                                                    obtained from several programs such as the global surface drifter
The air–sea interface is a key gateway in the Earth system. It                      array (GSDA), the Voluntary Observing Ship (VOS) scheme, the
is where the atmosphere sets the ocean in motion, climate and                       tropical moored buoy array (TMBA), OceanSITES, and various
weather-relevant air–sea forcing and feedback processes occur,                      national moored buoy networks. The Argo program, mainly
and pollutants such as plastic, anthropogenic carbon dioxide,                       aimed at studying the depth of the ocean from the surface to 2 km
and some radioactive and chemical waste enter the sea. Hence,                       with profiling floats (Roemmich et al., 2009; Riser et al., 2016),
improving the accuracy of estimates and forecasts of physical and                   also contributes, although to a lesser extent, to characterizing the
biogeochemical processes at this interface has direct impacts on                    air–sea interface.
society and is essential for a sustainable blue economy planning,                      The focus of many of the sustained observational programs
growth, and disaster mitigation. Such estimates and forecasts                       operating at the interface between the ocean and the atmosphere
rely on accurate and integrated in situ and satellite surface                       is to measure key ECVs that are defined under the global
observations of essential climate and ocean variables (ECVs and                     climate observing system (GCOS) framework. Established
EOVs) at the ocean–atmosphere interface and in the respective                       in 1992 and co-sponsored by the World Meteorological
boundary layers.                                                                    Organization (WMO), the Intergovernmental Oceanographic
    Satellite observations offer near-global coverage at useful                     Commission (IOC) of the United Nations Educational, Scientific
spatial and temporal resolution that make them well suited                          and Cultural Organization (UNESCO), the United Nations
for assimilation, alongside in situ observations, into forecasting                  Environment Program (UNEP), and the International Science
models and for estimating the state of the ocean/atmosphere                         Council (ISC), GCOS provides a list of 54 ECVs (including
system. Both active and passive remote sensing techniques are                       near-surface currents, SST, and SLP) needed to support
used in a wide spectral interval spanning visible, infrared, and                    intergovernmental and national oceanographic, climate, and
microwave parts of the spectrum, to measure many of the ECVs                        weather services. The WMO Integrated Global Observing System
and EOVs also sampled by the in situ network. In situ sensors also                  (WIGOS) provides an overarching framework for integrating
provide the data against which satellite retrievals are calibrated,                 the various sources of observations, including the networks
for example, ocean color, and validated, for example, ocean color,                  mentioned above, contributing to WMO applications. The
sea surface temperature (SST), and surface winds (Kilpatrick                        framework includes relevant tools, standards, guidance, and
et al., 2001, 2015; Xu and Ignatov, 2010; Xu and Ignatov, 2014;                     WMO regulatory material. WIGOS also provisions for observing
Ignatov et al., 2016; Loew et al., 2017). However, some variables                   network design and observing system evolution through
such as sea level pressure (SLP) cannot be determined from                          the WMO’s Rolling Review of Requirements (RRR), where
space with current technology, and thus, their acquisition relies                   observational user requirements are compared with observing
solely on in situ platforms. A comprehensive description of the                     systems capabilities1 together with impact studies for the
satellite systems used for remote sensing of the air–sea interface                  identification of observational gaps, leading to prioritization for
is beyond the scope of this review but can be found in Ardhuin                      the evolution of global observing systems and key recommended
et al. (2019a,b), Bourassa et al. (2019), Cronin et al. (2019),                     actions to WMO members and other significant programs to
Gommenginger et al. (2019), Kent et al. (2019), O’Carroll et al.                    address such gaps. One component of WIGOS, the Global
(2019), Smith et al. (2019), Swart et al. (2019), Villas Bôas et al.
(2019), Wanninkhof et al. (2019), and Weller et al. (2019).                         1
                                                                                        https://oscar.wmo.int/surface//index.html#/

Frontiers in Marine Science | www.frontiersin.org                               2                                                     August 2019 | Volume 6 | Article 419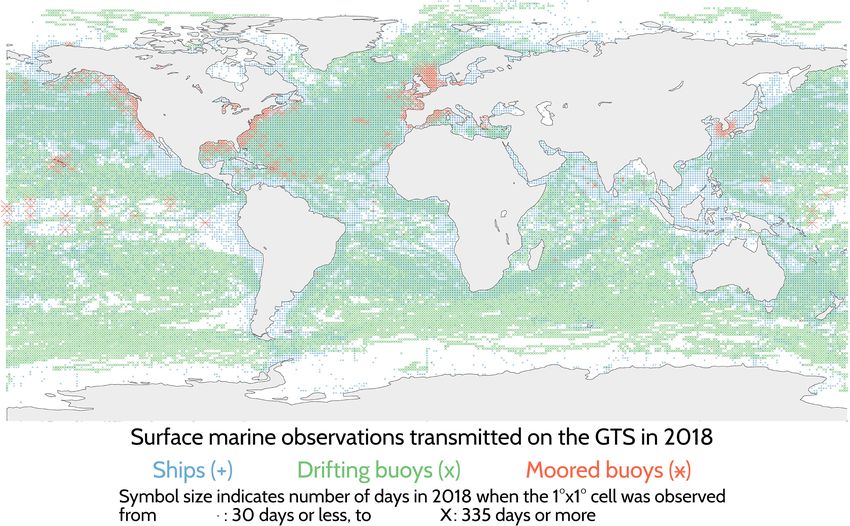
Centurioni et al.                                                                                              Global ECV and EOV Observations

Observing System (GOS), provides for national meteorological              the United States NOAA (National Oceanic and Atmospheric
services (NMSs) and other partners’ contributions to the Global           Administration)-funded Global Drifter Program (GDP; Niiler,
Ocean Observing System (GOOS) and GCOS (meteorological                    2001; Maximenko et al., 2013), which represents along with the
satellites, drifters, moored buoys, and VOS). See Moltmann et al.         SVP the basis of the GSDA. Sustained deployments of drifters
(2019) for more details on WIGOS.                                         quickly grew into a global array with contributions from over
    Many of these global observing networks are made of                   25 countries (see Figure 1) delivering primarily near real-time
collections of national scientific and operational programs               observations of SST and geolocation. The collaboration between
designed and implemented in support of a wide range                       the GSDA and NMSs in the 1990s facilitated the development,
of multidisciplinary scientific research and operational                  testing, and adoption of the barometer drifter (SVP-B; see
applications. Often, data from multiple programs and networks             Figure 3) as a reliable source of SLP data to support weather
are consolidated to facilitate their accessibility and use. One           forecasting with the deployment of such SVP-B drifters in large
example is the International Comprehensive Ocean–Atmosphere               numbers since then. The GSDA reached its full implementation
Data Set (ICOADS) project, which attempts to bring together               when drifter number 1,250 was deployed off Halifax, Nova Scotia,
all available data of the ocean–atmosphere interface (Freeman             Canada, on September 12, 2005, by Distinguished Professor
et al., 2016). Likewise, satellite communities, including the             Dr. Peter Niiler of the Scripps Institution of Oceanography
Group for High-Resolution SST (GHRSST; Donlon et al., 2009),              (SIO) and Dr. Michael Johnson of NOAA, becoming the
consolidate and uniformly quality control the in situ data for the        first fully implemented component of GOOS. The GDP, a
satellite era for use in their calibration and validation systems,        branch of NOAA’s GOOS, is a scientific program that also has
standardize the matchup criteria, and unify and consolidate               substantial impacts on operational activities, including satellite
the comparison metrics (O’Carroll et al., 2019). The European             SST validation and numerical weather prediction (NWP) and
Copernicus Marine Environment Monitoring Service (CMEMS)                  constitutes the principal component of the GSDA. The GSDA is
also relies on data from in situ monitoring networks to provide           coordinated internationally through the Data Buoy Cooperation
robust integrated information and to calibrate and validate the           Panel (DBCP), an international body coordinating the use of
data from satellites.                                                     both drifting and moored data buoys to observe atmospheric
    The purpose of this article is to review strengths, weaknesses,       and oceanographic conditions over the ocean, including regions
impacts, and sustainability of in situ global observing networks          where few other measurements are taken, such as the Southern
measuring target ECVs and EOVs at the air–sea interface                   Ocean. The DBCP was created in 1985 as a joint body of
and to provide a 10-year vision for improved synergy and                  WMO and UNESCO’s IOC. The DBCP constitutes the data buoy
integration with other observing systems (e.g., satellites), for          component of WMO–IOC JCOMM (Pinardi et al., 2019).
modeling/forecast efforts, and for a better ocean observing                   The main objectives of the GDP and GSDA are very closely
governance. We review new emerging technologies, sensors,                 aligned and can be summarized as follows:
newly developed platforms, as well as information technology
advances that have the potential to improve the impact and                   • Maintain a global 5◦ × 5◦ array of satellite-tracked SVP
efficiency of the existing ocean surface observing networks                    drifters (excluding marginal seas and latitudes higher
or the creation of new ones. The context is both the                           than 60◦ N/S) to meet the need for an accurate and
applications listed above and the guidelines of frameworks such                globally dense set of in situ observations of near-surface
as IOC–WMO–UNEP, WMO–IOC Joint Technical Commission                            currents, SST, and SLP.
for Oceanography and Marine Meteorology (JCOMM), ISC,                        • Provide a data processing system to deliver the data to
GCOS, GOOS, and WIGOS (Moltmann et al., 2019).                                 operational and research users via the WMO Global
                                                                               Telecommunication System (GTS) and via quality-
                                                                               controlled (QC), delayed mode products. The release of QC
STATE OF THE ART: EXISTING GLOBAL                                              data products is led by the United States GDP component
NETWORKS FOR OBSERVATIONS AT                                                   at the Atlantic Oceanographic and Meteorological
                                                                               Laboratory (AOML) of NOAA.
THE AIR–SEA INTERFACE.                                                       • Under the lead of the United States GDP component
CONFIGURATION AND IMPACTS                                                      at SIO, the Lagrangian Drifter Laboratory (LDL), to
                                                                               innovate the drifter technology and expand the scope of the
The Global Surface Drifter Array                                               international program by transitioning new technologies
Background and Objectives                                                      and sensors into operation. Examples of recently developed
The large-scale deployment of Lagrangian (i.e., water following)               technologies include water-following drifters measuring
surface drifters drogued at a depth of 15 m and designed                       wind, solar radiation, and directional wave spectra (see
according to the specifications of the Surface Velocity Program                section “Emerging Technologies”).
(SVP; Niiler et al., 1995; Niiler, 2001; Centurioni, 2018; see also
Figure 3 for schematics of several SVP drifter configurations)               The GCOS and GOOS guidelines specify an array of at
began in the tropical Pacific Ocean in 1988 (Hansen and Poulain,          least 1,250 Lagrangian SVP drifting buoys, as needed to achieve
1996). The World Ocean Circulation Experiment (WOCE)                      a 5◦ × 5◦ global coverage. More details on this can be
requirements were instrumental in laying the foundations of               found in Lumpkin et al. (2016), who also discuss the modern

Frontiers in Marine Science | www.frontiersin.org                     3                                       August 2019 | Volume 6 | Article 419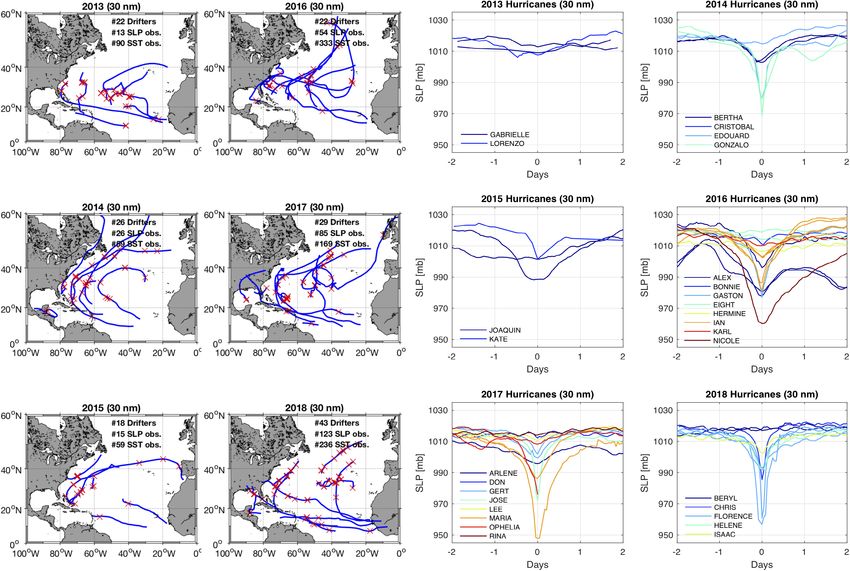
Centurioni et al.                                                                                                           Global ECV and EOV Observations

  FIGURE 1 | Location of SVP drifters forming the GSDA array, color coded by deploying country.

implementation strategy of the GDP and GSDA. A crucial aspect                           The NOAA-funded GDP releases QC ocean current
of the data delivery is that the time interval between data                          data that have supported more than 1,000 peer-reviewed
collection and delivery to the GTS needs to be as short as                           scientific publications (see http://www.aoml.noaa.gov/phod/
possible, typically 15 min or less, in order to meet operational                     dac/gdp_biblio.php for a partial list). The quality of the
forecasting needs. The Iridium satellite system currently satisfies                  data collected with Lagrangian SVP drifters is discussed, for
this requirement, and, at the time of writing, around 80% of                         example, in Niiler (2001), Pazan and Niiler (2001), Lumpkin
the GSDA now transmits its data via Iridium telemetry. It is                         and Pazos (2007), and Maximenko et al. (2013). Ocean
anticipated that by the end of 2019, all drifters in the GSDA will                   current data are available in delayed-time mode because
be using Iridium modems.                                                             the strain gauge sensor used to detect the drogue presence
                                                                                     requires extensive operator interpretation (Lumpkin et al.,
Horizontal Near-Surface Current Observations From                                    2012), historically with a 3-month delay; automatic drogue
SVP Drifters                                                                         loss detection using strain gauge and GPS “time-to-first-fix,”
The historical drifter data archive maintained and served by                         implemented in 2018 by AOML’s DAC, has decreased this delay
the GDP’s Data Assembly Center (DAC) at NOAA/AOML                                    by a factor of three.
dates back to 1979 and consists of observations from more                               Surface current velocity observations derived from SVP
than 22,000 Lagrangian SVP drifters. Near-surface, 15-m                              drifters are directly used to validate the ocean velocity products
deep, ocean currents from SVP drifters are computed from                             of global monitoring and forecasting systems at Mercator Ocean
satellite-derived time series of geolocation obtained with the                       (Lellouche et al., 2013, 2018), including the state-of-the-art Global
Argos satellite system for older drifters and now with Global                        Ocean 1/12◦ Physics Analysis and Forecast. Surface velocities
Positioning System (GPS) satellites. The accuracy of GPS                             are also assimilated into regional ocean model forecast systems,
geolocation is one to two orders of magnitude better than                            leading to substantial improvement in the mesoscale Eulerian
Argos. Consequently, GPS drifters provide more accurate ocean                        and Lagrangian forecast skills (e.g., Muscarella et al., 2015;
current data. Standardized QC techniques and interpolating                           Carrier et al., 2016; Phillipson and Toumi, 2017).
procedures (Hansen and Poulain, 1996) onto regularly spaced                             A good synopsis of recent surface ocean circulation studies
6-h time series are described, for example, in Niiler (2001)                         based on drifter observations can be found in Maximenko
and Maximenko et al. (2013). QC and interpolation of recent                          et al. (2013), and state-of-the-art climatologies produced at
data to hourly intervals are described in Elipot et al. (2016).                      AOML/GDP are discussed by Lumpkin and Johnson (2013) as
The temporal extension of the GSDA dataset testifies to its                          well as Laurindo et al. (2017). These climatologies are used
value as a reference series relevant for climate studies and                         as benchmarks to validate the mean surface currents in the
supports a detailed description of most oceanic mesoscale and                        monitoring and forecasting systems at Mercator Ocean (Gasparin
submesoscale features and the major persistent current systems                       et al., 2018). Regional-scale SVP drifter climatologies have
of the World Ocean.                                                                  been used to study the seasonal and interannual variabilities

Frontiers in Marine Science | www.frontiersin.org                                4                                         August 2019 | Volume 6 | Article 419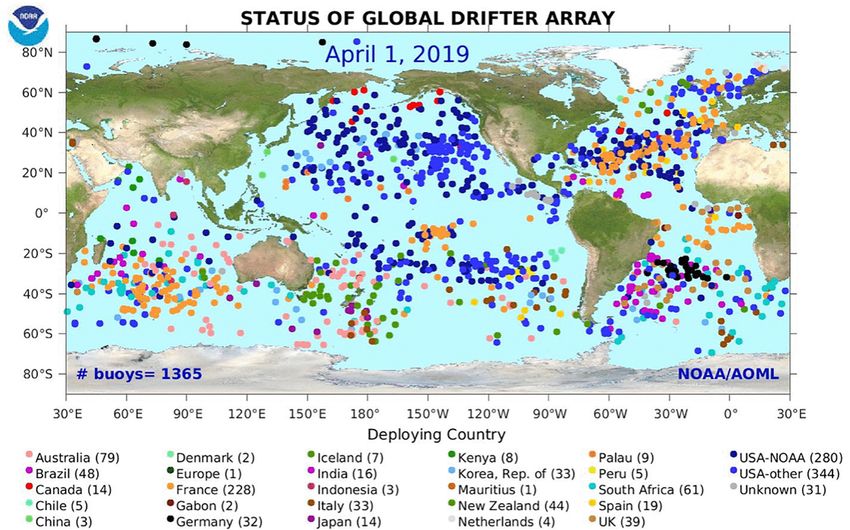
Centurioni et al.                                                                                                                Global ECV and EOV Observations

of the ocean circulation where the data coverage is sufficient                      barotropic tidal currents (Poulain and Centurioni, 2015). Since
(e.g., Andersson et al., 2011; Poulain et al., 2013; Peng et al.,                   2005, multisatellite processing of drifters transmitting through
2015). Methods to remove the biases resulting from the                              the Argos satellite system and the increasing use of GPS on some
irregular spatial and temporal sampling of the GSDA and                             Argos and all Iridium drifters have allowed interpolation down to
to reconstruct the time-dependent geostrophic and Ekman                             hourly intervals (Elipot et al., 2016) to support not only studies of
velocities (Gill, 1982) consist in combining satellite altimetry,                   global tidal currents but also of near- and super-inertial motions.
wind reanalysis products, and, sometimes, the large-scale                           When a wind stress is applied to the ocean surface, such as by
geoid (Centurioni et al., 2008, 2009; Maximenko et al., 2009;                       strong storms or tropical cyclones, the transient ocean response
Niiler et al., 2003a,b) (see Figure 2b as an example of such                        in the mixed layer consists in the generation of cyclonically
a synthesis). The GDP surface drifter dataset also enabled                          rotating near-surface currents that arise due to the Coriolis effect.
global mapping of the mean circulation (Figure 2a) and of                           These are commonly referred to as (near-)inertial oscillations,
characteristics such as cyclonic and anticyclonic motions from                      and their frequency is given by the Coriolis parameter. The
global SVP drifter observations for scales from large eddies                        overall current experienced by a Lagrangian SVP drifter results
to submesoscales (Griffa et al., 2008). Further, high-frequency                     from the superposition of geostrophic currents and preexisting
(super-inertial) drifter velocity observations have been used                       and wind-generated inertial currents, which often manifest in
to map the amplitude and phase of the baroclinic and                                cycloidal drifter trajectories; analysis of drifter observations

  FIGURE 2 | (a) Time mean near-surface current speed (cm/s) measured by GDP drifters; climatology available at https://www.aoml.noaa.gov/phod/gdp/mean
  _velocity.php. (b) Mean streamlines calculated from a combination of mean geostrophic and Ekman velocities; colors are magnitudes of mean geostrophic plus
  Ekman velocity (cm/s) used to compute the streamlines (from Maximenko et al., 2009).

Frontiers in Marine Science | www.frontiersin.org                               5                                              August 2019 | Volume 6 | Article 419
Centurioni et al.                                                                                                         Global ECV and EOV Observations

demonstrates that the period of these oscillations is also modified                  Berry et al., 2018). Three-way error analysis methods attempt
by the vorticity of the background eddy field and has been                           to decouple errors in the three datasets being compared (e.g.,
used to quantify the decay time scales of the oscillations (Elipot                   O’Carroll et al., 2008; Xu and Ignatov, 2010, 2016; Lean and
et al., 2010; Sykulski et al., 2016) in agreement with theory (e.g.,                 Saunders, 2013; Gentemann, 2014). The nominal accuracy and
Kunze, 1985). These inertial oscillations are believed to decay                      digitization of the temperature probes used to measure SST
by propagating to greater depth as internal waves and typically                      from SVP drifters deployed before 2014 were O0.1◦ C. The
subside over a few days to several weeks (e.g., Pollard and Millard,                 use of more accurate temperature sensors, with smaller drift,
1970; Price, 1983; D’Asaro et al., 1995; Hormann et al., 2014).                      improved accuracy (O0.05◦ C) and digitization (O0.01◦ C), and
   Because of the unmatched temporal and spatial resolution                          more accurate geolocation using GPS, is becoming the new
and their ability to accurately measure horizontal ocean currents,                   standard. The triple-collocation studies (e.g., O’Carroll et al.,
the observations from SVP drifters have been used in studies of                      2008; Xu and Ignatov, 2010, 2016; Lean and Saunders, 2013),
lateral dispersion and mixing due to mesoscale and submesoscale                      reviewed and summarized in Kennedy (2014), estimate the
circulations, providing estimates of mixing rates (e.g., Koszalka                    root-mean-square error (rmse; which equates to a standard
et al., 2011; Zhurbas et al., 2014; Roach et al., 2018), regional                    uncertainty) in drifter SSTs in open ocean conditions to be
turbulent transport regimes, and time scale dependence of mixing                     in the range of 0.15–0.25◦ C, higher than the expected range
(e.g., Lacorata et al., 2001; Koszalka et al., 2009; Lumpkin                         of 0.05–0.1◦ C, and the exact cause of this difference is not
and Elipot, 2010). The drifter-derived mixing rates are used                         fully understood.
to evaluate regional ocean models with implications for eddy                            Such estimates of SVP drifter SST uncertainty try to
parameterizations (e.g., Haza et al., 2007; Döös et al., 2011; Rühs                  exclude values affected by “gross errors” (i.e., instrument
et al., 2018). Turbulent parameters estimated from drifters are                      malfunctioning), but the details of any QC used can significantly
used to build stochastic Lagrangian models (e.g., Griffa et al.,                     affect the uncertainty estimate (Kennedy, 2014). Other subtle
1995; Sykulski et al., 2016) that are further used to study signal                   issues may play a role in the observed discrepancy between
propagation of hydrographic anomalies (e.g., Koszalka et al.,                        the nominal and inferred quality of old-generation drifters, and
2013) and dispersion of floating debris (e.g., Cozar et al., 2017;                   these include the stability of the analog/electronic components of
McAdam and van Sebille, 2018).                                                       the temperature sensors and variations in the drifters’ sampling
   A further description of ocean current observations in the                        methodology through the years. The contribution of real
upper-ocean mixed layer from Lagrangian drifters is given by                         geophysical variability between point-wise in situ observations
Lumpkin et al. (2017).                                                               and space-averaged satellite observations that sense SST over
                                                                                     about 1 km or larger pixels was first estimated by Minnett
SST Observations From SVP Drifters                                                   (1991) as 0.2◦ C for AVHRR and, more recently, by Castro et al.
Through the GTS, the drifter SSTs contribute to the majority of                      (2017) as 0.1◦ C for MODIS. New methods for satellite SST
reanalysis and validation datasets (e.g., OSTIA: Donlon et al.,                      validation explicitly include geophysical effects (including depth
2012; Coriolis CORA; the CMEMS drifter validation product:                           and time differences as well as point in space) as summarized
Etienne, 2018; EUMETSAT OSI SAF). Today, SVP drifters                                in Corlett et al. (2014). A benefit of the method detailed in
provide more SST observations than any other source of in situ                       Corlett et al. (2014) is the ability to validate the satellite SST
data, including ships (factor of about 4), coastal moorings (factor                  uncertainty (Lean and Saunders, 2013; Bulgin et al., 2016;
of about 4), tropical moorings (factor of about 50), or Argo                         Nielsen-Englyst et al., 2018). Here, the uncertainty of the SVP
floats (factor of about 100) (Xu and Ignatov, 2014). Together                        drifter data is vital and ideally should be lower than that
with tropical moorings, they cover most of the global oceans,                        of the satellite data itself, which for three-channel retrievals
producing highly accurate data with near-uniform quality across                      from dual-view satellite radiometers is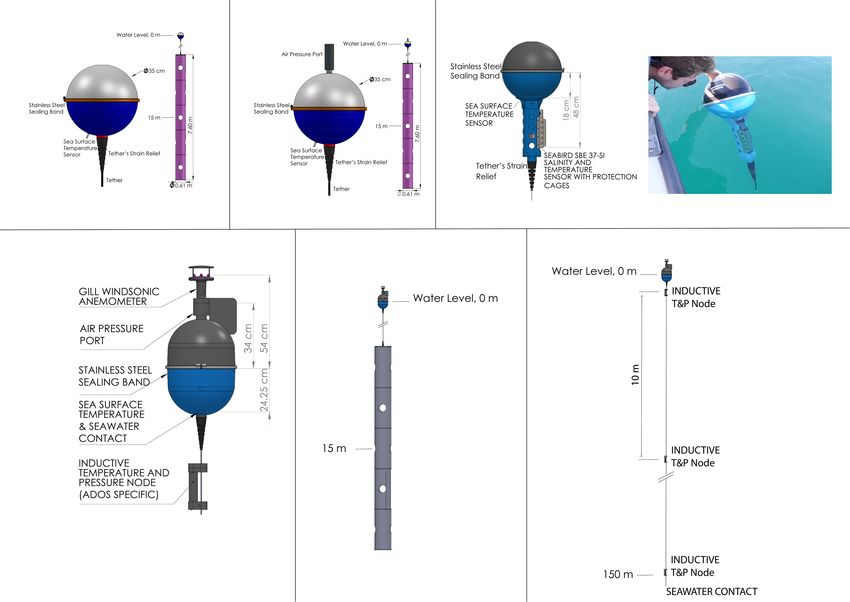
Centurioni et al.                                                                                                                 Global ECV and EOV Observations

the GSDA represents a relatively short time series from a                            between commercial shipping lanes, especially in the Southern
climate perspective, it represents the only source of in situ SLP                    Ocean and in the Arctic region (Woodruff et al., 2011). Even on
data in many ocean regions. SLP observations from SVP-B                              trafficked shipping lanes, drifters are often the only source of SLP
drifters (Figure 3) are more accurate than those from ships                          data when severe weather conditions occur and ships move out
because buoy barometers are located much closer to the sea                           of the impacted areas.
level, whereas ship measurements require extrapolation from                              SLP observations from SVP-B drifters contribute, directly
deck-level measurements (so-called reduction to sea level and                        or indirectly, to many reanalysis products used for climate
subject to human errors), generating additional uncertainty, of                      assessments. Climate-related changes of the mean atmospheric
the order of 0.8–0.9 hPa. SLP observations from ship-automated                       load, or SLP, correspond to about 1-cm change of sea level
systems are free from human error and are of the order of                            for a 100-hPa difference, the so-called inverse barometer effect
0.5 hPa (Poli et al., 2017). By the same diagnostics, SLP data from                  (Wunsch and Stammer, 1997). Although a study of the impact of
SVP-B drifters are characterized by 0.3 to 0.4 hPa rmse, which                       SLP drifter data on the correction of sea-level satellite altimetry
is consistent with the nominal accuracy of the sensor installed                      has never been performed, drifter-derived SLP data are likely to
on the drifters (Centurioni, 2018). This also suggests that the                      provide an important contribution to correct altimetry-derived
sampling methodology of the SVP-B drifters, which are affected                       sea level for atmospheric effects, especially in areas where drifters
by surface waves that can be several meters in height (it should be                  are the main or unique source of SLP ocean data.
recalled here that SLP can only be measured when the barometer                           Sea level pressure data from SVP-B drifters are used in
port is exposed to air and that, because of their large drogues,                     the computation of trends to diagnose climate models and
drifters tend to float in the troughs and be submerged at crests in                  to construct climate indices. For example, the tropical Pacific
high seas), is not introducing a bias.                                               SLP field is used to define the Multivariate El Niño–Southern
   The spatial distribution of SLP data over the ocean, if SVP-B                     Oscillation (ENSO) Index (MEI; Wolter and Timlin, 2011).
drifters were removed, would be affected by large gaps that exist                    The Southern Annular Mode (SAM) index is defined as the

  FIGURE 3 | (A) Schematic of the LDL SVP drifter (SST, 15-m depth currents). (B) Schematic of the LDL SVP-B drifter (SST, SLP, 15-m depth currents).
  (C) Schematic and picture of the LDL SVP-S drifter (SST, SSS, SLP optional, 15-m depth currents). (D) Schematic of the surface buoy (horizontal wind, SLP, SST)
  used for the LDL Minimet and ADOS drifters. (E) Schematic of the Minimet drifter (SST, SLP, horizontal wind, and 15-m depth currents). (F) Schematic of the ADOS
  drifter (SST, SLP, horizontal wind, subsurface temperature and pressure, up to 200 m with 10-m resolution). The ADOS can also be configured with ADCPs and
  conductivity sensors. All sensors use inductive communication modules to relay the data in real time through the Iridium satellite system.

Frontiers in Marine Science | www.frontiersin.org                                7                                               August 2019 | Volume 6 | Article 419
Centurioni et al.                                                                                                  Global ECV and EOV Observations

SLP difference between 40 and 65◦ S (Gong and Wang, 1999),                  Such assessments are often run operationally by ECMWF, the
and the North Atlantic Oscillation (NAO) index is based                     United Kingdom Met Office, and the Global Modeling and
on the SLP difference between the subtropical (Azores) high                 Assimilation Office of NASA. When the impact per observation
and the subpolar low. SLP data from SVP-B drifters are also                 or the fraction of beneficial observations is computed, the in situ
included in the Hadley Centre’s monthly historical mean SLP                 drifter SLP data provide some of the largest values among the
dataset (HadSLP2) and the ICOADS v.2.5 (ranging from 1662                   main components of GOS (Centurioni et al., 2017b; Horányi
to 2007), and subsequent updates are based exclusively on                   et al., 2017). In addition, Ingleby and Isaksen (2018) assessed
observations available on the GTS (Woodruff et al., 2011).                  the impact of removing half of the drifter SLP data from the
Substantial differences between reanalysis products are observed            assimilation; they concluded that the observing system was not
in regions where observations are sparse, including the Southern            yet saturated, and there was much room for improvement with
Ocean and southeastern Pacific (Allan and Ansell, 2006). Other              additional SLP drifter data.
climate products that use the drifter data (i.e., SST and SLP)
are global reanalyses, such as the Climate Forecast System                  Other Observations From SVP Drifters
Reanalysis (CFSR) of the National Centers for Environmental                 Lagrangian drifters based on the SVP design can be configured
Prediction (NCEP; Saha et al., 2010), the European Centre for               with a variety of meteorological and oceanographic sensors
Medium-Range Weather Forecasts (ECMWF) Interim reanalysis                   (Figure 3), including Gill’s Windsonic anemometers,
(ERA-Interim; Dee et al., 2011), the United States National                 conductivity sensors to measure sea surface salinity (SSS),
Aeronautics and Space Administration (NASA) Modern-Era                      radiometers and pyranometers, hydrophones, acoustic Doppler
Retrospective analysis for Research and Applications, Version 2             current profilers (ADCPs), and subsurface temperature and
(MERRA-2; Gelaro et al., 2017), the 55-year Japanese Reanalysis             conductivity sensors (see Centurioni, 2018 for a review of
(JRA-55; Kobayashi et al., 2015), the 20th Century Reanalysis               the current technology). A large number of salinity drifters
(20CR; Compo et al., 2011), and the ECMWF 20th century                      were deployed in recent years in support of the two “Salinity
reanalysis (Poli et al., 2016). As reanalysis systems are evolving to       Processes in the Upper-ocean Regional Study” (i.e., SPURS-1 and
describe the Earth system, they move toward ocean–atmosphere                SPURS-2) campaigns (Centurioni et al., 2015; Hormann et al.,
coupling, as noted at the 5th International Conference on                   2015; Reverdin et al., 2015; Schmitt et al., 2015), and in the Bay of
Reanalyses (Buizza et al., 2018); to support advances in                    Bengal during the Office of Naval Research (ONR) Departmental
atmosphere–ocean coupling, the subsequent demand for air–sea                Research Initiative (DRI) “Air–Sea Interactions in the Northern
interface observations is expected to grow.                                 Indian Ocean–Regional Initiative” (ASIRI; Hormann et al.,
    SLP observations are used to assess changes in the frequency            2016). Salinity drifters can provide SSS observations with an
of occurrence and intensity of extratropical storms, to monitor             accuracy of about 0.01 psu for 1 year (Hormann et al., 2015).
and predict monsoon variabilities as well as trends in extreme
weather. However, recent Intergovernmental Panel on Climate                 Voluntary Observing Ship Scheme
Change (IPCC) reports indicate that the confidence in some of               International coordination of observing the weather from ships
these evaluations is low due to inconsistencies between reanalysis          started as long ago as 1853 and has led to the WMO VOS
products that use data from different years (e.g., early 1900s)             scheme, which is an international program in which ships
and of different quality as well as the lack of long-term data,             are recruited by NMSs to make meteorological observations
particularly in the southern hemisphere (IPCC, 2013 report,                 at sea. Participation in the VOS scheme is encouraged in the
pg. 2–62). Ensuring the continuity of in situ SLP observations              International Maritime Organization (IMO) Safety of Life at
coming from a variety of sources, including the GSDA, should                Sea (SOLAS) convention. The VOS scheme is an observing
be considered a priority.                                                   program of the Ship Observations Team (SOT), coordinated
    A particularly significant impact of the GSDA is the                    by the WMO–IOC JCOMM and described by Smith et al.
beneficial influence of drifter SLP data for NWP. Ingleby (2010)            (2019), including the contribution of oceanographic research
provides an overview of in situ ocean surface observations                  vessels to observations at the air–sea interface. VOS report air
from a NWP perspective. Recent studies have quantified the                  and sea variables that are assimilated in forecasting models and
implications of the non-availability of these data (Centurioni              used for reanalysis products, similarly to those from drifters
et al., 2017b). Observing system experiments (OSEs), as discussed           described above. In addition, VOS generally also report critical
in Centurioni et al. (2017b) and Horányi et al. (2017), were                variables such as air temperature as well as relative humidity
performed with the objective to evaluate associated NWP errors              and wind, which are also assimilated in operational weather
against reanalyses when only drifter SLP data were removed.                 models and global reanalyses. Furthermore, when observers
The main conclusions of these studies are that the in situ drifter          are present, observations of clouds and sea state are also
SLP data reduce the forecast error up to 5 days ahead near                  collected. Figure 4 shows the locations of observations from
the surface and higher in the troposphere, up to 250 hPa. The               VOS for a selected time period. This map indicates that the
largest error reductions were observed for the mean SLP and                 concentration of VOS is greater near economic centers of activity
wind field forecasts. Such studies also suggest that the expansion          and shipping corridors or along coastlines. A few research
of the SVP-B array to the tropics should be considered. Forecast            vessels are further equipped with sensors to measure salinity,
sensitivity observation impact (FSOI) studies were also used to             pH, fluorescence, and currents, though such information is
quantify the impact on the principal components of GCOS.                    generally not included in the VOS reports, but only available

Frontiers in Marine Science | www.frontiersin.org                       8                                         August 2019 | Volume 6 | Article 419
Centurioni et al. Global ECV and EOV Observations FIGURE 4 | Data coverage by the three major components of GOS (i.e., ships, drifting buoys, and moored buoys) based on information received by Météo-France through the GTS in 2018 (see legend for symbol details). in delayed mode and for research. Currently, only few or Such data serve to develop fiducial reference measurements no automated stations with broadcasting to the GTS report (FRM) of SST from ships (Theocharous et al., 2016). parameters such as pH, fluorescence, clouds, sea state, and For further information, we refer the reader to the review currents. However, notable efforts are underway for pH and by Smith et al. (2019) on the role of ship-based observations, fluorescence (e.g., Choquer et al., 2013), for waves (Christensen including but not limited to VOS, in support of the physical, et al., 2013) as well as for currents from position, compass biological, and carbon dioxide (CO2 ) communities. direction, and ship speed transmitted through the Automatic Identification System (AIS; Guichoux et al., 2016). In recent Moored Buoys decades, there has been a slow decline in the number of ships As noted earlier, the DBCP also coordinates observations in the traditional VOS scheme, partly offset by an increase from the TMBA and the various national (mainly coastal) in automated (usually hourly) ship reports. There has also meteorological and oceanographic moored buoy networks been an increase in average ship size. About half of the ship (including directional wave buoys). Figure 4 shows that the measurements are relatively close to the coast (see Ingleby, 2010 coverage achieved by moored buoys, especially the TMBA, and references therein). complements the surface drifter array, which tends to be advected Compared to drifters, the more complete set of variables away from the equatorial band by the ocean circulation. The from VOS enables the computation of air–sea fluxes from bulk TMBA spans the Pacific (TAO/TRITON), Atlantic (PIRATA), parametrizations. A notable example is the surface flux and and Indian (RAMA) ocean basins. It consists primarily meteorological dataset of the National Oceanography Centre of T-FLEX moorings developed at NOAA/Pacific Marine (NOC) version 2.0 (Berry and Kent, 2009), where air and Environmental Laboratory (PMEL), and their configurations sea temperatures observed by ships, along with observations are determined by climate and regional processes of interest of humidity, wind speed, and cloud cover, are used to in the different basins. Reevaluations, such as the so-called estimate various components of heat fluxes (i.e., sensible, latent, TPOS 2020 effort (Cravatte et al., 2016), aim to maintain or short-, and longwave radiation). Such estimates are then useful increase the value of the arrays while responding to changes in benchmarks for the performance of weather and climate models partner commitments and funding pressures as well as other and lead advances toward ocean–atmosphere coupling in models constraints (e.g., vandalism on data buoys). Numerous regional and data assimilation (Freeman et al., 2019). partners work together to maintain the three arrays, which Finally, research vessels can be equipped to directly require significant investment of ship time. TMBA moorings measure some components of the air–sea fluxes (e.g., outgoing measure wind speed and direction, air temperature, humidity longwave radiation). This information is readily comparable to and downward shortwave radiation, and many also measure SLP. satellite measurements, enabling a better understanding of the Ocean parameters measured include temperature and salinity in uncertainties caused by atmospheric absorption in the retrievals. the upper 500 m of the ocean, and most also measure ocean Frontiers in Marine Science | www.frontiersin.org 9 August 2019 | Volume 6 | Article 419
Centurioni et al.                                                                                                  Global ECV and EOV Observations

currents at a depth of about 10 m using point acoustic current              demonstrated that data from Lagrangian SVP drifters were
meters. The TMBA additionally includes a small number of                    critical for adequate modeling of debris drift from the 2011
ADCP moorings providing vertical profiles of ocean currents.                tsunami in Japan to North American and Hawaiian shorelines.
Some TMBA as well as OceanSITES moorings have added                         Drifters are expected to play an important role in the future
biogeochemical observations such as oxygen, CO2 fugacity, and               Integrated Marine Debris Observing System (IMDOS; De
acoustic monitoring.                                                        Dominicis et al., 2012; Maximenko et al., 2019).
    Over the last 25 years or so, national moored buoy networks                It should also be noted that some observing programs,
have been developed by many countries as part of their                      driven by a scientific rather than fully operational rational, are
operational observing capabilities. As such, there is no single             capable of addressing fast response needs to emergencies or can
global network of moored buoys but rather a “network of                     provide critical data for such applications in an opportunistic
networks,” capable of measuring a wide range of ECVs and                    way. For example, the GDP can quickly air-deploy special
EOVs from marine meteorology and waves to subsurface                        drifters designed to measure wind speed and direction, SLP,
oceanographic measurements that complement other sources                    SST, subsurface temperature, and directional wave spectra
of synoptic observations in coastal seas and the open ocean.                ahead of tropical storms and provide real-time data through
They provide real-time data for operational services such as                the GTS and web server interfaces to forecasters and for
marine weather and wave forecasts (both for assimilation into               post-storm season assessments. These buoys are deployed from
and validation of forecast models), maritime safety information             C-130J aircrafts by the United States Air Force Reserve’s 53rd
and warnings to end users, information for marine disaster                  Weather Reconnaissance Squadron “Hurricane Hunters.” The
and accident response, calibration/validation of satellite-derived          latest deployment, at the time of writing occurred ahead of
observations, and data for research purposes. Many of these                 Hurricane Michael in the Gulf of Mexico on October 8, 2018,
networks have been in place for at least a couple of decades, some          when drifters sampled storm conditions at the sea surface for
for as long as 40 years, and so provide valuable time series for            several hours ahead of the storm, inside the eye, and in the
marine climate studies, in particular for wave climate analyses.            wake of the storm (Figure 5). It should be noted that the drifter
Advances in sensor technology, moorings, best practices, and                technology has matured to a level of sophistication that allows
sharing of experience and expertise are coordinated through the             such instruments to go through tropical cyclones unscathed (e.g.,
DBCP and have helped improve the performance and reliability                D’Asaro et al., 2013; Mrvaljevic et al., 2013; Hormann et al., 2014;
of these systems at sea.                                                    Centurioni, 2018).
    Similar to drifters and ships, moored buoy data also assist                Furthermore, the GSDA is maintained with a buoy density
in the development of ocean–atmosphere coupling in numerical                that makes encounters of drifters with tropical cyclones a rather
models. For example, the June 2018 upgrade of the ECMWF                     common occurrence, thus providing valuable SST and SLP
operational system to coupling was validated using moored buoys             observations for assimilation into forecasting models and to
measuring SLP, air and sea temperatures as well as wind speed               support forecast analysis. In the North Atlantic alone and for
(Mogensen et al., 2018).                                                    the January 2013–September 2018 period, a total of 160 SVP and
                                                                            SVP-B drifters were within 30 nautical miles (nm) of the tracks of
                                                                            systems that eventually developed into hurricanes (Figure 6).
Other Impacts of the Existing Air–Sea
Networks
Besides the demonstrated beneficial impact of several air–sea               GAPS AND LIMITATIONS OF THE
in situ observations for NWP as well as operational ocean                   EXISTING AIR–SEA IN SITU NETWORK
forecasting and their importance for assembling climate datasets
used for research and assessments discussed in the previous                 It is fair to say that the current air–sea in situ observing system
paragraphs, data relayed from the existing air–sea in situ                  is covering the basic needs for SST, SLP, and mixed-layer current
observational networks are commonly supporting a variety of                 observations. Notable lack of observed ECVs/EOVs at a spatial
other applications with direct relevance to society and the                 scale and temporal resolution compared to that provided by
development of blue economy.                                                the GSDA include SSS, surface wind, directional wave spectra,
    One example of the latter is the exploitation of the Lagrangian         air temperature, and relative humidity. For many (but not all)
properties of drogued SVP drifters to study the biological                  of these variables, the VOS and the moored buoy networks
dispersal (e.g., Carlton et al., 2017; Miller, 2018) and recruitment        are the only sources of data, thus leaving many critical regions
of fish larvae to support stock management (e.g., Hare and Walsh,           undersampled or not sampled at all. In the following, we review
2007; Booker et al., 2008).                                                 gaps and limitations of each observing system component.
    Also, surface currents transport oil spills and marine debris.
Generally, every type of pollution moves differently from each              The Global Surface Drifter Array
other as well as from the water parcels. Modeling this drift                In its present configuration, the GSDA is sustainable with respect
remains challenging because it is a result of the rectification             to global SST and near-surface currents, but gaps in the drifter
of high-frequency motions and a function of the near-surface                distribution remain. Notable areas include some parts of the
vertical structure of the currents, neither of which are resolved           western Indian Ocean, stretching into the Arabian Sea, where
by the present observing system. Maximenko et al. (2018)                    sustained deployments in partnership with the shipping industry

Frontiers in Marine Science | www.frontiersin.org                      10                                        August 2019 | Volume 6 | Article 419
Centurioni et al. Global ECV and EOV Observations
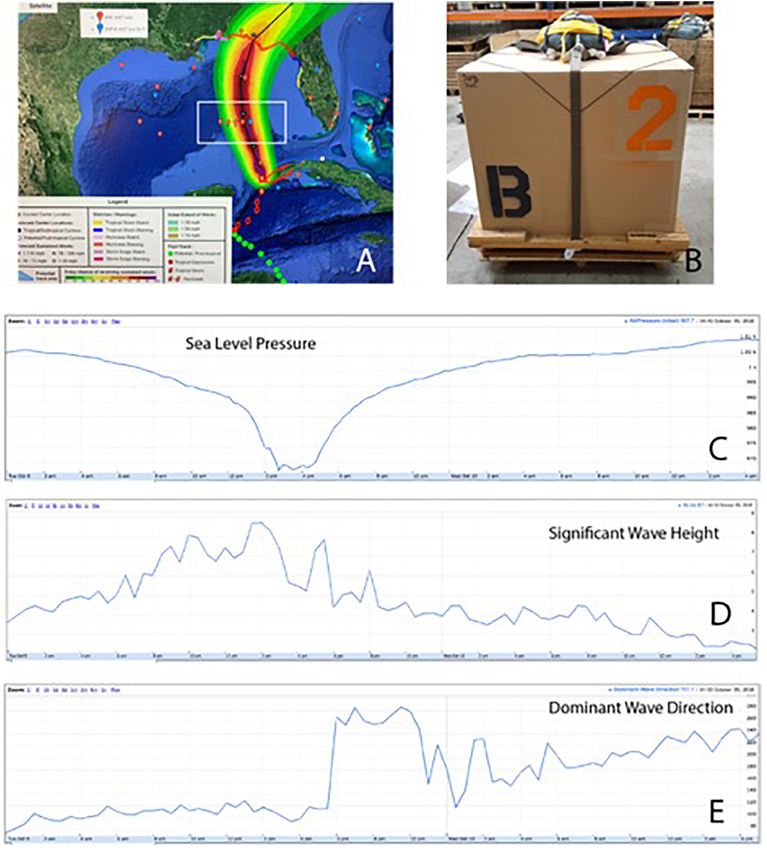
FIGURE 5 | (A) Deployment location of 10 drifters ahead of Hurricane Michael (white box). The drifters were deployed on October 8, 2018, from a C-130J aircraft by
the United States Air Force Reserve’s 53rd Weather Reconnaissance Squadron “Hurricane Hunters.” The transect was located approximately 24 h ahead of the
predicted track of the storm, which is shown by green and red symbols. The forecast for the wind intensity is overlaid as a contour plot (see legend in panel A). The
storm data were provided by NOAA’s National Hurricane Center (NHC). The 10 drifters were air-deployed at five stations using the deployment package shown in
panel (B). Each box contained one SVP-B drifter and one directional wave spectra (DWS) drifter. One SVP-B drifter measured a minimum air pressure of 967.7 hPa
inside the eye of the hurricane (C). The DWS drifter deployed at the same location measured a maximum significant wave height of 8.7 m (D). Note the sharp
change of the dominant wave direction due to the hurricane moving over the DWS drifter (E) and the rapid decay of the wave field in the wake of the storm.
still present logistical challenges (Centurioni et al., 2017a). oceanographic connotation, with various NMSs from several
Furthermore, drifting buoys are largely absent in the Arctic, countries. These include NOAA’s National Weather Services,
notably during summer months when the basin becomes largely Members of the European Meteorological Services Network
ice free, with the exception of ice buoys deployed as part of the (EUMETNET), Canada, Australia, South Africa, New Zealand,
Arctic Buoy Program and the Year of Polar Prediction (YOPP) India, and many other partners who are interested in maintaining
targeting important SLP observations. a global network of barometers at the sea surface. Such
The demonstrated beneficial impact of drifter SLP data in collaborations are coordinated by the DBCP and implemented
climate research and NWP is sufficient to justify the installation through both the direct purchase of barometer drifters and
of barometers on all of the GSDA drifters, but as of now, by means of the GDP barometer drifter upgrade program.
only about 50% of the drifters carry barometers, mainly due Therefore, the collaboration with the meteorological services
to the additional cost (approximately 1,100 US$ per unit) and has the effect to provide a significant number (i.e., 25–30%) of
funding limitations. One of the most difficult tasks is to sustain additional drifter deployments.
a global drifter distribution; crucial to achieving this goal is During the last decade, the drifter technology has evolved to
the collaboration of the GDP, which evolved with a strong measure other ECVs/EOVs. Drifters designed at SIO can measure
Frontiers in Marine Science | www.frontiersin.org 11 August 2019 | Volume 6 | Article 419Centurioni et al. Global ECV and EOV Observations
FIGURE 6 | Drifter/hurricane encounters (June 2013–September 2018). All drifter observations are within 60 min of the track location. Matches within 30 nm (left) are
marked by red crosses. The hurricane tracks are shown in blue. For each hurricane season, the numbers of drifter/hurricane encounters are reported for each
matching criterion as well as the total number of SST and SLP observations collected. Time series of SLP for drifter/hurricane matches selected using the 30-nm
proximity criteria, color coded by storm name, are also shown. The time series are 4 days long and are centered around the minimum SLP pressure observed by the
drifters.
SSS, sea-level wind velocity (Centurioni, 2018), upper-ocean with the sea level, to report accurate SLP measurements. For
temperature profiles, and surface radiation. Such technologies wind, accounting for airflow distortion can help to reconcile
could be deployed for sustained operations, but funding air-flux measurements (using corrected winds) with direct flux
limitations prevent the implementation on a global scale. Other measurements (Landwehr et al., 2015).
observational gaps that could be addressed with surface drifters SST is most often measured at the engine intake or
include air temperature, water vapor, sea state, and velocity shear using hull contact sensors, but on a small number of
in the upper ocean. commercial vessels as well as research ships, infrared radiometers
can be deployed to provide skin SST measurements of
Voluntary Observing Ship Scheme high accuracy. Two such instruments, the ISAR (Infrared
While ships can host a wide variety of sensors, placement of Sea Surface Temperature Autonomous Radiometer), a filter
sensors is a primary issue for all variables. For SLP, the barometer radiometer with internal calibration (Donlon et al., 2008),
can be up to several tens of meters above the surface, which and the M-AERI (Marine-Atmospheric Emitted Radiance
introduces considerable additional errors when adjusting the Interferometer), a Fourier-transform infrared spectroradiometer,
measurements to the sea surface, especially when the proper also have internal blackbodies for at-sea calibration (Minnett
barometer height is not used or misused (e.g., height depends et al., 2001). These radiometers were specifically developed to
on ship’s load, which is variable and often not reported). take measurements suitable for the validation of satellite-derived
For temperature, the ship structures are known to affect the SSTs (Corlett et al., 2014), and both types have been deployed
measurements, and daytime measurements are most affected on commercial ships for this purpose (Minnett, 2010; Wimmer
by biases (Berry et al., 2004). For wind, in spite of general et al., 2012; Donlon et al., 2014a,b) as well as on research vessels.
placement at the highest point (to reduce circulation effects A major advantage of using a M-AERI-type instrument is that
on the ship structures), it should also be noted that the ship besides measuring the skin SST, a near-surface air temperature
structure can sometimes disturb the air flow (Popinet et al., 2004). can be derived (Minnett et al., 2005) and, hence, an accurate
For some of these challenges, there are possible ways forward. determination of the air–sea temperature difference. In addition,
For example, reduction in cost of multifrequency, multisystem the analysis of the infrared emission spectra of the sea surface
Global Navigation Satellite System (GNSS) technology may can lead to an estimation of the temperature profile through the
permit dynamic estimation of the barometer height, along ocean skin layer (Wong and Minnett, 2016a,b) and the response
Frontiers in Marine Science | www.frontiersin.org 12 August 2019 | Volume 6 | Article 419Centurioni et al. Global ECV and EOV Observations
of the skin layer to infrared radiative forcing (Wong and Minnett, EMERGING TECHNOLOGIES
2018), which are not accessible by in situ methods.
In this section, we describe some of the emerging technologies
Moored Buoys that are either mature for operations and large-scale deployments
Moored buoys are generally regarded as providing the or have the potential to address some of the gaps and
highest-quality observations of a wide range of marine shortcomings described in the previous section.
meteorological variables and, as noted earlier, are used to provide
“ground truth” observations for satellite calibration/validation Directional Wave Spectra (DWS) Drifters
as well as for estimates of surface fluxes (e.g., Bourras, 2006) Developed by the LDL at SIO, the DWS drifter (Centurioni
for which wind speed is an essential parameter. However, et al., 2016 and Figure 7) is a very-low-cost and accurate
due to the costs and logistics in operating moored buoys, wave rider based on the GPS technology that returns in real
they cannot provide global spatial coverage as drifters do time the directional wave spectra of surface gravity waves
since they are primarily located in the tropics and adjacent and GHRSST-compliant SST. The DWS drifter is capable of
to coastlines (mainly in the northern hemisphere) to meet a 1-year-long mission with 6-h measurements. The power
national operational requirements. Deployment and servicing of spectral density, co-spectra, and quadrature-spectra parameters
moored buoys require dedicated ship time, which is becoming are derived by a Fourier transform of the correlation functions
increasingly costly. Typically, servicing intervals can be as long as related to each pair of the three-dimensional wave orbital
2 years, during which time the sensors, which are often exposed velocities, giving the “First-5” independent Fourier coefficients
to severe weather conditions, may drift or fail. On some moored (a0 , a1 , a2 , b1 , b2 ) and, thus, the wave spectra for each 6-h (but
buoy networks, this can be partly mitigated by having dual sensor as often as half-hourly) sea state. For each measured sea state,
systems to provide increased resilience. In addition, the mooring the three velocity components, the computed “First-5” Fourier
lines generally need replacing every 2 to 4 years, and these can be coefficients, and the main wave data parameters can be stored
expensive for deep ocean moorings that can be several thousand onboard an optional data logger while platform information
meters long. Vandalism is also a major problem, particularly for (timestamp, latitude, longitude, battery voltage, internal pressure,
moored buoys that are deployed in equatorial regions near areas temperature, and humidity) at start of data collection, computed
of intense fishing activity. This can include moored buoys being wave parameters (Hmo , Tp , Ta , and Dp ), and, optionally, “First-5”
dragged off station, mooring lines being cut by fishing vessels so coefficients in the 0.031–0.496 Hz frequency range with 1/256-
that the buoy goes adrift and has to be recovered, sensors and Hz bandwidth are transmitted to shore in real time through
satellite transmitters being removed and stolen, and deliberate the Iridium satellite system. The interval between measurements
or accidental (e.g., collision with a ship) damage. The DBCP is is programmable over the air, and spectral wave data can be
trying to mitigate the problem of vandalism through an outreach retrieved as often as every 30 min. At the time of writing, a
strategy that aims to inform the fishing communities that the GTS format for the DWS drifter has been approved by WMO,
buoys are operated to provide data that are to their benefit (i.e., with the objective to facilitate the distribution of these data on
improved weather and wave predictions, and tsunami warnings). the GTS and the use of in situ spectral wave data with wave
forecasting models and to assist operational forecasting centers.
Gaps Across Programs and Platforms The DWS drifter technology has a technology readiness level
Users exploiting past observational data always wish to know (TRL) of 9, which has been demonstrated through the operational
the actual sensing equipment used and the direct sensing deployment from ships of 62 units in the Global Ocean and
environment (e.g., platform type, sensor placement on the with the air deployment of 7 units in the Bay of Bengal and
platform). Accurate and exhaustive metadata are the basis for the Atlantic Ocean.
the correct utilization of the data and to maximize their impact.
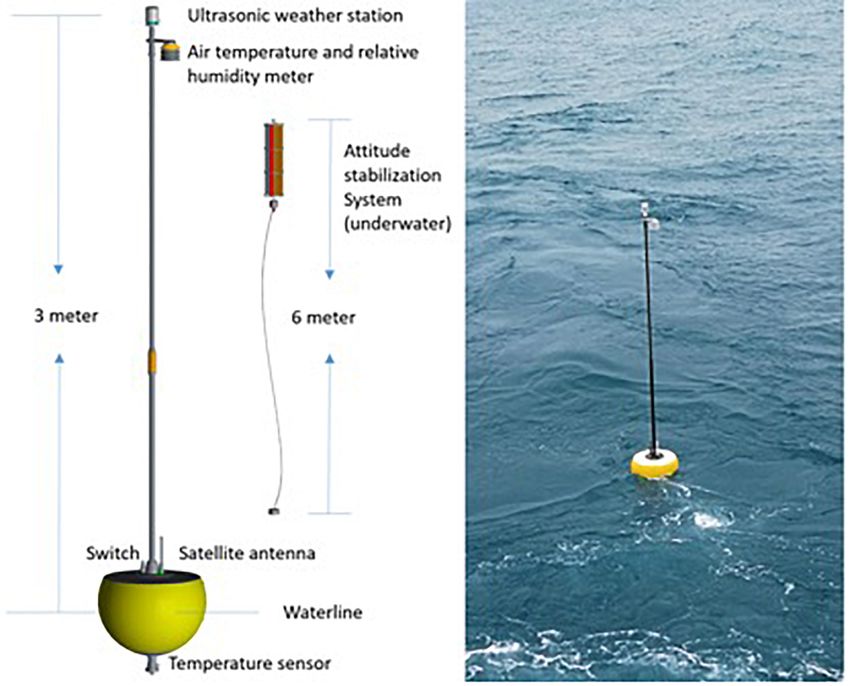
While this information is always recorded locally, there is Drifting Air–Sea Interface Buoy (DrIB)
very little coordination among individual projects regarding the A newly designed non-Lagrangian drifter, called the drifting
content and format of the metadata. This lack of coordination air–sea interface buoy (DrIB), was recently tested in the western
constitutes a potential limitation to the full exploitation of the Pacific. The DrIB is intended for atmospheric observations of
observations. Under WMO guidance, metadata are only recently surface wind, air temperature, air pressure, and relative humidity
started being collected internationally. We also identify this effort at a height of 3 m as well as for measuring SST (Figure 8). The
as a way forward to improve the current situation, and we data are transmitted by the Iridium or Beidou satellite systems.
refer the reader to the guide on WIGOS (https://library.wmo. The total weight of the DrIB is about 50 kg, and the maximum
int/doc_num.php?explnum_id=6010) which explains how the diameter is 0.54 m. An Airmar ultrasonic weather station is
international community has now arranged for a comprehensive located at the top of the 3-m mast to measure wind velocity
collection of metadata, and for a process to consolidate real- and atmospheric pressure. The NOTC SHT16-1 sensor is used
time and delayed-mode data repositories in the Marine Climate to measure air temperature and relative humidity, and the NOTC
Data System (MCDS; Pinardi et al., 2019). Here, we just wish MT15 is used to measure SST. Both sensors are manufactured
to point out the importance that individual programs invest by the National Ocean Technology Center of China and tested
adequate resources to endorse and facilitate the harmonization and calibrated by the National Center of Ocean Standard and
of their metadata. Metrology of China.
Frontiers in Marine Science | www.frontiersin.org 13 August 2019 | Volume 6 | Article 419You can also read