A standardized database of Marine Isotopic Stage 5e sea-level proxies on tropical Pacific islands
←
→
Page content transcription
If your browser does not render page correctly, please read the page content below
Earth Syst. Sci. Data, 13, 2651–2699, 2021
https://doi.org/10.5194/essd-13-2651-2021
© Author(s) 2021. This work is distributed under
the Creative Commons Attribution 4.0 License.

           A standardized database of Marine Isotopic Stage 5e
                sea-level proxies on tropical Pacific islands
                      Nadine Hallmann1 , Gilbert Camoin1 , Jody M. Webster2 , and Marc Humblet3
       1 Aix-Marseille   Université, CNRS, IRD, INRAE, Coll France, CEREGE, Europôle Méditerranéen de l’Arbois,
                                       BP80, 13545 Aix-en-Provence CEDEX 4, France
                        2 Geocoastal Research Group, School of Geosciences, The University of Sydney,

                                          New South Wales 2006, Sydney, Australia
                   3 Department of Earth and Planetary Sciences, Graduate School of Environmental Studies,

                                         Nagoya University, Nagoya 464-8601, Japan
                                Correspondence: Nadine Hallmann (hallmann@cerege.fr)

                              Received: 1 September 2020 – Discussion started: 24 November 2020
                             Revised: 1 May 2021 – Accepted: 6 May 2021 – Published: 14 June 2021

      Abstract. Marine Isotope Stage 5 deposits have been reported on many tropical Pacific islands. This paper
      presents a database compiled through the review of MIS 5e (last interglacial – LIG) coral reef records from
      islands belonging to French Polynesia (Anaa, Niau, Makatea, Moruroa, Takapoto, Bora Bora), the Hawaiian
      Islands (Oahu, Lanai, Midway Atoll), Tuvalu, Kiribati (Christmas Island, Tarawa), the Cook Islands (Mangaia,
      Atiu, Mitiaro, Mauke, Pukapuka, Rakahanga, Rarotonga), Tonga, Samoa, the Federal States of Micronesia, the
      Mariana Islands, the Marshall Islands (Enewetak, Bikini), New Caledonia, Papua New Guinea, the Solomon Is-
      lands, Vanuatu, Fiji and Niue. Studies reporting other sea-level indicators dated to other Pleistocene interglacials
      and Holocene sea-level indicators were not inserted in the database but are included in this data description pa-
      per for completeness. Overall, about 300 studies concerning Pleistocene and Holocene sea-level indicators have
      been reviewed, and finally 163 age data points and 94 relative sea-level (RSL) data points from 38 studies on
      the MIS 5e have been inserted in the database. An additional 155 age data points have been reviewed; i.e. the
      tropical Pacific islands database contains 318 age data points. The main sea-level indicators include emerged
      coral reef terraces, but also reef units recovered in drill cores from a few islands, thus reflecting the diversity of
      tectonic settings and sampling approaches. Future research should be directed towards better constrained RSL
      reconstructions, including more precise chronological data, more accurate elevation measurements and a bet-
      ter refinement of the palaeo-water-depth significance of coralgal assemblages. The database for tropical Pacific
      islands is available open access at this link: https://doi.org/10.5281/zenodo.3991672 (Hallmann and Camoin,
      2020).

1   Introduction                                                   lows the standardized insertion into a mySQL database
                                                                   on relative sea-level indicators and associated ages. The
In this paper, we describe in detail the background in-            database presented in this study has been downloaded
formation used to build the standardized database of               from the interface as an .xls file. The database presented
tropical Pacific islands. This database was compiled as            here is open access and is available under this link:
a contribution to the World Atlas of Last Interglacial             https://doi.org/10.5281/zenodo.3991672 (Hallmann and
Shorelines (WALIS) ESSD special issue. The database                Camoin, 2020). Each field in our database is described at
was created using the WALIS interface, which is avail-             the following link: https://doi.org/10.5281/zenodo.3961543
able at this link: https://warmcoasts.eu/world-atlas.html          (Rovere et al., 2020). The open access will enable the rapid
(last access: 22 April 2021). The WALIS interface al-

Published by Copernicus Publications.
2652                                                                     N. Hallmann et al.: MIS 5e in tropical Pacific islands

                                                                   method used to reconstruct MIS 5e palaeo-RSL. We then
                                                                   report a detailed description of the data points located in
                                                                   each administrative province/region within the area of inter-
                                                                   est, where sea-level data were reviewed (Sect. 5). Section 6.1
                                                                   contains the description of a number of studies where the
                                                                   presence of different peaks in the LIG sea-level record was
                                                                   discussed in literature. While in our database we only re-
                                                                   viewed specifically MIS 5e data, we encountered a number
                                                                   of studies where other Pleistocene shorelines were dated or
                                                                   described (Sect. 6.2 and 6.3), as well as Holocene sea-level
                                                                   data (Sect. 6.4). Major controversies regarding MIS 5e are
                                                                   highlighted in Sect. 6.5, while uncertainties associated with
                                                                   estimating palaeo-RSL from the data in the database are de-
                                                                   tailed in Sect. 6.6. Large RSL uncertainties and limitations
                                                                   in the accuracy of RSL reconstructions can be considered for
                                                                   studies concerning MIS 5e coral reef records from the trop-
                                                                   ical Pacific islands. The data quality is mostly affected by
Figure 1. Map showing the tropical Pacific islands considered in
                                                                   the quality of RSL data and, to a lesser extent, by the qual-
this article (blue dots).
                                                                   ity of age information (see Sect. 6.6). We further present fu-
                                                                   ture research directions (Sect. 7) that may stem from our data
                                                                   compilation. Future work using more accurate dating meth-
and wide dissemination of the data that form the basement          ods and elevation measurements as well as a more detailed
of this work and which in turn may trigger new studies in          identification of the collected coral samples are essential to
this field. The database presented here will be useful for         better constrain the MIS 5e RSL dataset concerning the trop-
scientists studying relative sea-level changes, reef geology,      ical Pacific islands.
tectonics and geodynamics of the Pacific region, as well as
palaeoceanographers.                                               2   Literature overview
   More than 200 studies on Marine Isotopic Stage (MIS) 5
coral reef records in the tropical Pacific have been reviewed.     The sea-level database described by this article focuses on
Of those, data from 38 studies have been included in the           tropical Pacific islands, which cover most of the intertropical
database. The geographical distribution of the studied islands     realm of the Pacific Ocean from the Hawaiian archipelago to
from 14 nations is shown in Fig. 1. Overall, the database con-     the north to New Caledonia to the south and from Mariana Is-
tains 315 U-series data points and three electron spin res-        lands and Papua New Guinea to the west to French Polynesia
onance data points. Evaluation of the quality of radiomet-         to the east.
ric ages includes the mineralogical assessment, but also the          Last interglacial (LIG) coral reef records of relative sea-
closed- versus open-system behaviour of radioisotopes. Data        level (RSL) change on tropical Pacific islands were mostly
points obtained outside closed-system conditions are high-         investigated on subaerially exposed reef terraces. Since the
lighted in the database. The information on the acceptance         pioneer work of Veeh (1966), which focused on the dating of
of radiometric ages has often been directly taken from the         corals from different islands (Hawaiian Islands, French Poly-
original publication. In addition, the quality of the ages that    nesia, Cook Islands), extensive studies have been conducted
are reported in the WALIS database has been reviewed by            in many islands across this vast region. Some of these studies
Chutcharavan and Dutton (2020), who compiled a U-series            have used the LIG shorelines to reconstruct tectonic uplift,
database for MIS 5e corals (see this special issue). We in-        especially in Papua New Guinea and Vanuatu. Submerged
serted in the database 163 age data points and 94 relative         coral reef deposits related to the LIG, forming locally well-
sea-level (RSL) data points from 38 studies on the MIS 5e.         identified terraces, have been investigated since the begin-
An additional 155 age data points inserted by Chutcharavan         ning of the 20th century and the first drilling in Funafuti (Tu-
and Dutton (2020) have been reviewed; i.e. the tropical Pa-        valu). Drill cores including reef units related to the LIG have
cific islands database contains 318 age data points.               been collected between the 1950s and the 1980s on Enewetak
   In the following, we first give an overview of the pub-         (Marshall Islands), Midway Atoll, Moruroa (French Polyne-
lished literature related to last interglacial (LIG) sea-level     sia) and Tarawa (Kiribati) and more recently in New Caledo-
indicators in the tropical Pacific islands, in order to give       nia and Bora Bora (French Polynesia).
the reader a sense of the historical background upon which            All reviewed studies concerning LIG reef records from
our review was done. Then, we describe the types of sea-           tropical Pacific islands (Fig. 1) are summarized hereafter.
level indicators as well as the elevation measurement tech-
niques and sea-level datums reported in the literature and the

Earth Syst. Sci. Data, 13, 2651–2699, 2021                                         https://doi.org/10.5194/essd-13-2651-2021
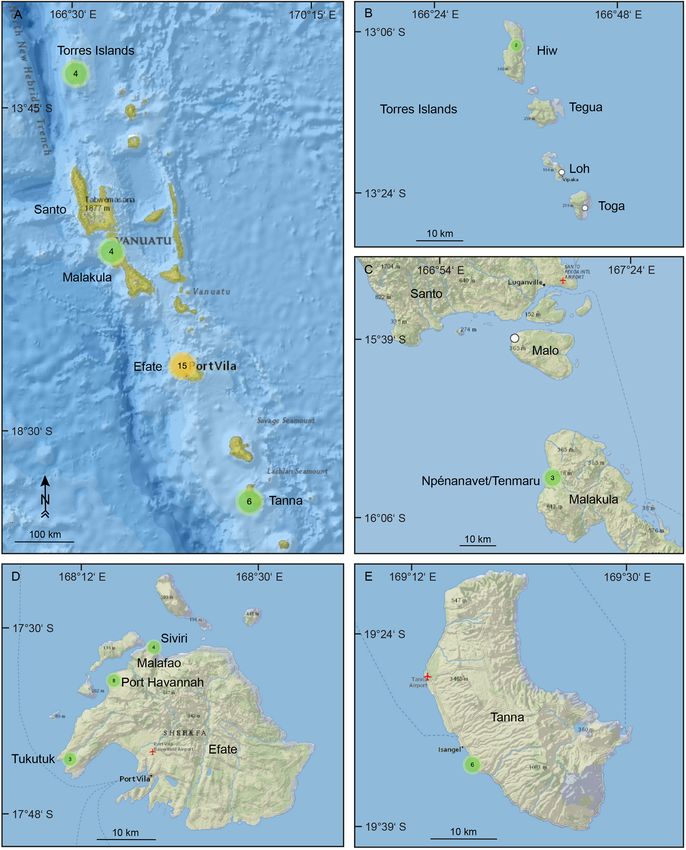
N. Hallmann et al.: MIS 5e in tropical Pacific islands                                                                      2653

   French Polynesia (Fig. 2). Since the early 1960s, the geol-     Fiji were reported for the first time in the late 1970s by Tay-
ogy of Moruroa has been investigated through the drilling          lor (1978), who dated reefs on Yasawa Island. In the late
of a number of deep vertical and inclined boreholes car-           1990s, Nunn and Omura (1999) studied exposed reef terraces
ried out in the modern lagoon and on the reef rim. Lalou et        around Kadavu Island. The most recent studies by Nunn et
al. (1966) and Labeyrie et al. (1969) studied reef units from      al. (2002) and Nunn and Omura (2003) summarized the lev-
the last 300 000 years. Trichet et al. (1984) described the gen-   els of emerged LIG shorelines on the northeastern Fiji Is-
eral stratigraphy of Moruroa based on three cores. Camoin et       lands and compared them to those from the western Fiji Is-
al. (2001) dated four 300 m long drill cores from the reef rim     lands.
and reconstructed RSL changes over the past 300 000 years,            Tuvalu. Data regarding LIG deposits from Tuvalu are re-
including the identification of MIS 5e. The most recent study      stricted to the 340 m long drill core that was carried out by
on a Moruroa drill core by Braithwaite and Camoin (2011)           the Coral Reef Expedition of The Royal Society in 1896–
focused on the study of carbonate sedimentology and diage-         1898 on Funafuti Atoll. This drill core was used to interpret
netic features of these cores.                                     the origin and history of atoll formation (Bonney, 1904) and
   The earliest study on emerged Pleistocene coral reef ter-       test Darwin’s subsidence theory (Darwin, 1842). Despite a
races was performed by Veeh (1966), who dated in situ fos-         detailed study of these reef cores (Bonney, 1904), the core
sil corals on Anaa, Niau and Makatea, followed by Piraz-           was originally interpreted as a modern reef deposit overlying
zoli et al. (1988a), who dated LIG reefs on Anaa. Montag-          Pleistocene limestone (Hinde, 1904), and no chronological
gioni (1985), Montaggioni et al. (1985), and Montaggioni           frame was established before Ohde et al. (2002), who con-
and Camoin (1997) studied LIG reef terraces on Makatea.            sidered that LIG reef deposits must be deeper than 24.2 m
More recent studies by Montaggioni et al. (2018, 2019a, b)         below the modern surface. Since then, the Funafuti cores
considered that some reef units have formed during Pleis-          have been mentioned in general reviews regarding the devel-
tocene high RSL, including MIS 5e, on Takapoto but did             opment of coral reef islands (e.g. McLean and Woodroffe,
not provide dating results. In addition, Gischler et al. (2016,    1994; Spencer et al., 2008).
2019) reported the occurrence of a Pleistocene reef unit at-          Kiribati (Fig. 8). In 1981, 30 m long drill cores reaching
tributed to MIS 5e in Bora Bora drill cores.                       Pleistocene limestone have been collected on Tarawa during
   Cook Islands (Figs. 3 and 4). Schofield (1910) reported on      a hydrogeological investigation by an Australian government
late Quaternary RSL changes on Rarotonga in the southern           team. These cores have been dated later by Marshall and Ja-
Cook Islands. The earliest study providing datings on LIG          cobson (1985). Woodroffe and McLean (1998) reported U-
reef limestones in the southern Cook Islands (Mangaia) was         series ages from an outcrop of LIG limestone on Christmas
performed by Veeh (1966). Subsequent studies have been             Island.
conducted by Stoddart et al. (1985), Spencer et al. (1987,            Solomon Islands. Stearns (1945) studied elevated benches
1988) and Stoddart et al. (1990). Woodroffe et al. (1991)          in the southwest Pacific and correlated the different lev-
worked on the stratigraphy and chronology of the southern          els between the Solomon Islands, Vanuatu, the Mariana and
Cook Islands and presented new U-series ages for Atiu, Mi-         Hawaiian Islands. The geology of the Solomon Islands was
tiaro and Mauke. Gray et al. (1992) studied the geochronol-        then studied in the 1950s by Grover (1958), while their geo-
ogy and subsurface stratigraphy of Pukapuka and Rakahanga          morphology was investigated later by Stoddart (1969), who
in the northern Cook Islands based on drill cores from the         reported on elevated shorelines, terraces and tidal notches on
lagoon.                                                            different island groups.
   Samoa. The early study by Kear and Wood (1959) de-                 Vanuatu (Fig. 9). Uplifted Quaternary reef terraces on Van-
scribed LIG reefs in Samoa. Stice and McCoy (1986) studied         uatu islands, specifically Santo, Malakula and Efate, have
the geology of the Manu’a Islands and reported on the occur-       been identified and partially described since the late 1960s
rence of carbonate deposits.                                       and the 1970s (Mitchell, 1966, 1969, 1971; Robinson, 1969;
   Niue (Fig. 5). Different terraces on Niue were explored         Mallick and Greenbaum, 1977; Ash et al., 1978). After these
at the beginning of the 20th century (Agassiz, 1903; David,        first descriptions, a reconnaissance study was carried out
1904). Schofield (1959) identified seven terraces. A LIG reef      by Neef and Veeh (1977), who published the first U-series
sequence has been reported by Paulay (1988), Paulay and            ages on Malo and Efate, immediately followed by Bloom
Spencer (1992), Spencer and Paulay (1994) and Wheeler              et al. (1978), who focused on the dating of LIG reefs from
(2000). More recent studies further described the different        Efate. In the 1980s, the vertical movements in the New He-
terraces on Niue (Terry and Nunn, 2003; Nunn and Britton,          brides (Vanuatu) Island arc were reconstructed based on the
2004; Kennedy et al., 2012).                                       dating of the uplifted coral reef terraces, and several in-
   Tonga (Fig. 6). Taylor (1978) and Yonekura (1983) have          vestigations provided additional dating results on terraces
attributed reef deposits from the Tongatapu block to the LIG.      from Santo, Malakula, Efate and Torres Islands (Jouannic
   Fiji (Fig. 7). Despite pioneer geomorphological works by        et al., 1980, 1982; Lecolle and Bernat, 1985; Taylor et al.,
Dana (1872) and Moore (1889), and reports on late Quater-          1980, 1985). Taylor et al. (1987) compared contemporary co-
nary RSL changes by Schofield (1910), LIG deposits from            seismic and nonseismic with quaternary vertical movements

https://doi.org/10.5194/essd-13-2651-2021                                         Earth Syst. Sci. Data, 13, 2651–2699, 2021
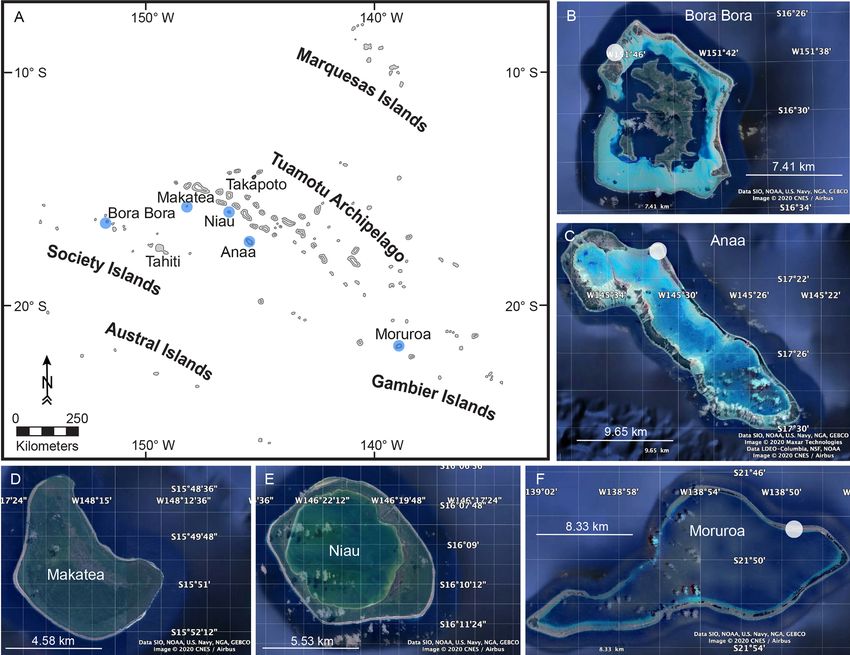
2654                                                                            N. Hallmann et al.: MIS 5e in tropical Pacific islands

Figure 2. Map showing islands in French Polynesia considered in this article (blue dots). Study sites are indicated by white circles. © Google
Earth 2020 (b–f).

based on the analysis of partially emerged corals and reef               their geological map of Maré Island. The drilling of modern
terraces in the central Vanuatu Arc. Edwards et al. (1987a,              reefs from the western coast of New Caledonia in the 1970s
b) have provided precise chronological data on exposed reef              (Coudray, 1971), late 1990s (Cabioch et al., 1996, 1999) and
terraces from Efate. Chronological data obtained on uplifted             after 2000 (Frank et al., 2006; Cabioch et al., 2008; Mon-
coral reef terraces were used by Taylor et al. (2005) to recon-          taggioni et al., 2011; Hongo and Wirrmann, 2015) aimed at
struct rapid vertical movements in the New Hebrides forearc.             reconstructing the development pattern of fringing and bar-
Since the beginning of the current century, additional stud-             rier reefs. Drill cores from the Chesterfield Islands that are
ies have been carried out on Malakula (Cabioch and Ayliffe,              located about 500 km to the WNW of New Caledonia have
2001) and Tanna (Neef et al., 2003) and significantly ad-                been studied with the same objective by Degaugue-Michalski
vanced the chronological frame of Pleistocene raised reefs.              (1993).
On Tanna, the studied reefs and raised lagoonal deposits                    Papua New Guinea (Fig. 11). Uplifted Quaternary reef ter-
range in age from the Holocene to MIS 7 (Neef et al., 2003).             races from Huon Peninsula (Papua New Guinea) represent a
   New Caledonia (Fig. 10). Early studies on Pleistocene reef            classical site of RSL change studies in support of the astro-
terraces, including the LIG, were carried out in the 1970s and           nomical theory of climate change. Early studies and first at-
early 1980s by Launay and Récy (1972), Coudray (1976),                   tempts to establish an accurate chronological frame for these
Bernat et al. (1976), Marshall and Launay (1978), and Gaven              coral reef terraces were carried out in the 1970s by Veeh and
and Bourrouilh-Le Jan (1981) and were focused on their dat-              Chappell (1970), Chappell (1974), and Bloom et al. (1974).
ing and use for the reconstruction of neotectonic movements              Since then, the uplifted terraces from Huon Peninsula have
in the Loyalty Islands (Maré, Lifou and Ouvéa). These re-                been regularly investigated with the same general objective
sults have been summarized by Maurizot and Lafoy (2003) in               in the 1980s by Aharon (1983), Chappell (1983), and Aharon

Earth Syst. Sci. Data, 13, 2651–2699, 2021                                                 https://doi.org/10.5194/essd-13-2651-2021
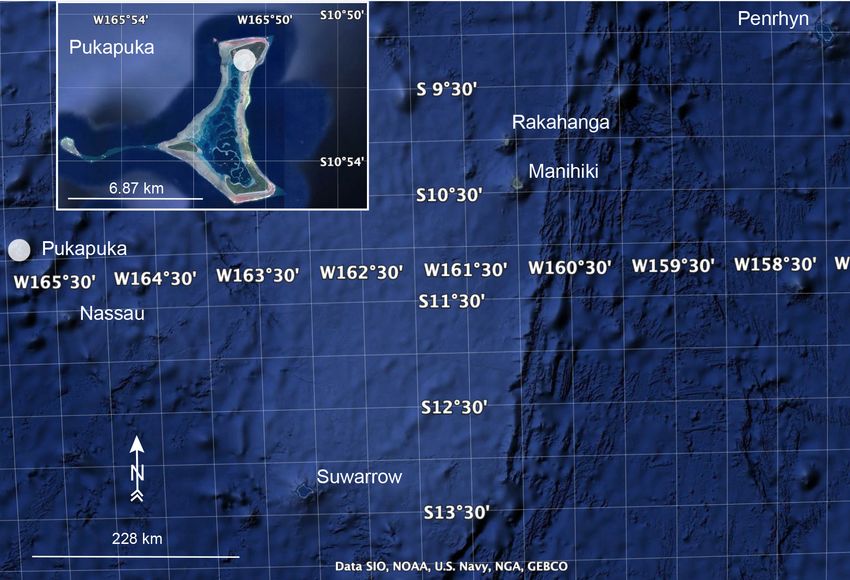
N. Hallmann et al.: MIS 5e in tropical Pacific islands                                                                         2655

Figure 3. Map showing the northern Cook Islands. Study site on Pukapuka is indicated by a white circle. © Google Earth 2020.

and Chappell (1986); in the 1990s by Stein et al. (1993)              The latest study by Muhs et al. (2020) provided U-series ages
and Esat et al. (1999); and, in the early 2000s, by Cutler et         for the emergent reef of the Tanapag Limestone in Saipan,
al. (2003).                                                           which formed during the LIG period.
   Federated States of Micronesia. Ayers and Vacher (1986),              Marshall Islands. Five drill cores extracted from Bikini
Anthony (1996a, b, c) and Fletcher and Richmond (2010)                atoll in 1947 were first studied by Ladd et al. (1948), who de-
mentioned Pleistocene limestones, including the LIG period,           scribed subaerial horizons in those cores. Emery et al. (1954)
in this region.                                                       further described cores from Bikini. Drillings on Enewe-
   Mariana Islands (Fig. 12). The geologic history of Guam            tak were performed in the early 1950s, and drill cores have
was first studied by Stearns (1940), who reported on the              been studied by Ladd et al. (1953), Potratz et al. (1955),
deposition of Pleistocene limestone on volcanic substrate.            Ladd and Schlanger (1960), Schlanger (1963), and Thurber
Stearns (1945), Tayama (1952) and Emery (1962) described              et al. (1965). Schlanger (1963) has shown similarities be-
“shore benches” related to sea level. Cloud (1954) correlated         tween cores from Enewetak and Bikini. Two shallow drilling
stratigraphic sections throughout the West Pacific, including         programmes were initiated in the early 1970s: PACE (1971–
Guam. In the early 1950s, a programme by the Corps of En-             1972; Henry et al., 1974) and EXPOE with 46 holes down to
gineers, U.S. Army and U.S. Geological Survey focused on              90 m on Enewetak (1973–1974; Couch et al., 1975). Couch
geology, soils and water of Guam (Tracey et al., 1959, 1964),         et al. (1975) confirmed the occurrence of subaerial unconfor-
including a detailed description of submarine and emerged             mities in many drill cores. Tracey and Ladd (1974) described
coral reef terraces. Lower terraces on Guam, less than 15 m           unconformities in the Bikini drill core, which could also be
above modern sea level, are comparable to limestones that             partly recognized in Enewetak drill cores. Szabo et al. (1985)
were described at the same elevation on Saipan, Northern              presented dating results from two drill cores extracted from
Mariana Islands (Tracey et al., 1964) and assigned to the late        the Enewetak reef flat during the PACE programme. Dur-
Pleistocene (Cloud et al., 1956). Further studies on Guam             ing the Pacific Enewetak Atoll Crater Exploration (PEACE)
reef terraces included their lithological description (Emery,         programme (1984–1985), the U.S. Geological Survey inves-
1963), the provision of U-series ages obtained on MIS 5e              tigated two craters formed by nuclear detonations in 1958
limestone and estimated tectonic movements (Randall and               (Henry et al., 1986; Henry and Wardlaw, 1990). Ludwig et
Siegrist, 1996) and the reconstruction of RSL changes since           al. (1988) studied a 350 m long drill core of Neogene la-
MIS 5e (Miklavič et al., 2012). Following up the work by             goonal, shallow-water carbonates from Enewetak. Quinn and
Cloud et al. (1956) on the geology of Saipan, Weary and               Matthews (1990), Wardlaw and Quinn (1991), and Quinn
Burton (2011) mapped the island and stated that the Tanapag           (1991) studied the post-Miocene sea-level history of Enewe-
Limestone is usually found at elevations of less than 30 m.           tak.

https://doi.org/10.5194/essd-13-2651-2021                                             Earth Syst. Sci. Data, 13, 2651–2699, 2021
2656                                                                          N. Hallmann et al.: MIS 5e in tropical Pacific islands

Figure 4. Map showing islands in the southern Cook Islands considered in this article (white circles). Study sites are indicated by white
circles. © Google Earth 2020.

   Hawaii (Fig. 13). Stearns (1935a, b, c) and Wentworth and           of reef deposits from Oahu have been reported by Hearty et
Hoffmeister (1939) first studied Pleistocene shorelines on the         al. (2007) and McMurtry et al. (2010). Rubin et al. (1995,
islands of Oahu and Maui. In 1960, drill cores were collected          2000) provided U-series data for the Hulopoe gravel on Lanai
on Midway Atoll and studied in the following decades (e.g.             containing corals corresponding to MIS 5e and MIS 7.
Ladd et al., 1967, 1970; Wells, 1982). Stearns and Cham-
berlain (1967) described deep cores extracted from Oahu
                                                                       3   Sea-level indicators
to better understand the geologic history. Several studies
provided ages and demonstrated that the Waimanalo lime-
                                                                       The main features associated with last interglacial (LIG) rel-
stone on Oahu corresponds to the LIG. Veeh (1966) and
                                                                       ative sea levels (RSLs) on tropical Pacific islands are exposed
Ku et al. (1974) provided the first dating results of those
                                                                       coral reef terraces. In addition, submerged coral reef deposits
emerged terraces. Further chronological studies concerning
                                                                       related to the LIG, forming locally well-identified terraces,
the Waimanalo deposits included those from Sherman et
                                                                       have been drilled on land on several islands, such as Funa-
al. (1993), Muhs and Szabo (1994), and Szabo et al. (1994).
                                                                       futi (Tuvalu), Enewetak (Marshall Islands), Midway Atoll,
Muhs et al. (2002) performed additional datings with a higher
                                                                       Moruroa and Bora Bora (French Polynesia), Tarawa (Kiri-
precision at the Szabo et al. (1994) study sites. The latest ages
                                                                       bati), and New Caledonia.

Earth Syst. Sci. Data, 13, 2651–2699, 2021                                              https://doi.org/10.5194/essd-13-2651-2021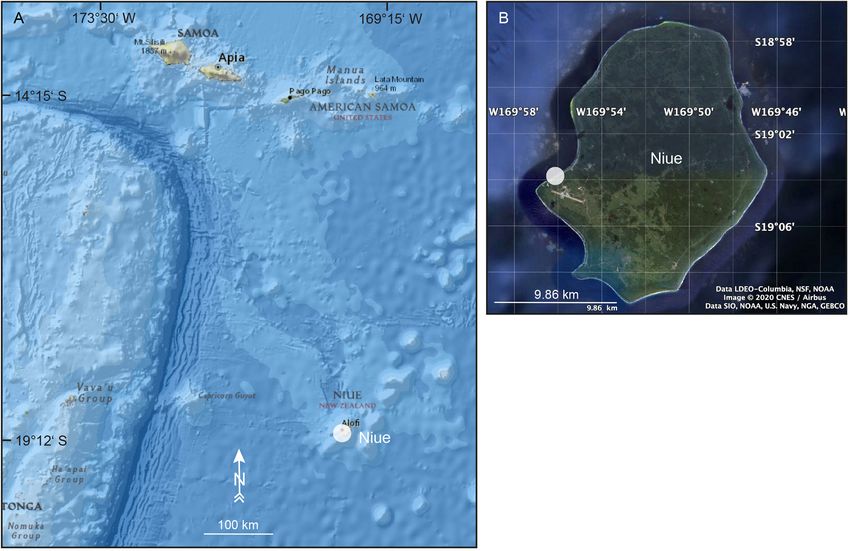
N. Hallmann et al.: MIS 5e in tropical Pacific islands                                                                              2657

Figure 5. Map showing the island of Niue. Study site on Niue is indicated by a white circle. Basemap: “National Geographic Map”, with data
from National Geographic, Esri, Garmin, HERE, UNEP-WCMC, USGS, NASA, ESA, METI, NRCAN, GEBCO, NOAA and INCREMENT
P Corp (a). © Google Earth 2020 (b).

   In general, palaeo-RSL is determined from the average el-           (1) time range: 1990–2020 and (2) depth range: 0–150 (to
evation of the terrace or, if present, from the elevation of the       eliminate potential aberrant depths). Records which had the
highest in situ corals which are usually found on the palaeo           following characteristics were excluded from the analysis:
reef crest (Rovere et al., 2016). However, the identification          (1) those for which the difference between max depth and
of coral assemblages that characterize coral reef terraces and         min depth were > 0.2 m and (2) those for which the “basis of
the definition of the relevant water depth range estimates             record” was not “human observation” or “machine observa-
may provide a more accurate indication of the palaeo-RSL.              tion” (i.e. collection specimens were excluded).
Single corals and coral assemblages have been described in                All available data were used to define palaeo-water-depth
some studies related to LIG reefs on tropical Pacific islands.         intervals for each species (Table 2). However, the data that
Since their palaeo-water-depth significance has been barely            have been compiled from OBIS and other databases cover
reported in the relevant studies, we have compiled data pub-           the whole Indo-Pacific region. The value that has been cal-
lished in two databases: OBIS (Ocean Biodiversity Infor-               culated for average and median depths can therefore differ
mation System; https://obis.org, last access: 22 April 2021)           when considering specific islands or areas of the studied area.
and IUCN (International Union for Conservation of Nature;              In most cases, it has been difficult to assign a palaeo-water-
https://www.iucnredlist.org, last access: 22 April 2021), thus         depth based on a single species, as most corals have a wide
following a similar approach to the one used by Hibbert et             depth range. Accurate palaeo-water-depth intervals can usu-
al. (2016, 2018). The datasets used are listed on the OBIS and         ally be defined based on coral assemblages. We have primar-
IUCN websites and summarized in Table 2, which presents                ily selected data for which a precise depth, not a range, was
the best estimates of palaeo-water-depth intervals for corals          available in the OBIS database.
that were quoted in the literature.                                       For some species, which were not identified with certainty,
   OBIS is a more detailed database, which allows the defini-          we used close species to define a depth interval (e.g. for Acro-
tion of distribution curves and prediction of the depth ranges         pora cf. aspera, we have compiled data concerning close
at which the relevant species can be found with the high-              species that belong to the “aspera group” of Wallace, 1999:
est probability. Data were extracted from the OBIS database            A. aspera, A. pulchra and A. millepora).
using the Mapper tool. Two filters were used on Mapper:

https://doi.org/10.5194/essd-13-2651-2021                                              Earth Syst. Sci. Data, 13, 2651–2699, 2021
2658 N. Hallmann et al.: MIS 5e in tropical Pacific islands
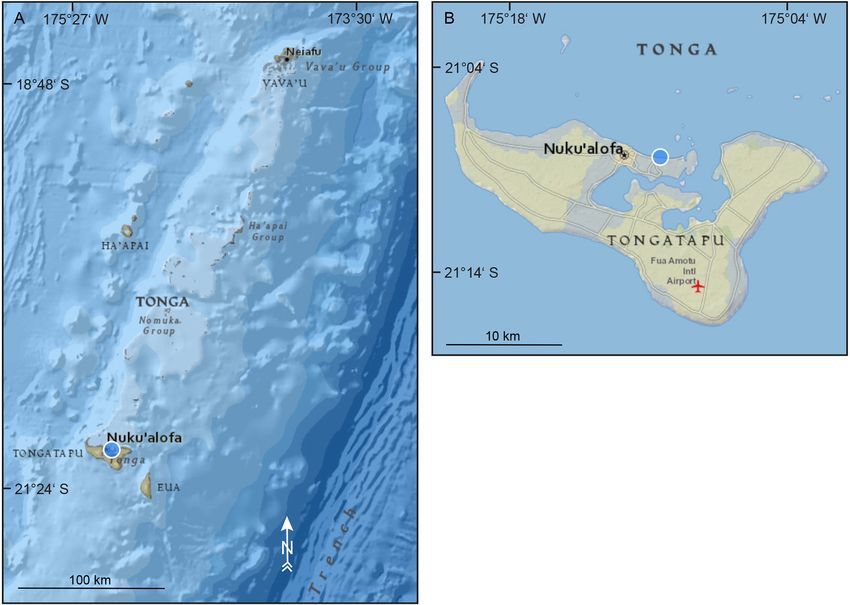
Figure 6. Map showing Tonga. Study site on Tongatapu is indicated by a blue circle. Basemap: “National Geographic Map”, with data from
National Geographic, Esri, Garmin, HERE, UNEP-WCMC, USGS, NASA, ESA, METI, NRCAN, GEBCO, NOAA and INCREMENT P
Corp.
Table 1. Different types of RSL indicators reviewed in this study.
Name of RSL Description of RSL indicator Description of ref- Description of Indicator reference(s)
indicator erence water level indicative range
Coral reef terrace Coral-built flat surface, corresponding (mean lower low Mean lower low Rovere et al. (2016)
(general to shallow-water reef terrace to reef water + breaking water − breaking
description) crest. The definition of indicative mean- depth)/2 depth
ing is derived from Rovere et al. (2016),
and it represents the broadest possible
indicative range, which can be refined
with information on living coral ranges.
Porites is the most frequent coral reported in LIG reefs 4 Elevation measurements
from tropical Pacific islands. However, it cannot be gen-
erally used to constrain the palaeo-water-depth interval as
it displays a wide depth range when it is not identified at Almost all studies used auto/hand level to measure elevations
the species level. The morphology of Porites colonies may of relative sea-level (RSL) indicators (Table 3); fewer studies
nevertheless give some indications on a gross palaeo-water- used theodolite and rod or metre tape and rod. The elevation
depth distribution. measurement technique has not been reported in many of the
reviewed studies but was most probably hand level or me-
tered tape (Table 3). The sea-level datums reviewed in this
study include mean sea level (MSL), mean high tide (MHT),
mean low tide (MLT), mean low water springs (MLWS) and
Earth Syst. Sci. Data, 13, 2651–2699, 2021 https://doi.org/10.5194/essd-13-2651-2021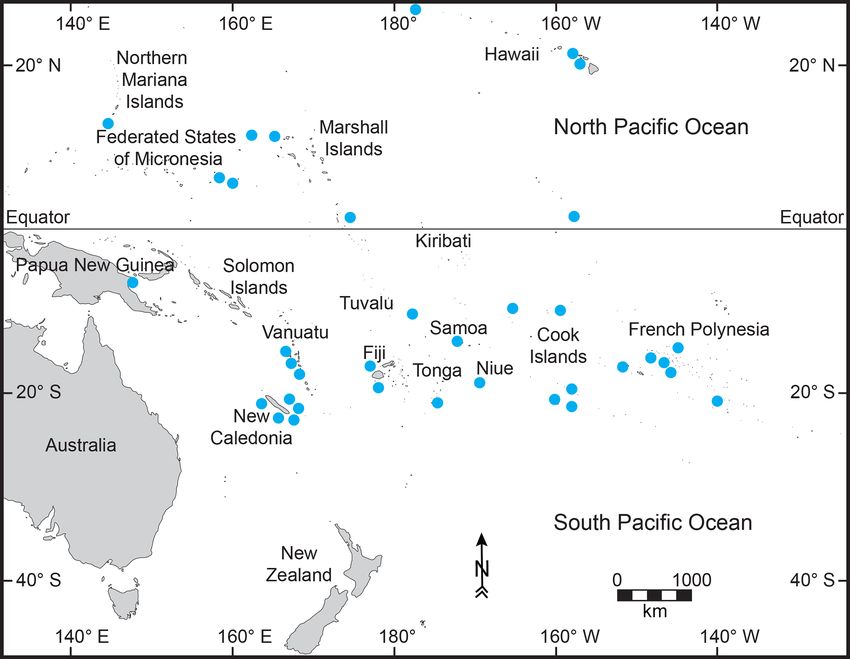
N. Hallmann et al.: MIS 5e in tropical Pacific islands                                                                                 2659

Figure 7. Map showing islands in Fiji considered in this article (white circles). Study sites on Kaibu Island are indicated by white circles.
Basemap: “National Geographic Map”, with data from National Geographic, Esri, Garmin, HERE, UNEP-WCMC, USGS, NASA, ESA,
METI, NRCAN, GEBCO, NOAA and INCREMENT P Corp (a). © Google Earth 2020 (b–c).

modern reef (Table 4). In several studies the sea-level datum            and Daly (1920) on Samoa and other Pacific islands (Camoin
has not been reported and has been assumed to be MSL (Ta-                and Webster, 2015).
ble 4).                                                                     Most of the tropical Pacific islands are underlain by the
                                                                         large northwestward-moving Pacific plate that is generated
                                                                         at the East Pacific Rise and the Pacific–Antarctic Ridge (see
5   Relative sea-level indicators                                        Fig. 1 in Neall and Trewick, 2008). The archipelagos and
                                                                         islands from the western part of the studied area developed
Because they correspond to easily accessible coral reef
                                                                         in a complex geodynamic setting resulting from the relative
archives of sea-level change on many tropical and subtrop-
                                                                         motions of the Pacific and the Australian and Eurasian plates.
ical coasts, the last interglacial (LIG) terraces have received
much attention since the seminal works from Mayer (1917)

https://doi.org/10.5194/essd-13-2651-2021                                                Earth Syst. Sci. Data, 13, 2651–2699, 2021
2660 N. Hallmann et al.: MIS 5e in tropical Pacific islands
Figure 8. Map showing islands in Kiribati considered in this article (white circles). Study sites on Tarawa and Christmas Island are indicated
by white circles. Basemap: “National Geographic Map”, with data from National Geographic, Esri, Garmin, HERE, UNEP-WCMC, USGS,
NASA, ESA, METI, NRCAN, GEBCO, NOAA and INCREMENT P Corp (a–b). © Google Earth 2020 (c–d).
The 16 archipelagos and islands reported in the database movements and estimated palaeo-water-depth intervals of
illustrate the exceptional diversity of tropical Pacific islands, their modern counterparts, as shown in Fig. 14.
which is mainly related to their dynamic and complex ge-
ological history. They have originated as linear chains of
volcanic islands on the above plates, atolls, uplifted coral 5.1 French Polynesia
reef islands, fragments of continental crust and obducted por-
tions of adjoining lithospheric plates and have also resulted LIG reef deposits have been reported from outcrops on sev-
from subduction along convergent plate margins (Neall and eral Polynesian islands and from drill cores collected on
Trewick, 2008). This complex history has generated a great Moruroa and Bora Bora.
diversity of tectonic movements (uplift vs. subsidence), The first dates on LIG reef terraces from French Poly-
which have guided the initiation and the evolution of LIG nesia, which can be found at elevations of +4 to +5 m,
reefs described below. were obtained by Veeh (1966), who dated in situ fossil
The palaeo-relative sea level (RSL) has been reconstructed corals from emerged Pleistocene reef terraces on Anaa, Niau
based on reported elevations of coral assemblages, tectonic and Makatea. Leptoria specimens at elevations of +2 to
+4 ± 0.5 m MLWS on Anaa have been dated at 110 ± 20,
140 ± 30 and 150 ± 40 ka (WALIS U-series IDs 1731–1733;
Earth Syst. Sci. Data, 13, 2651–2699, 2021 https://doi.org/10.5194/essd-13-2651-2021N. Hallmann et al.: MIS 5e in tropical Pacific islands 2661 Figure 9. Map showing islands in Vanuatu considered in this article (green and orange circles). Study sites are indicated by white and green circles. Basemap: “National Geographic Map”, with data from National Geographic, Esri, Garmin, HERE, UNEP-WCMC, USGS, NASA, ESA, METI, NRCAN, GEBCO, NOAA and INCREMENT P Corp. ANAA5, ANAA15 and ANAA16). However, the use of the Modern Leptoria is living at a median and average depths alpha-counting technique resulted in large age uncertainties. of 4 and 7.5 m, respectively (see Table 2). Consequently, Pirazzoli et al. (1988a) used electron spin resonance (ESR) the palaeo-RSL based on those four Leptoria specimen from to date the 4–5 m high raised reefs from Anaa (see Fig. 2 in Anaa is assumed to have been at +8.75 ± 2.3 m (WALIS Pirazzoli et al., 1988a). A Leptoria? coral colony in growth RSL ID 548). position with an aragonite content of 97 % yielded an age of An emerged reef terrace at the same elevation has 109 + 8/ − 4 ka (WALIS ESR ID 103; 3AN14). The authors been dated by Veeh (1966) on Niau and Makatea. Two reported an elevation of 3.85 ± 0.2 m above mean sea level Leptoria specimens at hand-levelled elevations of +3 to (MSL) and a palaeo-MSL at an elevation of +4.15 ± 0.2 m. +4 ± 0.5 m MLWS on Niau have been dated at 160 ± 40 ka https://doi.org/10.5194/essd-13-2651-2021 Earth Syst. Sci. Data, 13, 2651–2699, 2021
2662                                                                                  N. Hallmann et al.: MIS 5e in tropical Pacific islands

Table 2. Modern depth distribution (in metres below mean sea level – MSL) of corals identified in LIG records from the tropical Pacific
islands. This table is based on two databases: OBIS (Ocean Biodiversity Information System; https://obis.org, last access: 22 April 2021)
and IUCN (International Union for Conservation of Nature; https://www.iucnredlist.org, last access: 22 April 2021).

                                                                    OBIS database                                IUCN database
                                                 Median depth   Average depth     Min depth    Max depth     Min depth    Max depth
            Acropora∗                                     4.0             5.7            0.0         91.0
            Acropora aspera                               3.0             3.0            0.0         11.0           0.0           5.0
            Acropora millepora                            3.0             3.9            0.0         12.0           2.0          12.0
            Acropora pulchra                              3.0             4.0            0.0         18.0           1.0          20.0
            Cyphastrea serailia                           4.5             5.2            0.0         24.9           0.0          50.0
            Dipsastraea                                   6.0            11.1            0.0         60.0
            Dipsastraea laxa                              7.0             5.9            0.0         11.0           1.0          25.0
            Gardineroseris planulata                      3.0             5.9            0.0         50.0           2.0          30.0
            Goniastrea                                    6.0            15.3            0.0         92.0
            Goniastrea retiformis                         8.0            17.9            0.0         53.0           0.0          20.0
            Goniastrea stelligera                         0.0            13.6            0.0         91.0           0.0          20.0
            Leptastrea                                    7.0            16.8            0.0         86.0
            Leptoria                                      4.0             7.5            0.0         86.0
            Leptoria phrygia                              4.0             5.0            0.0         47.0           0.0          30.0
            Oulophyllia crispa                            6.0             6.4            0.0         50.0           2.0          30.0
            Platygyra                                     4.0             6.9            0.0         84.0
            Platygyra lamellina                           4.0             4.4            0.0         27.4           1.0          30.0
            Platygyra sinensis                            5.0             5.0            0.0         17.0           0.0          30.0
            Plesiastrea versipora                         6.0             5.8            0.0         30.0           1.0          40.0
            Pocillopora                                   0.0            15.6            0.0        142.0
            Pocillopora meandrina                         0.0            15.8            0.0         98.0           1.0          27.0
            Porites∗                                      0.0            18.5            0.0        142.0
            Porites lobata                                0.0            19.2            0.0         98.0           0.0          30.0
            Porites lutea                                 0.0             2.7            0.0         84.0           0.0          30.0
          ∗ Data for Indo-Pacific region only.

Figure 10. Map showing islands in New Caledonia considered
in this article (green and white circles). Basemap: “National Ge-
ographic Map”, with data from National Geographic, Esri, Garmin,                Figure 11. Map showing study sites on the Huon Peninsula, Papua
HERE, UNEP-WCMC, USGS, NASA, ESA, METI, NRCAN,                                  New Guinea, considered in this article (orange circle). Basemap:
GEBCO, NOAA and INCREMENT P Corp.                                               “National Geographic Map”, with data from National Geographic,
                                                                                Esri, Garmin, HERE, UNEP-WCMC, USGS, NASA, ESA, METI,
                                                                                NRCAN, GEBCO, NOAA and INCREMENT P Corp.

Earth Syst. Sci. Data, 13, 2651–2699, 2021                                                      https://doi.org/10.5194/essd-13-2651-2021
N. Hallmann et al.: MIS 5e in tropical Pacific islands 2663 Figure 12. Map showing Guam and islands in the Northern Mariana Islands considered in this article. Study sites on Saipan are indicated by white circles. Basemap: “National Geographic Map”, with data from National Geographic, Esri, Garmin, HERE, UNEP-WCMC, USGS, NASA, ESA, METI, NRCAN, GEBCO, NOAA and INCREMENT P Corp. and 120 ± 20 ka (WALIS U-series IDs 1735 and 1736; Camoin, 2011) are mainly composed of coralgal frameworks NIAU4 and NIAU6). The palaeo-RSL on Niau is assumed built by an Acropora gr. danai-robusta/Porolithon onkodes to have been at +9.25 ± 2.0 m (WALIS RSL ID 549). Favia assemblage, which typifies a very shallow depositional en- (now called Dipsastraea; Huang et al., 2014) and Lepto- vironment (i.e. shallower than 6 m). However, only one out ria on Makatea at an elevation of +3 ± 0.5 m MLWS have of six datings has been accepted (Camoin et al., 2001) and yielded ages of 140 ± 30 ka and 100 ± 20 ka (WALIS U- concerns a reworked colony of Acropora specimen at 92.7 m series IDs 1737–1738; MAKA2 and MAKA3). The palaeo- below MSL yielding an age of 124.4 ± 2 ka (WALIS U-series RSL on Makatea is assumed to have been at +8.75 ± 1.8 m IDs 1017–1022; WALIS RSL ID 551; core FIL 5/30 at depth (WALIS RSL ID 550). Montaggioni and Camoin (1997) of 92.7 m). The subsidence rate of Moruroa has been esti- identified two well-defined Pleistocene terraces on Makatea, mated at 0.007–0.008 mm/yr (Camoin et al., 2001), i.e. about one of which is at an elevation of +7 m and can be related 1 m since 125 ka. to the 125 ka RSL highstand. It can be assumed that Makatea Gischler et al. (2016) dated a barrier reef drill core from reached relative vertical stability just prior to the 120 ka ma- Bora Bora. Core TEV1 was drilled at MSL, and a Pocillo- rine transgression (Montaggioni et al., 1985; Montaggioni pora specimen at 30.6 ± 0.6 m below MSL has given an age and Camoin, 1997). of 116.9 ± 1.1 ka (WALIS U-series ID 1869; TEV1). This LIG reef deposits have been reported in drill cores col- sample is 100 % aragonitic and the dating is considered reli- lected in Moruroa (Camoin et al., 2001) and Bora Bora able. The subsidence rate of Bora Bora has been estimated at (Gischler et al., 2016). The reef units related to the LIG in 0.05 to 0.14 mm/yr. Moruroa drill cores (see Figs. 15 and 2 in Braithwaite and https://doi.org/10.5194/essd-13-2651-2021 Earth Syst. Sci. Data, 13, 2651–2699, 2021
2664                                                                           N. Hallmann et al.: MIS 5e in tropical Pacific islands

Figure 13. Map showing islands in Hawaii considered in this article (green and orange circles). Study sites on Lanai and Oahu are indicated
by blue and green circles. Basemap: “National Geographic Map”, with data from National Geographic, Esri, Garmin, HERE, UNEP-WCMC,
USGS, NASA, ESA, METI, NRCAN, GEBCO, NOAA and INCREMENT P Corp.

  In a recent study by Montaggioni et al. (2019a) a “eustatic           5.2   Cook Islands
sea level” of about 7 m above MSL during MIS 5e has been
considered on Takapoto, but no U-series age has been re-
                                                                        LIG reef deposits have been reported from outcrops on sev-
ported.
                                                                        eral southern Cook Islands and from drill cores collected on
                                                                        Pukapuka, northern Cook Islands.
                                                                           The southern Cook Islands have been located in a complex
                                                                        tectonic setting related to volcanic processes since 1.65 Ma,
                                                                        the mean age for the main shield-building phase (Te Manga)
                                                                        on Rarotonga (Thompson et al., 1998; Neal and Trewick,

Earth Syst. Sci. Data, 13, 2651–2699, 2021                                               https://doi.org/10.5194/essd-13-2651-2021
N. Hallmann et al.: MIS 5e in tropical Pacific islands 2665
Table 3. Measurement techniques used to establish the elevation of MIS 5e shorelines in the tropical Pacific islands.
Measurement Description Typical accuracy
technique
Total station or Total stations or levels measure slope distances from the instrument to ±0.1/±0.2 m for total station
Auto/hand level a particular point and triangulate relative to the XY Z coordinates of the ±0.2/±0.4 m for hand level
base station. The accuracy of this process depends on how well defined
the reference point and on the distance of the surveyed point from the
base station. Thus, it is necessary to benchmark the reference station
with a nearby tidal datum, or use a precisely (DGPS) known geode-
tic point. The accuracy of the elevation measurement is also inversely
proportional to the distance between the instrument and the point being
measured.
Theodolite and rod Elevation derived from triangulation with a theodolite. Usually very precise, centimet-
ric accuracy, depending on dis-
tance
Barometric Difference in barometric pressure between a point of known elevation Up to ±20 % of elevation mea-
altimeter (often sea level) and a point of unknown elevation. Not accurate and surement
used only rarely in sea-level studies.
Cross section from The elevation was extracted from a published sketch/topographic sec- Variable, depending on the
publication tion. scale of the sketch or
topographic section
Metered tape or rod The end of a tape or rod is placed at a known elevation point, and the Up to ±10 % of elevation mea-
elevation of the unknown point is calculated using the metered scale surement
and, if necessary, clinometers to calculate angles.
Distance from top Distance from the top of drill core. Depending on coring technique
of drill core and sampling procedures
Differential GPS GPS positions acquired in the field and corrected either in real time or ±0.02/±0.08 m, depending on
during post-processing with respect to the known position of a base sta- survey conditions and instru-
tion or a geostationary satellite system (e.g. OmniSTAR). Accuracy de- ments used (e.g. single-band vs.
pends on satellite signal strength, distance from base station and number dual-band receivers)
of static positions acquired at the same location.
Not reported The elevation measurement technique was not reported, most probably 20 % of the original elevation
hand level or metered tape. reported added in root mean
square to the sea-level datum
error
2008). The formation of this volcanic system led to the sub- spectively, based on a 6 m sea-level highstand during the LIG
sidence of some islands (Rarotonga, Aitutaki and Manuae) (Woodroffe et al., 1991). These rates would imply an up-
and the subsequent uplift of other islands related to a flexural lift of these islands of about 3.6 to 12 m since 120 ka. Con-
response to loading of the ocean floor (McNutt and Menard, versely, a subsidence rate of 0.02 mm/yr has been considered
1978). However, this flexural response has been the subject for Rarotonga (Woodroffe et al., 1991). However, it is uncer-
of many debates and controversies regarding its course, tim- tain whether the assumed 6 m LIG sea-level highstand for the
ing and amplitude (see review in Woodroffe et al., 1991). Cook Islands is appropriate.
Gray et al. (1992) reported an average subsidence rate of Gray et al. (1992) reported a subsidence rate of
0.03 to 0.06 mm/yr for the Cook Islands, resulting in a sub- 0.045 ± 0.028 mm/yr for Pukapuka in the northern Cook Is-
sidence of up to 7.5 m since 125 ka. In contrast, uplift rates lands.
have been estimated at approximately 0.044 mm/yr on Man- Exposed reef terraces can be found at different elevations,
gaia, 0.011 mm/yr on Atiu, and 0.005–0.007 mm/yr on Mi- up to 15 m above MSL, on different southern Cook Islands,
tiaro and Mauke (Spencer et al., 1988). Uplift rates over the including Mangaia, Rarotonga, Atiu, Mauke and Mitiaro.
last 120 kyr have been estimated at 0.07–0.10, 0.05, 0.03 and The first datings of LIG reef limestones in the southern Cook
0.03–0.05 mm/yr for Mangaia, Atiu, Mitiaro and Mauke, re- Islands have been provided by Veeh (1966). He dated in situ
https://doi.org/10.5194/essd-13-2651-2021 Earth Syst. Sci. Data, 13, 2651–2699, 20212666 N. Hallmann et al.: MIS 5e in tropical Pacific islands
Table 4. Sea-level datums reviewed in this study. n/a – not applicable
Datum name Datum description Datum uncertainty
Mean sea level/general definition General definition of MSL, with no indications on the A datum uncertainty
datum to which it is referred to. can be established on a
case-by-case basis.
Modern reef Upper surface of modern reef. A datum uncertainty
may be established on a
case-by-case basis.
Mean high tide (MHT) From NOAA definitions: “It is obtained by subtracting Depending on the qual-
the mean of all the high waters from the mean of the ity of tidal data used.
higher high waters. One-half the average difference be-
tween the two low waters of each tidal day observed
over the National Tidal Datum Epoch.”
Mean low tide (MLT) From http://tideschart.com (last access: 22 April 2021): Depending on the qual-
“The Mean Low Tide (or Mean Low Water) is the av- ity of tidal data used.
erage height of all low tides in a given place, deriving
from a long series of observations (NTDE) of all levels
of low tide in that spot.”
Mean low water springs (MLWS) From http://www.coastalwiki.org (last access: 22 April Depending on the qual-
2021): “The height of mean low water springs is the av- ity of tidal data used.
erage throughout a year of the heights of two successive
low waters during those periods of 24 h (approximately
once a fortnight) when the range of the tide is greatest.”
Not reported The sea-level datum is not reported and impossible to n/a
derive from metadata.
Figure 14. Reconstruction of palaeo-relative sea level (RSL) based on reported palaeo-elevations of last interglacial (LIG) corals and esti-
mated palaeo-water-depth intervals of their modern counterparts. The range bars indicate maximum, median and minimum depths. Modern
corals are shown in grey and LIG corals in white.
fossil corals from emerged Pleistocene reef terraces on Man- Table 2). Spencer et al. (1988) dated four Porites samples
gaia using the alpha-counting technique. Two corals, Favia from an encrusting groove wall on Mangaia using the alpha-
(now called Dipsastraea; Huang et al., 2014) and Leptoria, counting technique. All samples contained less than 1 % of
at a hand-levelled elevation of +2 ± 0.5 m MLWS have been calcite, and all datings have been accepted. The four samples
dated at 90 ± 20 and 110 ± 20 ka, respectively (WALIS U- at elevations of +15, +11, +3 and +13 m MLT have been
series IDs 1744 and 1746; MANG1 and MANG2; WALIS dated at 118 ± 12, 107 ± 18, 101 ± 12 and 135 ± 15 ka, re-
RSL ID 585). Modern Leptoria live at median and aver- spectively (WALIS U-series IDs 1848 and 1850–1852; M2,
age depths of 4 and 7.5 m, respectively; however, their depth M3, M47 and M54; 1σ uncertainty; WALIS RSL ID 584; see
range is large, from the surface down to more than 80 m (see Fig. 16). The tidal range is approximately 80 cm; i.e. the sam-
Earth Syst. Sci. Data, 13, 2651–2699, 2021 https://doi.org/10.5194/essd-13-2651-2021N. Hallmann et al.: MIS 5e in tropical Pacific islands 2667 Figure 15. Distribution of radiometric ages and reconstruction of successive reef units (MIS: Marine Isotopic Stages) in Moruroa cores FIL 8/30 and 8/40 (from Camoin et al., 2001, and Braithwaite and Camoin, 2011). ple elevations are of +15.4, +11.4, +3.4 and +13.4 MSL. an age of 111 ± 6 and 113 ± 9 ka (WALIS U-series IDs 1816 Porites lives at median and average depths of 0 and 18.5 m, and 1817; AT11; WALIS RSL ID 559). respectively, in modern environments; however, this genus Woodroffe et al. (1991) also dated four samples from displays a wide depth range, from the surface down to more Mauke (see Fig. 18): (1) a Porites colony from a perched than 100 m (see Table 2). reef block at an elevation of +7 to +8 m MLT (interpreted Stoddart et al. (1985) presumed the occurrence of LIG elevation +7.5 ± 1 m MSL) with an age of 136 ± 10 and reefs on Rarotonga, southern Cook Islands, at a maximum 138 ± 10 ka (WALIS U-series IDs 1818 and 1819; MK9; elevation of 3.5 m above MSL. They assumed that these reefs WALIS RSL ID 560); (2) an encrusting coral from the up- have not been tectonically uplifted. per unit at an elevation of more than +2 m MLT (inter- Spencer et al. (1987, 1988) identified deposits of proba- preted elevation +3 ± 1 m MSL) with an age of 123 ± 8 and ble Late Pleistocene age at +12.2 m on Atiu, +10.0 m on 138 ± 12 ka (WALIS U-series IDs 1820 and 1821; MK15; Mauke and +9.8 m on Mitiaro in the southern Cook Is- WALIS RSL ID 561); (3) a Porites colony from the en- lands. Stoddart et al. (1990) found evidence of late Pleis- crusting upper unit at an elevation of +5 m MLT (inter- tocene RSL up to +12.2 m on Atiu, +10.0 m on Mauke preted elevation +5 ± 1 m MSL) with an age of 136 ± 11 and and +9.8 m on Mitiaro. They also reported unconformi- 145 ± 10 ka (WALIS U-series IDs 1822 and 1823; MK16; ties within the Pleistocene at +1.75 to +2.65 m on Atiu, WALIS RSL ID 561); and (4) a Porites boulder in the up- +1.5 to +2.75 m on Mauke and +4.1 to +6.0 m on Mi- per unit at an elevation of +6 m MLT (interpreted eleva- tiaro. Woodroffe et al. (1991) identified MIS 5e reefs on tion +6 ± 1 m MSL) with an age of 119 ± 8 and 119 ± 7 ka Atiu, Mauke and Mitiaro using the alpha-counting technique. (WALIS U-series IDs 1824 and 1825; MK18; WALIS RSL Three samples from Atiu have been dated (WALIS U-series ID 561). Porites lives at median and average depths of 0 and IDs 1812–1817; AT8, AT9 and AT11; see Fig. 17): (1) an 18.5 m, respectively, in modern environments; however, this in situ Porites on an erosional bench at an elevation of less genus displays a wide depth range (see Table 2). than +2.7 m MLT (interpreted elevation +1.5 ± 1.5 m MSL) Five samples from Mitiaro (see Fig. 19) have been dated with an age of 132 ± 10 and 111 ± 7 ka (WALIS U-series by Woodroffe et al. (1991): (1) two specimens of Faviidae IDs 1812 and 1813; AT8; WALIS RSL ID 557); (2) a Porites (now called Merulinidae; Huang et al., 2014) from Te Unu colony from the encrusting upper unit at an elevation of more at an elevation of more than +4 m (interpreted elevation than +2.7 m MLT (interpreted elevation +6.5 ± 3.5 m MSL) +6.5 ± 2.5 m MSL) have been dated at 128 ± 6, 140 ± 10, with an age of 135 ± 10 and 151 ± 12 ka (WALIS U-series 98.1 ± 5.4, 112 ± 7 and 132 ± 9 ka (WALIS U-series IDs IDs 1814 and 1815; AT9; WALIS RSL ID 558); and (3) a 1826–1830; MT1 and MT2; WALIS RSL ID 580); Merulin- massive in situ coral on the cliff top at an elevation of +10 idae mainly indicate a depth range of 0–30 m; (2) one Ple- to +12 m MLT (interpreted elevation +11 ± 1 m MSL) with siastrea specimen from the north coast at an elevation of https://doi.org/10.5194/essd-13-2651-2021 Earth Syst. Sci. Data, 13, 2651–2699, 2021
2668                                                                          N. Hallmann et al.: MIS 5e in tropical Pacific islands

Figure 16. Sea-level indicators on Mangaia, Cook Islands. Selected profiles and dated samples are shown (from Woodroffe et al., 1991).

Figure 17. Sea-level indicators on Atiu, Cook Islands. Selected profiles and dated samples are shown (from Woodroffe et al., 1991).

more than +4 m (interpreted elevation +6.5 ± 2.5 m MSL)                Table 2). All samples contained less than 1 %–2 % of calcite,
has been dated at 120 ± 6 and 132 ± 9 ka (WALIS U-series               and all datings have been accepted (1σ uncertainty). Eleva-
IDs 1832 and 1834; MT9; WALIS RSL ID 581); in modern                   tions have been hand-levelled, and the tidal range is approx-
reef environments, Plesiastrea mainly lives at depths rang-            imately 80 cm.
ing from the surface down to 10 m; (3) one Porites spec-                  Gray et al. (1992) extracted drill cores and described
imen from the village at an elevation of more than +2 m                widespread LIG reefs on Pukapuka (see Fig. 3 in Gray et
(interpreted elevation +5.5 ± 3.5 m MSL) has yielded ages              al., 1992); however, they only obtained reliable ages on two
of 116 ± 8, 144 ± 9 and 106.3 ± 5.4 ka (WALIS U-series                 Porites specimens (100 % aragonite; WALIS RSL ID 586).
IDs 1836–1838; MT13; WALIS RSL ID 582); and (4) one                    Electron spin resonance (ESR) dating provided two ages of
Porites specimen from Vaikoua at an elevation of more than             144 ± 22 and 136 ± 20 ka for samples at depths of 21.77
+3 m (interpreted elevation +4 ± 1 m MSL) revealed an age              and 24.85 m MSL, respectively (WALIS ESR IDs 104 and
of 118 ± 7 (WALIS U-series IDs 1841 and 1842; MT15;                    105; 991 and 951). The Porites specimen at a depth of
WALIS RSL ID 583). Porites lives at median and average                 24.85 m MSL was also dated using the alpha-counting tech-
depths of 0 and 18.5 m, respectively, in modern environ-               nique, which revealed an age of 130 ± 9 ka (WALIS U-series
ments; however, this genus displays a wide depth range (see            ID 1855, 1σ uncertainty; 951). Porites lives at median and

Earth Syst. Sci. Data, 13, 2651–2699, 2021                                              https://doi.org/10.5194/essd-13-2651-2021
N. Hallmann et al.: MIS 5e in tropical Pacific islands                                                                              2669

Figure 18. Sea-level indicators on Mauke, Cook Islands. Selected profiles and dated samples are shown (from Woodroffe et al., 1991).

Figure 19. Sea-level indicators on Mitiaro, Cook Islands. Selected profiles and dated samples are shown (from Woodroffe et al., 1991).

average depths of 0 and 18.5 m, respectively in modern envi-             Overall, the large variability in elevations and the lack of
ronments.                                                              accurate ages from the Cook Islands do not allow any precise
   Most of the dated samples from the southern Cook Islands            conclusion about the LIG RSL.
by Woodroffe et al. (1991) can be related to the LIG RSL
highstand, but a MIS 7 reef, i.e. the penultimate interglacial,
                                                                       5.3    Samoa
has also been observed (see Fig. 20). Woodroffe et al. (1991)
did not observe two periods of high RSL separated by a pe-             Exposed Pleistocene reef terraces have been described on
riod of lower RSL during the LIG. However, they describe               several Samoan Islands, but no dates have been reported in
several stratigraphic features, such as erosional benches and          the reviewed studies. Kear and Wood (1959) reported ter-
notches, that might indicate RSL fluctuations during MIS 5e.           races occurring at up to 15 and 10 m higher than present RSL

https://doi.org/10.5194/essd-13-2651-2021                                               Earth Syst. Sci. Data, 13, 2651–2699, 2021
2670 N. Hallmann et al.: MIS 5e in tropical Pacific islands
Figure 20. Uranium-series ages (±1 standard error) from corals of
the southern Cook Islands, and comparison with the late Quaternary
sea-level curve of Chappell and Shackleton (1986) (from Woodroffe
et al., 1991).
on Upolu and Upolu’s offshore islands, respectively, and that
might correspond to the LIG period (125 ka). They also de- Figure 21. Bathymetric and topographic map of Niue (from
scribed benches near Fagaloa Bay at elevations of +39 to Kennedy et al., 2012).
+60 m, which might relate to the LIG or penultimate inter-
glacial.
Stice and McCoy (1968) observed cliffs with benches at Nunn and Britton, 2004; Kennedy et al., 2012). Nunn and
elevations of 4.5 to 1.5 m above MSL, probably indicating Britton (2004) indicated the presence of at least seven ter-
former higher RSL on three Manu’a Islands. The +3.7 to races, at +58, +52, +43.5, +34, +28, +23 and +18 m with
+3.0 m terrace is composed of sand and coral shingle or en- ages back to 700 ka. Kennedy et al. (2012) dated the Alofi
tirely of sand. Terrace (see Fig. 22) based on the dating of one Porites
specimen at 133 ± 0.9 ka (WALIS U-series ID 1285; NT11;
WALIS RSL ID 3981) at an elevation of 3.1 m above the
5.4 Niue height of living corals. This coral head consisted of more
LIG reef deposits have been dated from outcrops by Kennedy than 95 % of aragonite, and the dating is considered reliable.
et al. (2012). The earliest studies by Agassiz (1903), David Porites lives at median and average depths of 0 and 18.5 m,
(1904) and Schofield (1959) described different raised reef respectively, in modern environments; however, this genus
terraces on Niue. The widest terrace (Alofi Terrace; see displays a wide depth range (see Table 2). Niue is affected
Figs. 21 and 22) is the most continuous one around the is- by uplift with estimated rates of 0.13–0.16 mm/yr, with uplift
land (Agassiz, 1903). David (1904) recognized three terraces considered to be ongoing (Dickinson, 2001), thus indicating
at +6, +24 to +27 and +60 m and also mentioned a ter- an uplift of 16 to 20 m since 125 ka.
race at an elevation of 40 m above MSL. Schofield (1959)
distinguished the Alofi Terrace at about +23 m and the Mu- 5.5 Tonga
talau Platform, a +69 m high terrace, and identified five more
terraces, including two submerged ones at −37 to −33 and LIG reef terraces in Tonga have been reported from out-
−15 to −11 m and three exposed ones at +12 to +14, +35 crops at elevations of about +5 to +7 m. Taylor (1978) and
to +40 and at +55 m. At least parts of the Alofi Terrace date Yonekura (1983) dated emerged reef terraces on the Tongat-
to 230–260 ka (Wheeler, 2000). The Alofi Terrace is overlain apu block using the alpha-counting technique. Taylor (1978)
by a 6 m thick LIG reef sequence (Paulay, 1988; Paulay and described a group of emerged notches and caves at 6.6–7.2 m
Spencer, 1992; Spencer and Paulay, 1994; Wheeler, 2000). above present MSL and dated a single sample at 133 ± 12 ka
Beach deposits and erosional features indicate a 6 m high (WALIS U-series ID 1787). Yonekura (1983) described LIG
RSL (Paulay and Spencer, 1992). More recent studies de- reefs at +5.5 m MHT and provided ages of 135 ± 15 and
scribe the different terraces on Niue from close to present 133 ± 12 ka (WALIS U-series IDs 1785 and 1786; WALIS
MSL up to an elevation of +60 m (Terry and Nunn, 2003; RSL ID 554). A wide palaeo-water-depth range of 0–30 m
Earth Syst. Sci. Data, 13, 2651–2699, 2021 https://doi.org/10.5194/essd-13-2651-2021You can also read