Progress on level of water stress - GLOBAL STATUS AND ACCELER ATION NEEDS FOR SDG INDICATOR 6.4.2 2021
←
→
Page content transcription
If your browser does not render page correctly, please read the page content below
Progress on
   level of water
           stress
 G LO B A L S TAT U S A N D
AC C E L E R AT I O N N E E D S
  F O R S D G I N D I C ATO R
                        6.4.2

                        2021
Progress on level of
               water stress
                 Global status and
               acceleration needs for
                SDG indicator 6.4.2

                        2021

FOOD AND AGRICULTURE ORGANIZATION OF THE UNITED NATIONS
               AND UNITED NATIONS WATER,
                      ROME, 2021
Required citation: FAO and UN Water. 2021. Progress on Level of Water Stress. Global status and acceleration needs for SDG
Indicator 6.4.2, 2021. Rome. https://doi.org/10.4060/cb6241en

The designations employed and the presentation of material in this information product do not imply the expression of any opinion
whatsoever on the part of the Food and Agriculture Organization of the United Nations (FAO) or UN Water concerning the legal
or development status of any country, territory, city or area or of its authorities, or concerning the delimitation of its frontiers or
boundaries. Dashed lines on maps represent approximate border lines for which there may not yet be full agreement. The mention
of specific companies or products of manufacturers, whether or not these have been patented, does not imply that these have
been endorsed or recommended by FAO or UN Water in preference to others of a similar nature that are not mentioned.

ISBN 978-92-5-134826 (FAO)

© FAO and UN Water, 2021

Some rights reserved. This work is made available under the Creative Commons Attribution-NonCommercial-ShareAlike 3.0 IGO
licence (CC BY-NC-SA 3.0 IGO; https://creativecommons.org/licenses/by-nc-sa/3.0/igo/legalcode).

Under the terms of this licence, this work may be copied, redistributed and adapted for non-commercial purposes, provided that
the work is appropriately cited. In any use of this work, there should be no suggestion that FAO endorses any specific organization,
products or services. The use of the FAO logo is not permitted. If the work is adapted, then it must be licensed under the same or
equivalent Creative Commons licence. If a translation of this work is created, it must include the following disclaimer along with
the required citation: “This translation was not created by the Food and Agriculture Organization of the United Nations (FAO). FAO
is not responsible for the content or accuracy of this translation. The original [Language] edition shall be the authoritative edition.”

Disputes arising under the licence that cannot be settled amicably will be resolved by mediation and arbitration as described
in Article 8 of the licence except as otherwise provided herein. The applicable mediation rules will be the mediation rules of the
World Intellectual Property Organization http://www.wipo.int/amc/en/mediation/rules and any arbitration will be conducted in
accordance with the Arbitration Rules of the United Nations Commission on International Trade Law (UNCITRAL).

Third-party materials. Users wishing to reuse material from this work that is attributed to a third party, such as tables, figures
or images, are responsible for determining whether permission is needed for that reuse and for obtaining permission from the
copyright holder. The risk of claims resulting from infringement of any third-party-owned component in the work rests solely with
the user.

Sales, rights and licensing. FAO information products are available on the FAO website (www.fao.org/publications) and can be
purchased through publications-sales@fao.org. Requests for commercial use should be submitted via: www.fao.org/contact-us/
licence-request. Queries regarding rights and licensing should be submitted to: copyright@fao.org.

Cover photograph: Afghanistan by John Winnie Jr.

MAPS:

Final boundary between the Sudan and South Sudan has not yet been determined.
Final status of the Abyei area is not yet determined.
Dotted line represents approximately the Line of Control in Jammu and Kashmir agreed upon by India and Pakistan. The final
status of Jammu and Kashmir has not yet been agreed upon by the parties.
Presenting the UN-Water
      Integrated Monitoring
      Initiative for SDG 6

      Through the UN-Water Integrated Monitoring Initiative for SDG 6 (IMI-SDG6), the United Nations seeks to
      support countries in monitoring water- and sanitation-related issues within the framework of the 2030
      Agenda for Sustainable Development, and in compiling country data to report on global progress towards
      SDG 6.

      IMI-SDG6 brings together the United Nations organizations that are formally mandated to compile
      country data on the SDG 6 global indicators, and builds on ongoing efforts such as the World Health
      Organization (WHO)/United Nations Children’s Fund (UNICEF) Joint Monitoring Programme for Water
      Supply, Sanitation and Hygiene (JMP), the Global Environment Monitoring System for Freshwater (GEMS/
      Water), the Food and Agriculture Organization of the United Nations (FAO) Global Information System on
      Water and Agriculture (AQUASTAT) and the UN-Water Global Analysis and Assessment of Sanitation and
      Drinking-Water (GLAAS).

      This joint effort enables synergies to be created across United Nations organizations and methodologies
      and requests for data to be harmonized, leading to more efficient outreach and a reduced reporting
      burden. At the national level, IMI-SDG6 also promotes intersectoral collaboration and consolidation of
      existing capacities and data across organizations.

      The overarching goal of IMI-SDG6 is to accelerate the achievement of SDG 6 by increasing the availability
      of high-quality data for evidence-based policymaking, regulations, planning and investments at all levels.
      More specifically, IMI-SDG6 aims to support countries to collect, analyse and report SDG 6 data, and to
      support policymakers and decision makers at all levels to use these data.

      > Learn more about SDG 6 monitoring and reporting and the support available: www.sdg6monitoring.org

      > Read the latest SDG 6 progress reports, for the whole goal and by indicator:
         https://www.unwater.org/publication_categories/sdg6-progress-reports/

      > Explore the latest SDG 6 data at the global, regional and national levels: www.sdg6data.org

III
IV
Contents

    FAO foreword .................................................................................................. ix

    UN-Water foreword......................................................................................... xi

    Acknowledgements........................................................................................ xiii

    List of acronyms and abbreviations.............................................................. Xv

    Executive summary....................................................................................... XVII

    Key messages and recommendations............................................................. Xix

    1.	Reporting water stress under the 2030 Agenda....................................... 1
      1.1. What is water stress and why is it important?.................................................................................. 3

      1.2. Setting the scene – lessons learned for the new reporting period and capacity-building
      initiatives.................................................................................................................................................... 3

    2.	How to monitor water stress................................................................... 7
      2.1. Globally available data – from country-led collection to the AQUASTAT database...................... 7

            2.1.1. Treatment of missing values at country and regional level................................................... 8

            2.1.2. Regional aggregations............................................................................................................. 9

      2.2. Calculation methodology................................................................................................................... 9

      2.3. Threshold levels............................................................................................................................... 10

      2.4. Disaggregation – sector, country and basin level.......................................................................... 11

      2.5. Case study – how are countries handling complex data collection?........................................... 12

V
3.	Results and analysis............................................................................... 15
  3.1. Challenges – dealing with data gaps.............................................................................................. 15

  3.2. Level of water stress – a global problem regionally differentiated.............................................. 17

  3.3. Analysis of water stress by countries............................................................................................. 21

        3.3.1. Highly water-stressed countries........................................................................................... 21

  3.4. Level of water stress at major river basin level ............................................................................. 26

        3.4.1. Sectoral disaggregation at the major basins....................................................................... 28

  3.5. Socioeconomic drivers and impacts of water stress.................................................................... 31

4.	Conclusion, challenges and next steps................................................. 35
  4.1. Summary of findings........................................................................................................................ 35

  4.2. Recommendations to accelerate the achievement of a reduction in water stress.................... 36

        4.2.1. Policy recommendations....................................................................................................... 36

  4.3. Recommendations for the reporting process................................................................................ 38

References...................................................................................................... 43

Annexes.......................................................................................................... 47
  Annex I. Country data for the water stress indicator (2018)................................................................ 47

  Annex II. AQUASTAT questionnaire template........................................................................................ 55

  Annex III. Approach used to disaggregate the SDG 6.4.2 by major river basin.................................. 61

  Annex IV. Indicators-related basic documents and information resources....................................... 65

Learn more about progress towards SDG 6.................................................... 67

                                                                                                                                                        VI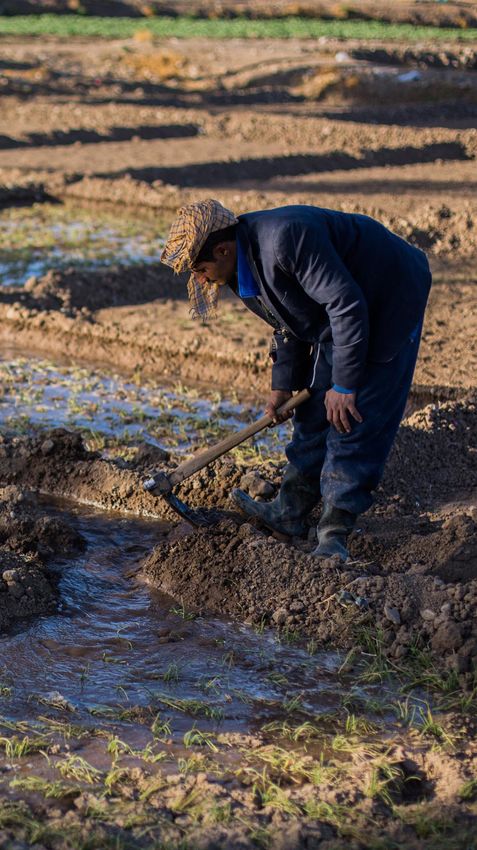
List of boxes and figures

      Box 1. SDG 6 – Ensure availability and sustainable management of water and sanitation for all...... 2

      Box 2. Capacity-building resources available for country representatives to get acquainted with the
      indicator 6.4.2 monitoring and reporting process.................................................................................. 5

      Box 3. Steps in the AQUASTAT data-validation process........................................................................ 8

      Box 4. Water stress indicator in Brazil by hydrographic region........................................................... 39

      Figure 1. Percentage of questionnaires received by countries in each of the subregions (2020).... 16

      Figure 2. Change of the global water stress levels (2006–2018)........................................................ 18

      Figure 3. Level of water stress by region and subregion (2018).......................................................... 18

      Figure 4. Change in the level of water stress by region and at the global level (2008–2018)........... 19

      Figure 5. Global Map of aridity index..................................................................................................... 20

      Figure 6. Level of water stress, by region and subregion (2006–2018).............................................. 20

      Figure 7. Global map of the level of water stress by country (2018).................................................... 21

      Figure 8. Water stress values in Least Developed Countries (2018)................................................... 23

      Figure 9. Water stress and drinking water coverage level in Least Developed Countries (2017)..... 23

      Figure 10. Water stress levels (%) in Landlocked Developing Countries (2018)................................. 24

      Figure 11. Water withdrawals by major sectors in
      Landlocked Developing Countries (2018).............................................................................................. 25

      Figure 12. Water stress in Small Island Developing States with available data (2018)...................... 27

      Figure 13. Global map of the level of water stress by major river basin (2018) ................................ 28

      Figure 14. Global map of the level of water stress by major river basin with country boundaries
      (2018)........................................................................................................................................................ 28

VII
Figure 15. Global map of the dominant economic sectors for freshwater withdrawals by major river
basins (2018)............................................................................................................................................ 29

Figure 16. Global maps of the proportion of freshwater withdrawal of each economic sector over
the total freshwater withdrawal (2018).................................................................................................. 29

Figure 17. Major farming system occurrence according to the level of water stress in major river
basins....................................................................................................................................................... 32

Figure 18. Global water withdrawals by main sector (2018)................................................................ 32

Figure 19. Distribution of global population by water stress at country level in 2000 (left) and 2018
(right)........................................................................................................................................................ 33

Figure 20. Distribution of population density (people/km2) by water stress class at major basin
level (2018) .............................................................................................................................................. 34

Figure 21. Global map of the level of water stress by major river basin indicating large cities (2018).
34

Figure 22. Extract from the National Water Agency of Brazil application where the results of
indicator 6.4.2 at the national and hydrographic-region level are publicly available......................... 39

Figure III.1. Global distribution of environmental flows (2018)............................................................ 62

Figure III.2. Global distribution of the Agriculture water withdrawal (2018)....................................... 63

Figure III.3. Service water withdrawal for the year 2018 (Vs 2018) spatialized using the Global
Human Settlement Layer population density layer and the Joint Monitoring Programme database
(access to water through “basic services”)........................................................................................... 64

                                                                                                                                                                     VIII
Foreword
One of the key premises of the 2030 Agenda for Sustainable Development is “leaving no one behind”. To
achieve this, the interlinkages between all the 17 Sustainable Development Goals must be articulated well
and appropriate actions undertaken for the benefit of all.
The Food and Agriculture Organization of the United Nations (FAO) is supporting the 2030 Agenda
through the transformation to MORE efficient, inclusive, resilient and sustainable agri-food systems for
better production, better nutrition, a better environment, and a better life - leaving no one behind. The
transformation of agri-food systems is at the heart of FAO’s mandate and at the core of FAO’s Strategic
Framework 2022-2031.
Water is the essence of life and central to agri-food systems. This report addresses the importance
of reducing water stress, which is a measure of the pressure that human activities exert on natural
freshwater resources, and provides an indication of the environmental sustainability of the use of water
resources. The path to reduce water stress passes through sustainable agri-food systems.
An important novelty of this report is the presentation of the disaggregation of the indicator by major
basins, providing better insights on the sustainability of agricultural systems that may be at risk due to
human pressure on land and water.
Alternative water sources such as wastewater, storm run-off and desalination, as well as measures such
as water harvesting, can help relieve water stress. Safe wastewater reuse and recycling is a significantly
untapped resource for industry and agriculture, but its use must overcome political and cultural barriers.
FAO joined the Integrated Monitoring Initiative for SDG6 (“Clean Water and Sanitation”) in 2015,
coordinated by UN-Water, which has gathered experiences and resources aimed at ensuring a coherent
monitoring framework for water and sanitation by 2030. Such a framework will help countries achieve
progress through well-informed decision-making on water, based on harmonized, comprehensive, timely
and accurate information.
IXFAO, predominantly through its AQUASTAT database, remains committed to improving the quality and
quantity of data produced and analysed, in close partnership with the relevant national authorities of our
Members.
In coordination and collaboration with other stakeholders, FAO will continue supporting Members to
achieve this target by providing scientific and technical assistance.
Qu Dongyu
FAO Director-General
©FAO
XForeword
The COVID-19 crisis has caused enormous disruption to sustainable development. However, even before
the pandemic, the world was seriously off track to meet Sustainable Development Goal 6 (SDG 6) – to
ensure water and sanitation for all by 2030.
No matter how significant the challenges we face, achieving SDG 6 is critical to the overarching aim of
the 2030 Agenda, which is to eradicate extreme poverty and create a better and more sustainable world.
Making sure that there is water and sanitation for all people, for all purposes, by 2030 will help protect
global society against many and varied looming threats.
Our immediate, shared task is to establish safe water and sanitation services in all homes, schools,
workplaces and health care facilities. We must increase investment in water use efficiency, wastewater
treatment and reuse, while protecting water-related ecosystems. And we must integrate our approaches,
with improved governance and coordination across sectors and geographical borders.
In short, we need to do much more, and do it much more quickly. In the SDG 6 Summary Progress Update
2021 that preceded this series of reports, UN-Water showed that the current rate of progress needs to
double - and in some cases quadruple - to reach many of the targets under SDG 6.
At the March 2021 high-level meeting on the “Implementation of the Water-related Goals and Targets
of the 2030 Agenda”, UN Member States noted that to achieve SDG 6 by 2030 will require mobilizing
an additional USD 1.7 trillion, three times more than the current level of investment in water-related
infrastructure. To make this happen, Member States are calling for new partnerships between
governments and a diverse group of stakeholders, including the private sector and philanthropic
organizations, as well as the wide dissemination of innovative technology and methods.
We know where we need to go, and data will help light the way. As we ramp up our efforts and target them
at areas of greatest need, information and evidence will be of critical importance.
Published by the UN-Water Integrated Monitoring Initiative for SDG 6 (IMI-SDG6), this series of indicator
reports is based on the latest available country data, compiled and verified by the custodian United
Nations agencies, and sometimes complemented by data from other sources.
XIThe data were collected in 2020, a year in which the pandemic forced country focal points and UN
agencies to collaborate in new ways. Together we learned valuable lessons on how to build monitoring
capacity and how to involve more people, in more countries, in these activities.
The output
a year in which of IMI-SDG6
the pandemic makes
forced anfocal
country important
pointscontribution to improving
and UN agencies data and
to collaborate information,
in new ways. one of the
five
Together we accelerators
learned valuableinlessons
the SDG
on 6how
Global Acceleration
to build monitoringFramework
capacity andlaunched last year.
how to involve more people,
in more countries, in these activities.
With these reports, our intention is to provide decision-makers with reliable and up-to-date evidence on
The output of IMI-SDG6 makes an important contribution to improving data and information, one of the five
where acceleration is most needed, so as to ensure the greatest possible gains. This evidence is also
accelerators in the SDG 6 Global Acceleration Framework launched last year.
vital to ensure accountability and build public, political and private sector support for investment.
With these reports, our intention is to provide decision-makers with reliable and up-to-date evidence on
a year in which the pandemic
Thank you forforced
readingcountry
this focal points and UN agencies
this to collaborate in new ways.
where acceleration is most needed, so document
as to ensureand
thefor joining
greatest critical
possible gains.effort. Everyone
This evidence is has
alsoavital
role to play. When
Together we learned valuable
governments, lessons
civil on how
society, to build monitoring
business, academiacapacity
and and how
developmentto involve
aid more
agenciespeople,
pull together dramatic
to ensure accountability and build public, political and private sector support for investment.
in more countries, in these activities.
gains are possible in water and sanitation. To deliver them, it will be essential to scale up this cooperation
Thank youacross
for reading this document
countries and for joining this critical effort. Everyone has a role to play. When
and regions.
The output of IMI-SDG6 makes an important contribution to improving data and information, one of the five
governments, civil society, business, academia and development aid agencies pull together dramatic gains
accelerators in the SDG 6 Global Acceleration Framework launched last year.
are possible in water and sanitation. To deliver them, will be essential to scale up this cooperation across
The COVID-19 pandemic reminds us of our shared vulnerability and common destiny. Let us “build back
countries and regions.
With these reports, our intention
better” is to water
by ensuring provide decision-makers
and with
sanitation for all byreliable
2030. and up-to-date evidence on
where acceleration is most needed, so as to ensure the greatest possible gains. This evidence is also vital
The COVID-19 pandemic reminds us of our shared vulnerability and common destiny. Let us “build back
to ensure accountability and build public, political and private sector support for investment.
better” by ensuring water and sanitation for all by 2030.
Thank you for reading this document and for joining this critical effort. Everyone has a role to play. When
governments, civil society, business, academia and development aid agencies pull together dramatic gains
are possible in water and sanitation. To deliver them, will Gilbert F. Houngbo
be essential to scale up this cooperation across
countries and regions.
UN-Water Chair and President
The COVID-19 pandemic reminds us of our shared vulnerability and commonFund
of the International destiny.
for Let us “build back
better” by ensuring water and sanitation for all by 2030.
Agricultural Development
©UN-Water
XII
PROGRESS ON FRESHWATER ECOSYSTEMS 2Acknowledgements
This report was prepared by Marta Rica, FAO Consultant, with the close supervision of Riccardo
Biancalani and the collaboration of Michela Marinelli, Ghaieth Ben Hamouda and Lucie Chocholata of the
FAO Land and Water Division.
The authors are grateful for the valuable oversight, guidance and inputs to this report provided by other
FAO staff, including Sasha Koo-Oshima, Jippe Hoogeveen Virginie Gillet and Patricia Mejías Moreno.
They are also thankful for the inputs provided by the National Water and Sanitation Agency of Brazil.
The authors wish to acknowledge Maria Schade (UN-Water), Robert Argent (Bureau of Meteorology,
Australian Government), colleagues from the World Bank Water Global Practice on SDG 6 and Paul
Glennie (UNEP-DHI) for their valuable comments on the draft report and the overall support provided by
the Senior Programme Managers of UN-Water.
Financial support was provided by the Swiss Agency for Development and Corporation (SDC), the
Dutch Directorate-General for International Cooperation (DGIS), the Ministry of Foreign Affairs of The
Netherlands and the German Federal Ministry for Economic Cooperation and Development (BMZ)
through the Integrated Monitoring Initiative for SDG 6 (IMI-SDG6).
Further support has been supplied by the Government of Belgium and the Swedish International
Development Agency (SIDA) through the Multiparner Programme Support Mechanism of FAO.
This report was produced as part of a series of reports on SDG indicators 6.3.1, 6.3.2, 6.4.1, 6.4.2, 6.5.1,
6.5.2 and 6.6.1, coordinated by UN-Water through the Integrated Monitoring Initiative for SDG 6.
XIIIXIV
List of acronyms and abbreviations

             Agência Nacional de Águas e Saneamento Básico (National Water and Basic Sanitation
     ANA
             Agency of Brazil)

     EFR     Environmental flow requirements

     ERWR    External renewable water resources

     EVI     Economic Vulnerability Index

     FAO     Food and Agriculture Organization of the United Nations

     GEFIS   Global Environmental Flow Information System

     GHSL    Global Human Settlement Layer

     GNI     Gross national income

     GVA     Gross value added

     GW      Groundwater

     HAI     Human Assets Index

     IMI     Integrated Monitoring Initiative

     IRWR    Internal renewable water resources

     IUCN    International Union for Conservation of Nature

XV
IWMI International Water Management Institute
IWRM Integrated water resources management
JMP Joint Monitoring Programme
LDC Least Developed Countries
LEAP Livestock Environmental Assessment and Performance
LLDC Landlocked Least Developed Countries
MDG Millennium Development Goal
MIMEC Mining and quarrying, manufacturing, constructions and energy
NBS Nature Based Solutions
SDG Sustainable Development Goal
SIDS Small Island Developing States
SWOT Strengths, weaknesses, opportunities and threats
TFWW Total freshwater withdrawal
TRWR Total renewable freshwater resources
UNECE United Nations Economic Commission for Europe
VA Volume of freshwater withdrawal by the agricultural sector
VM Volume of freshwater withdrawal by the industrial sector
VS Volume of freshwater withdrawal by the service sector
XVIExecutive summary
This report presents an update of the latest in Figure 0.1. In 2018, three out of seven
consolidated data in the monitoring process of Sustainable Development Goal (SDG) regions
indicator 6.4.2, which provides an estimate of had water stress values above 25 percent,
the pressure exerted by all economic sectors on including two subregions with high water stress
a country's renewable freshwater resources. It (Central and Southern Asia) and one with critical
also considers environmental flow requirements water stress (Northern Africa). Western Asia has
since these are essential to maintaining medium water stress and Eastern Asia low water
ecosystem health and resilience. stress. The rest of the regions and subregions,
representing approximately 31 percent of the
At the global level, 18.4 percent of the total global population, remained at the “no stress”
renewable freshwater resources available were level, but when analysed at country- or major-
being withdrawn in 2018. Although this figure basin level, important differences arise in water
may seem safe, it hides large regional, national stress levels.
and subnational variations, as can be observed
Figure 0.1. Global map of the level of water stress by country (2018)
Source: FAO IMI-SDG6 adapted from FAO (2021a); UNmap. 2018.
XVIIFigure 0.2. Global map of the level of water stress by major basin, with
country boundaries (2018)
Source: FAO IMI-SDG6 adapted from FAO (2021a); UNmap. 2018.
This report showcases the efforts made by This indicator shows the extent to which water
FAO to disaggregate the indicator into different resources are already used and demonstrates
levels and dimensions such as major basins. the importance of effective supply- and
The result of the major basin disaggregation demand-management policies. It indicates
(Figure 0.2) is very much in-line with that of the the likelihood of increasing competition and
map of water stress at country level (Figure conflict between different water uses and users
0.1). However, the disaggregation by river basin in a situation of increasing water scarcity. On
shows that the basins affected by severe water average, 10 percent of the global population
stress are located not only in Northern Africa lives in countries with high or critical water
and the Near East, but also in Northern America, stress, which has a significant impact on
in Central and Southern Asia, and on the west water access and availability for personal
coast of Latin America, which is not so evident needs. Water is crucial to combat diseases
from the map of the indicator at country level. such as the recently discovered COVID-19, and
Indeed, countries that may appear safe can when it is under stress, it significantly affects
include much more stressed basins, in whole or economic activities, agricultural production,
in part, such as Chile and Peru, but also China, and subsequently, food security. Farmers may
Mexico and the United States of America. As experience increasing inequalities in their access
many of these basins are shared between two to water resources in a water stress situation.
or more countries, this also shows the need for Therefore not only sustainable but also inclusive
transboundary cooperation on water resources and integrated management and governance
management, as assessed by SDG of the different water sources needs to be
indicator 6.5.2. promoted.
XVIIIKey messages and
recommendations
• The two indicators included in the monitoring Disaggregating by water source (surface/
process of target 6.4 are complementary. groundwater) is also crucial to determine
Indicator 6.4.1 is an economic indicator, where the stress is located and consequently
assessing the extent to which a country’s to implement different mitigation strategies.
economic growth is dependent on the use
of water resources while indicator 6.4.2 • Water stress has multiple causes, ranging
is an environmental indicator, tracking from climate to demography to land use.
the physical availability of freshwater Integrated water resources management
resources and the impact of water use. (IWRM), assessed by SDG 6.5.1, can
support controlling and reducing water
• At the global level, 18.4 percent of total stress. This can include measures such
renewable freshwater resources available as reduced losses from water distribution
are being withdrawn by different economic systems, wastewater reuse (SDG target 6.3),
activities. However, this safe value at the desalination and appropriate water allocation.
global level hides the higher values and
the variability that exist at the regional, • Agriculture continues to be the most
national and subnational levels. demanding sector in terms of freshwater
withdrawals in most of the basins. It is the
• Aggregated values of water stress at dominant withdrawing sector in most of the
global, regional and country level can highly and critically water-stressed major
mask wide differences within the area basins, with some exceptions in basins
considered. Disaggregating the indicator with big or densely populated cities.
is of paramount importance to provide a
finer view of both the causes and effects • In addition to efficient water distribution
of water stress, supporting the policy systems and sustainable agriculture, reuse
choices of the relevant authorities. of wastewater is a key strategy in reducing
water stress, together with water-saving
• River basins should be considered the main technologies, green and hybrid technologies,
units for the spatial disaggregation of the and awareness campaigns to reduce the
indicator. Disaggregating the indicator at use of water in households and encourage
river basin level provides a clearer view sustainable diets and consumption.
of the relation between water withdrawal
and the availability of water resources.
XIX• Poor reporting is hindering the global models, as well as the use of remote sensing
value of the indicator. More efforts and techniques that can improve knowledge
resources should be dedicated to increasing on precipitation patterns, soil moisture
the countries’ capacity to collect, manage and groundwater changes, should be
and report water data. The opportunities explored further and promoted for and by
presented by including water supply, countries to improve monitoring capacity.
demand and allocation in Earth system
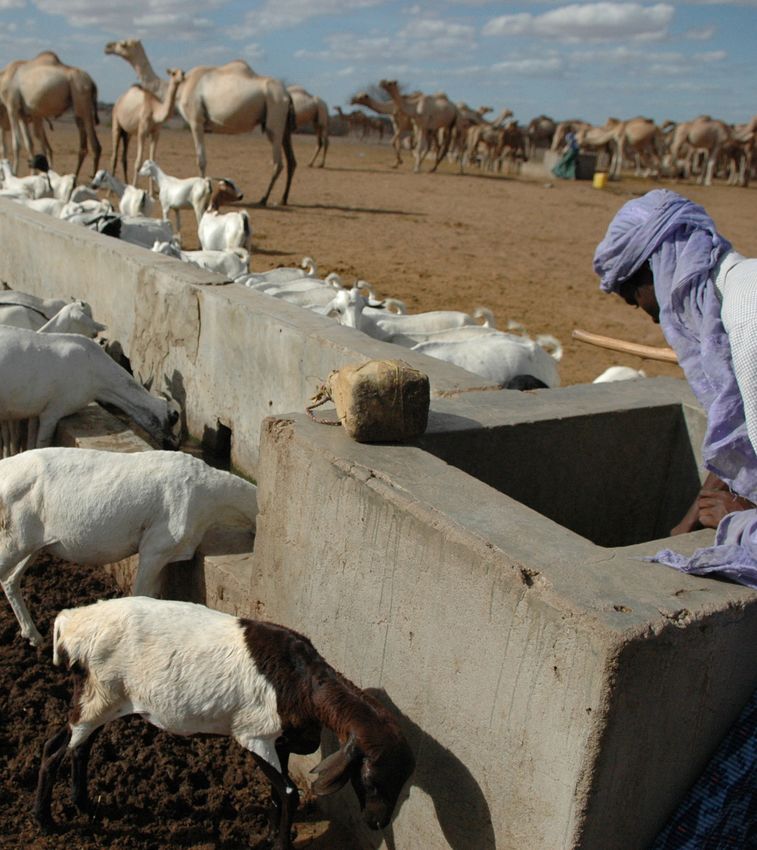
Livestock drinking from a waterpoint in the Garissa area, Kenya by Thomas Hug ©FAO
XXOn the other hand, extremely low water stress
values may indicate the inability of a country to
properly use its water resources for the benefit
of the population. In such cases, a moderate and
controlled increase in the value of the indicator
can be a sign of positive development.
Data collection for this indicator is carried out
through AQUASTAT, FAO’s global information
system on water resources and agricultural
water management, after countries have filled in
and submitted a questionnaire with national data
on water use (annex II. questionnaire template).
Ideally, countries should submit data on an
annual basis, but FAO will accept them updating
the water-use information every three years. The
process of data collection and analysis remains
a major challenge since not all countries report
on all the variables necessary to calculate the
indicator, and some countries are not reporting
with the required frequency for an insightful or
accurate monitoring.
Nevertheless, for this reporting process, data
from 180 countries were available for a period
from 2006/2008 until 2018. Data previous to
2015 were easily obtained from the AQUASTAT
database since similar variables were already
used for the Millennium Development Goal
(MDG) monitoring process. The environmental
flow requirements (EFR) values have been
obtained based on the Global Environmental
Flows Information System (GEFIS), elaborated
by the International Water Management
Institute (IWMI).
XXISouth East Asia farmers' field school by K. Pratt ©FAO
XXII1. Reporting water stress under the 2030 Agenda In September 2015, Heads of State from all Within the SDG monitoring framework, data around the world adopted the 2030 Agenda collection and reporting are based on country for Sustainable Development, consisting of data and national representatives are included 17 Sustainable Develop¬ment Goals (SDGs) in this process to ensure progress is made and with 169 targets. All SDGs are interlinked, accountability is strengthened. since transitioning towards more sustainable and resilient societies requires an integrated approach. The 2030 Agen¬da includes a goal on water and sanitation (SDG 6) that sets out to “ensure availability and sustainable management of water and sanitation for all” (United Nations General Assembly [UNGA], 2015). As a goal concerning the lifeblood of society and the planet, progress towards the eight SDG 6 targets (Box 1) has catalytic effects across the entire 2030 Agenda. Indicator 6.4.2, together with indicator 6.4.1, measures the achievement of target 6.4. Safe drinking water and sanitation are human rights. Access to these services, including water and soap for handwashing, is fundamental to human health and well-being. SDG 6, however, goes far beyond water and sanitation services to cover the entire water cycle. Apart from domestic purposes, water is needed across all sectors of society, to produce food, energy, goods and services, and to maintain healthy ecosystems that in turn protect life on Earth, and Lower Kagera River Basin, Burundi by Giulio as such it is framed in the goal targets (Box 1). Napolitano ©FAO 1 PROGRESS ON LEVEL OF WATER STRESS - 2021
Box 1. SDG 6 – Ensure availability and sustainable management of water and
   sanitation for all

   Targets

   6.1: By 2030, achieve universal and equitable access to safe and affordable drinking water for all.

   6.2: By 2030, achieve access to adequate and equitable sanitation and hygiene for all and end
   open defecation, paying special attention to the needs of women and girls and those in vulnerable
   situations.

   6.3: By 2030, improve water quality by reducing pollution, eliminating dumping and minimizing release
   of hazardous chemicals and materials, halving the proportion of untreated wastewater and substan-
   tially increasing recycling and safe reuse globally.

   6.4: By 2030, substantially increase water-use efficiency across all sectors and ensure sustainable
   withdrawals and supply of fresh water to address water scarcity and substantially reduce the number
   of people suffering from water scarcity.

   6.5: By 2030, implement integrated water resources management at all levels, including through trans-
   boundary cooperation as appropriate.

   6.6: By 2020, protect and restore water-related ecosystems, including mountains, forests, wetlands,
   rivers, aquifers and lakes.

   6.a: By 2030, expand international cooperation and capacity-building support to developing countries
   in water- and sanitation-related activities and programmes, including water harvesting, desalination,
   water efficiency, wastewater treatment, recycling and reuse technologies.

   6.b: Support and strengthen the participation of local communities in improving water and sanitation
   management.

As the total amount of water on Earth is fixed             than there are among others. Targets 6.3–6.6
and cannot be changed, all the water-related               are particularly strongly linked, since they all deal
SDG targets are interlinked. Nonetheless, it               with the quantity and quality of the water that we
is clear that there are closer and more direct             use for all human activity, water management,
connections between some of these targets                  and water’s status in nature.

                                                                      PROGRESS ON LEVEL OF WATER STRESS - 2021     2
It is important to note that when discussing of SDG indicator 6.4.2 is relatively similar to that
the interlinkages among these targets, these of the MDG indicator with the exception that it
linkages are said to exhibit a “circular pattern”, in explicitly takes EFR into consideration.
which all efforts to achieve one target may have
either a positive or negative impact on any of the The indicator shows the extent to which natural
other targets. A similar perspective can be taken freshwater resources are already used and
in the consideration of the indicators of those demonstrates the importance of effective
targets. To this end, these indicators could be supply- and demand-management policies. It
divided into two groups: indicates the likelihood of increasing competition
and conflict between different water uses and
• Informative indicators: 6.4.1; 6.4.2; 6.6.1 users in a situation of increasing water scarcity.
High water stress, determined by a high value
• Operational indicators: 6.3.2; 6.5.1; 6.5.2.
of the indicator, has potentially negative effects
on the sustainability of the natural resources
and of economic development. On the other
1.1. What is water stress and hand, low values of the indicator indicate that
why is it important? water does not represent a particular challenge
for economic development and sustainability.
The objective of this report is to document However, extremely low values may indicate the
the latest results available in the monitoring inability of a country to properly use its water
process for indicator 6.4.2, and to provide resources for the benefit of the population. In
recommendations to accelerate the achievement such cases, a moderate and controlled increase
of sustainable withdrawals and supply of fresh in the value of the indicator can be a sign of
water so fewer people suffer water scarcity positive development.
and ecosystems remain healthy. This indicator
measures the level of water stress by providing
an estimate of the pressure exerted by all 1.2. Setting the scene –
economic sectors on the country's renewable lessons learned for the
freshwater resources. It also considers
new reporting period and
environmental flow requirements (EFR) since
capacity-building initiatives
these are essential to maintaining ecosystem
health and resilience.
The Millennium Development Goals (MDGs) In 2018, FAO released the first report on the 6.4.2
framework already had a water stress indicator monitoring progress (FAO, 2018). This report
related to target 7.A, defined as “proportion focused on the methodology testing process for
of total water resources used”. Although the indicator 6.4.2, including EFR for the first time,
MDGs were only defined in 1999, these variables in five pilot countries (Jordan, The Netherlands,
were monitored by the Food and Agriculture Peru, Senegal and Uganda) and presented the
Organization of the United Nations (FAO) global baseline (2015–2018) for this indicator.
through its global information system on water The pilot exercise was an opportunity to further
resources, AQUASTAT, since 1994. The definition improve data collection and estimations in each
of the countries and to improve the way water
resources are managed.
3 PROGRESS ON LEVEL OF WATER STRESS - 2021Some of the main lessons learned from that These principles, criteria and guidelines were
report were as follows: prepared in collaboration with the custodian
agencies and were intended to provide guidance
• Monitoring a given indicator at the to all parties on their roles and responsibilities to
country level calls for the involvement ensure that data reporting for the 2030 Agenda
of various stakeholders and institutions. is as seamless as possible, acknowledging
Countries should appoint a lead institution that data requirements of the SDGs present
to coordinate these stakeholders. unprecedented challenges for both National
Statistical Systems and custodian agencies.
• There is a need for a framework for
data collection on global indicators to
After the 2015–2018 phase, two main steps were
provide guidance to Member States
undertaken in the data-collection process:
and custodian agencies alike.
1) All Member States received a
• There are several issues during the precompiled data-collection sheet,
data-collection process that should be which had to be revised or updated
resolved: data inconsistency among with new data and returned.
various sources; lack of EFR data; poor-
quality monitoring by country institutions; 2) A network of national correspondents
outdated data or reference years not was established to ensure that
specified; weak reporting to the AQUASTAT countries produce and submit regular
database; double counting of data. and consistent data to AQUASTAT.
• Interpretation of indicator 6.4.2 could be
further enhanced by conducting a deeper
analysis at the basin and regional levels.
Taking note of these concerns, and after
analysing a few case studies on the data-
collection process for some indicators, the
Inter-Agency and Expert Group on Sustainable
Development Goal Indicators (IAEG-SDGs)
elaborated on its Best Practices and
Recommendations in Global Data Reporting.1
1 See https://unstats.un.org/sdgs/iaeg-sdgs/data-flows/.
PROGRESS ON LEVEL OF WATER STRESS - 2021 4Box 2. Capacity-building resources available for country representatives to get
acquainted with the indicator 6.4.2 monitoring and reporting process
> SDG 6.4.2 web page: A public website that contains all the background information, training mate-
rials and updates on the monitoring and reporting process.
> SDG 6.4.2 metadata: A document providing definitions and methodological and data-collection
considerations.
> Step-by-step monitoring methodology for SDG 6.4.2: A document containing a detailed description
of all the information and steps needed to collect the data and compute the indicator.
> SDG 6.4.2 e-learning course: An online course providing tools, methods and processes to support
countries in monitoring and reporting on the indicator. It also explores interlinkages with other
SDG targets. Available in English, French, Spanish and Russian.
> Regional on-site and online training courses on sustainable water use – SDG 6.4 indica-
tors: During 2020 and 2021, FAO organized four virtual trainings for Asia, Latin America and the
Caribbean, and Africa on SDG 6.4, and before COVID-19 emerged, between 2017 and 2019, another
six regional workshops were organized.
Note: For the e-learning course, see https://elearning.fao.org/course/view.php?id=365 (English);
https://elearning.fao.org/course/view.php?id=519 (French);
https://elearning.fao.org/course/view.php?id=588 (Russian) and
https://elearning.fao.org/course/view.php?id=518 (Spanish).
The Integrated Monitoring Initiative for SDG 6, 2 collection and reporting. In its endeavour to
coordinated by UN-Water and including FAO build national ownership, FAO has developed
along with other United Nations agencies, has differentresources and facilitated several
the current objective of supporting countries workshops on the data-collection methodologies
to increase their technical and institutional for indicators 6.4.1 and 6.4.2 (Box 2).
capacity for the monitoring of the indicators
related to SDG 6 targets, together with data
2 UN-Water Integrated Monitoring Initiative for SDG 6 (IMI-SDG6) brings together the United Nations organizations that are formally
mandated to compile country data on the SDG 6 global indicators, and builds on ongoing efforts such as the World Health Organization/
United Nations Children’s Fund (WHO/UNICEF) Joint Monitoring Programme for Water Supply, Sanitation and Hygiene (JMP), the Global
Environment Monitoring System for Freshwater (GEMS/Water), FAO’s global information system on water and agriculture (AQUASTAT)
and the UN-Water Global Analysis and Assessment of Sanitation and Drinking-Water (GLAAS). See https://www.sdg6monitoring.org/.
5 PROGRESS ON LEVEL OF WATER STRESS - 2021Tigray, Ethiopia by Petterik Wiggers ©FAOIFADWFP
PROGRESS ON LEVEL OF WATER STRESS - 2021 62. How to monitor water stress
2.1. Globally available data – to ensure the quality and consistency of these
from country-led collection data. This process includes a constant dialogue
with national correspondents (Box 3).
to the AQUASTAT database
Data for this indicator are usually collected
by national ministries and institutions that
have water-related issues as part of their
mandate, such as national statistical offices
and ministries of water resources, agriculture
or environment. The data collected is then
shared with AQUASTAT, FAO's global information
system on water and agriculture. AQUASTAT’s
data-collection method has evolved since 2018
to align with the principles of data-gathering
promoted through the SDGs, to follow country-
led (and the countries’ own) processes.
In this regard, AQUASTAT has established a
network of national correspondents to improve
country participation and the ownership of data.
Every year, AQUASTAT sends a questionnaire
(see annex II. questionnaire template) to a
network of national correspondents which
includes the variables needed for the calculation
of SDG 6.4.2. National correspondents have
the key role of ensuring data quality and the
coordination of data collection at country level.
Having national coordination in place will assure
the timely and consistent collection of the data
on a regular basis. Once countries submit the
data, there is a validation process by AQUASTAT Sanaa, Yemen by Soliman Ahmed ©FAO
7 PROGRESS ON LEVEL OF WATER STRESS - 2021Box 3. Steps in the AQUASTAT
As previously mentioned, the total freshwater
data-validation process
withdrawals (TFWW) and total renewable
freshwater resources (TRWR) variables have
1. The AQUASTAT questionnaire embeds been monitored by AQUASTAT since 1994. Data
automatic validation rules to allow
from years earlier than 2015 were therefore
national correspondents to identify any
easily obtained from the AQUASTAT database
data consistency errors while compiling
since similar variables were already used for
the data.
the MDG monitoring process. To compute EFR
values, FAO makes use of the guidelines based
2. FAO thoroughly reviews the information
on the Global Environmental Flow Information
reported in the questionnaire responses
System (GEFIS), 3 providing a minimum standard
using the following tools:
method (FAO, 2019). Countries that have more
comprehensive and accurate EFR data make use
c. a manual cross-variable check,
of those data and can also add additional details
which includes cross-comparison
to their voluntary national report. Countries
with similar countries, as well as
compile their different variables’ values in the
historic data for the countries
questionnaire, which is then sent back to FAO
so that it can calculate the regional and global
d. time-series coherence by running
aggregates.
an R-script to compare reported
data with those corresponding to
previous years
2.1.1. Treatment of missing values
at country and regional level
e. verification of the metadata,
particularly the source of the
There are three types of imputations that are
proposed data – the critical
made at country level to fill in missing years in
analysis of the compiled data gives
preference to national sources the time series:
and expert knowledge.
• Linear imputation: Between
two available data points.
6. Exchanges between the national corre
spondents and FAO take place to corect • Carry forward: After the last available
and confirm the collected data. data points and up to 10 years.
7. An automated validation routine is • Vertical imputation: Where TFWW is
carried out, included in the Statistical available but without disaggregation by
Working System, which uses almost 200 sources. If disaggregated data existed
validation rules. for previous years, the respective ratio by
sources is applied to the available total.
Source: FAO (2021b).
3 See http://eflows.iwmi.org.
PROGRESS ON LEVEL OF WATER STRESS - 2021 8• TRWR are expressed as the sum of (a)
Thanks to the imputation methods at country
internal renewable water resources (IRWR)
level, data are available at regional and global
and (b) external renewable water resources
levels for the whole time series (unless the
(ERWR). The term “water resources” is
latest official value was obtained more than 10
understood here as freshwater resources.
years ago). Imputed data is displayed with an
appropriate qualifier in AQUASTAT. a. “IRWR” refers to the long-term average
annual flow of rivers and recharge of
groundwater for a given country gener-
2.1.2. Regional aggregations ated from endogenous precipitation.
b. “ERWR” refer to the flows of water
Regional and global estimates are made by
entering the country, taking into consid-
adding up the national figures on TFWW and
eration the quantity of flows reserved
TRWR, considering only the internal renewable
to upstream and downstream coun-
water resources of each country to avoid double
tries through agreements or treaties.
counting, and the external renewable freshwater
resources of the region as a whole, if any. Where
• “TFWW” refers to the volume of fresh
there is a case of regional aggregation without
water extracted from its source (rivers,
physical continuity (such as income groupings
lakes, aquifers) for agriculture, industries
or Least Developed Country groups), TRWR
and services. It is estimated at the country
are summed up. The EFR at regional level is
level for the agriculture, services (including
estimated as the average of the countries’ EFRs,
domestic water withdrawals) and industries
in a percentage, and applied to the regional
(including cooling of thermoelectric plants)
water resources.
sectors, as these are the main sectors.
2.2. Calculation methodology “Freshwater withdrawal” includes fossil
groundwater. It does not include direct use of
Indicator 6.4.2 has been defined as the ratio non-conventional water, i.e. direct use of treated
between total fresh water withdrawn (TFWW) wastewater, or direct use of agricultural drainage
by all major sectors and total renewable water and use of desalinated water. TFWW is
freshwater resources (TRWR), after considering generally the sum of total water withdrawal by
the environmental flow requirements (EFR). It is sector minus the direct use of wastewater, direct
calculated using the following formula: use of agricultural drainage water and use of
desalinated water.
• “EFR” refers to the quantity and timing
of freshwater flows and levels necessary
The indicator is computed as the TFWW to sustain aquatic ecosystems which, in
divided by the difference between the TRWR turn, support human cultures, economies,
and the EFR, multiplied by 100. All variables are sustainable livelihoods and well-being.
expressed in km3/year (109 m3/year). Water quality and the resulting ecosystem
services are excluded from this formulation
which is confined to water volumes. This
does not imply that water quality and the
9 PROGRESS ON LEVEL OF WATER STRESS - 2021support to societies which are dependent
2.3. Threshold levels
on environmental flows are not important
and should not be taken care of. They are
Identifying a common threshold level of water
indeed taken into account by other targets
stress, generally valid across the world, is
and indicators, such as 6.3.2, 6.5.1 and
a difficult and potentially futile exercise. In
6.6.1. Methods of computation of EFR are
fact, both logic and experience show that arid
extremely variable and range from global
countries tend to have higher levels of water
estimates to comprehensive assessments
stress. At the same time, countries with low
for river reaches. For the purpose of the SDG
levels of water stress but with low levels of water
indicator, water volumes can be expressed
distribution may need to increase the use of their
in the same units as the TFWW, and then as
freshwater resources in a sustainable manner
percentages of the available water resources.
that would imply an increase in their water stress
value. These considerations brought to light
FAO is required to periodically collect global the apparent need to identify a convergent path
data on SDG 6.4.2 and to report this to the to a water stress threshold in a way in which
IAEG-SDGs. To do this, FAO makes use of global countries with high water stress would
data sets on renewable water resources, water be encouraged to decrease their level,
withdrawals and EFR. This data is summarized while low-stress countries would increase it.
per country and for major river basins and sent The ideal convergence level was set at
by FAO to each country. Countries contribute about 20–25 percent. However, ultimately, the
to this global report by endorsing the global convergence approach was discarded, as it was
data for that country. Each country receives cumbersome, difficult to read and unsuitable for
the EFR data from FAO and has the opportunity many countries.
to comment on its accuracy using a template
provided by FAO. Where a country proposes Following the experience of the initial five
corrections to the data set, these should be years of application of the indicator, a more
based on data that are at a greater level of conventional approach was taken to categorize
confidence than those that were used for the the water stress levels, consistent with the
global data set. Since the advent of the EFR solution adopted during the MDG programme.
concept, many methods have been developed A threshold of 25 percent has been identified
for its estimation. For SDG reporting, at the as the upper limit for the full and unconditional
global reporting level, desktop approaches safety of water stress as assessed by indicator
using global data sets are most appropriate, 6.4.2. This means that on the one hand, values
although the option remains for individual below 25 percent can be considered safe in
countries to undertake assessments at a higher any instance (no stress), whereas on the other,
level of confidence and report these. Within values above 25 percent should be regarded as
this framework, FAO published guidelines that potentially and increasingly problematic and
provide a minimum standard method, principally should be qualified and/or reduced. Water-stress
based on the GEFIS. This is the approach used
4
values above 25 percent are categorized into
to generate the country environmental flow data four different levels of stress severity:
for this 6.4.2 report. 5
4 See http://eflows.iwmi.org.
5 To consult the guidelines, see http://www.fao.org/3/CA3097EN/ca3097en.pdf.
PROGRESS ON LEVEL OF WATER STRESS - 2021 10You can also read