European SDG Voluntary Local Reviews - A comparative analysis of local indicators and data - Stadt-Land-Plus
←
→
Page content transcription
If your browser does not render page correctly, please read the page content below

European SDG Voluntary Local Reviews

                      A comparative analysis of
                      local indicators and data

                      Andrea Ciambra

                      Alice Siragusa and Paola Proietti (eds.)

                      2021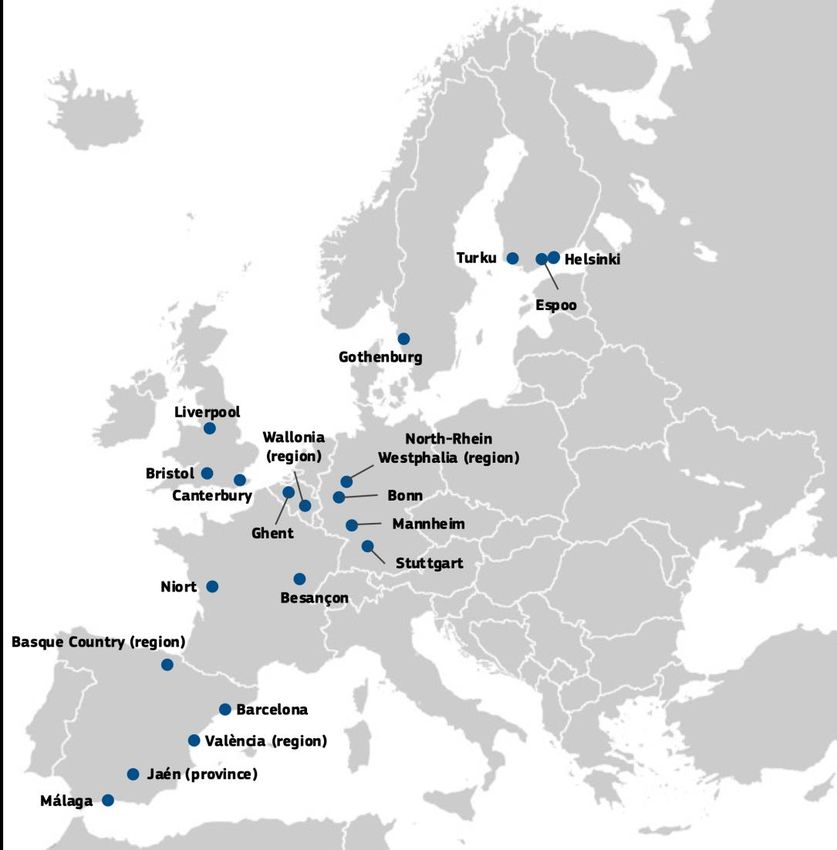
This p ublication is a re port by the Joint Research Ce ntre (JRC), the European Commission’s science and knowledge service. It aims to
p rovide e vidence-based scientific support to the European p olicymaking p rocess. The scie ntific outp ut exp ressed does not imp ly a policy
p osition of the European Commission. Neither the European Commission nor any p erson acting on behalf of the Commission is
re sp onsible for the use that might be made of this publication. For information on the me thodology and quality underlying the data used
in this p ublication for which the source is neither Eurostat nor other Commission service s, users should contact the re ferenced source. The
de signations employed and the p resentation of material on the maps do not imp ly the exp ression of any opinion whatsoever on the p art
of the European Union concerning the le gal status of any country, territory, city or are a or of its authoritie s, or concernin g the delimitation
of its frontie rs or boundaries.

Contact information
Name : Alice Siragusa
Addre ss: Edificio EXPO, c/ Inca Garcillaso 3 41092 Seville , Spain
Email: alice .siragusa@ec.europa.eu
Te l.: +34 95 44 89017

EU Science Hub
http s://ec.europa.eu/jrc

JRC124580

   PDF           ISBN 978-92-76-32321-1                                            doi:10.2760/9692

Luxe mbourg: Publications Office of the European Union, 2021

© Europ ean Union, 2021

The re use p olicy of the European Commission is imp le mented by the Commission Decision 2011/833/EU of 12 December 2011 on the
re use of Commission documents (OJ L 330, 14.12.2011, p . 39). Exce pt otherwise noted, the re use of this document is authorised under
the Cre ative Commons Attribution 4.0 International (CC BY 4.0) lice nce (http s://cre ativecommons.org/licenses/by/4.0/). This me ans that
re use is allowed p rovided appropriate cre dit is give n and any changes are indicated. For any use or re production of photos or other
mate rial that is not owned by the EU, permission must be sought directly from the copyright holders.

All conte nt © European Union, 2021
Cove r image: Laura Spirito

How to cite this re p ort: Ciambra, A., European SDG Voluntary Local Reviews: A comp arative analysis of local indicators and data,
Siragusa, A. and Proie tti, P. e ditor(s), Publications Office of the Europ e an Union, Luxe mbourg, 2021, ISBN 978 -92-76-32321-1,
doi:10.2760/9692, JRC124580.
Contents

Acknowledgements..................................................................................................................................................................................................................................... 4
Abstract................................................................................................................................................................................................................................................................. 5
Executive Summary....................................................................................................................................................................................................................................6
1 Introduction............................................................................................................................................................................................................................................... 7
        1.1 Focus and structure of this study............................................................................................................................................................................ 7
        1.2 Methodology...............................................................................................................................................................................................................................8
2 Local SDG monitoring and reporting in Europe........................................................................................................................................................9
        2.1 Europe’s institutional frameworks and ‘enabling environment’...................................................................................................9
        2.2 Early, strategic and regional: the first SDG local reviews in Europe ..................................................................................... 11
        2.3 What is inside a VLR? Strategy, policy and data ..................................................................................................................................... 12
3 European VLRs and SDG indicators .................................................................................................................................................................................13
        3.1 European VLRs: figures and basic trends ...................................................................................................................................................... 14
                3.1.1                The Spanish cluster......................................................................................................................................................................................... 15
                3.1.2                The Finnish cluster...........................................................................................................................................................................................16
                3.1.3                The German cluster.........................................................................................................................................................................................16
                3.1.4                Clusters of VLRs and the role of institutional context: a few takeaways.......................................................16
        3.2 Distribution, use and type of indicators in European VLRs............................................................................................................ 17
4 Indicator design and definition in European VLRs ..............................................................................................................................................19
        4.1 The role of ‘third-party’ knowledge brokers and VLR indicators............................................................................................... 21
                4.1.1                The Bertelsmann Foundation and the German monitoring 'ecosystem’ ......................................................... 21
                4.1.2                Relevant German cities’ case-studies for indicator design: Mannheim, Stuttgart, Bonn.................. 22
                4.1.3                The UN-SDSN ‘ecosystem’ and its impact in Spain: the case of Málaga........................................................23
        4.2 Indicator design in evolving approaches to SDG monitoring: the cases of Barcelona and Bristol............. 24
                4.2.1                Bristol’s definition of indicator toolkits..........................................................................................................................................26
        4.3 Alignment of existing strategic frameworks with the SDGs.........................................................................................................28
                4.3.1                Barcelona: the VLR as patchwork of existing (and effective) assessment tools .....................................28
                4.3.2                A paradigm of systematic local-data collection: the case of Jaén ......................................................................28
                4.3.3                Local sustainability strategies as methodological legacy: the cases of Turku and Bonn................29
5 Data collection and management in European VLRs.......................................................................................................................................31
        5.1 Locally collected and available data..................................................................................................................................................................34
                5.1.1                Barcelona..................................................................................................................................................................................................................34
                5.1.2                Stuttgart....................................................................................................................................................................................................................34
        5.2 National and regional data in VLRs ................................................................................................................................................................... 36
                5.2.1                The example of the Finnish municipalities................................................................................................................................ 36
                5.2.2                Looking for data across all governance levels: the examples of Jaén and Bristol................................37
        5.3 Open data and source accessibility: a few good practices ........................................................................................................... 39
                5.3.1                The province of Jaén ..................................................................................................................................................................................... 39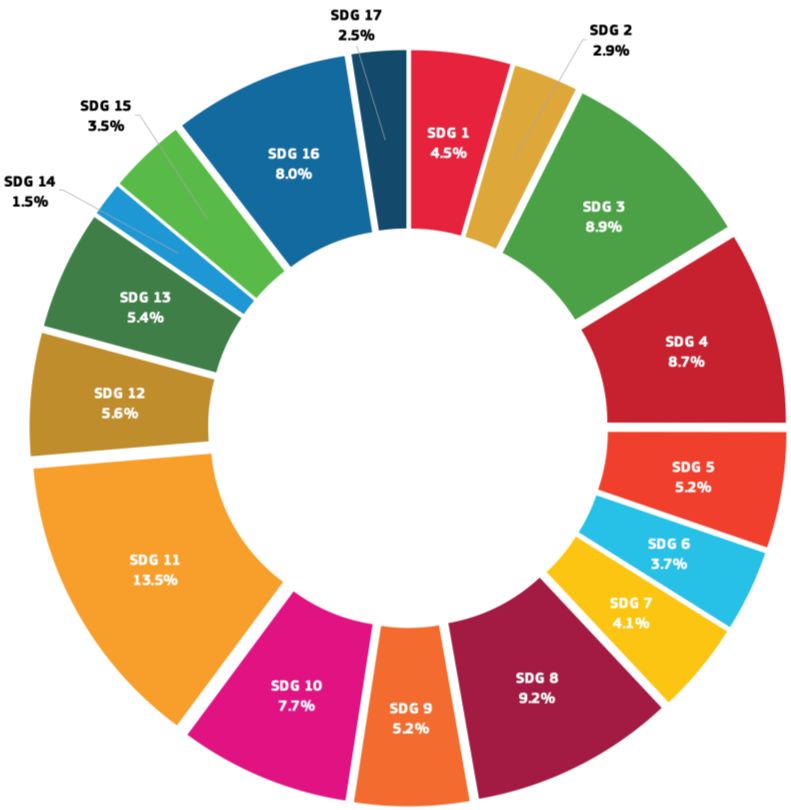
5.3.2 Bristol.......................................................................................................................................................................................................................... 39
5.3.3 Northern Europe: Gothenburg and Turku .................................................................................................................................... 39
5.4 Visualisation, communication and lessons learnt: the ‘in-a-glimpse’ approach to SDG measurements
41
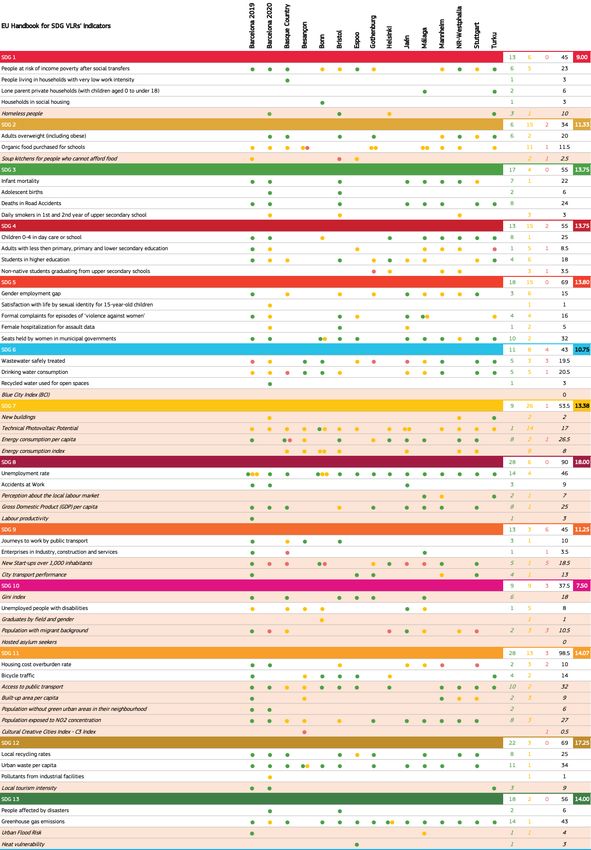
6 Bridging the gap: city indicators and the European Handbook ............................................................................................................... 42
6.1 The VLRs of European cities and how they relate to the Handbook..................................................................................... 45
6.1.1 ‘Pure’ proximity: the data on indicator comparability....................................................................................................... 45
6.1.2 Relative proximity: how much do compatible indicators weigh on the total?.............................................46
6.2 Analysis by SDG: how to approach the Handbook’s indicator set? .........................................................................................48
6.2.1 What SDGs elicited the highest proximity? And the lowest? ......................................................................................48
6.2.2 How to improve coherence between Handbook and VLR indicators?.................................................................49
Conclusions .....................................................................................................................................................................................................................................................50
References....................................................................................................................................................................................................................................................... 52
List of abbreviations and definitions....................................................................................................................................................................................... 54
List of figures ............................................................................................................................................................................................................................................... 55
List of tables..................................................................................................................................................................................................................................................56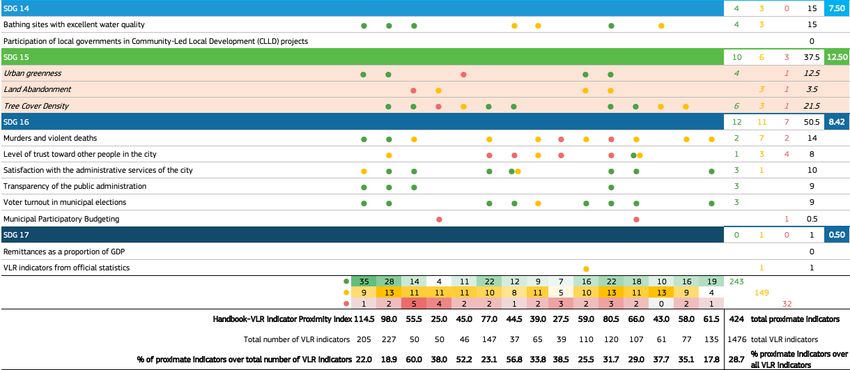
Acknowledgements
The following local government officers, representatives and researchers agreed to meet or talk with the author
to discuss the themes and contents of parts of this report:
Inmaculada Herrador Lindes, Head of the Technical Office, “Estrategias para el desarrollo
económico y social de la provincia de Jaén” Foundation, Jaén
Christian Hübel, Head of the Democracy and Strategy Department, City of Mannheim
Allan Macleod, Bristol City Office and Cabot Institute, University of Bristol, SDG Research and
Engagement Coordinator
Jutta Mäkinen, Communications Coordinator, City of Turku
Verena Schwarte, Department of International Affairs and Global Sustainability, City of Bonn
The authors would also like to thank Mark Boden, Giulia Testori and Alessandro Rainoldi, for their comments
and suggestions.
Authors
Andrea Ciambra, European Commission expert, Laboratory of Cartographic Engineering, University of A
Coruña, leading author.
Alice Siragusa and Paola Proietti, Joint Research Centre, Territorial Development Unit, editors.
4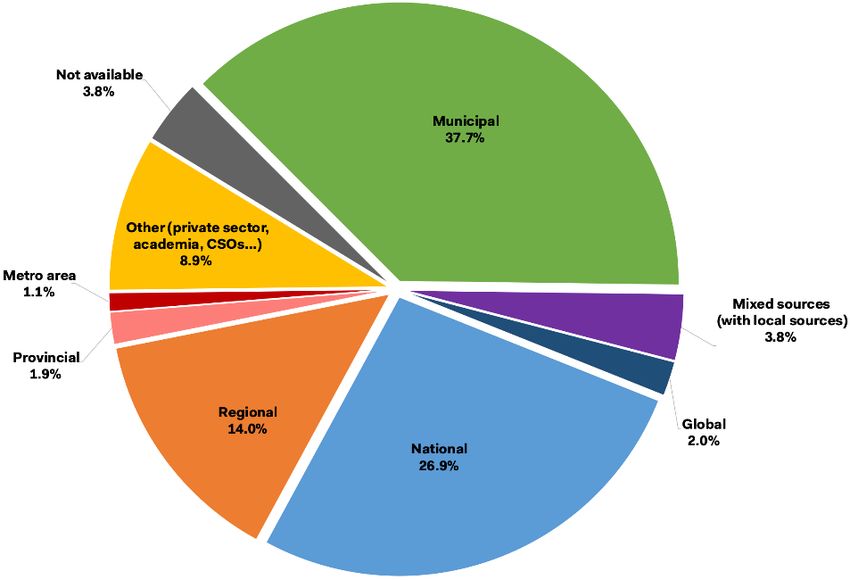
Abstract
This report explores the use of local indicators by European Voluntary Local Reviews on the achievement of the
Sustainable Development Goals between 2016 and early 2021. This report has been prepared by a European
Commission external expert in the framework of the URBAN 2030 project developed by the Joint Research
Centre to support local governments in monitoring the achievement of the 2030 Agenda for Sustainable
Development and its SDGs at local level — in particular by promoting transformative and inclusive action for
their localisation.

                                                      5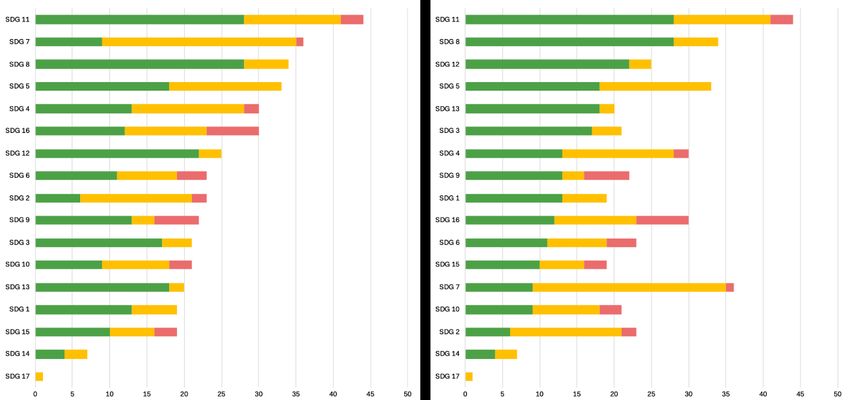
Executive Summary
This report contributes to the growing debate on the value, form and technical aspects of the Voluntary Local
Reviews (VLRs) that are increasingly used by sub-national governments to assess the process of
implementation and achievement of the Sustainable Development Goals (SDGs). The report focuses, in
particular, on the VLRs produced by European cities and regions between 2016 and early 2021.
On September 25, 2015, United Nations member states adopted a set of goals to end poverty, protect the
planet and ensure prosperity for all as part of a new sustainable development agenda. The Sustainable
Development Goals aim, among other things, to fight poverty and hunger everywhere; combat inequalities
within and among countries; build peaceful, just and inclusive societies; protect human rights and promote
gender equality and the empowerment of women and girls; and ensure the lasting protection of the planet and
its natural resources.
The SDGs promote an integrated approach to development built on five pillars: People, Planet, Prosperity, Peace,
and Partnerships. The European Commission aims to fully inte grate the SDGs into the European policy
framework and, as demonstrated by several recent actions, it considers the SDGs as a holistic guide to be
incorporated into the Commission’s strategic vision and commitment. The SDGs are thus directly linked not only
to “A stronger Europe in the World”, but also to all European Commission’s priorities.
Recent research has demonstrated that the SDGs cannot be achieved without the full integration of different
levels of government in the process of implementation, monitoring and evaluation. Not unlike the Millennium
Development Goals which were the global development policy framework before them, the SDGs also rely on
the potential of local governments to engage with communities, mobilise resources and localise strategies
based on place-based potentials and challenges.
Over the last five years, local governments (cities, provinces, and regions) have been producing reviews on both
the initiatives they put into practice and the achievements they have made thanks to the implementation of
the SDGs. This was made possible by adapting a framework that was originally designed by the United Nations
to be more of an intergovernmental effort. These reviews, albeit based on diverse sets of local indicators,
proved to be powerful tools to engage with local governments, institutions, and communities for the localisation
of the SDGs.
Despite their potential impact on the institutional and statistical capacity of local administrations, appropriate
knowledge and technical guidance are required to support the preparation of these voluntary reports.
Accordingly, the European Commission’s Joint Research Centre (JRC) has published the first edition of the
‘European Handbook for SDG Voluntary Local Reviews’ in 2020. The Goal of the Handbook was bring support
to European cities willing to prepare their VLRs. This was achieved providing a framework to inspire the selection
of appropriate indicators, making reviews both comparable across Europe and targeting local situations and
challenges.
This report analyses the different sources and types of indicators used by European local governments to
measure performance in the implementation and achievement of the SDGs. It provides insights into the
different methods and approaches adopted by local governments in different European countries, identifying
some good practices (such the cases of Spain, Finland and Germany) and shedding light on a potential common
way forward.
This report thus contributes to the ongoing debate among researchers and policy makers on the most effective
strategy to capitalise on these front-running experiences and scale up the impact of SDG localisation.
This report aims at understanding how the local approach to SDG indicators and monitoring has changed
through time, as well as providing local and regional governments and local government associations with
solid, robust and replicable analyses of all the options available for local SDG monitoring and review. It also
shows how European VLRs have managed the processes of indicator definition and selection, as well as the
sourcing of relevant data for the measurement of their indicators. It reviews the state of the art of the different
frameworks of indicators and data in European VLRs in relation to the set proposed in the first Handbook.
Together with this report, the European Commission’s Joint Research Centre (JRC) plans to release an analysis
of multi-level governance in SDG localisation and a report on regional indicators for the Sustainable
Development Goals. Moreover, the JRC has been working since October 2020 with a group of European cities
to validate the proposed methodology: Bratislava, Oulu, Porto, Reggio Emilia, Seville, Valencia, Turku and
Helsinki. Knowledge and insight from these works will feed the second edition of the European Handbook, which
is planned for publication in 2022. This edition of the European Handbook will include an update of the state
of the art on local reviews, a consolidated guidance indicator set and policy recommendations on viable
strategies for the future.

                                                        6
1 Introduction
1.1 Focus and structure of this study
This report explores the use of indicators and data in the Voluntary Local Reviews (VLRs) of the Sustainable
Development Goals (SDGs) published to date by European local governments. It aims, in particular, to study
how European VLRs have managed the processes of indicator definition and selection, as well as the sourcing
of relevant data for the compilation of their indicators.
This report is part of a series of research contributions on European VLRs, coordinated by the European
Commission’s Joint Research Centre (JRC) as a follow-up to the publication of the European Handbook on SDG
Voluntary Local Reviews (hereinafter, also ‘European Handbook’), which the JRC published in 2020 to “provide
support to European cities willing to prepare” their VLRs. This report reviews the state of the art of indicator
design and use in European VLRs. It also analyses the relation to the indicator set the Handbook developed in
order to — among other purposes — “be a guide for the selection of appropriate indicators […] for local
situations and challenges” (Siragusa et al., 2020).
Three basic research questions guided the drafting of this report:
rq1. How do European VLRs’ indicators and data relate to the SDGs as an analytical framework and
to specific SDGs in particular?
rq2. How do European VLRs define their indicators and what data sources are used to compile them?
Are these sources local or are they adapted from different levels of government/analysis?
rq3. How do the European VLRs’ indicators relate to the indicators selected by the European Handbook
on SDG Voluntary Local Reviews?
In order to comprehensively address these questions, this report is structured as follows. Chapter 2 provides
an overview of the current state of the art of local reviewing of SDG localisation, globally and with a specific
focus on Europe and the relevance of data and indicators. Chapter 3 analyses the European VLRs more in depth,
as well as the emergence of ‘clusters’ of VLRs around specific national approaches to the 2030 Agenda and
the relationship between the VLRs and the SDGs. Chapter 4 explores the definition, selection and identification
of the indicators used in the VLRs, focusing on whether these metrics were adapted from different tiers of
governance, strategic frameworks and methodologies, or if they were originally designed at the local level.
Chapter 5 ‘completes’ this information by studying the data with which these indicators are measured: sourcing,
disaggregation, open-access availability, and the impact of data and indicators in communicating and raising
awareness on SDG localisation. Chapter 6, finally, studies the relationship between the VLR indicators and data
and the indicator set proposed by the European Handbook. Chapter 6 also defines an index of ‘indicator
proximity’ across the different VLRs, an attempt to operationalise the proximity between VLR indicators and
those selected in the European Handbook. In the light of the experience and practices of European cities, their
reviews, and emerging issues and priorities, the chapter also suggests a few additional research questions and
outstanding issues to guide the process of updating, revising or re-framing the Handbook’s sets of indicators.
71.2 Methodology
This study analyses the VLRs published by European cities as of February 28, 2021. Up to this date, and to the
best of the editorial team’s knowledge, 22 VLRs from 20 different European local governments were available.
All available VLRs were analysed in order to assess whether they:
had any relevant treatment of data and/or indicators;
featured any kind of statistical annex and/or indicator metadata;
assessed (semi-)quantitatively the implementation of all the SDGs or only some of them;
explained the origin or definition process of selected indicators; and the source of the data that was
used to compile such indicators; the degree of disaggregation; and the availability of data on open-
access or otherwise openly-available datasets, platforms or other aggregators of statistical
information.
Information collected via desk research on the VLR documents, secondary sources and literature reviews was
also integrated with primary information collected via five interviews with representatives from the local
administrations or the consulting teams in charge of the local VLR process (the municipalities of Bonn, Bristol,
Mannheim, and Turku, and the province of Jaén).
82 Local SDG monitoring and reporting in Europe
Since the onset of the ‘SDG era’, Europe has been a relevant case-study and a launch pad for the analysis of
monitoring and reporting on the implementation of the 2030 Agenda — as it has been a key laboratory for the
study of SDG localisation and the emergence of Voluntary Local Reviews (VLRs). Europe has historically been
characterised by a strong commitment to sustainable development frameworks and policies, even though with
relevant differences from one country to another. The approach that European countries have shown towards
the monitoring of SDG implementation has by and large built on the inclusion of municipalities and sub-national
governments. This has established a positive and diffused ‘enabling environment’ where VLRs can thrive. The
outcome is apparent when studying how SDG local reporting has evolved in the Europe.
2.1 Europe’s institutional frameworks and ‘enabling environment’
Every year since 2017, United Cities and Local Governments (UCLG) has studied the degree of engagement of
sub-governments in the process of production of Voluntary National Reviews (VNRs). Municipalities and sub-
national governments have been involved in at least 68% of the European VNRs published between 2016 and
2020: sub-national governments had “mid-high” participation in the VNR process in 22 reviews out of 47 (UCLG
& Global Taskforce of Local and Regional Governments, 2020, p. 34).1
The European context, in other words, has provided municipalities with several institutionalised opportunities
to familiarise themselves with the SDGs and has been an effective background for the mainstreaming of the
SDGs into local policy. Ultimately, it is not surprising that — to date — over one third of all published VLRs and
other relevant reviewing documents (22 out of 63, or 34.9%)2 has been produced by European cities, provinces
and regions. Besides the argument of political culture in the European context being generally more prone to
considering sustainable development as a driver of policy innovation and adaptation, there are also further
elements worth exploring as to why VLRs have thrived more visibly in Europe than in other world areas.
On the one hand, European cities have traditionally been more open to horizontal cooperation with peers,
favouring the establishment of transversal alliances and what the multi-level governance literature has defined
as ‘transnational municipal networks’. Large institutional experiments are a testament to the tendency of
European municipalities to seek institutional venues and resources to work together on shared solutions to
common challenges3 — a trend that the establishment of the common market and the EU’s cohesion policy
have only strengthened. Some examples are: the European section of the Global Covenant of Mayors for
Climate and Energy (established in 2008 by the European Commission and relying today on a membership of
over 10,400 municipalities across the continent), or historically trailblazing actors such as the Council of
European Municipalities and Regions (CEMR-CCRE), established in 1951, or Eurocities, created in 1986.
European institutions organise global fora and events — such as the European Week of Regions and Cities 4 and
the CITIES Forum 5 — that have become key drivers of dialogue and innovation on localisation and urban
development for all levels of government.
Similarly, the emergence throughout Europe of strong and proactive national and regional associations of local
governments has provided municipalities with a knowledge hub in which local governments can share
experiences, practices and goals, mutually train and learn, as well as be represented at a scale and with an
impact that they would not otherwise be able to attain alone.
European cities have also been vertically active at the global level and invested in the organisation of municipal
interest in worldwide venues and with global interlocutors and partners. They have been able to take advantage
of the institutional space that several international actors and organisations have created to bring certain
agendas — including climate, sustainable development and urban habitat — forward.
1
The data are the re sult of the work carrie d out by UCLG both through the analysis of VNRs submitted to the United Nations Hig h-
Le ve l Political Forum since 2016 and the re sponses to yearly surveys that the organisation circulates to its membership (national
local gove rnment associations in over 140 countries) prior to e ach year’s HLPF. For a comp rehensive overview of the work of U CLG
on VNRs and local p articip ation, see: http s://gold.uclg.org/re port/localizing -sdgs-boost-monitoring-reporting.
2
The se figures re fer to the VLRs available when the e diting of this re search was concluded, in March 2021.
3
Se e more generally on these concepts and their re levance to the Europea n context Kern and Bulke ley, ‘Citie s, Europeanization and
Multi-Le vel Gove rnance: Gove rning Climate Change through Transnational Municip al Ne tworks’. On the re le vance of these
arrangements in climate governance and sustainable development — as well as for a more rece nt overview — Bansard, Pattberg, and
Wide rbe rg, ‘Citie s to the Rescue? Assessing the Performance of Transnational Municip al Networks in Global Climate Governance’.
4
More information available online: h ttp ://Europa.eu/regions-and-citie s/.
5
More information on the late st se ssion of the Forum available online:
http ://e c.europa.eu/re gional_p olicy/en/conferences/citie s_forum_pt/.
9The CEMR-CCRE evolved into the European branch of UCLG, a global network of sub-national authorities and
national local government associations (LGAs) that vows to represent urban and territorial interest in global
policy-making. UCLG and CEMR-CCRE have supported European cities in the definition of local sustainable
development planning and strategies; brought local delegations to such fora as Habitat III, the High-Level
Political forum for Sustainable Development (HLPF), the World Urban Forum facilitated peer-to-peer training
on the 2030 Agenda and the SDGs; shared knowledge and experience for SDG implementation and facilitated
the work on early VLRs as well as ‘sub-national’ reviews coordinated by LGAs.
The OECD set up its ambitious Programme on a Territorial Approach to the SDGs (OECD, 2020) to help sub-
national governments include and mainstream the Goals in local policy-making: case-studies include 11 local
governments worldwide, while over 600 municipalities and other sub-national authorities are profiled in its
data-based SDG implementation measurement tool. C40, ICLEI – Local Governments for Sustainability,
Regions4, and several other global networks of local governments have committed explicitly to the achievement
of the SDGs and are providing cities and local stakeholders with the resources, the connections and the technical
and political opportunities to rise as key players in the global sustainable development arena.
102.2 Early, strategic and regional: the first SDG local reviews in Europe
Against this backdrop, European cities have been able to act as early movers in the fledgling community of
local governments willing to contribute to the global effort of measuring and reporting on SDG implementation.
The beginning of the VLR ‘movement’ is usually identified with the publication of the three reviews from
Toyama, Kitakyushu and Shimokawa in Japan, in collaboration with the Institute for Global Environmental
Strategies (IGES), a national government-sponsored research institution, and the presentation of New York
City’s VLR at the 2018 HLPF. However, back in 2016, two documents had already been published that complied
with at least the core criteria that the international community is using today to ‘define’ VLRs (UCLG & UN-
Habitat, 2020, p. 11), even though they did not have a formal ‘VLR’ branding.
In May 2016, the Department of Accountability, Social Responsibility, Participation and Cooperation of the
Government of the Valencian Country — one of Spain’s regions, the Autonomous Communities, first-tier sub-
national authorities — published a 22-page report on ‘The Region of Valencia and the local implementation of
the SDGs’ (Directorate General for Cooperation and Solidarity & UNDP-Art Initiative, 2016). The document is
more strategic and planning-oriented than it is a full-fledged review of achievements and performance — even
though it shares good practices and relevant implementation examples — but it is the first such paper with a
full acknowledgement of the SDGs, a call for more policy alignment and a pioneering involvement of several
local stakeholders in the process. It is substantially the beginning of the VLR movement.
Later in July 2016, the Government of North Rhein-Westphalia, one of Germany’s Länder, another first-tier
regional authority, published its ‘Sustainability Strategy’ (Ministry for Climate Protection Environment
Agriculture Nature and Consumer Protection of the State of North Rhine-Westphalia, 2016): the 49-pager
provided a detailed account of the Land’s sustainable development plans and the fit with specific groups of
SDGs, and it is the first such document with a dedicated section on adapted SDG indicators6 as a
methodological guide. These were the initiative that laid the groundwork for the current VLR community as we
know it. Their deep rooting in local planning and an evolving relationship with data and indicators remain the
trademarks of local reviewing to date.
6
Eve n though it p rovides no information on indicator design, data source s and availability, or the values of the indicators at the time
of p ublication (Ministry for Climate Protection Environment Agriculture Nature and Consumer Protection of the State of North Rhine -
We stp halia, 2016)
112.3 What is inside a VLR? Strategy, policy and data
One of the main challenges for the municipalities and local governments interested in producing their own VLR
has been approaching the contents of the review for the first time. Precisely, controversly to the formal process
of the Voluntary National Reviews that national governments submit to the UN, local governments have no
expected blueprint or template to follow for their VLRs. Several VLRs have followed, as closely as possible, the
model that UNDESA prepared for the reviews of national governments in 2015, and that was recently adapted
to local and regional governments in its 2020 ‘Global Guiding Elements’ document (UNDESA, 2020). The VLRs
of New York, Buenos Aires and Helsinki can be considered to be the most faithful to this template. Other local
governments carried out the task of writing their VLR with a much looser approach: for many local authorities
the ‘original’ VNR template proved expectedly hard to follow. The blueprint was modelled on the competences
and the actual political leeway and power of national governments. Local governments, in many national
contexts, often lacked the political, financial and technical resources to obtain enough knowledge and
information to fill the template that was originally recommended by the office of the United Nations Secretary
General.
This has resulted in significant diversity across the board. The average VLR is 79 pages long, Stuttgart’s review
is 220 pages long (State Capital Stuttgart et al., 2019), and Cauayan City’s declaration on Sustainable
Development is just 7 pages long. A few basic components are present in all VLRs: a gallery or overview of
relevant SDG-related activities or initiatives carried out at the local level; an assessment of policy and/or
strategic alignment with the SDGs (often all 17 of them, sometimes just the five/six SDGs which were
specifically assessed in that year’s HLPF).
A similar degree of diversity affects the approach of the VLRs to the use of data and indicators. Globally, with
N = 63 of VLRs published up to January 31, 2020, there are 42 documents that include an analysis of (specific)
SDG indicators in their structure. In terms of the metadata, only 16 VLRs use a statistical annex which dissects
the indicators used in the report in terms of indicator definition, description, origin, source of data, availability
of data, and time coverage. Among European VLRs, this figure is seven. Sources of data are the information
most commonly provided (see also Section 4 below), even though the acknowledgement of the sources does
not always imply a reference to accessible online resources or other opportunities to fully disclose the data
used in the VLR.
123 European VLRs and SDG indicators
At the time of writing (February 28, 2021) and since the publication of the Valencian Community’s VLR in May
2016, 22 VLRs from 20 European local governments had already been published. 17 of them had been issued
by municipalities, four by regional governments, and one by a provincial government (the province of Jaén, in
Spain). The information compiled in this report is on the VLRs published to the best of the editorial team’s
knowledge: the VLR movement has grown so quickly and there are so many diverse channels of institutional
communication through which information on local reviewing efforts is being circulated, that it is sometimes
hard to keep track of all localisation-related documents being issued, in Europe as elsewhere.7
Table 1 below provides a quick overview of the current status of European VLRs. From a global perspective,
Europe is the leading continent in terms of VLR publications, with about 35% of all local reviews being issued
in the region.
Table 1 Basic information on European VLRs published to date (22 documents from 20 local governments)
Source : own e laboration from p ublished VLRs
Local Government Country Type Population Year
2019
Barcelona Spain City 1,620,343
2020
Basque Country Spain Regional 2,189,534 2018
2018
Besançon France City 115,934
2019
Bonn Germany City 329,673 2020
Bristol United Kingdom City 463,400 2019
Canterbury United Kingdom City 55,240 2019
Espoo Finland City 291,439 2020
Ghent Belgium City 260,341 2020
Gothenburg Sweden City 579,281 2019
Helsinki Finland City 650,058 2019
Jaén Spain P rovincial 638,099 2020
Liverpool United Kingdom City 864,122 2020
Málaga Spain City 571,026 2018
Mannheim Germany City 309,370 2019
Niort France City 58,707 2020
NR-Westphalia Germany Regional 17,912,134 2016
Stuttgart Germany City 635,911 2020
Turku Finland City 193,089 2020
Valencian Country Spain Regional 5,003,769 2016
Wallonia Belgium Regional 3,633,795 2017
7
Local governments whose VLR or localisation-related document is not included in this list and wish to share information on their
re vie w or imp le me ntation work can contact dire ctly the Knowledge Ce ntre for Te rritorial Policie s at the following addre ss: JRC-
KCTP@e c.europa.eu
133.1 European VLRs: figures and basic trends
In total, local governments from only seven European countries have ultimately undertaken a local review:
Spain (6 VLRs), Germany (4), France, Finland and the United Kingdom (3), Belgium (2) and Sweden (1).
While — when plotted on a map (see Figure 1) — the distribution of the VLRs seemingly draws a ‘VLR line’ from
Spain through Finland across most of North-Western Europe, it is hard to make a compelling argument on any
relationship between these locations and the growth of the VLR movement. A few other variables, in this regard,
may help verify the emergence of a few more trends.
In terms of what kinds of local government in Europe are approaching VLRs more frequently, to date reviews
have been prepared mostly by municipal governments, which issued almost three-fourths of all reviews. On
one end of the municipality size continuum, only one city with one million inhabitants or
more — Barcelona — has published a VLR. On the other end, two cities of just above 50,000 inhabitants (Niort,
in France, and Canterbury, in the United Kingdom) have issued review s. Rather than revealing a
tendency — there is scarce evidence for an argument that mid-sized cities are more prone or better positioned
than others to take part in SDG localisation and reviewing — these data elicit a few questions about why VLR
‘entrepreneurship’ in Europe is still somehow limited to the group of cities with more than 100,000 and fewer
than one million inhabitants. Smaller towns have been historically underrepresented among VLR cities, often
because the challenge of producing a report compliant with the requirements that municipalities expect from
this kind of review can appear overwhelming to smaller administrations. 8 The weak participation of
metropolitan cities — often considered the urban settlement best placed and endowed to approach an
endeavour such as a VLR — is more surprising and clearly an opposing trend if compared to VLRs worldwide,
where 13 different cities with one million inhabitants or have already issued 17 VLRs, with 6 reviews published
by ‘global cities’ of over 5 million inhabitants (Moscow, São Paulo, Mexico City, New York City and Rio de
Janeiro).
8
In Volume 1 of their ‘Guidelines for VLRs’, however, UCLG and UN -Habitat did not find a valid correlation between p opulation size
and the amount of information eventually p rovided in the VLRs. For a short analysis of this variable, see (UCLG & UN-Habitat, 2020).
14Figure 1 Current map of European VLRs
Source : own e laboration.
(1) VLR list up dated up to March 1, 2021.
The map can also be read in light of other intervening variables, such as the relationship and/or the leadership
of the national government, the national association of local governments or any other relevant stakeholder in
the reviewing process. A virtuous relationship across different tiers of governance can be a positive catalyst of
engagement in the VLR process, creating what is commonly referred to as an ‘enabling environment’ that
promotes horizontal collaboration among cities, provinces or regions and drives participation in local reviewing
as part of a broader national commitment to the 2030 Agenda. In the case of European VLR cities, this
hypothesis leads to mixed results.
3.1.1 The Spanish cluster
There was no structured or formal cooperation between Sp anish local and regional governments — which
together form the largest ‘bloc’ of European VLRs — and the national government for the production of the
local reviews. The Spanish Federation of Municipalities and Provinces (Federación Española de Municipalidades
y Provincias, FEMP), the national LGA, has a long history of collaboration with the central government to provide
the information it requires from the local level for the national reviews, and has assisted the United Nations’
Sustainable Development Solutions Network (UN-SDSN) and the Spanish Red Española para el Desarrollo
Sostenible (REDS) consortium in the realisation of two reports on SDG localisation in Spain (REDS - Red Española
para el Desarrollo Sostenible, 2018, 2020) — which have been frequently used by Spanish municipalities
approaching SDG implementation and alignment. Both reports, for example, have been a relevant part of the
15indicator-based work that the Málaga municipality has carried out for its own VLR (Fundación CIEDES & City of
Málaga, 2018).
3.1.2 The Finnish cluster
A connection between the national government’s strategy and an empowerment of local
governments to make their own VLRs, for the reviewing outcomes to be mutually complementary, is much
clearer in the case of Finland. The municipalities of Turku and Espoo were published at the same time of
Finland’s 2020 VNR: the national review, moreover, collects information and data on the advancements of SDG
implementation at the local level and, at the same time, showcases the three current examples of VLRs
(Helsinki, Turku and Espoo) as highlighted case-studies. This trio of front-runners has also been in close contact
with three more municipalities that will present their VLRs through 2021: Tampere, Oulu and Vantaa. These
cities — Finland’s six largest municipalities — begun formal discussions for the institutionalisation of this
dialogue in late January 2021, involving a representative from the Office of Finland’s Prime Minister as well
as the Association of Finnish Local and Regional Authorities (Kuntaliitto),9 traditionally supportive of the
interests of smaller towns and dispersed rural communities. The concerted, multi-level development of Finnish
VLRs is being explored as a ‘live laboratory’ in Volume 2 of the Guidelines for VLRs that UN-Habitat and UCLG
are developing jointly and are expected to be published in the first half of 2021 (UN-Habitat & UCLG, 2021).
3.1.3 The German cluster
In the case of the four German local governments that have produced a VLR since 2016, there was
no direct connection to the overall national strategy led by the German government — which
presented a national review to the HLPF in 2016 and plans to publish a second one in 2021. While local
governments were engaged at various stages in the drafting of the 2016 VNR, quite early in the SDG era, there
is no explicit establishment of a multi-level or cross-tier reporting strategy or an institutional venue in support
of local reviews. The system of local government organisation in the German context has been supportive of
local reviewing and, more generally, of local efforts for implementation, albeit mostly through awareness-
raising and SDG-related advocacy. As it is addressed more in detail below in Section 3.1, in the case of the
German group of VLR cities it was a non-profit organisation, the Bertelsmann Foundation (Bertelsmann
Stiftung), that acted — in close collaboration with a wide range of institutional partners from the national, sub-
national and local levels — as a catalyst and knowledge hub. It was around this intelligence-driven core that
several German municipalities, proactively seeking to take part in the global implementation effort, gathered.
3.1.4 Clusters of VLRs and the role of institutional context: a few takeaways
Given all the above, a mixed ‘cluster’ argument for the current diffusion and location of VLRs in Europe can be
made. Certain hot-spots in Europe — the convergence of a specific administrative culture of local governments
coming together under the aegis of national strategies (as in Finland); the horizontal circulation of ideas and
methods within the community of local governments (as in Spain); or the unique input and de facto leadership
of an SDG-oriented actor able to serve as catalyst (as the coalition of the Bertelsmann Foundation and a
network of local governments’ associations did in Germany) — are creating unprecedented opportunities for
SDG mainstreaming and enhanced awareness on the importance of comparable and reliable data,
methodological rigour, and the need to communicate progress in SDG localisation via clear measurement and
achievements. These are the preconditions that make indicators essential for a new generation of VLRs to
emerge in Europe — considering that local governments of only seven out of European countries have so far
issued a VLR — and the main argument in support of this report’s research questions on how far European
VLRs have come in the way they manage data and indicators.
9
More information on the association’s we bsite: http s://www.localfinland.fi/.
163.2 Distribution, use and type of indicators in European VLRs
At the time of publication of this report, 16 European VLRs out of 22 (72.7%) included or used at least some
kind of indicator in their review. The presence and relevance of indicators across European VLRs appear to vary
according to several variables.
It was expected that earlier reviews — some of which were not even embedded in a formal SDG monitoring
framework and did not follow specific guidelines or requirements — may lack the quantitative approach or
awareness of later reviews, which were in turn developed in a context of much more institutionalised
collaboration and a more diffused understanding of the relevance of data and measurement in order to monitor
localisation. Data confirm that a certain degree of sophistication in the approach to indicator usage exists if
the information is broken into time splits (see Figure 2). Among VLRs published in 2019 or 2020, about one
third includes no statistical details on data use. In the same time frame, however, the proportion of VLRs that
has a statistical annex and also include metadata and/or information on indicator design and data sources
soars to 40% (6 VLRs out of the 15 documents published in this frame), up from just 17% in the previous time
split.
In terms of the distribution of indicators across the SDG spectrum, the pattern is quite balanced. There is no
SDG that monopolises the attention of the VLRs’ statistical analyses, and only SDG 14 on life below water has
been met with a certain reticence at the local level — mostly because SDG 14 has by design been conceived
as an instrument for innovation of ocean and sea-related policies, typically at the national level and from a
number of dimensions (pollution, underwater life and natural health, fisheries and more generally the socio-
economic implications of healthier and cleaner large bodies of water), addressing issues and/or competences
that are hardly available to any local and regional governments, let alone those that are landlocked or have
marginal access to waterways or any water expanses.
More generally, this report approached this issue with a simple hypothesis: most VLRs would focus statistically
on: a) SDG 11 as the archetypical goal for urban policy and development; and b) SDGs that relate overtly to
fields and areas whose competencies are conventionally devolved to sub-national levels of government.
Figure 2 Degree of statistical information provided in European VLRs (total and at different time splits).
Source : own e laboration
SDG 11 is in fact the most relevant Goal when it comes to indicator distribution, with 216 indicators dedicated
to sustainable cities and communities, almost 1.5 times the second most common Goal, SDG 8 (146, or 9.2%
of total indicators).
17The second hypothesis is more nuanced, given the diversity of competences and activities in which local
governments are empowered or mandated to act in different contexts: 10 municipalities and regions are
generally granted responsibilities and powers in local planning, housing, roads and transport, the provision of
social services and certain services of education and healthcare, water management and, under certain
conditions, energy supply as well as public order and policing.
Indicator distribution in European VLRs is generally coherent with this pattern: SDG 8 (economic growth,
diversification, but also welfare, training and work safety) is the second most-measured Goal, followed
by SDG 3 on education, SDG 4 on health and wellbeing, and SDG 16 on justice and peace, a Goal
which includes public safety, crime prevention, but also indexes of corruption and transparency at
all levels of government. Data on ecosystem preservation (SDG 15), the construction of development-
oriented alliances (SDG 17) or the fight against hunger and the achievement of food security, improved nutrition
and the promotion of sustainable agriculture (SDG 2) are, not surprisingly, the least favourable to urban local
authorities — still an overwhelming majority of VLR-drafting local governments, in Europe as well as
globally — and the harder to quantify, collect and manage. Even when local competences are not fully aligned
with the targets and indicators of certain SDGs, data-based analysis, indicator definition and/or measurement
can be relatively stronger in areas or sectors in which sub-national governments — and municipalities in the
first place — have access to the most systematised and encompassing data: residents’ registers, lists of social
security or health insurance users, enrolment lists in (public) education institutions.
Figure 3 Distribution of indicators across all SDGs in European VLRs
Source : own e laboration.
Figure 3 re-plots the SDG wheel according to the frequency of indicators per each SDG in European VLRs. The
distribution is rather homogeneous with just a few relevant exceptions: SDG 11 is especially relevant in the
VLRs’ statistical analysis with 214 indicators (13.6%), followed at a distance, somewhat surprisingly, by SDG 8
on decent work (146 indicators, 9.3%).
10
A 2007 re se arch of the Council of Europe attempted a small-N comparison of the main competences devolved to the local le vels in
Europ ean countries: European Committe e on Local and Regional Democracy, ‘Local Authority Competence s in Europe’, ed. Gérard
Marcou (Council of Europe, 2007). More re cently, CEMR -CCRE has cre ated a taxonomy of sub-national tie rs of government in all
Europ ean countrie s, listing the core competence s of e ach. The study, CEMR-CCRE, ‘Local and Re gional Gove rnments in Europe.
Structure s and Competences’, e d. Irene Martínez Marias, Nathalie Noupadja, and Pierre Vander Auwera (Brussels: CCRE -CEMR, 2016),
is available online at this link: http s://is.gd/fF1KmK.
184 Indicator design and definition in European VLRs
The origin of the indicators that are being used in European VLRs is one of the most complex items to be
tracked in a data-based analysis of currently available documents. On the one hand, as seen also above, only
one-third of European VLRs includes fully-developed statistical annexes with a presentation of indicators’
structure and/or metadata. In other words, at least for 67% of the VLRs currently published in Europe it is not
possible to know from the documents alone how the indicators were defined, designed or structured — whether
they are adapted from the ‘official’ list of the IEAG-SDGs indicators of the United Nations or any other
institutional sources at any level, be it the EU’s Eurostat set of indicators, national indicators, or even local
indicators already developed for any other use (e.g., Jaén, Málaga, Mannheim or Turku). Most importantly, most
VLRs do not clarify whether the indicators have been developed on purpose for the VLR, or whether the
institution(s) in charge of the review has specifically improved (pre-existing) work on strategic planning, data
management, measurement and indicators in order to provide adequate information for a VLR.
Table 2 European VLRs with explicit mention of indicator definition.
Source : own e laboration.
Origin of indicator
Total No.
Local National,
Country Type Year indicators UN EU Original
Government other, or N/A
used
Barcelona Spain City 2019 205 0 0 184 21
Barcelona1 Spain City 2020 227 36 10 0 175
Bonn Germany City 2020 46 0 0 12 34
United
Bristol City 2019 147 0 0 108 39
Kingdom
Jaén2 Spain P rovince 2019 110 0 0 0 110
Málaga Spain City 2018 120 0 0 50 70
Mannheim Germany City 2019 107 0 0 54 53
Stuttgart 3 Germany City 2020 77 0 0 50 17
Turku4 Finland City 2020 44 0 0 0 44
(1) indicators in the 2020 Barcelona VLR document are not me thodologically developed, neither origin of indicators or
source s of data are liste d.
(2) the re count of data sources in Section 4 below lists 140 indicators for the VLR of the Province of Jaén since it includes
sub-indicators broke n down by disaggregation variables (e .g., gender or age);
(3) 10 indicators are used for more than one SDG, hence the difference of totals between total indicators and indicator
de sign breakdown;
(4) the VLR highlights 44 indicators adapted from the city’s sustainable development strategy, but at le ast a total of 135
me trics are me ntioned in the VLR’s conte nts.
A necessary premise on this point is that indicator design — more generally in global SDG reporting, but also
specifically in VLRs — has been crucial for the analysis of SDG implementation for at least two key reasons.
On the one hand, indicator design in local reviews can be a very telling litmus test of the actual capacity of the
SDG framework to engender and maintain those ‘enabling environments’ for implementation to be truly holistic,
multi-level and all encompassing: the IAEG-SDGs indicators have proven to be a challenging task even for
national governments when compiling their VNRs, and have been all the more complex for local governments
to approach, decipher and use at their own level. It is not surprising that many VLRs from all over the world
have edited and revisited the ‘official’ indicator set to make it more consistent with the specific socio-economic,
demographic and territorial realities of their communities. On the other hand, indicator design in VLRs can also
be telling of the degree of alignment between a city or region’s local policy environment and the SDG
framework: the ability of a local government to use local indicators developed for local strategic planning can
provide evidence on how pervasive the impact of the 2030 Agenda has been on the way a municipality makes
its policies or measures its performance.
19You can also read