Dynamics of fMRI patterns reflect sub-second activation sequences and reveal replay in human visual cortex
←
→
Page content transcription
If your browser does not render page correctly, please read the page content below
ARTICLE
                  https://doi.org/10.1038/s41467-021-21970-2                 OPEN

                  Dynamics of fMRI patterns reflect sub-second
                  activation sequences and reveal replay in human
                  visual cortex
                  Lennart Wittkuhn             1,2 ✉   & Nicolas W. Schuck              1,2 ✉
1234567890():,;

                  Neural computations are often fast and anatomically localized. Yet, investigating such
                  computations in humans is challenging because non-invasive methods have either high
                  temporal or spatial resolution, but not both. Of particular relevance, fast neural replay is
                  known to occur throughout the brain in a coordinated fashion about which little is known. We
                  develop a multivariate analysis method for functional magnetic resonance imaging that
                  makes it possible to study sequentially activated neural patterns separated by less than 100
                  ms with precise spatial resolution. Human participants viewed five images individually and
                  sequentially with speeds up to 32 ms between items. Probabilistic pattern classifiers were
                  trained on activation patterns in visual and ventrotemporal cortex during individual image
                  trials. Applied to sequence trials, probabilistic classifier time courses allow the detection of
                  neural representations and their order. Order detection remains possible at speeds up to 32
                  ms between items (plus 100 ms per item). The frequency spectrum of the sequentiality
                  metric distinguishes between sub- versus supra-second sequences. Importantly, applied to
                  resting-state data our method reveals fast replay of task-related stimuli in visual cortex. This
                  indicates that non-hippocampal replay occurs even after tasks without memory requirements
                  and shows that our method can be used to detect such spontaneously occurring replay.

                  1 Max Planck Research Group NeuroCode, Max Planck Institute for Human Development, Berlin, Germany. 2 Max Planck UCL Centre for Computational

                  Psychiatry and Ageing Research, Berlin, Germany. ✉email: wittkuhn@mpib-berlin.mpg.de; schuck@mpib-berlin.mpg.de

                  NATURE COMMUNICATIONS | (2021)12:1795 | https://doi.org/10.1038/s41467-021-21970-2 | www.nature.com/naturecommunications                        1
ARTICLE NATURE COMMUNICATIONS | https://doi.org/10.1038/s41467-021-21970-2
M
any cognitive processes are underpinned by rapidly sequential fMRI activation patterns over seconds or
changing neural activation patterns. Most famously, minutes49–53. Recently, we have hypothesized that the properties
memory and planning have been linked to fast replay of of BOLD signals mentioned above should enable the investigation
representation sequences in the hippocampus, happening of rapid neural dynamics. Indeed, using fMRI, we identified fast
approximately within 200–300 milliseconds (ms) while the ani- sequential hippocampal pattern reactivation in resting humans54.
mal is resting or sleeping, e.g.1–9. Similar events have been However, Schuck and Niv54 did not yet answer questions
observed during behavior10,11, as well as outside of the about how fMRI could be used to measure the speed of replay.
hippocampus12–17. Likewise, internal deliberations during choice One additional exploratory question is whether replay occurs
are reflected in alternations between orbitofrontal value repre- outside of the hippocampus, and even following simple visual
sentations that last less than 100 ms18, while perceptual learning detection tasks.
has been shown to result in sub-second anticipatory activation Here, we provide and experimentally validate a multivariate
sequences in visual cortex19–21. Investigating fast-paced repre- analysis approach for fMRI that addresses the challenges and
sentational dynamics within specific brain areas therefore pro- questions outlined above. The main idea of our approach is that
mises important insights into a variety of cognitive processes. fast neural event sequences will cause characteristic time courses
Such investigations could be crucial for understanding replay, of overlapping activation patterns. While the effects of co-
which is characterized by a widespread co-occurrence of neural occurring activations on individual voxels is complex, we reason
reactivation events throughout the brain of mostly unknown that characteristic overlap will nevertheless lead to predictable
functional significance, in particular outside of the hippocampus, and simple fluctuations in the time courses of pattern classifiers.
see, e.g.17,22. These aspects are still understudied in humans. The present experiment tests this idea and our results confirm
Studying fast neural dynamics is particularly difficult in that logistic regression classifier time courses reveal the content
humans because signal recording must mainly occur non- and order of fast sequential neural events using fMRI. Impor-
invasively. How fast and anatomically localized neural dynamics tantly, we use this method to ask whether sequential reactivations
can be investigated using non-invasive neuroimaging techniques of sensory events occur outside of the hippocampus, even if task
is therefore a major challenge for human neuroscience, see, experiences did not require memorization or involve repeated
e.g.23,24. The main concern related to functional magnetic reso- sequential structure. Our study extends our previous work in
nance imaging (fMRI) is that this technique measures neural several ways. First, our controlled experimental design provides
activity indirectly through slow sampling of an extended and evidence for the decodability of fast sequential neural events in a
delayed blood-oxygen-level-dependent (BOLD) response setting where the speed and order of fast neural event sequences
function25–27 that can obscure temporal detail. Yet, the problems are known. We also show that sequence detection can be achieved
arising in BOLD fMRI might not be as insurmountable as they in the presence of high levels of signal noise and timing uncer-
seem. First, BOLD signals from the same participant and brain tainty, and is specific enough to differentiate fast sequences from
region show reliable timing and last for several seconds. Miezin activation patterns that could reflect slow conscious thinking.
et al.28, for instance, reported a between-session reliability of Second, we develop a modeling approach of multivariate fMRI
hemodynamic peak times in visual cortex of r2 = 0.95, see pattern classification time courses that validates our experimental
also29,30. Even for closely timed events, the sequential order can results and allows inference of the speed of fast sequential neural
therefore result in systematic differences in activation strength31 processes from the frequency spectra of our fMRI sequentiality
that remain in the signal long after the fast sequence event is over, metric. Third, we report that our task induced fast sequential
effectively mitigating the problems that arise from slow sampling. replay in sensory brain areas during post-task rest, although it did
Moreover, Misaki et al.32 were able to decode onset differences in not require any memorization, did not feature strong sequential
visual stimulation of only 100 ms when two stimuli were shown structure, and did not elicit systematic hippocampal responses.
to one eye before the other. Interestingly, Misaki et al.32 indicated Finally, our results have implications for the interpretation of our
that timing differences become most apparent in peak activation own previous results in Schuck and Niv54 and future fMRI studies
strength, rather than temporal aspects of the hemodynamic investigating fast neural event sequences, like hippocampal
response function (HRF). A second reason that makes the replay.
investigation of fast neural dynamics feasible is that some fast
sequence events have properties that make it easier to detect
them. Replay events, in particular, involve reactivation of spatially Results
tuned cells in the order of a previously traveled path. But these As discussed above, we investigated the possibility that fMRI can
reactivated paths do not typically span the entire spatial envir- be used to address two cornerstones of understanding signals
onment and only involve a local subset of all possible places the resulting from fast activation sequences: order detection and ele-
animal could occupy7,8. This locality means that even when ment detection. The first effect, order detection, pertains to the
measurement noise causes some elements of a fast sequence to presence of order structure in the signal that is caused by the
remain undetected, or leads to partially re-ordered detection, the sequential order of fast neural events. We evaluated this effect by
set of detected representations will still reflect positions nearby in investigating the impact of item order on (a) the relative strength
space. In this case, successive detection of elements nearby in of activations within a single measurement, and (b) the order of
space or time would still identify the fast process under investi- decoded patterns across successive measurements. The second
gation even under noisy conditions. effect, element detection, quantifies to what extent fMRI allows
If fMRI analyses can capitalize on such effects, this could allow detection of elements that were part of a sequence versus those
the investigation of fast sequential activations. As mentioned that were not. While event detection is a standard problem in
above, one important application of such methods would be fMRI, we focused on the special case relevant to our question:
hippocampal replay, a topic of intense recent interest, for reviews, detecting neural patterns of brief events that are affected by
see, e.g.24,33–37. To date, most replay research has studied the patterns from other sequence elements occurring only tens of
phenomenon in rodents because investigations in humans and milliseconds before or afterwards, causing backward and forward
other primates either required invasive recordings from the interference, respectively. Using full sequences of all possible
hippocampus38–42, used techniques with reduced hippocampal elements in our experimental setup that tested sequence ordering,
sensitivity and spatial resolution43–48, or investigated non- our design ensured that the two effects can be demonstrated
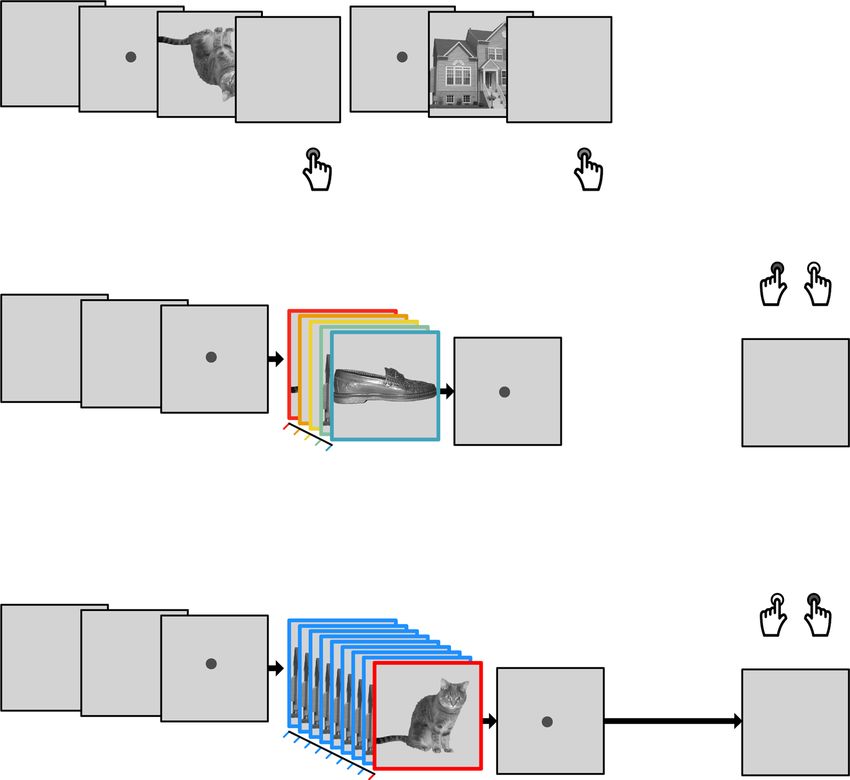
2 NATURE COMMUNICATIONS | (2021)12:1795 | https://doi.org/10.1038/s41467-021-21970-2 | www.nature.com/naturecommunicationsNATURE COMMUNICATIONS | https://doi.org/10.1038/s41467-021-21970-2 ARTICLE Fig. 1 Task design and behavioral performance. a On slow trials, individual images were presented and inter-trial intervals (ITIs) were 2.5 s on average. Participants were instructed to detect upside-down visual stimuli (20% of trials) but not respond to upright pictures. Classifier training was performed on fMRI data from correct upright trials only. b Sequence trials contained five unique visual images, separated by five levels of inter-stimulus intervals (ISIs) between 32 and 2048 ms. c Repetition trials were always fast (32 ms ISI) and contained two visual images of which either the first or the second was repeated eight times (causing backward and forward interference, respectively). In both task conditions, participants were asked to detect the serial position of a cued target stimulus in a sequence and select the correct answer after a delay period without visual input. One sequence or repetition trial came after five slow trials. fMRI analyses focused on the time from sequence onset to the end of the delay period (16 s ≈ 13 TRs, 1 TR = 1.25 s). d Illustration of the three fastest sequence speed conditions of 32, 64, and 128 ms ISI between images. e Mean behavioral accuracy in sequence trials (in %) as a function of sequence speed (ISI, in ms; N = 36, ts ≥ 23.78, ps < 0.001, ds ≥ 3.96, linear mixed effects (LME) model and five one-sided one-sample t-tests against chance (50%), false discovery rate (FDR) correction). f Mean behavioral accuracy in repetition trials (in %), as a function of which sequence item was repeated (fwd = forward, bwd = backward condition; N = 36, ts ≥ 2.94, ps ≤ 0.003, ds ≥ 0.49, two one-sided one-sample t-tests against chance (50%) with FDR-correction). All error bars represent ±1 standard error of the mean (SEM). All statistics have been derived from data of N = 36 human participants who participated in one experiment. The horizontal dashed lines in (e) and (f) indicate 50% chance level. The original authors of Haxby et al.55 hold the copyright of the stimulus material (individual images of a cat, chair, face, house, and shoe) shown in (a), (b), and (c) and made it available under the terms of the Creative Commons Attribution-Share Alike 3.0 license (see http://data.pymvpa.org/datasets/haxby2001/and http://creativecommons. org/licenses/by-sa/3.0/ for details). Source data are provided as a Source Data file. independently, i.e., the order effect could not have been a side as well as to resting-state data. We then asked whether the order effect of element detection. and the elements of fast sequences are detectable from fMRI Participants viewed images of five different objects. During signals, depending on sequence speed, number of repetitions, slow trials (Fig. 1a, 600 trials in total), individual images were level of background noise, and timing uncertainty. To this end, shown with inter-trial intervals (ITIs) of approximately 2.5 s, as visual stimuli in sequence and repetition trials were presented in a is common in fMRI decision-making experiments (cf.44,47,52,54). precisely timed and ordered manner, as detailed below. Since In fast trials (120 trials in total), the same images were shown as activation patterns were primarily visual in nature, only data from either a random sequence of all five objects (sequence trials, 75 visual and ventral temporal cortex were considered. A corre- trials, Fig. 1b), or two objects were repeated several times (repe- sponding analysis using hippocampal data did not yield com- tition trials, 45 trials, Fig. 1c). Importantly, image presentation parable results, see below. The analyses included N = 36 human rate was greatly increased in sequence and repetition trials, with participants who underwent two fMRI sessions with four task as little as 32 ms between stimuli and a presentation time of 100 runs each, i.e., eight runs in total. Four additional participants ms per stimulus. Logistic regression classifiers were trained on were excluded from analyses due to insufficient performance, see data from slow trials and applied to sequence and repetition trials, Methods and Supplementary Information (SI) (Supplementary NATURE COMMUNICATIONS | (2021)12:1795 | https://doi.org/10.1038/s41467-021-21970-2 | www.nature.com/naturecommunications 3
ARTICLE                                                                 NATURE COMMUNICATIONS | https://doi.org/10.1038/s41467-021-21970-2

Fig. 1a). Sessions were separated by 9 days on average (SD =                 single event duration, here λ = 5.24 TRs (see Eqs. (4) and (5),
6 days, range: 1–24 days).                                                   Methods). This average parameter was used for all further ana-
                                                                             lyses (Fig. 2c, d; see Methods). In this model, the amplitude is
                                                                             proportional to the time shift between events (until time shifts
Training fMRI pattern classifiers on slow events. In slow trials,             become larger than the time-to-peak of the response function).
participants repeatedly viewed the same five images individually              Consequently, after an onset delay (d = 0.56 TRs), the difference
for 500 ms (images showed a cat, chair, face, house, and shoe,               in probability of two time-shifted events is expected to be positive
taken from55). Temporal delays between images were set to 2.5 s              for the duration of half a cycle, i.e., 0.5λδ = 0.5(5.24 + δ) TRs, and
on average, as typical for task-based fMRI experiments56. To                 negative for the same period thereafter. Simply put, this means
ensure that image ordering did not yield biased classifiers through           that the strength of overlapping activations will initially be
biased pattern similarities (cf.57), each possible order permutation         ordered forward, in the same way as the sequence, i.e., earlier
of the five images was presented exactly once (120 sets of 5 images           items will be activated stronger. In a later period, however, this
each). Participants were kept attentive by a cover task that                 will reverse and result in backwards ordering, i.e., earlier items
required them to press a button whenever a picture was shown                 will be activated less. In summary, three predictions therefore
upside-down (20% of trials; mean accuracy = 99.44%; t(35) =                  arise from this model: (1) the first event will dominate the signal
263.27, 95% CI [99.13, + ∞]; p < 0.001, compared to chance                   in earlier TRs, and activation strengths will be proportional to the
(50%); d = 43.88; Supplementary Fig. 1a–c). Using data from                  true event order during the sequential process; (2) in later TRs,
correct upright slow trials, we trained five separate multinomial             the last sequence element will dominate the signal, and the
logistic regression classifiers, one for each image category (one-            activation strengths will be ordered backwards; and (3) the
vs.-rest; see Methods for details; cf.55). fMRI data were masked by          duration and strength of these two effects will depend on the
a gray-matter-restricted region of interest (ROI) of occipito-               fitted response duration and the timing of the stimuli as specified
temporal cortex, known to be related to visual object processing             above (Fig. 2e and Eqs. (1)–(5); see Methods). For sequences with
(11,162 voxels in the masks on average; cf.55,58–60). Spatial pat-           more than two items (as in sequence trials, see below), δ is
terns associated with image categories indicated a mix of over-              defined as the interval between the onsets of the first and last
lapping and non-overlapping sets of voxels, and average                      sequence item. To reflect the relation between the true order and
correlations between the mean voxel patterns were negative (see              the activation strength, we henceforth term the above-mentioned
SI). We accounted for hemodynamic lag by extracting fMRI data                early and late TRs as the forward and backward periods, and
acquired 3.75–5 s after stimulus onset (corresponding to the                 consider all results below either separately for these phases, or for
fourth repetition time (TR), see Methods). Cross-validated (leave-           both relevant periods combined (calculating periods depending
one-run-out) classification accuracy was on average 69.22% (SD                on the timings of image sequences and rounding TRs, see
= 11.18%; t(35) = 26.41, 95% CI [66.07, + ∞], p < 0.001, com-                Methods).
pared to chance (20%); d = 4.40; Fig. 2a). In order to examine the
sensitivity of the classifiers to pattern activation time courses, we         Detecting sequentiality in fMRI patterns following fast and slow
applied them to seven TRs following stimulus onset on each trial.            neural event sequences. Our first major aim was to test detection
This analysis confirmed delayed and distinct increases in the                 of sequential order of fast neural events with fMRI. We therefore
estimated probability of the true stimulus class given the data,             investigated the above-mentioned sequence trials in which par-
peaking at the fourth TR after stimulus onset, as expected, given            ticipants viewed a series of five unique images at different speeds
that the classifiers were trained on data from the fourth TR fol-             (Fig. 1b). Sequence speed was manipulated by leaving either 32,
lowing stimulus onset (Fig. 2b). The peak in probability for the             64, 128, 512, or 2048 ms between pictures, while images were
true stimulus shown on the corresponding trial was significantly              always presented briefly (100 ms per image, total sequence
higher than the mean probability of all other stimuli at that time           duration 0.628–8.692 s). Note, that we refer to the inter-stimulus
point (ts ≥ 17.95, ps < 0.001, ds ≥ 2.99; Bonferroni-corrected).             interval (ISI) as “sequence speed” (see Fig. 1d). Sequences always
Decoding in an anatomical ROI of the hippocampus did not                     contained each image exactly once. Every participant experienced
surpass the chance level (decoding accuracy: mean (M) = 20.52%,              15 randomly selected image orders that ensured that each image
SD = 1.49%; t35 = 2.10, 95% CI [20.02, 21.03], p = 0.05, com-                appeared equally often at the first and last position of the
pared to chance (20%), d = 0.35; using the same decoding                     sequence (all 120 possible orders counterbalanced across parti-
approach, see SI for details).                                               cipants). The task required participants to indicate the serial
                                                                             position of a verbally cued image 16 s after the first image was
Single event and event sequence modeling. The data shown in                  presented. This delay between visual events and response
Fig. 2b highlight that multivariate decoding time courses are                (roughly spanning 13 TRs; see x-axes in Fig. 3a, b) allowed us to
delayed and sustained, similar to single-voxel hemodynamics. We              measure sequence-related fMRI signals without interference from
captured these dynamics elicited by single events by fitting a sine-          following trials, while the upcoming question did not necessitate
based response function to the time courses on slow trials (a                memorization of the sequence during the delay period. Perfor-
single sine wave flattened after one cycle, with parameters for               mance was high even in the fastest sequence trials (32 ms: M =
amplitude A, response duration λ, onset delay d, and baseline b;             88.33%, SD = 7.70, t35 = 29.85, 95% CI [86.16, + ∞], p < 0.001
Fig. 2c and Supplementary Fig. 4; see Methods). Based on this fit             compared to chance (50%), d = 4.98), and only slightly reduced
to single events, we derived expectations for probabilistic time             compared to the slowest condition (2048 ms: M = 93.70%, SD =
courses during sequential events. The sequentiality analyses                 7.96, t35 = 32.95, 95% CI [91.46, + ∞], p < 0.001 compared to
reported below essentially quantify how well successive activation           chance (50%), d = 5.49; Fig. 1e and Supplementary Fig. 1d).
patterns can be differentiated from one another depending on the                We investigated whether sequence order was detectable from
speed of stimulus sequences. We therefore considered two time-               the relative pattern activation strength within a single measure-
shifted response functions and derived the magnitude and time                ment. Examining the time courses of probabilistic classifier
course of differences between them. Based on the sinusoidal                  evidence during sequence trials (Fig. 3a) showed that the time
nature of the response function, the time course of this difference          delay between events was indeed reflected in sustained within-TR
can be approximated by a single sine wave with duration λδ = λ               ordering of probabilities in all speed conditions. Specifically,
+ δ, where δ is the time between events and λ is the average fitted           immediately after sequence onset, the first element (red line) had

4                NATURE COMMUNICATIONS | (2021)12:1795 | https://doi.org/10.1038/s41467-021-21970-2 | www.nature.com/naturecommunications
NATURE COMMUNICATIONS | https://doi.org/10.1038/s41467-021-21970-2 ARTICLE Fig. 2 Classification accuracy and multivariate response functions. a Cross-validated classification accuracy in decoding the five unique visual objects in occipito-temporal data during task performance (in %; N = 36, t(35) = 26.41, 95% CI [66.07, + ∞], p < 0.001, d = 4.40, one one-sided one-sample t-test, no multiple comparisons). Chance level is 20% (dashed line). Each dot corresponds to averaged data from one participant. Error bar represents ±1 SEM. b Time courses (in TRs from stimulus onset) of probabilistic classification evidence (in %) for all five stimulus classes. Substantial delayed and extended probability increases for the stimulus presented (black lines) on a given trial (gray panels) were found. Each line represents one participant (N = 36, ts ≥ 17.95, ps < 0.001, ds ≥ 2.99, 35 two-sided two-sample t-tests, Bonferroni-corrected). c Average probabilistic classifier response for the five stimulus classes (gray lines) and fitted sine-wave response model using averaged parameters (black line). d Illustration of sinusoidal response functions following two neural events (blue and red lines) time-shifted by delta seconds (dashed horizontal line). The resulting difference between event probabilities (black line) establishes a forward (blue area) and backward (red area) time period, split into early and late phases. The sine-wave approximation without flattened tails is shown in gray. e Probability differences between two time-shifted events predicted by the sinusoidal response functions depending on the event delays (delta) as they occurred in the five different sequence speed conditions (colors), based on Eq. (6). All statistics have been derived from data of N = 36 human participants who participated in one experiment. Source data are provided as a Source Data file. the highest probability and the last element (blue line) had the Pearson’s rs ≥ 0.23, ts ≥ 3.76, ps < 0.001, compared to zero, ds ≥ lowest probability. This pattern reversed afterwards, following the 0.63, FDR-corrected). forward and backward dynamics that were predicted by the time- Choosing a different index of association like rank correlation shifted response functions (Fig. 2d; forward and backward coefficients (Supplementary Figs. 5a, b and 6c) or the mean step periods adjusted to sequence speed, see above and Methods). A size between probability-ordered events within TRs (Supplemen- TR-wise linear regression between the serial positions of the tary Figs. 5c, d and 6d) produced qualitatively similar results (for images and their probabilities confirmed this impression. In all details, see SI). Removing the sequence item with the highest speed conditions, the mean slope coefficients initially increased probability at every TR also resulted in similar effects, with above zero (reflecting higher probabilities of earlier compared to backward sequentiality remaining significant at all speeds (p ≤ later items) and decreased below zero afterwards (Fig. 3b and 0.002) except the 32 and 128 ms conditions (p ≥ 0.20), and Supplementary Fig. 6a). Considering mean regression coefficients forward sequentiality still being evident at speeds of 512 and during the predicted forward and backward periods, we found 2048 ms (p ≤ 0.004; Supplementary Fig. 7a, b). To identify the significant forward ordering in the forward period at ISIs of 128, drivers of the apparent asymmetry in detecting forward and 512, and 2048 ms (ts ≥ 2.85, ps ≤ 0.009, ds ≥ 0.47) and significant backward sequentiality, we ran two additional control analyses backward ordering in the backward period in all speed conditions and either removed the probability of the first or the last sequence (ts ≥ 3.89, ps < 0.001, ds ≥ 0.65, FDR-corrected; Fig. 3c). Notably, item (forward and backward periods adjusted accordingly). the observed time course of regression slopes on sequence trials Removal of the first sequence item had little impact on (Fig. 3b) closely matched the time course predicted by our sequentiality detection (Supplementary Fig. 7c, d and SI), but modeling approach (Fig. 2d), as indicated by strong correlations removing the last sequence item markedly affected the results for all speed conditions between model predictions and the such that significant forward and backward sequentiality was only averaged time courses (Fig. 3d; Pearson’s rs ≥ 0.81, ps < 0.001) as evident at speeds of 512 and 2048 ms (Supplementary Fig. 7e, f well as significant within-participant correlations (Fig. 3e; mean and SI). NATURE COMMUNICATIONS | (2021)12:1795 | https://doi.org/10.1038/s41467-021-21970-2 | www.nature.com/naturecommunications 5
ARTICLE                                                                 NATURE COMMUNICATIONS | https://doi.org/10.1038/s41467-021-21970-2

   Next, we investigated evidence of pattern sequentiality across            The average serial position of the decoded images was therefore
successive measurements, similar to Schuck and Niv54. Specifi-                significantly different between the predicted forward and back-
cally, for each TR we only considered the decoded image with the             ward period at all sequence speeds (all ps < 0.001, Fig. 3g,
highest probability and asked whether earlier images were                    Supplementary Fig. 6d). Compared to baseline (mean serial
decoded primarily in earlier TRs, and whether later images were              position of 3), the average serial position during the forward
primarily decoded in later TRs. In line with this prediction, the            period was significantly lower for speeds of 512 and 2048 ms (all
average serial position fluctuated in a similar manner as the                 ps < 0.001). The average decoded serial position at later time
regression coefficients, with a tendency of early positions to be             points was significantly higher compared to baseline in all speed
decoded in early TRs, and later positions in later TRs (Fig. 3f).            conditions, including the 32 ms condition (all ps < 0.001). Thus,

6                NATURE COMMUNICATIONS | (2021)12:1795 | https://doi.org/10.1038/s41467-021-21970-2 | www.nature.com/naturecommunications
NATURE COMMUNICATIONS | https://doi.org/10.1038/s41467-021-21970-2                                                                      ARTICLE

Fig. 3 Sequence order is reflected in probability time courses. a Time courses (TRs from sequence onset) of classifier probabilities (%) per event (colors)
and sequence speed (panels). Forward (blue) and backward (red) periods shaded as in Fig. 2d. b Time courses of mean regression slopes between event
position and probability for each speed (colors). Positive/negative values indicate forward/backward sequentiality, respectively. c Mean slope coefficients
for each speed (colors) and period (forward vs. backward; N = 36, ts ≥ 2.85, ps ≤ 0.009, ds ≥ 0.47 (significant tests only), ten two-sided one-sample t-
tests against zero, FDR-corrected). Asterisks indicate significant differences from baseline. d Between-participant correlation between predicted (Fig. 2e,
Eq. (6)) and observed (b) time courses of mean regression slopes (13 TRs per correlation, Pearson’s rs ≥ 0.81, ps < 0.001). Each dot represents one TR.
e Mean within-participant correlations between predicted and observed slopes as in (d) (N = 36, mean Pearson’s rs ≥ 0.23, ts ≥ 3.76, ps ≤ 0.001,
compared to zero, ds ≥ 0.63, FDR-corrected). f Time courses of mean event position for each speed, as in (b). g Mean event position for each period and
speed, as in (c) (N = 36, ts ≥ 4.78, ps < 0.001, ds ≥ 0.75 (significant tests only), ten two-sided one-sample t-tests against baseline, FDR-corrected).
h Mean step sizes of early and late transitions for each period and speed (N = 36, ts ≥ 2.88, ps ≤ 0.006, ds ≥ 0.48 (significant tests only), ten two-sided
one-sample t-tests against zero, FDR-corrected). Asterisks indicate differences between periods, otherwise as in (c). Each dot represents data of one
participant. Error bars/shaded areas represent ±1 SEM. All statistics have been derived from data of N = 36 human participants who participated in one
experiment. Effect sizes indicated by Cohen’s d. Asterisks indicate p < 0.05, FDR-corrected. 1 TR = 1.25 s. Source data are provided as a Source Data file.

earlier images were decoded earlier after sequence onset and later              ask if detection of brief activations is differently affected by events
images later, as expected.                                                      occurring before versus after the single event, we varied whether
   This sequential progression through the involved sequence                    the single item was preceded or followed by the repeated item.
elements had implications for transitions between consecutively                 We pose this question because the backward effects were
decoded events. The transitions will be a direct function of the                consistently larger than forward effects in our sequentiality
slope of the average decoded position shown in Fig. 3f. When the                analyses reported above (Fig. 3c), suggesting asymmetric detec-
slope is negative, the steps between successive sequence items are              tion sensitivity. This implies that one briefly presented item at the
backward and reflect the transition from a later position to an                  end of a sequence will be easier to detect than a briefly presented
earlier position. When the slope is positive, the steps are forward,            item at the beginning of a sequence, even though both were
reflecting a progression from an earlier event position to a later               equally close in time to another strong activation signal. To test
event position. This can be verified by computing the step sizes                 this idea, we considered the two order conditions described
between consecutively decoded serial events as in Schuck and                    above. We will term the case in which the first image was shown
Niv54. For example, observing a 2 → 4 transition of decoded                     briefly once and followed immediately by eight repetitions of a
events in consecutive TRs would correspond to a forward step of                 second image the forward interference condition, because the
size +2, while a 3 → 2 transition would reflect a backward step of               forward phase of the sequential responses suffers from inter-
size −1. As can be seen from Fig. 3f, both the early and late phase             ference. Correspondingly, trials in which the first image was
of the response (see phases in Fig. 2d) included periods with a                 repeated eight times and the second image was shown once will
negative and a positive slope, in line with our predictions                     be termed the backward interference condition. In all cases,
(formally, the prediction can be obtained by taking the derivative              images were separated by only 32 ms. Participants were kept
with respect to time of Eq. (6), see Methods, i.e., the function                attentive by the same cover task used in sequence trials (Fig. 1c).
shown in Fig. 2e). We therefore considered the periods with a                   Average behavioral accuracy was high on repetition trials (M =
positive and negative position slope separately for the early and               73.46%, SD = 9.71%; Fig. 1f and Supplementary Fig. 1a) and
late phase. As expected, the early transitions were mainly forward              clearly differed from a 50% chance level (t(35) = 14.50, 95% CI
during the period of a positive slope as compared to the negative               [70.72, + ∞], p < 0.001, d = 2.42). Splitting up performance into
slope periods for speed conditions of 512 and 2048 ms (ps ≤ 0.01,               forward and backward interference trials showed performance
Fig. 3h). Similarly, the late transitions were also forward and                 above chance level in both conditions (M = 82.22% and M =
backward during the positive and negative slope periods,                        63.33%, respectively, ts ≥ 2.94, ps ≤ 0.003, ds ≥ 0.49, Fig. 1f).
respectively, and differed in all speed conditions (ps ≤ 0.01,                     As before, we applied the classifiers trained on slow trials to the
Fig. 3h), except the 64 and 128 ms conditions (p = 0.12 and p =                 data acquired in repetition trials and obtained the estimated
0.10; FDR-corrected). This analysis suggests that transitions                   probability of every class given the data for each TR (Fig. 4a and
between decoded items reflect the ordered progression from early                 Supplementary Fig. 9). The expected relevant time period was
to late and then from late to early sequence events, even when                  determined to be from TRs 2 to 7 and used in all analyses (see
events were separated only by tens of milliseconds.                             rectangular areas in Fig. 4a).
                                                                                   We first asked whether our classifiers indicated that the two
Detecting sequence elements: asymmetries and interference effects.              events that were part of the sequence were more likely decoded
We next turned to our second main question, asking whether we                   than items that were not part of the sequence. Indeed, the event
can detect which patterns were part of a fast sequence and which                types (first, second, non-sequence) had significantly different
were not. One important reason why detecting which patterns                     mean decoding probabilities, with sequence items having a higher
were activated during sequence events might be more difficult                    probability (first: M = 20.19%; second: M = 24.78%) compared to
than in a standard setting is that co-activation of multiple pat-               non-sequence items (M = 7.72%; both ps < 0.001, corrected; main
terns close in time could lead to interference. We therefore                    effect: F2,57.78 = 110.13, p < 0.001; Fig. 4b). Moreover, the prob-
investigate such interference in detail below.                                  ability of decoding within-sequence items depended on the
   We analyzed classification time courses in repetition trials, in              condition and whether the item was repeated or not. Considering
which only two out of the five possible images were shown. One                   both interference conditions (forward/backward) in the same
of the two images was repeated, while the other one was shown                   analysis revealed a main effect of condition, F2,41.64 = 146.15, p <
only once. This setup allowed us to study to what extent another                0.001, as well as an interaction between condition and whether
activation (the repeated image) can interfere with the detection of             the item was repeated, F2,140.00 = 122.59, p < 0.001. This indicated
a brief activation pattern of interest (the image shown only once).             that the forward phase suffered from much stronger interference
The repeating image was shown eight times, which created                        than the backward phase. In the forward interference condition,
maximally adverse effects for the detection of the single image. To             the repeated second event had an approximately 18% higher

NATURE COMMUNICATIONS | (2021)12:1795 | https://doi.org/10.1038/s41467-021-21970-2 | www.nature.com/naturecommunications                                7
ARTICLE NATURE COMMUNICATIONS | https://doi.org/10.1038/s41467-021-21970-2 Fig. 4 Ordering of two-item sequences on repetition trials. a Time courses (in TRs from sequence onset) of probabilistic classifier evidence (in %) in repetition trials, color-coded by event type (first, second and the three remaining non-sequence items, see legend). Data shown separately for forward (left) and backward (right) interference conditions. Gray background indicates relevant time period independently inferred from response functions (Fig. 2d). Shaded areas represent ±1 SEM. 1 TR = 1.25 s. b Mean probability of event types averaged across all TRs in the relevant time period, as in (a). Each dot represents one participant, the probability density of the data is shown as rain cloud plots (cf.141). Boxplots indicate the median and interquartile range (IQR, i.e., distance between the first and third quartiles). The lower and upper hinges correspond to the first and third quartiles (the 25th and 75th percentiles). The upper whisker extends from the hinge to the largest value no further than 1.5* IQR from the hinge. The lower whisker extends from the hinge to the smallest value at most 1.5* IQR of the hinge. The diamond shapes show the sample mean and error bars indicate ±1 SEM (N = 36, ts ≥ 3.31, ps ≤ 0.006, LME model with post hoc Tukey’s honest significant difference (HSD) tests). c Average probability of event types, separately for forward/backward conditions as in (a), plots as in (b) (N = 36, ts ≥ 4.14, ps < 0.001, LME model with post hoc Tukey’s HSD tests). d Mean trial-wise proportion of each transition type, separately for forward/backward conditions, as in (a) (N = 36, ts ≥ 4.64, ps < 0.001, four two-sided paired t-tests, Bonferroni-corrected). e Transition matrix of decoded images indicating mean proportions per trial, separately for forward/backward conditions, as in (a). Transition types highlighted in colors (see legend). All statistics have been derived from data of N = 36 human participants who participated in one experiment. Source data are provided as a Source Data file. probability than the single first event (31.55% vs. 13.50%, p < item shown only once was easier to detect when it followed a 0.001). In the backward interference condition, the repeated first sustained activation of a different pattern, compared to when it event had only 9% higher probability than the single second event preceded an interfering activation (Fig. 4c). We found no main (26.87% vs. 18.00%, p < 0.001, corrected). This means that the effect of repetition, p = 0.91 (Fig. 4c). 8 NATURE COMMUNICATIONS | (2021)12:1795 | https://doi.org/10.1038/s41467-021-21970-2 | www.nature.com/naturecommunications
NATURE COMMUNICATIONS | https://doi.org/10.1038/s41467-021-21970-2                                                                     ARTICLE

   Importantly, however, both sequence elements still differed                  probabilities, such that category probabilities tended to be closer
from non-sequence items even under conditions of interference                   together and less extreme. In consequence, the average standard
(forward: 7.75% and backward: 7.69%, respectively, all ps < 0.001,              deviation of the probabilities per TR during rest and slow (2048
corrected), indicating that sequence element detection remains                  ms) sequence periods was higher (M = 0.23 and M = 0.22,
possible under such circumstances. Using data from all TRs                      respectively) compared to the average standard deviation in the
revealed qualitatively similar significant effects (p ≤ 0.04 for all             fast sequence condition (32 ms; M = 0.20; ts ≥ 4.17; ps < 0.001;
but one test after correction, see SI). Repeating all analyses using            ds ≥ 0.74; Fig. 5a).
proportions of decoded classes (the class with the maximum                         As before, we fitted regression coefficients through the classifier
probability was considered decoded at every TR), or considering                 probabilities of the rest data and, for comparison, concatenated
all repetition trial conditions, also revealed qualitatively similar            data from the 32 and 2048 ms sequence trials (Fig. 5b, c). As
results. Thus, brief events can be detected despite significant                  predicted by our modeling approach (Fig. 2e), and shown in the
interference.                                                                   previous section (Fig. 3b), the time courses of regression
   We next asked which implications these findings have for the                  coefficients in the sequence conditions were characterized by
observed pattern transitions (cf.54). To this end, we analyzed the              rhythmic fluctuations whose frequency and amplitude differed
trial-wise proportions of transitions between consecutively                     between speed conditions (Fig. 5c). To quantify the magnitude of
decoded events, and asked whether forward transitions between                   this effect, we calculated frequency spectra of the time courses of
sequence items were more likely than transitions between a                      the regression coefficients in rest and concatenated sequence data
sequence and a non-sequence item (outward transitions) or                       (Fig. 5d; using the Lomb-Scargle method, e.g.61 to account for
between two non-sequence items (outside transitions; for details,               potential artifacts due to data concatenation, see Methods). This
see Methods). This analysis revealed that forward transitions                   analysis revealed that frequency spectra of the sequence data
(5.89%) were more frequent than both outward transitions                        differed from rest frequency spectra in a manner that depended
(2.46%), and outside transitions (1.04%, both ps < 0.001, ts ≥ 4.64,            on the speed condition (Fig. 5d, e). As foreshadowed by our
Bonferroni-corrected; Fig. 4d) in the forward interference                      model, power differences appeared most pronounced in the
condition. The same was true in the backward interference                       predicted frequency ranges (Fig. 5e; ps ≤ 0.002; see Eq. (5) and
condition (forward transitions: 7.22%; outward transitions:                     Methods). Specifically, when the 32 ms condition was considered,
2.67%; outside transitions: 1.06%, all ps < 0.001, ts ≥ 5.14). The              the analyses revealed an increased power around 0.17 Hz, which
full transition matrix is shown in Fig. 4e. Repetitions of the first or          corresponds to the frequency predicted to occur by our model.
second item are shown on the upper two diagonal elements (with                  Data from the 2048 ms condition, in contrast, exhibited an
all consecutive repetitions of items labeled repetition in Fig. 4e),            increased power around 0.07 Hz, as predicted.
and were not considered in this analysis.                                          Finally, we asked whether these differences would persist if (a)
   Together, the results from repetition trials indicated that: (1)             only few sequence events occurred during a 5-min rest period,
within-sequence items could be clearly detected despite inter-                  while (b) their onset was unknown, and (c) their SNR was lower.
ference from other sequence items; (2) event detection was                      To this end, we synthetically generated data containing a variable
asymmetric, such that items occurring at the end of sequences                   number of sequence events that were inserted at random times
can be detected more easily than those occurring at the beginning;              into the resting-state data acquired before any task exposure.
and (3) the detection of sequence items made it possible to                     Specifically, we inserted between 1 and 6 sequence events into the
observe within-sequence transitions between decoded items.                      rest period by blending rest data with TRs recorded in fast (32
   Note that our analyses focused on the two extreme cases of                   ms) or slow (2048 ms) sequence trials (12 TRs per trial, random
repetition trials with one versus eight repetitions of the first or              selection of sequence trials and insertion of time points, without
second item while the experiment also included repetition trials                replacement). To account for possible SNR reductions, the
with intermediate levels of repetitions (see SI). Specifically, other            inserted probability time courses were multiplied by a factor κ
repetition trials included cases in which the second item began to              of 45, 12, 14, 18, or 0 and added to the probability time courses of the
appear at each possible position from 2 to 9. The other repetition              inversely scaled (1−κ) resting-state data. Effectively, this led to a
trials could therefore include, for instance, three repetitions of the          step-wise reduction of the inserted sequence signal from 80% to
first and six repetitions of the second image, or four repetitions of            0%, relative to the SNR obtained in the experimental conditions
the first and five repetitions of the second item, etc. The results               reported above. Thus, here we use the term SNR to describe the
reported in the SI indicate that effects in these trials show smooth            relative mixing proportion of (a) data from the task, which
transition between the extremes shown in the main manuscript.                   contain sequential signal, with (b) data from the pre-task resting-
                                                                                state session, which contain only noise. Note that this is different
Detecting sparse sequence events with lower signal-to-noise ratio               from the common definition of SNR in univariate fMRI as the
(SNR). The results above indicate that detection of fast sequences              ratio of average signal to standard deviation over time.
is possible if they are under experimental control. In most                        As expected, differences in the above-mentioned standard
applications of our method, however, this will not be the case.                 deviation of the probability gradually increased with both the
When detecting replay, for instance, sequential events will occur               SNR level and the number of inserted sequence events when
spontaneously during a period of noise. We therefore next                       either fast or slow sequences were inserted (Fig. 5f). In our case,
assessed the usefulness of our method under such circumstances.                 this led significant differences to emerge with one insert and an
   We first characterized the behavior of sequence detection                     SNR reduced to 12.5% in both the fast and slow conditions
metrics during periods of noise. To this end, we applied the                    (Fig. 5g; comparing against zero, the expectation of no difference
logistic regression classifiers to fMRI data acquired from the same              with a conventional false-positive rate α of 5%; all ps FDR-
participants (n = 32 out of 36) during a 5-min (233 TRs) resting                corrected).
period before any task exposure. Classifier probabilities during                    Importantly, the presence of sequence events was also reflected
rest fluctuated wildly, often with a single category having a high               in the frequency spectrum of the regression coefficients. Inserting
probability, while all other categories had probabilities close to              fast event sequences into rest led to power increases in the
zero. During fast sequence periods, in contrast, the near-                      frequency range indicative of 32 ms events (~0.17 Hz, Fig. 5h, i,
simultaneous activation of stimulus-driven activity led to reduced              left panel), in line with our findings above. This effect again got

NATURE COMMUNICATIONS | (2021)12:1795 | https://doi.org/10.1038/s41467-021-21970-2 | www.nature.com/naturecommunications                              9
ARTICLE NATURE COMMUNICATIONS | https://doi.org/10.1038/s41467-021-21970-2 stronger with higher SNR levels and more sequence events. presence of spontaneously occurring sub-second sequences Inserting slow (2048 ms) sequence events into the rest period during rest can be detected in the frequency spectrum of our showed a markedly different frequency spectrum, with an sequentiality measure, and distinguished from slower second- increase around the frequency predicted for this speed (~0.07 scale sequences that might reflect conscious thinking. Hz, Fig 5h, i, right panel). Comparing the power around the predicted frequency (±0.01 Hz) of both speed conditions Detecting fast reactivations in post-task resting-state data. Finally, indicated significant increases in power compared to sequence- we asked whether our task elicited spontaneous replay of image free rest when six sequence events were inserted and the SNR was sequences in object-selective brain areas during rest after the task. reduced to 80% (ts ≥ 2.28, ps ≤ 0.03, ds ≥ 0.40). Hence, the Based on the above findings, we reasoned that potentially 10 NATURE COMMUNICATIONS | (2021)12:1795 | https://doi.org/10.1038/s41467-021-21970-2 | www.nature.com/naturecommunications
NATURE COMMUNICATIONS | https://doi.org/10.1038/s41467-021-21970-2                                                                       ARTICLE

Fig. 5 Detecting sparse sequence events with lower SNR. a Mean standard deviation of classifier probabilities in rest and sequence data (n = 32, ts ≥ 4.17,
ps < 0.001, ds ≥ 0.74, two two-sided paired t-tests comparing rest and 2048 ms conditions against 32 ms condition, FDR-corrected). b Mean absolute
regression slopes, as in (a) (n = 32, ts ≥ 4.64, ps < 0.001, ds ≥ 0.82, two two-sided paired t-tests comparing rest and 2048 ms conditions against 32 ms
condition, FDR-corrected). c Time courses of the regression slopes (signed values, not magnitudes) in rest and sequence data. Vertical lines indicate trial
boundaries. d Normalized frequency spectra of regression slopes in rest and sequence data. Annotations indicate predicted frequencies based on Eq. (5).
e Mean power of predicted frequencies in rest and sequence data, as in (a). Each dot represents data from one participant (n = 32, ts ≥ 3.10, ps ≤ 0.002,
two-sided paired t-tests, FDR-corrected). f Mean standard deviation of rest data including a varying number of SNR-adjusted sequence events (fast or
slow). Dashed line indicates indifference from sequence-free rest (n = 32, ts ≥ 2.22, ps ≤ 0.04, 30 two-sided one-sample t-tests against chance, FDR-
corrected). g Base-20 log-transformed p values of t-tests comparing the standard deviation of probabilities in (f) with sequence-free rest. Dashed line
indicates p = 0.05 (N = 32, ts ≥ 2.22, ps ≤ 0.04, 30 two-sided one-sample t-tests against chance, FDR-corrected). h Frequency spectra of regression
slopes in SNR-adjusted sequence-containing rest relative to sequence-free rest. Rectangles indicate predicted frequencies, as in (d). i Mean relative power
of predicted frequencies in SNR-adjusted sequence-containing rest (n = 32, ts ≥ 2.28, ps ≤ 0.03, two-sided t-tests against baseline, FDR-corrected).
Shaded areas/error bars represent ±1 SEM. All statistics have been derived from data of n = 32 human participants who participated in one experiment. 1
TR = 1.25 s. Source data are provided as a Source Data file.

Fig. 6 Detecting fast task-related reactivations in post-task resting-state data. a Normalized frequency spectra of regression slopes in pre- and post-task
resting-state data. Annotations indicate predicted frequencies based on Eq. (5). Shaded areas represent ±1 SEM. b Relative power (difference between pre-
and post-task rest) of normalized frequency spectra shown in (a) (n = 32, F1,94.99 = 6.17, p = 0.02, LME model comparing pre- vs. post-task resting-state
data at 0.17 Hz). c Mean power at predicted fast frequency (0.17 Hz) in pre- and post-task resting-state data for less and more frequent stimulus
sequences (n = 32, ts ≥ 4.17, ps < 0.001, ds ≥ 0.74, two two-sided paired t-tests comparing rest and 2048 ms conditions against 32 ms condition, FDR-
corrected). Each dot corresponds to averaged data from one participant. Error bars represent ±1 SEM. All statistics have been derived from data of n = 32
human participants who participated in one experiment. Source data are provided as a Source Data file.

reactivated sequences should become apparent in a frequency                     trials were slightly more frequent and we asked if they were
spectrum analysis. We therefore applied this analysis to resting-               reactivated more strongly during the post-task resting-state ses-
state data recorded after participants performed the task. Cru-                 sion. This was not the case. A power increase in the fast frequency
cially, because the true sequence of potential replay events was                range when comparing pre- to post-task rest was found for both
not known, we repeated the analyses for all possible image orders,              sets of sequences, i.e., the 15 image orders that occurred in
averaged the resulting frequency spectra, and compared the                      sequence and slow trials, and the 105 that occurred only in slow
results to the same analysis performed on the pre-task rest session             trials (Fig. 6c, ps ≥ 0.13). In summary, applying the frequency
(see Methods). As shown in Fig. 6, the frequency spectrum                       spectrum analyses to post-task resting-state therefore suggests
analyses revealed a significant increase specifically in the power                that (1) task stimuli are reactivated during post-task rest, and (2)
spectrum of the high frequency range (Fig. 6a, F1,94.99 = 6.17, p =             this reactivation happens fast, but (3) appears unspecific and not
0.02 when testing pre- versus post-task data at the predicted                   directly related to the sequences presented more frequently to
frequency of 0.17 Hz, as before). Directly comparing pre- versus                participants during the task.
post-task rest revealed a large power difference at 0.17 Hz, indi-
cative of replayed sequence speeds of 32 ms, as in our fastest
sequence speed condition (Fig. 6b). In addition, we found a                     Discussion
second peak at around 0.04 Hz, indicating long activations of                   Here, we demonstrated that BOLD fMRI in combination with
individual items of several seconds. Thus, post-task rest seemed to             multivariate probabilistic decoding can be used to detect sub-
be characterized by fast sequential reactivations as well as longer             second sequences of closely timed neural events non-invasively in
constant activations. We next asked whether specific sequences                   humans. We combined probabilistic multivariate pattern analysis
that had been experienced slightly more often by participants                   with time course modeling and investigated human brain activity
were more likely to be reactivated than less frequent sequences.                recorded following the presentation of sequences of visual objects
During slow trials, all participants experienced all 120 possible               at varying speeds, as well as activity during rest. In the fastest case
sequential combinations of images. But in addition, each parti-                 a sequence of five images was displayed within 628 ms (32 ms
cipant experienced only a subset of 15 image orders during the                  between pictures). Stimulus sequences were not masked. Even
sequence trials. Hence, image orders experienced in sequence                    when using a TR of 1.25 s, achievable with conventional multi-

NATURE COMMUNICATIONS | (2021)12:1795 | https://doi.org/10.1038/s41467-021-21970-2 | www.nature.com/naturecommunications                                11
ARTICLE                                                                  NATURE COMMUNICATIONS | https://doi.org/10.1038/s41467-021-21970-2

band (MB) echo-planar imaging (EPI), the image order could be                 cortical, and dopaminergic brain structures that support post-
detected from activity patterns in visual and ventral temporal                encoding systems-level memory consolidation66–68,70–72. In the
cortex. Detection of briefly presented sequence items was also                 current study we open the path toward a better understanding of
possible when their activation was affected by interfering signals            the speed and sequential nature of the observed phenomena.
from a preceding or subsequent sequence item and could be                        The fastest sequences studied in our experiments lasted 628 ms
differentiated from images that were not part of the sequence.                and were therefore longer than the average hippocampal replay
Our results withstood several robustness tests, and also indicated            event of about 300 ms, e.g.17. Yet, several factors support the idea
that detection is biased to most strongly reflect the last event of a          that our method is still relevant for the study of replay. First,
sequence. Analyses of augmented resting data, in which neural                 previous studies have shown that a significant proportion of
event sequences occurred rarely, at unknown times, and with                   replay events indeed lasts much longer than 300 ms. Davidson
reduced signal strength, showed that our method could detect                  et al.7 report sequence lengths of up to 1000 ms and the data by
sub-second sequences even under such adverse conditions.                      Kaefer et al.17 indicate that about 20% of events in the hippo-
Moreover, we showed that frequency spectrum analyses can be                   campus are longer than 500 ms. In addition, the median duration
used to distinguish sub-second from supra-second sequences                    of replay events in medial prefrontal cortex (PFC) reported in
under such circumstances. Our approach therefore promises to                  Kaefer et al.17 was 740 ms. This indicates that a significant pro-
expand the scope of BOLD fMRI to fast, sequential neural                      portion of replay events will be covered by our method. Second,
representations by extending multivariate decoding approaches                 our ISI was as fast as 32 ms, which corresponds to the time lag
into the temporal domain, in line with our previous findings54.                between activations reported in magnetoencephalography (MEG)
   Importantly, we applied this method not only to experimen-                 studies (e.g.,47) and therefore might capture the important aspect
tally controlled data, but also used it to ask whether task                   of temporal separation between activation patterns well. Third,
experience might elicit spontaneous replay of sequential stimuli in           while effect sizes showed a pronounced decrease when comparing
post-task resting-state data, as suggested by previous studies, for           the slower conditions (2048 ms: 3.13; 512 ms: 1.36; 128 ms: 0.75,
reviews, see, e.g.33,35,62,63. Indeed, our results indicate that such         for the backwards effect of regression slopes, Fig. 3c, effect sizes
reactivations occur during post-task rest and can be detected                 indicate Cohen’s d), accelerating sequence speeds beyond 128 ms
using the proposed analysis. Our analyses suggest that the reac-              seemed not to be associated with a comparable decrease in effect
tivated sequences were fast and occurred at replay-like speeds,               sizes (64 ms: 0.65, 32 ms: 1.00). This indicates that the sensitivity
similar to the fastest sequence trials used in our task (32 ms                of our methods for even faster event sequences might not be
between activations). Evidence for fast sequential replay was                 catastrophically diminished. Fourth, the sequence duration of
accompanied by a relative increase in power in the slower fre-                628 ms was to a large extent due to the stimulus duration of 100
quency range (peaking at 0.04 Hz). This could reflect an increase              ms. Evidence from previous work using electroencephalography
of slower long-lasting activations, possibly reflecting conscious              (EEG) suggests that the neural response to successive visual sti-
thinking about the task. This supports our conclusion that the                muli is more strongly influenced by the ISI than the stimulus
frequency spectrum of the sequentiality metric is a useful                    duration73,74. Hence, we speculate that our methods may also
approach to detect fast replay and to distinguish it from slow                work in cases with shorter pattern activations and thereby overall
activations. Our analysis did not find any evidence that only those            shorter sequences.
sequences were replayed that were more frequent than others or                   Our results deepen the understanding of our previous
that were presented at a fast speed during the task. Rather, our              findings54 in two ways. First, we provide additional empirical
results suggest that replay seemed to equally involve all stimulus            evidence that our sequentiality analyses based on multivariate
orders. However, it is important to note that our task was not                fMRI pattern classification are indeed sensitive to fast neural
optimized to elicit replay of particular sequences at all. In fact, the       event sequences. To this end, we used an experimental setup
more frequent sequences were arranged such that the same sti-                 where the order of sequential events is known—in contrast to
muli appeared equally often at the first and last position, which              analyses of resting-state data in Schuck and Niv54 where the order
makes it difficult to distinguish them from other sequences.                   and speed of event sequences can only be assumed. Second,
   Of note, replay during post-task rest reflected cortical reacti-            Schuck and Niv54 observed forward-ordered replay. Our present
vations in occipito-temporal brain regions. Given that we were                study clarifies the origins of forward and backward ordering of
not able to decode on-task stimulus representations in the hip-               fMRI activation patterns. We show that probabilistic classifier
pocampus, it remains unclear if reactivations occurred indepen-               evidence in earlier TRs reflects the forward order of the sequences
dently from (task-related) involvement of the hippocampus or if               while this pattern reverses in later TRs. Importantly, we
we were simply not able to detect concurrent reactivation in the              demonstrate an asymmetry in decoding early versus late
hippocampus. This possibility of hippocampus-independent                      sequential events. This can therefore lead fMRI pattern sequences
cortical reactivations raises important questions regarding the               to appear in the reverse order relative to the underlying neural
functional significance of such events. One potential reason why               sequences. This represents a crucial insight, given the different
we found no hippocampus involvement could be that the oddball                 functional roles assigned to forward and backward replay (see
detection paradigm used for slow trials to train the classifiers               e.g.33). We note that future research should be careful when
involved no mnemonic task component, and therefore was not                    interpreting directionality, as the relationship between decoded
suitable to activate the hippocampus. Our previous work54 has                 and true directionality is not straightforward. One approach in
already demonstrated the success of our methods in hippocampal                this context could be to investigate the order of sequence direc-
data. Taken together, our results indicate that our method allows             tion itself. If items appear to be ordered first in direction A, and a
the uncovering of fast task-related reactivations during rest and             few TRs later in direction B, then direction A seems to be the true
highlight the importance of task design for detecting replay in               one. Probabilistic classifiers might prove particularly useful for
humans using fMRI.                                                            such analyses as they make it possible to characterize sequential
   This contrasts with previous fMRI studies in humans (for                   ordering within a single measurement. The origins of this
reviews see, e.g.24,64) that measured non-sequential reactivation             asymmetry are not entirely clear. It seems possible that they
as increased similarity of multi-voxel patterns during experience             reflect the benefits of the last item not being followed by another
and extended post-encoding rest compared to pre-encoding                      activation that could impede its detection. A relation to the
baseline49–51,53,65–69 or functional connectivity of hippocampal,             asymmetric shape of the HRF, to changing HRF variability with

12                NATURE COMMUNICATIONS | (2021)12:1795 | https://doi.org/10.1038/s41467-021-21970-2 | www.nature.com/naturecommunications
You can also read