REPORT ON THE FUTURE USE OF CRITICAL RAW MATERIALS - scrreen
←
→
Page content transcription
If your browser does not render page correctly, please read the page content below
SCRREEN
                      This project has received funding from the
           European Union's Horizon 2020 research and innovation programme
                          under grant agreement No 730227

                      Start date: 2016-11-01 Duration: 38 Months

 REPORT ON THE FUTURE USE OF CRITICAL RAW MATERIALS

                                                          AUTHOR(S):
LUIS TERCERO ESPINOZA, ANTONIA LOIBL, SABINE LANGKAU (FRAUNHOFER ISI)
              ARJAN DE KONING, ESTER VAN DER VOET (LEIDEN UNIVERSITY)
                                                 SIMON MICHAUX (GTK)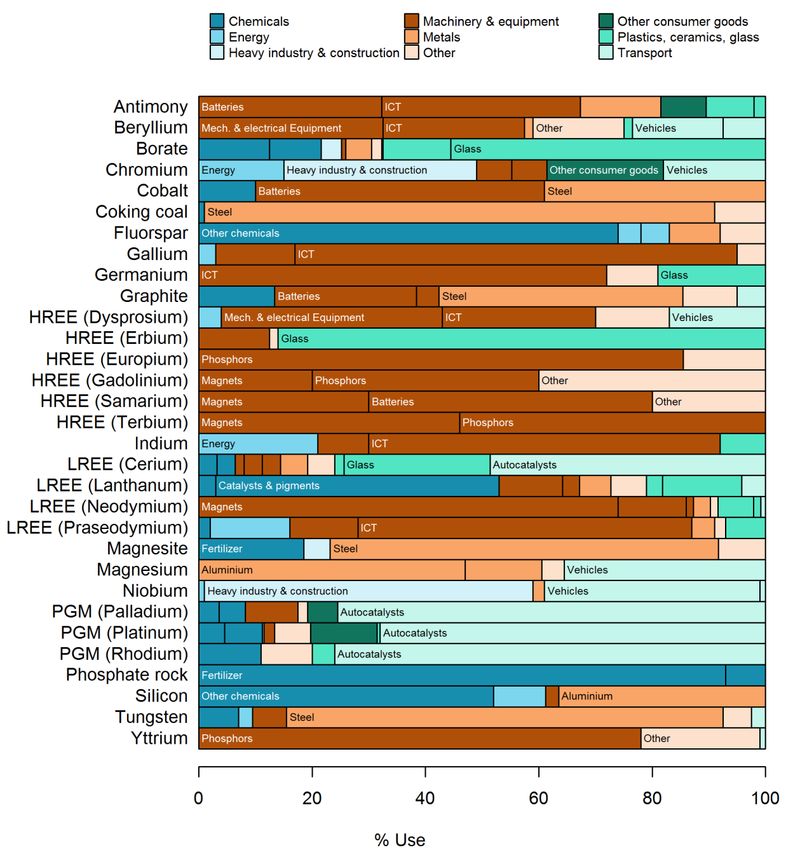
CONTRIBUTIONS
Fraunhofer ISI: Framework of the deliverable, introduction, context of the work, link to WP 2.1 and 2.2, profiles
for cobalt, neodymium, dysprosium, platinum, palladium & rhodium, integration.

Leiden University: Profiles for gallium, indium, niobium, tantalum & tungsten.

GTK: Profiles for barytes, magnesium and phosphate rock.

Special thanks to Dr. M. Tauber of the CRM Alliance for their input to the magnesium profile.

      This project has received funding from the European Union’s Horizon 2020 research and innovation
                                 programme under grant agreement No 730227
                      SCRREEN | D2.3: REPORT ON THE FUTURE USE OF CRITICAL RAW MATERIALS |              2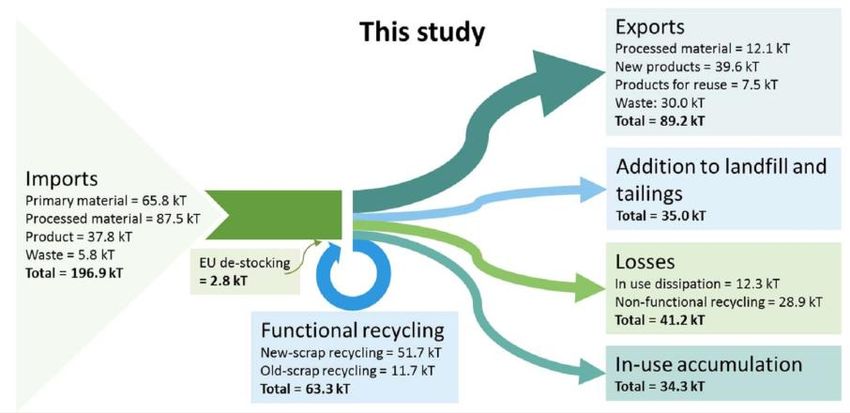
CONTENT

Content ................................................................................................................................................................... 3

Introduction ............................................................................................................................................................ 6

Providing context to the work ................................................................................................................................ 7

   Summary examination of demand change in the past ....................................................................................... 7

   Influence of technological change on changing demand .................................................................................... 9

       Close to stagnation: Silver, platinum and palladium....................................................................................... 9

       Surprisingly slow growth: Lithium and tin..................................................................................................... 11

       Steady increase: Aluminium and copper ...................................................................................................... 11

       Explosive growth: Indium and cobalt ............................................................................................................ 12

Building upon previous results from Work Package 2 .......................................................................................... 14

Future use of critical raw materials in the EU ....................................................................................................... 17

   Barytes (Barite) ................................................................................................................................................. 17

   Cobalt ................................................................................................................................................................ 21

       Current use.................................................................................................................................................... 21

       Future use ..................................................................................................................................................... 23

   Gallium .............................................................................................................................................................. 26

       Current Use ................................................................................................................................................... 26

       Future development of applications ............................................................................................................. 27

       Future use ..................................................................................................................................................... 27

   Indium ............................................................................................................................................................... 28

       Current Use ................................................................................................................................................... 28

       Future development of applications ............................................................................................................. 30

       Future use ..................................................................................................................................................... 30

   Magnesium ....................................................................................................................................................... 31

       Magnesium Use and Application .................................................................................................................. 31

         This project has received funding from the European Union’s Horizon 2020 research and innovation
                                    programme under grant agreement No 730227
                                 SCRREEN | D2.3: REPORT ON THE FUTURE USE OF CRITICAL RAW MATERIALS |                                                          3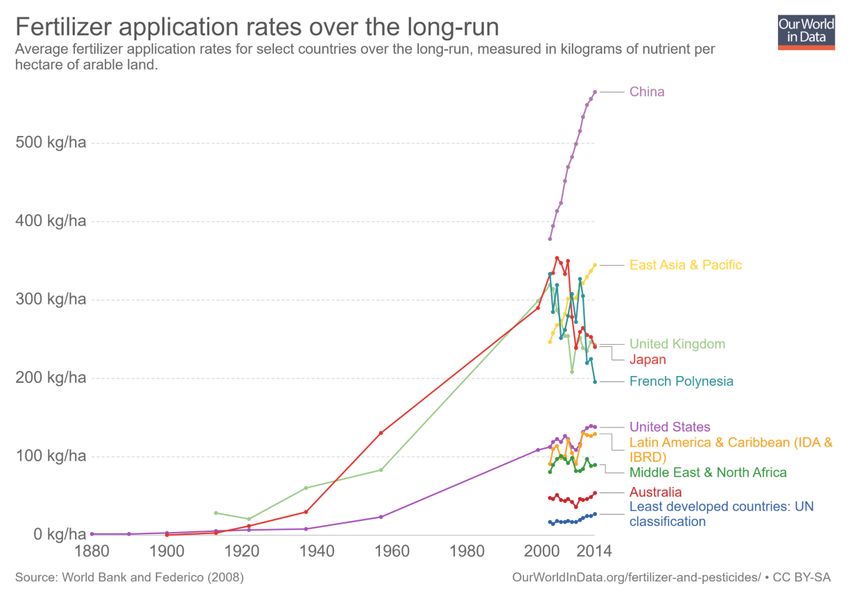
Refined Magnesium Production ................................................................................................................... 33

   Chinese change and enforcement of environmental laws............................................................................ 33

   Recycling of Magnesium Metal in the European Union ................................................................................ 34

   Future demand for magnesium metal use .................................................................................................... 34

Niobium............................................................................................................................................................. 35

   Current Use ................................................................................................................................................... 35

   Future development of applications ............................................................................................................. 35

   Future use ..................................................................................................................................................... 36

PGM: Palladium ................................................................................................................................................. 37

   Current use.................................................................................................................................................... 37

   Future use ..................................................................................................................................................... 38

PGM: Platinum .................................................................................................................................................. 42

   Current use.................................................................................................................................................... 42

   Future use ..................................................................................................................................................... 43

PGM: Rhodium .................................................................................................................................................. 45

   Current use.................................................................................................................................................... 45

   Future use ..................................................................................................................................................... 47

Phosphate rock ................................................................................................................................................. 49

   Use and application of phosphate rock ........................................................................................................ 49

   Demand for and consumption of phosphate rock ........................................................................................ 51

   Projection of future production of phosphate rock ...................................................................................... 52

Rare earth elements: Neodymium .................................................................................................................... 53

   Current use.................................................................................................................................................... 53

   Future use ..................................................................................................................................................... 54

Rare earth elements: Dysprosium..................................................................................................................... 58

   Current use.................................................................................................................................................... 58

   Future use ..................................................................................................................................................... 59

     This project has received funding from the European Union’s Horizon 2020 research and innovation
                                programme under grant agreement No 730227
                             SCRREEN | D2.3: REPORT ON THE FUTURE USE OF CRITICAL RAW MATERIALS |                                                        4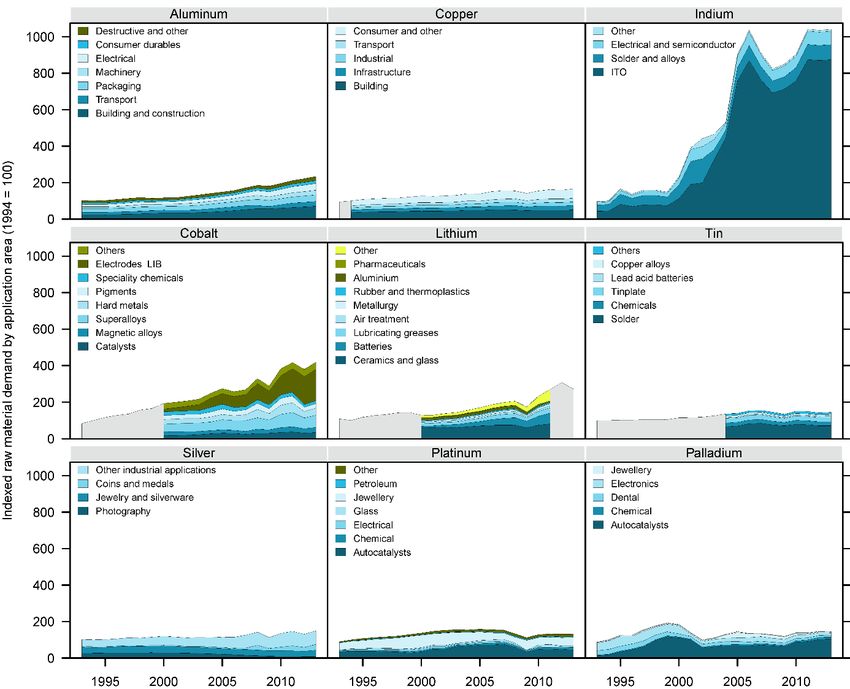
Tantalum ........................................................................................................................................................... 63

       Current Use ................................................................................................................................................... 63

       Future development of applications ............................................................................................................. 64

       Future use ..................................................................................................................................................... 65

   Tungsten............................................................................................................................................................ 66

       Current Use ................................................................................................................................................... 66

       Future development of applications ............................................................................................................. 67

       Future use ..................................................................................................................................................... 68

References ............................................................................................................................................................ 69

         This project has received funding from the European Union’s Horizon 2020 research and innovation
                                    programme under grant agreement No 730227
                                 SCRREEN | D2.3: REPORT ON THE FUTURE USE OF CRITICAL RAW MATERIALS |                                                        5
INTRODUCTION
Ensuring a sufficient raw material supply to meet demand is an economic necessity. In the context of the Raw
Materials Initiative (RMI), the term "critical" is introduced for raw materials that: (1) have a significant
economic importance for key sectors while (2) suffering from high supply risks and (3), for which there is a
current lack of substitutes (Commission of the European Communities 2008). Through a series of exercises
(European Commission 2011, 2014c, 2017a), lists of critical raw materials (CRM) have been prepared for the EU
using two basic methodologies in an effort to provide up-to-date focus points for policy and industry action to
secure the supply of raw materials necessary for the European economy.
Useful for highlighting risks as the CRM lists are, it remains necessary to dive into the individual details of each
raw material market in order to understand the issues and develop adequate risk mitigation strategies at the
appropriate levels (from R&D funding by national governments to product design or short-to-medium term
stockpiling by individual companies). Furthermore, CRM lists are generally data-driven/backward-looking in
their methodology. Therefore, it becomes necessary to supplement lists of CRM with additional, especially
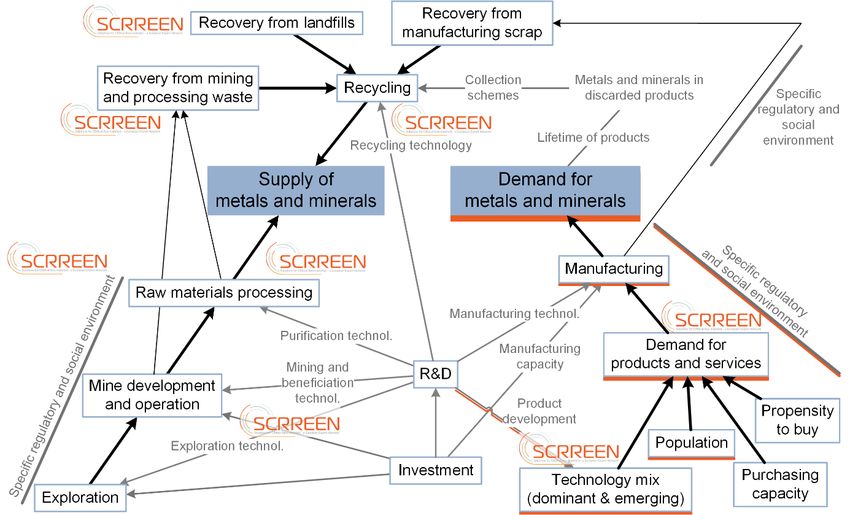
forward-looking information (cf. European Commission 2010, 2014a, 2017b). The Minerals4EU project
prepared a simplified overview of the factors to consider for an understanding/modelling of raw materials
markets and for sketching future raw materials supply and demand (Wittmer & Sievers 2015), as shown in
Figure 1.
Figure 1: Simplified sketch of the dynamic relationships between different aspects of raw materials supply and demand. The Work
Packages of the SCRREEN project are roughly located in the picture. The focus of this report is on the demand of raw materials
(underlined in orange). Figure modified from Tercero Espinoza & Wittmer (2015).
This report is the third and last Deliverable in Work Package 2 and follows both on the work done in
Minerals4EU and that described in D2.1 "Report on the current use of critical raw materials" and D2.2 "Report
This project has received funding from the European Union’s Horizon 2020 research and innovation
programme under grant agreement No 730227
SCRREEN | D2.3: REPORT ON THE FUTURE USE OF CRITICAL RAW MATERIALS | 6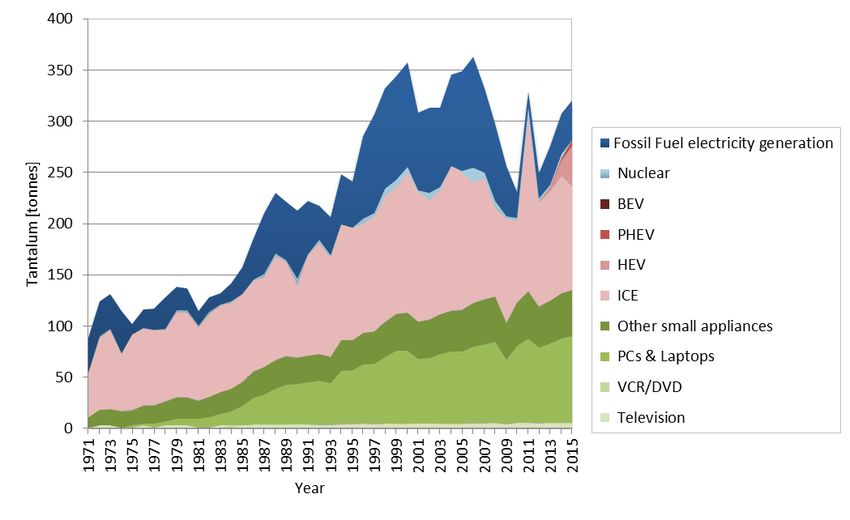
on major trends affecting future demand for critical raw materials" of the SCRREEN project. The objective is to
provide a framework for estimating critical raw material needs for the EU for a time horizon of 10-20 years and
to apply this framework to selected critical raw materials.

PROVIDING CONTEXT TO THE WORK

A variety of factors is known to influence demand for raw materials such that it is not possible to precisely
determine what demand will be in the future. Nevertheless, it is necessary to estimate what developments in
demand or different raw materials are possible and to decide which of these developments need exceptional
action in order to focus political and industrial measures. Delivering on the first point, the generation of
quantitative scenarios for raw material demand (and supply) has become an established tool (Hoenderdaal et
al. 2013; Marscheider-Weidemann et al. 2016; Sverdrup et al. 2015). The second point, i.e. deciding whether a
development is "normal" or "extraordinary", is still an open issue in the literature and work was undertaken
within SCRREEN to close this gap and to better elucidate the different influences that lead to changing demand
for raw materials over time. This work, focusing on metals and published by Langkau & Tercero Espinoza
(2018), is briefly presented below. The limitation to metals follows from practical considerations of data
availability. The relevance of metals as critical raw materials is undisputed; however, the criticality of other
types of raw materials (industrial minerals, biotic materials) is by no means questions by this limitation of
scope.

SUMMARY EXAMINATION OF DEMAND CHANGE IN THE PAST

As sketched in Figure 1, factors such as world population, disposable income, regulations, incentives, policy,
trade regimes, prevalent-technology mix, etc. affect the demand for raw materials in general and for metals in
particular. Many researchers have made the observation ("intensity of use" hypothesis) that the expansion of
manufacturing and construction by industrialization causes the intensity of metal use to rise with GDP in low-
income countries while shifting consumer preferences in higher-income countries cause per-capita demand to
stagnate (Pei & Tilton 1999; Roberts 1990; Stürmer 2013). However, as Crowson (2017) points out, the
intensity of use hypothesis alone is not sufficient to explain development in material demand as it neglects the
influence of technological change. Especially in the case of metals, the influence of technological change in
end-use applications may also be significant and has gained particular attention. In particular, an exceptional
increment in demand due to emerging technologies is considered likely for the so-called "technology metals"
(e.g. indium, germanium, gallium, rhenium, selenium or rare earths; Blagoeva et al. 2016; Hoenderdaal et al.
2013; Marscheider-Weidemann et al. 2016; Moss et al. 2011; Moss et al. 2013).

In addition to the emergence of new technologies (including their invention, innovation and diffusion),
continual improvement of technologies is a constitutive part of technological change (Pei & Tilton 1999).
Continual improvement of production technologies is generally connected with a decrease in costs (e.g. for
labour, energy, material), which tends to make products less expensive and more accessible to consumers,
possibly leading to higher overall demand. In the case of improved material efficiency, a decrease in metal
demand could be expected but this may be counteracted or even overcompensated by increased demand for
the (now cheaper) products—the so-called "rebound effect" (Pfaff & Sartorius 2015). Furthermore,
technological change (in the shape of emerging technologies as well as continually improved technologies) also
includes enhancements of recycling and other aspects of a circular economy, which lead to a reduced primary
demand for materials. Finally, new technological developments do not necessarily mean their raw material

      This project has received funding from the European Union’s Horizon 2020 research and innovation
                                 programme under grant agreement No 730227
                      SCRREEN | D2.3: REPORT ON THE FUTURE USE OF CRITICAL RAW MATERIALS |              7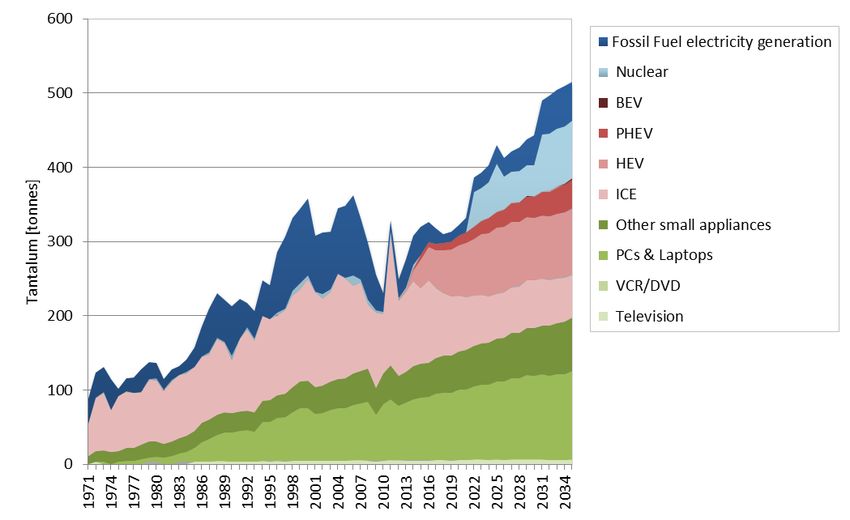
requirements are additive to that of established applications. Instead, the introduction of new technologies can
also result in the substitution of an established technology, possibly shifting raw material requirements to a
different set of raw materials.

Consequently, technological change can have increasing effects on demand for some materials and, at the
same time, decreasing effects for others. Therefore, a better understanding of the development of metal
demand over time requires a combination of aspects of GDP growth, changes in consumer preferences and
gradual as well as radical technological change. As a first approach to examine all factors at once, the relative
change in global primary production for 30 metals over 21 years (1993–2013) is shown in Figure 2 as a proxy for
demand development within this period.

Figure 2: Relative increase in primary production of 30 metals. Units: t = metric tons, kt = thousand metric tons, Mt = million metric tons,
Gt = billion metric tons; GDP growth in constant 2010 US$. Figure taken from Langkau & Tercero Espinoza (2018).

Examination of Figure 2 reveals that, while primary production for none of the metals has decreased, the
degree of increase is largely variable: from essentially zero (Be) to more than 500 % of the original level (In and
Co) while the world economy grew to approximately 180 % of its level in the time period considered. The
histogram on the right of Figure 2 shows the count of raw materials falling in each interval.

Half of the metals (15 of the 30 metals considered) increased to less than 200 % of their total production in
1993 by 2013. Therefore, they increased in a similar manner to GDP or less than GDP. Note that this group

       This project has received funding from the European Union’s Horizon 2020 research and innovation
                                  programme under grant agreement No 730227
                           SCRREEN | D2.3: REPORT ON THE FUTURE USE OF CRITICAL RAW MATERIALS |                                  8
comprises metals with a total primary production ranging from small (< 10 kt) over medium (< 1 Mt) to large (> 1 Mt) total size. The same is to be noticed for the 15 metals that experienced significantly stronger growth than GDP (intensity of use above 1). However, for all five metals having a ratio of demand2013/demand1993 of about or more than 400 % (tantalum, bismuth, niobium, cobalt and indium), the total primary production is
Figure 3: Demand trends for selected raw materials. The numbers for aluminum, copper, indium, tin and silver include demand for both
primary and secondary material (i.e. including recycling of old and new scrap) whereas the numbers for cobalt, lithium, platinum and
palladium are for primary material only. Figures for platinum and silver only cover physical demand for industrial applications. Figure
taken from Langkau & Tercero Espinoza (2018).

Similarly, physical demand for industrial applications for Pt and Pd increased only by ≈ 50 and 70 %,
respectively, between 1993 and 2013. There are at least two important factors to consider when putting these
numbers into context. First, Pd can substitute for Pt in different applications, though generally at the expense
of performance. Since Pt is more expensive, there have been extensive attempts to reduce the demand for Pt
by using the less expensive Pd in various ways and with different success for decades. Second, the high price of
Pt and Pd is a strong incentive for promoting efficiency (reduced material intensity per unit) and recycling. As a
result, growth in most applications for both Pt and Pd ranges from contracting (e.g. dental and electronic uses)
to essentially stagnating (jewellery, electrical uses). Only demand for Pt and Pd for catalysts increased more
than overall economic growth. The single most significant driver of demand increase for Pt and Pd in the period
under consideration was, therefore, autocatalysts.

The impact of recycling becomes clear when comparing the development of demand with and without the
demand for secondary supplies (Johnson Matthey 2018a). When considering the demand for primary
production only, the demand of Pt and Pd for catalysts in 2013 appears to be 340 % of the demand in 1993.

       This project has received funding from the European Union’s Horizon 2020 research and innovation
                                  programme under grant agreement No 730227
                          SCRREEN | D2.3: REPORT ON THE FUTURE USE OF CRITICAL RAW MATERIALS |                               10
Including demand for recycled supplies, however, leads to a ratio of demand2013/demand1993 = 420 %, i.e.
recycling significantly mitigated the increase in demand for primary material.
SURPRISINGLY SLOW GROWTH: LITHIUM AND TIN
It appears initially surprising that overall Li demand “only” doubled between 1993 and 2013. This is especially
surprising when considering that lithium ion batteries (LIB) became dominant for portable electronic devices
within this period and that a LIB contains approx. 4 % Li by weight (TUBAF 2013), which led to an increase in
demand for this application by a factor of ⪆ 7 between 2000 and 2011. However, not all end-use applications
of Li grew in a similar manner in the period under consideration. Noteworthy is the almost 5-fold increase in
the “other” category, which unfortunately cannot be elucidated further. The use of Li in pharmaceuticals also
increased significantly (demand2011/demand2000 > 4.5), but this end-use only accounts for ≈ 1 % of Li use and is
therefore insignificant for overall demand. The remaining end-use categories grew in an average manner
(1.3 ⪅ demand2011/demand2000 ⪅ 2) in the period 2000–2011, with the exception of aluminium, which shrunk
to ≈ 1/5 of the original level. Therefore, the majority of Li demand did not grow as fast as the demand for LIB
and this is why the widespread adoption of LIB did not yet lead to exceptional growth for overall lithium
demand.
The demand for tin grew only modestly in the period 1993–2013. This is surprising because, first, the major
application of tin is in lead-free solders (for general applications and microelectronics) and the prohibition of
lead in solders has increased the weight of tin in solder from about 60 % to 97 % in Europe. Yet, Sn demand for
solders remained about constant in the period under consideration.
There are two plausible reasons for this: miniaturization in electronics and material efficiency increase in
soldering techniques. Miniaturization in electronics has led to higher performance per chip, thereby reducing
the demand for solders. Furthermore, an increasing market share of surface mounted technology (SMT) versus
through-hole technology (THT; Marscheider-Weidemann et al. 2016) has also diminished demand for solders.
Altogether, tin demand for solders increased little even though applications like consumer electronics
experience growth rates above average.
The second reason why the small overall increase in tin demand is initially surprising has to do with displays
and, in particular, the dominant use of indium tin oxide (ITO) as transparent conductive electrode. This,
however, has not significantly influenced demand for tin because the mixed oxide ITO usually comprises about
90 wt% of indium(III)oxide and only 10 wt% of tin(IV)oxide. In addition, total Sn demand is close to 1×10⁶
tonnes, whereas total In demand is well below 1×10⁴ tonnes (we revisit the issue of market size below).
The demand from other tin applications remained approximately constant.
STEADY INCREASE: ALUMINIUM AND COPPER
The overall demand for Al and Cu developed smoothly between 1993 and 2013, with the only noticeable kink in
the curves being tied to the economic and financial crisis in 2009. The ratio of demand 2013/demand1993 is
between 150 and 300 % for all application sectors considered, i.e. there are no application sectors showing
particularly strong growth.
This project has received funding from the European Union’s Horizon 2020 research and innovation
programme under grant agreement No 730227
SCRREEN | D2.3: REPORT ON THE FUTURE USE OF CRITICAL RAW MATERIALS | 11With the high total demand and production of these metals and their distribution over a broad range of
applications, demand for these metals for special and emerging applications is generally small in comparison to
total demand and therefore not significant for the development of overall demand. This holds true even when
considering the widespread adoption of material intensive technologies such as electric vehicles, as illustrated
in Figure 4 for Cu and Li, two raw materials associated with the “technology” electric vehicles. Though the raw
material demand per vehicle is lower for Li than for Cu, the Cu market is three orders or magnitude larger than
the Li market. Consequently, regardless of the market penetration scenario for electric cars and assuming LIB
will remain the preferred battery technology in the foreseeable future, the widespread adoption of electric
vehicles will more markedly define the Li market. Therefore, it becomes evident that smaller markets are more
prone to disruption by the (rapid and) widespread introduction of new technologies by virtue of their market
size alone.
Figure 4: Historic primary supply and expected demand
for copper and lithium for (electric) vehicles. Two
scenarios for the market penetration of electric vehicles
are considered: “strong” and “weak”. Figure taken from
Langkau & Tercero Espinoza (2018).
EXPLOSIVE GROWTH: INDIUM AND COBALT
Indium and cobalt both experience a more than fivefold growth in (primary) production between 1993 and
2013. In the case of indium, this growth was driven by applications of ITO in displays and thin film solar cells.
The requirement of a transparent and conductive material makes ITO difficult to substitute in these
applications, and the rapid spread of flat screen TVs and portable electronic devices has been enough to
fundamentally change the indium market in a very short period. Notice also that the increase in indium
demand depicted in Figure 3 is almost twice the increase in primary production shown in Figure 2. This
difference is due to the extensive recycling of the ITO sputtering targets, contributing an estimated 3/4 of the
indium used for ITO applications (Licht et al. 2015). In contrast, recycling of indium from post-consumer scrap is
currently negligible (UNEP 2011).
Similar to indium demand, the rise in cobalt demand was due to a specific emerging technology: lithium-ion
batteries (LIB). LIB using LiCoO2 as cathode material enabled the breakthrough of portable consumer
electronics like mobile phones and laptops. This is still the most widespread electrode material in lithium-ion
batteries for consumer electronics. The cobalt demand for this technology alone increased to > 1100 % of its
This project has received funding from the European Union’s Horizon 2020 research and innovation
programme under grant agreement No 730227
SCRREEN | D2.3: REPORT ON THE FUTURE USE OF CRITICAL RAW MATERIALS | 12level in 2000 by 2013. This increase is higher than that for lithium because there is more cobalt than lithium in
a LIB (approx. 11 % Co by weight vs. 4 % lithium) while the markets are of similar "size"/tonnage. All other Co-
applications have a ratio of demand2013/demand2000 of 80–200 %.
This project has received funding from the European Union’s Horizon 2020 research and innovation
programme under grant agreement No 730227
SCRREEN | D2.3: REPORT ON THE FUTURE USE OF CRITICAL RAW MATERIALS | 13BUILDING UPON PREVIOUS RESULTS FROM WORK PACKAGE 2
The aim of WP2 is to provide an overview of present and future (time horizon: 2035) CRM markets in Europe.
The starting point is the CRM list published in 2014, accommodating new CRM from the list published in 2017
as possible in the allotted time and budget. The first building block in this endeavour is a systematic overview
of current use of CRM in the EU. This was provided in D2.1 "Report on the current use of critical raw materials"
(Deetman et al. 2017a), a summary of which is shown in Figure 5.
Figure 5: Summary of CRM use in the EU. Data from D2.1 by Deetman et al. (2017a).
This project has received funding from the European Union’s Horizon 2020 research and innovation
programme under grant agreement No 730227
SCRREEN | D2.3: REPORT ON THE FUTURE USE OF CRITICAL RAW MATERIALS | 14The second building block in WP2 is a systematic overview of trends affecting the future use of CRM in the EU.
This is provided in D2.2 "Report on major trends affecting future demand for critical raw materials" by Ait
Abderrahim & Monnet (2018). Since such trends are inherently independent of the raw materials they affect,
an approach based on industrial applications and sectors was preferred to addressing this topic CRM-by-CRM.
The multilevel perspective (MLP; Geels 2002) was chosen as a conceptual framework and the identification of
drivers was aided by the use of the PESTEL (political, economic, social, environmental, legal) framework, as
sketched in Figure 6.
Figure 6: From the multilevel perspective (MLP) through the PESTEL framework to expected impacts on future demand of critical raw
materials in Europe.
The selection of technologies to cover attempted to include the majority of CRM use in Europe. In the end, this
study covered 12 applications involving 20 CRMs. 5 CRMs have been covered not for their main applications (B,
Ba, Hf, W, V) but because they are involved in the main application of other CRMs. As a result, the study covers
a low share of their consumption. The coverage rate (percentage of current EU apparent consumption covered
in the study) for natural graphite is also low but the reason is different: the applications involving this CRM are
emerging and the future requirement for these applications are expected to exceed the total current
consumption by 2035. The other 14 CRMs covered have a high average coverage rate. Figure 7 shows a
graphical summary of the trends identified for all 12 applications.
Based on literature review, a reference scenario including quantitative data was provided for each application
and more than 70 drivers helped to qualify the trends and their potential future evolution. Finally, D2.2
provides a synthesis of these drivers by sector. Briefly:
• Energy: The development of wind power (involving REE) and domestic energy storage (mainly
cobalt and natural graphite) are expected to drive up CRM demand in the coming decades.
Conversely, the demand related to the deployment of PV panels (mainly silicon, indium and
gallium) should become less critical by 2035, especially thanks to improvement in material
efficiency. Important drivers to monitor in this sector include policies to further reduce CO 2
emissions, incentives for distributed power generation, power and storage requirements related
to the deployment of EVs.
This project has received funding from the European Union’s Horizon 2020 research and innovation
programme under grant agreement No 730227
SCRREEN | D2.3: REPORT ON THE FUTURE USE OF CRITICAL RAW MATERIALS | 15Figure 7: Summary view of trends affecting the use of CRM in Europe in selected applications as identified in D2.2 using the PESTEL
framework. The number of arrows denotes the strength of the trend, from weak (one arrow) to strong (three arrows). The colour of the
arrows corresponds to their degree of certainty (light colour = low certainty, dark colour = high certainty). Some trends have an unclear
effect on CRM use in the selected applications; these are marked with an up/down-arrow (↕).
• Transport: The need to decarbonize mobility and reduce air pollution is closely tied to the
emergence of hybrid and electric vehicles and the persistent dependence on autocatalysts for ICE
vehicles. The deployment of EVs is expected to drive most of the growth of CRM requirements
(mainly REE, cobalt and natural graphite) in this sector by 2035. The search for more performant
materials to replace existing ones, especially in terms of weight and performance in extreme
conditions (ceramics for jet engines, Al-based alloys for car bodies), should also impacts the
sector: Ta, Mg, Nb are the main CRMs concerned. Finally, the increasing demand for mobility,
especially in emerging countries, and newer forms of mobility (mobility as a service, MaaS), are
not to be overlooked.
• Telecommunication and electronics: The global expansion of digital networks and services implies
that more people have access to the internet, thus fuelling the need for connected equipment and
fibre optics that Europe could produce and export. Therefore, the demand of CRMs in this sector
should either level off (indium for screens) or keep increasing (REE, Ta, Pd for electronic devices &
appliances, Ge for optic fibres). Important drivers to monitor in the future include miniaturisation
of components, measures against planned obsolescence and restrictions on exports of e-waste. In
addition, the search for more performant and cheaper materials or components of electronic
appliances fosters substitution, making future demands more unpredictable in the sector.
• Agriculture: Global population growth (moderate in Europe) will foster the need for a more
efficient agriculture, thus increasing reliance on fertilisers and potentially encouraging European
exports. At the same time, various sources of phosphorous are likely to be considered (animal
manure, but also sewage sludge and food waste chain) to reduce dependence on phosphate
rocks. At last, the emergence of precision farming, helped by new technologies, might improve
the efficiency of the use of fertilisers, in a context where agriculture tries to reduce its
environmental footprint.
This project has received funding from the European Union’s Horizon 2020 research and innovation
programme under grant agreement No 730227
SCRREEN | D2.3: REPORT ON THE FUTURE USE OF CRITICAL RAW MATERIALS | 16FUTURE USE OF CRITICAL RAW MATERIALS IN THE EU
The aim of Work Package 2.3 is the combination of information about historic and current uses of CRMs in the
EU (WP 2.1) with the analysis of major trends in their future demand (WP 2.2) to develop projections for future
demand in the EU until 2035 across their individual main applications (Ait Abderrahim & Monnet 2018;
Deetman et al. 2017a). Intending to show the potential of this method with a broad overview over different
materials, applications and trends, a variety of raw materials were chosen according to the following criteria:
Supply of the raw material is considered critical by the EU and therefore it is part of the CRM list of
2014 or 2017 (European Commission 2014a, 2017b)
Demand of the raw material is influenced by at least one of the applications analysed in WP 2.2
Raw materials affected by more than one major trend (WP 2.2) were given priority
Raw materials with applications that cover a high percentage of their overall demand today and are
impacted by a major trend were prioritized for analysis
Raw materials with applications expected to grow quickly into dominating the overall demand in the
near future were prioritized.
Using these criteria, the following raw materials were chosen for further analysis: Barytes, cobalt, gallium,
indium, magnesium, niobium, the platinum group metals (PGM) palladium, platinum and rhodium, phosphate
rock, the rare earth elements neodymium and dysprosium, tantalum and tungsten.
BARYTES (BARITE)
Applications of barite are spread across multiple industries, with the dominant application being in the oil and
gas industry as a lubricant in drilling. The unique properties of barite make it useful in several other
applications:
filler in paint and plastics
production of lithopone
getter (scavenger) alloys in vacuum tubes
deoxidizer for copper
lubricant for anode rotors in X-ray tubes
spark-plug alloys
a high-quality white pigment that is added to paints and some enamels
finely ground barite is added to synthetic rubber to incorporate the rubber into hot asphalt, typically
used in high-traffic areas such as parking lots.
elemental barium is an additive in optical glass, ceramic glazes
Barite has the unique ability to strongly absorb x-rays and gamma rays (is opaque to ionizing radiation).
Consequently, it is used in medical science for special x-ray tests on the intestines and colon. Global barite
resources are abundant and distribution is relatively concentrated. To have potential commercial value, barite
must meet certain criteria. For example, barite used in drilling fluids must have a minimum specific gravity of
4.2, which limits the amount of contaminants permissible in the concentrate, or the proportion of celestite in
solid solution or physical mixtures. There are also government regulatory restrictions imposed on the
concentrations of deleterious or toxic elements such as lead (Pb), cadmium (Cd) or mercury (Hg), and these
This project has received funding from the European Union’s Horizon 2020 research and innovation
programme under grant agreement No 730227
SCRREEN | D2.3: REPORT ON THE FUTURE USE OF CRITICAL RAW MATERIALS | 17limits vary according to jurisdiction. Pharmaceutical and medical applications commonly demand exceptional
purity (> 97.5% BaSO4) and low levels of heavy metals and other impurities.
In response to concerns about dwindling global reserves of 4.2-specific gravity barite used by the oil and gas
drilling industry, the American Petroleum Institute issued an alternate specification for 4.1-specific gravity
barite in 2010. This has likely stimulated exploration and expansion of global barite resources. In 2017, global
barite reserves were 290 million tons, of which China, Kazakhstan, Turkey, India, and Iran accounted for 73.4%.
Europe has gathered the world's largest paint, polymer, and automakers, so it is likely to continue to be the
world's largest non-drilling-level barite consumer zone in the future. In 2017, global barite mining production
was 6.38 million tons. When considering barite reserves suitable for use in drilling fluids, there are relatively
few major sources with China, India, the US and Morocco, Mexico and Turkey accounting for about 80% of
global production. The USA was the largest consumer at around 2.6 million tpa in 2017 - China consumed
1.6Mt and the Middle East 1.4Mt. In the USA over 95% barite output was for the oil industry consumption
(Merchant Research & Consulting 2018). Most of China's barites are exported in the form of crude ore and
barium salt products. The main target countries are the United States, Saudi Arabia and the Netherlands.
Barite's international trade flow has always been China to the Gulf of Mexico; China is the world's largest barite
exporter. The United States is the world's leading barite importer (related to the oil & gas drilling industry).
Europe consumption (including Norway and Turkey) was around 0.65 million tpa of which 72% was sourced
domestically. Approximately 70% of barite production was into added-value markets so a significant proportion
is an export net value, and a higher proportion of the oil-well industry requirement imported. Germany,
Bulgaria and UK account for over 90% of the EU-27 output. Approximately 70% European domestic production
is for added value in production sectors. For example, overall the chemical and filler industries account for half
of the barite consumption.
The increasing of, or slowing of oil and gas production will determine the changes of global barite market.
China and India are projected to continue to be the largest suppliers of barite post 2018. Diversification of
barite supply is predicted as many new projects (in China and India) are being developed.
Several driving forces influence demand for barite mineral. The bulk of the barite market has been linked to
growing demand for oil drilling and filler applications but world recession has hit the automotive industry.
Barite demand will not be bullish until there is a strong growth in the need for more drilling in the oil & gas
industry. Chemical demand has fallen due to a dramatic switch to LCD/plasma TV and computer screens, which
use less barite, but applications in the dielectrics, electro-ceramic and construction industry have risen. It is
unclear how these technologies will project into the future.
In geotechnical engineering, drilling fluid is used to aid the drilling of boreholes (liquid drilling fluid is often
called drilling mud). This is done for a series of applications like mineral exploration or used while drilling oil
and natural gas wells. Drilling fluids are also used for much simpler boreholes, such as water wells. Various
kinds of lubricants or drilling muds, such as water-based drilling muds (WBs), oil-based drilling muds (OBs) are
used to make the process more efficient and effective. The petroleum industry is, by far, the largest consumer
of barite (roughly 85% of global consumption in 2017) and uses it primarily as a weighting agent in drilling muds
utilized in drilling for oil and gas. The tight oil (fracking) industry in particular as a much higher rate of drilling
is required to maintain production compared to conventional oil and gas operations. Figure 8 shows the
consumption of barite globally correlates with the rig count in the oil and gas industry. Thus to understand the
barite market, one must understand the oil gas industry needs for drilling. World production is broadly linked
to oil-well drilling activity and has increased from 6.0- 6.5Mtpa in the early 2000s to 9.7Mt in 2014 - but fell to
This project has received funding from the European Union’s Horizon 2020 research and innovation
programme under grant agreement No 730227
SCRREEN | D2.3: REPORT ON THE FUTURE USE OF CRITICAL RAW MATERIALS | 188Mt in 2015 and to 7.3Mt in 2016 as a result of low oil prices and reduced drilling activity – but recovered to a
preliminary estimate of 8.7Mt in 2017.
Figure 8: Barite world production, and total drill rig count (Baker Hughes 2017; USGS 2018a).
Barite prices remained relatively steady until approximately 2006/2007 relative to 1995 dollars, after which
they increased rapidly until around 2012 and have currently fallen back slightly in 2014, but still some 200%
above the inflated 1995-dollar base. The sharp increase of barite market price resulted from a number of
factors including rationalisation and consolidation of the Chinese barite mines, in addition to highly intensified
US onshore drilling for tight oil and gas, which placed further pressure on suppliers.
The global barite industry share was consolidated in 2016 as leading operators in the barite market accounted
for over 55% of the market share in the same year. These operators continue to make heavy investments to
upgrade their plant facilities to enhance production capacity and attain competitive advantage in the industrial
mineral business. This basic pattern of supply and demand is basically stable and is unlikely to change in the
next few years. The major players are adopting key strategy like partnerships and agreements in order to
reduce gap between supplier and manufacturer of barite. Apart from that, various key strategies adopted by
key players are expansion and acquisition. Advancement in technology and increasing presence of significant
players has positively influenced the growth of the barite market. Moreover, market leaders in 2016/2017
expanded their production facility to meet global demand and obtain competitive advantage in the market.
Consolidation of market share seems to be the goal ahead of a perceived increase in demand associated with
the oil & gas industry.
Grades above 4.3 SG density barite market size is likely to grow at a compound annual growth rate (CAGR)
close to 3% owing to rapidly growing rubber, plastic, paints & coatings industry in the near future. In addition,
higher-grade barite is attained from deeper earth crust and henceforth is priced higher than lower grade barite
and is likely to make prominent contribution to market size in the coming years. Lower grade barite including
grade 3.9 SG density to grade 4.2 SG density finds application in oil & gas drilling industry, where grade 4.2 SG
density is considered optimum for oil & drilling application as per the American Association of Drilling
Engineers. Rapid pace of shale gas production in the U.S. due to reserves availability along with dire need to
This project has received funding from the European Union’s Horizon 2020 research and innovation
programme under grant agreement No 730227
SCRREEN | D2.3: REPORT ON THE FUTURE USE OF CRITICAL RAW MATERIALS | 19shift industry focus to unconventional energy sources has propelled grade 4.2 SG density demand as weighing
agent, which in turn will have positive impact on the barite market size in the coming years.
Figure 3: Projection of future U.S. crude oil production (Energy Information Agency 2014, 2018).
Barite market size for oil & drilling is expected to grow at a CAGR close to 4.5% in the coming years. In addition,
the product market for pharmaceuticals finds widespread applications as diagnosis materials for stomach &
intestine as well as for filling plaster to extend its time limit. Global barite market size for paints & coatings is
projected to grow at a CAGR of over 3.5% in the coming years. This is due to rapid pace of paints & coatings
industry, which is attributed to strong urbanization and industrialization primarily in the emerging economies.
Barite market size for rubber & plastic is anticipated to grow at a CAGR close to 3% owing to positive growth
indicators in the automotive industry primarily in the Asia Pacific due to improving socio-economic factors.
The Asia Pacific barite market size is the fastest growing segment and is anticipated to grow at a CAGR of over
7% during the forecast period. This is primarily due to large amount of shale reserves available in China to meet
energy demand across various end-user industries including power, automotive, etc. in the region. For
instance, China accounts for over 720 billion tons of shale resources, which are likely to be produced in the
coming years and henceforth will drive market by 2024. Furthermore, rapid industrialization and urbanization
has led to strong growth indicators in the paints & coatings industry, which will further boost the regional
barite market size over the projected time spell.
This shifting market focus to use unconventional energy sources to meet demand across various end-user
industries including automotive, power, household, etc. has led to rising product global demand by 2024
(Global Market Insights 2016).
This project has received funding from the European Union’s Horizon 2020 research and innovation
programme under grant agreement No 730227
SCRREEN | D2.3: REPORT ON THE FUTURE USE OF CRITICAL RAW MATERIALS | 20COBALT
CURRENT USE
Cobalt has diverse areas of use: Metallurgical applications such as superalloys for aeronautics, gas turbines or
carbon capture and storage, hard metals for tooling and magnetic alloys as well as chemical applications such
as catalysts, pigments and other specialty chemicals like tyre adhesives, soaps, paint driers and feedstuffs.
Additionally, cobalt is used in rechargeable lithium ion batteries (LIBs) which are commonly used in
smartphones, tablets and laptops but also more and more in the emerging technologies of electric vehicles and
domestic energy storage. On a global scale, cobalt demand for LIBs has displayed a rapid and massive growth
from 3 kt (8% of global cobalt use) in 2000 to 54 kt (46%) in 2017 (Cobalt Institute 2017, 2018b) and is expected
to continue this trend in the future. Also for Europe, all three of those LIB application sectors have been
identified within WP2.2 as causes for major changes in raw material demand during the next decades.
Furthermore, also the sector of jet engine production is expected to undergo major changes which is relevant
for the demand of cobalt containing superalloys (Ait Abderrahim & Monnet 2018).
Historic data on cobalt production as well as shares of demand by application sectors is available for 2000-2017
on a global scale (Cobalt Institute 2018a, 2018b; Kühn & Glöser 2013). Information on European cobalt
consumption is scarce and significantly less reliable. Total demand for cobalt within the EU is assumed to be
between 10-30 kt (Bio by Deloitte 2015; European Commission 2017b). For the distribution of cobalt demand
by the European industry on the application sectors, two relatively different data sets were found (Figure 9). An
MSA study for 2014 shows a strong emphasis on metallurgical applications in Europe with 44% of cobalt going
into superalloys and 31% into hard metals. Chemical applications only play a minor role with 17% for pigments,
5% for catalysts and only 3% for LIBs. Cobalt containing magnetic alloys and specialty chemicals do not
significantly contribute to European cobalt demand according to this study. The total European cobalt demand
was calculated to have been approximately 13 kt (Bio by Deloitte 2015). On the other hand, a more recent
industry survey by the Cobalt Institute (CI, formerly CDI, Cobalt Development Institute) shows with 55% a very
strong contribution of specialty chemicals to the overall European cobalt demand. Additionally the other
chemical applications of catalysts and pigments contribute with further 8% and 1% each. Metallurgical
applications are less significant in Europe with 12% of the total cobalt demand from hard metals, 8% from
superalloys and 6% from magnetic alloys according to this CI study (CoRC-CDI 2017). A number on the total
amount of European cobalt demand was not known from this survey. For the 2017 criticality assessment of
cobalt, the Cobalt Institute made an estimation of 10.5 kt for the apparent cobalt consumption of the EU
(European Commission 2017b).
Both datasets can be disputed. The statement in the MSA study of Europe with its strong chemical industry not
having a significant contribution to cobalt demand from the specialty chemicals sector should be scrutinized.
The CI dataset however, has such a high share of specialty chemicals that the resulting amount of chemicals
produced in the EU is higher than the amount produced globally. To the best of our knowledge, this might be
attributed to the methodology of the survey. Companies have been asked for the amount of cobalt they
process for each application per year and all answers were then summed up. However, some cobalt might go
through several steps of processing in different companies, which would lead to double entries distorting the
results in this approach. In the following analysis of European cobalt demand, the dataset from the MSA study
was used since it was also used within the criticality assessment of cobalt for the EU. Additionally, the logic of
This project has received funding from the European Union’s Horizon 2020 research and innovation
programme under grant agreement No 730227
SCRREEN | D2.3: REPORT ON THE FUTURE USE OF CRITICAL RAW MATERIALS | 21data analysis in this report does not allow for discrepancies between European and global consumption data as
were observed for the CI dataset.
Figure 9 : Comparison of two available datasets for the distribution of cobalt demand on different application sectors within European
industry. (Bottom) The MSA study for cobalt flows in the EU was conducted for the year 2012. Shown here are the shares of finished
products containing cobalt manufactured in the EU (Bio by Deloitte 2015). (Top) In 2017, the Cobalt Institute (CI) collected data from
European industry on cobalt flows within the different application sectors (CoRC-CDI 2017).
With data on European cobalt consumption only available for a single year, two assumptions had to be made.
First, the share of European cobalt demand on the global amount was set to be at a constant 17% as it has
been in the data year of 2012. Secondly, the application shares for European cobalt consumption were
assumed constant. As a result, the historic development of European and global cobalt consumption divided by
sectors is derived. Furthermore, we sought to highlight the similarities/differences between Europe and the
overall global uses of cobalt so the difference between global and European cobalt demand is shown as
demand by the rest of the world (RoW, in Figure 10).
Figure 10 : (Left) Historic cobalt demand 2000-2017 split into its main application sectors and shown for Europe (shades of blue) and the
rest of the world (shades of green). (Right) Comparison of shares in total cobalt demand for each application in 2017 (last data year) at
the global (orange, "World) and European (blue) levels, and for the Rest of the World (green, "RoW"). Demand estimates for the RoW
were constructed by subtracting European demand from global demand for each sector.
This project has received funding from the European Union’s Horizon 2020 research and innovation
programme under grant agreement No 730227
SCRREEN | D2.3: REPORT ON THE FUTURE USE OF CRITICAL RAW MATERIALS | 22Overall, global cobalt consumption has tripled from 39 kt to 117 kt in the shown timeframe of 2000-2017. Most
applications have been growing moderately but consistently. Only cobalt use in pigments has been almost
stagnant while the amounts of cobalt contained in specialty chemicals and other uses have been decreasing.
The LIB sector on the other hand has displayed a rapid, strong growth from 3 kt of cobalt demand in 2000 to
54 kt in 2017. In 2017, total cobalt demand consisted of 46% from LIBs, 17% from superalloys, 14% from hard
metals, 7% from catalysts, 5% for magnetic alloys and pigments each and 3% each for specialty chemicals and
other uses.
For Europe, the application sector contributions to cobalt demand are 44% from superalloys, 31% from hard
metals, 17% from pigments, 5% from catalysts and 3% from LIBs. Since the share of European cobalt
consumption on the global demand had to be assumed as constant for lack of further data, it increased at the
same rate as the global consumption from almost 7 kt in 2000 to 20 kt in 2017.
FUTURE USE
In order to develop a projection of cobalt use until 2035, historic data for the sectors of catalysts, magnetic
alloys, hard metals, pigments, specialty chemicals and other uses has been extrapolated. Superalloys containing
cobalt are used for jet engine production, which is a major driver for material demand in the EU during the next
decades according to D2.2. However, the share of cobalt in superalloys going into jet engines was below 1% in
2012 and will stay below 1% until 2035 (Ait Abderrahim & Monnet 2018). Therefore, data for superalloys was
also extrapolated without taking into account specific growth rates for jet engine production. For cobalt used in
LIBs, the trend analysis for their application in smartphones, tablets and laptops, in domestic energy storage as
well as in electric vehicles from D2.2 was taken and their individual growth rates were summed up into one
weighted growth rate for LIBs. Resulting is a projection for the future cobalt use until 2035 (Figure 11).
Figure 11 : Cobalt demand for the main application sectors with historical data until 2017 (indicated by the dotted line) and a demand
forecast in the timeframe of 2018-2035 shown for Europe (blue) and RoW (green).
This project has received funding from the European Union’s Horizon 2020 research and innovation
programme under grant agreement No 730227
SCRREEN | D2.3: REPORT ON THE FUTURE USE OF CRITICAL RAW MATERIALS | 23You can also read