Study on the Youth Guarantee in light of changes in the world of work
←
→
Page content transcription
If your browser does not render page correctly, please read the page content below
Study on the Youth Guarantee in
      light of changes in the
           world of work
                                                Part 1
  Youth Guarantee: Intervention Models, Sustainability
                    and Relevance

Written by Marco Caliendo, Jochen Kluve, Jonathan Stöterau,
and Stefan Tübbicke with contributions from Claire Dheret,
Kari Hadjivassiliou and Francesco Pastore
November - 2018

                                               Social Europe
The Youth Guarantee in light of changes in the world of work:
Youth Guarantee: Intervention Models, Sustainability and Relevance
EUROPEAN COMMISSION
Directorate-General for Employment, Social Affairs and Inclusion
Directorate B — Employment
Unit B.1— Employment Strategy
Contact: Pablo Cornide
E-mail: EMPL-PES-SECRETARIAT@ec.europa.eu
European Commission
B-1049 BrusselsThe Youth Guarantee in light of changes in the world of work:
Youth Guarantee: Intervention Models, Sustainability and Relevance
Study on the Youth Guarantee
in light of changes in the
world of work
Part 1
Youth Guarantee: Intervention Models, Sustainability
and Relevance
Directorate-General for Employment, Social Affairs and Inclusion
European Network of Public Employment Services (PES)The Youth Guarantee in light of changes in the world of work:
Youth Guarantee: Intervention Models, Sustainability and Relevance
Europe Direct is a service to help you find answers
to your questions about the European Union.
Freephone number (*):
00 800 6 7 8 9 10 11
(*) The information given is free, as are most calls (though some operators, phone
boxes or hotels may charge you).
LEGAL NOTICE
This document has been prepared for the European Commission, however, it reflects the views only of the
authors, and the Commission cannot be held responsible for any use which may be made of the information
contained therein.
More information on the European Union is available on the Internet (http://www.europa.eu).
Luxembourg: Publications Office of the European Union, 2018
ISBN: 978-92-79-99983-3
doi: 10.2767/371432
© European Union, 2018
The European Network of Public Employment Services was created following a Decision of the European Par-
liament and Council in June 20141. Its objective is to reinforce PES capacity, effectiveness and efficiency. This
activity has been developed within the work programme of the European PES Network. For further information:
http://ec.europa.eu/social/PESNetwork.
This publication has received financial support from the European Union Programme for Employment and Social
Innovation "EaSI" (2014-2020). For further information please consult: http://ec.europa.eu/social/easi.
1 DECISION No 573/2014/EU
1The Youth Guarantee in light of changes in the world of work:
Youth Guarantee: Intervention Models, Sustainability and Relevance
Table of contents
1. The Youth Guarantee: background and outline of the study ...................................... 6
1.1. The youth employment challenge in the European Union ............................................. 6
1.2. The Youth Guarantee ................................................................................................... 8
1.3. Outline of the project and the present report ............................................................... 9
2. Implementation features of the YG and related indicators ....................................... 10
2.1. Features of Youth Guarantee implementation ............................................................ 10
2.1.1. Financial resources for implementing the Youth Guarantee ..................................... 10
2.1.2. The Youth Guarantee as part of national policy-making ............................................ 14
2.1.3. Youth labour market challenges ................................................................................. 17
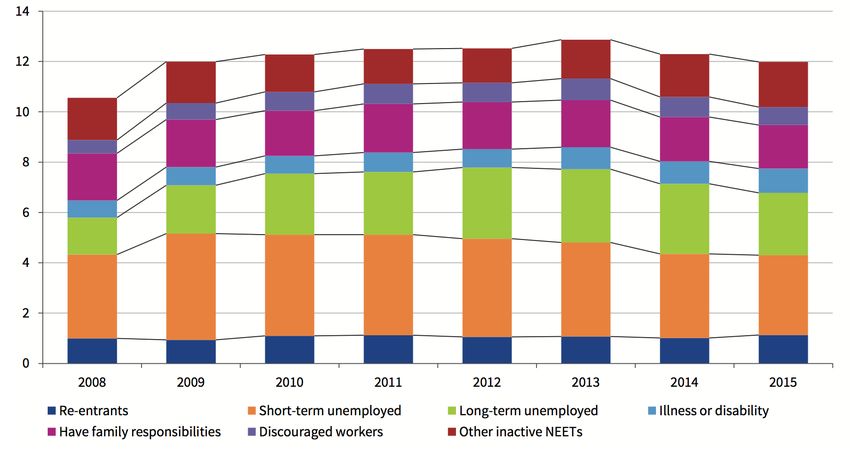
2.1.4. The heterogeneity of the NEET population ................................................................ 21
2.1.5. Design and implementation features of the Youth Guarantee .................................. 24
2.1.6. The role of the apprenticeship system in the Youth Guarantee ................................ 26
2.2. Empirical indicators of Youth Guarantee features ....................................................... 28
2.2.1. Indicator set 1: Financial resources for implementing the Youth Guarantee ............ 28
2.2.2. Indicator set 2: The Youth Guarantee as part of national policy-making ................... 29
2.2.3. Indicator set 3: Youth labour market challenges ........................................................ 30
2.2.4. Indicator set 4: The heterogeneity of the NEET population ....................................... 31
2.2.5. Indicator set 5: Design and implementation features of the Youth Guarantee ......... 31
2.2.6. Indicator set 6: The role of the apprenticeship system in the Youth Guarantee ....... 32
2.3. Conclusion ...................................................................................................................... 32
3. Typology of Youth Guarantee models ...................................................................... 33
3.1. Empirical approach to establishing Youth Guarantee models ...................................... 33
3.2. Description of first-step clusters ................................................................................. 34
3.2.1. Indicator set 1: Financial resources ............................................................................ 34
3.2.2. Indicator set 2: Youth Guarantee as part of national policy-making.......................... 34
3.2.3. Indicator set 3: Youth labour market challenges ........................................................ 35
3.2.4. Indicator set 4: The heterogeneity of the NEET population ....................................... 35
3.2.5. Indicator set 5: Design and implementation features of the Youth Guarantee ......... 36
3.2.6. Indicator set 6: The apprenticeship system ................................................................ 36
3.2.7. Summary of first-step cluster analysis ........................................................................ 37
3.3. Results and discussion of second-step clusters ............................................................ 38
3.4. Conclusion of second-step clusters ............................................................................. 41
3.5. Measures of performance .......................................................................................... 41
3.6. Assessing the correlation between Youth Guarantee models and performance ........... 44
4. Summary and conclusions ....................................................................................... 46
References ..................................................................................................................... 49
Annex............................................................................................................................. 53
2The Youth Guarantee in light of changes in the world of work:
Youth Guarantee: Intervention Models, Sustainability and Relevance
List of Figures
Figure 1. Youth unemployment rates (15-24 years old) in EU Member States, 2015 compared to
2018 ...................................................................................................................................................... 7
Figure 2. Rates of young people (15-24 years old) not in employment, education or training (NEET) in
EU Member States, 2015, 2017 .............................................................................................................. 8
Figure 3. Absolute number of youth-related active labour market reforms between 2013 and 2016 14
Figure 4. Composition of the EU NEET population (percentage of the population of young people) . 23
Figure 5. Number of indicators identified by variable set .................................................................... 33
Figure 6. YG-monitoring data performance indicators by Member States .......................................... 43
Figure 7. Eurostat performance indicators by Member States ............................................................ 44
Figure 8. YG monitoring data performance indicators by clusters ....................................................... 45
Figure 9. Aggregate performance measures ........................................................................................ 46
List of Tables
Table 1. Overview of actors involved in implementing the YG in 10 Member States .......................... 16
Table 2. Summary of Results of Cluster Analysis .................................................................................. 38
Table 3. List of indicators ...................................................................................................................... 53
Table 4. Outcome cluster means .......................................................................................................... 57
3The Youth Guarantee in light of changes in the world of work:
Youth Guarantee: Intervention Models, Sustainability and Relevance
Executive summary
The economic recession following the financial crisis, and its prolonged aftermath, com-
pounded the challenge that substantial youth unemployment put on the Member States
of the European Union. In addition, changes in the world of work, for example increas-
ingly complex school-to-work transitions and new challenges arising from rapid techno-
logical changes may further impede the labour market prospects of young people.
The Youth Guarantee (YG) was launched as a Council Recommendation adopted by all
Member States in 2013, in particular as a response to the high cyclical unemployment
among its youth. The YG meant that all young people aged between 15 and 24 would
receive a good quality offer of employment, training, education or apprenticeship within
a period of four months of becoming unemployed or leaving formal education. Following
this recommendation, EU Member States took steps to introduce such a scheme, albeit
with widely varying national approaches on (among many other differences) target
groups, timing, the types of interventions used and the types of partnerships.
This report synthesises the vast amount of available information on the implementation
of the YG and its performance. Based on an extensive desk research in its first part, the
study identifies six key aspects of YG implementation and delivery as well as background
characteristics that are important determinants of YG performance across Member
States: specifically, these are (1) the financial resources for implementing the YG, (2)
the role of the YG as part of national policy making, (3) challenges for the youth labour
market, (4) the heterogeneity of the NEET population, (5) the design and implementa-
tion features of the YG, and (6) the role of the apprenticeship system in the Youth Guar-
antee. The overall findings of desk research and data analysis indicate that, in sum, EU
funding via the Youth Employment Initiative (YEI) and the European Social Fund (ESF)
played a key role in supporting YG measures financially, especially for countries suffering
from simultaneously high NEET rates and a significant economic downturn or structural
labour market challenges. Many of these countries increased spending on active labour
market policies, which can be interpreted with caution as an indirect effect of the YG. In
some Member States the YG also fostered the introduction of reforms to national youth
policies, improvements in monitoring systems for youth activation policies, and the
building of new partnerships. These changes are likely to outlast the YG initiative and
thereby provide sustained and ongoing benefits.
Whereas these are substantive, positive changes brought about by the YG, not all of its
objectives were achieved. First, neither reducing labour market segmentation through
quality offers nor providing a remedy for imperfectly performing education systems was
fully achieved. One reason was a prevalence of employment offers compared to relative-
ly few education or apprenticeship offers in the YG. The low share of apprenticeship of-
fers in some Member States appears to be related to the institutional setup and school-
to-work (STW) transition regime: increasing the prominence of the apprenticeship sys-
tem would need to be accompanied by broader institutional change. Second, several
Member States were not able to fully address the heterogeneity of the NEET population –
especially those furthest away from the labour market. In contrast, countries that per-
formed well generally improved the capacity of their Public Employment Services (PES)
and developed partnerships to implement strong outreach programmes.
The second part of the study builds on the six key aspects to develop a Youth Guarantee
typology: this novel approach uses cluster analysis techniques to identify groups of simi-
lar countries. This analysis highlights several insights for the implementation of the
Youth Guarantee across Member States: firstly, country clusters within the single key
aspects are not always the same as the final country clusters for all six key aspects.
Second, certain contextual and implementation variables are clearly correlated, suggest-
4The Youth Guarantee in light of changes in the world of work:
Youth Guarantee: Intervention Models, Sustainability and Relevance
ing that some implementation features relate to each other: for instance, some countries
with a low estimated cost for implementing the YG tend to be countries that closely fol-
lowed the Recommendation, in particular in terms of timing of the intervention and tar-
get groups chosen. Other Member States with a more pronounced NEET challenge are
more likely to deviate from the recommendation, for example by increasing the targeted
time frame of intervention.
The most comprehensive version of the cluster analysis simultaneously takes into ac-
count all six key aspects and a total of 76 empirical indicators that properly reflect these
key aspects, and identifies five final clusters:
Cluster A: Member States with previous YG experience, lower initial NEET rates, ambi-
tious implementation and improved PES capacity, low educated NEETs and diversified
offers (AT, DK, DE, FI, IE, NL, SE).
Cluster B: Member States with intermediate NEET challenges, strong outreach efforts by
the PES, relatively poor monitoring data quality, high NEET rates due to family responsi-
bilities and strong focus on employment offers (CZ, EE, FR, HU, RO, UK).
Cluster C: Member States hit by the economic recession, with highest initial NEET rates,
severe long-term unemployment, large support via EU funding, highest reform efforts
and highest entry rates into apprenticeship offers (CY, EL, ES, IT, PT).
Cluster D: Member States characterised by relatively low initial NEET rates and short-
term unemployed rather than inactive NEETs, some funding under YEI, strong outreach
efforts through the PES and partnership approach, and diversified offers with a stronger
focus on education offers (BE, MT, LT, LU, PL, SI).
Cluster E: Member States that joined the EU relatively recently, with ‘transitional’ STW
regimes, high initial NEET rates, structural challenges and substantial EU funding, focus
on employment offers, rather high reform efforts (BG, HR, LV, SK).
Evidently, these explicit labels for the clusters tend to simplify the other factors of heter-
ogeneity across Member States that determine the typology. However, some conclusions
can be drawn regarding the fit of underlying challenges to be addressed with the policy
response observed. In particular, it appears that countries in Cluster A, C and D reflected
the challenges observed in the design and implementation of the YG to a higher degree
compared to cluster B and E, as policies implemented – for example regarding outreach
efforts – seem to better match key factors of heterogeneity in the NEET population.
In a final step, the study investigates the YG models resulting from the typology and
basic performance indicators. Cluster A performs well in terms of the NEET “coverage”
rate but less well regarding the reduction in NEET and unemployment rates over time.
Clusters B and D perform relatively similar across all YG outcome measures. Cluster C
shows the largest share of youth in the preparatory phase beyond the envisaged four
months but also the largest median decline in NEET rates. Cluster E has the lowest share
of positive and timely exits but the largest decline in youth unemployment out of all clus-
ters.
Whereas, therefore, the evidence is not fully conclusive, partly due to the number and
complex inter-relation of the aspects in which clusters differ, the report’s findings none-
theless clearly indicate that not only initial conditions but also the way Member States
implement the YG has affected its success.
5The Youth Guarantee in light of changes in the world of work:
Youth Guarantee: Intervention Models, Sustainability and Relevance
1. The Youth Guarantee: background and outline of the
study
An essential aim of the policies that promote economic growth and social equity is to
ensure that young people are adequately educated, that they enter the labour market
smoothly, and that they then continue successfully through a lifetime in employment
through till retirement. Young people face a wide range of structural challenges – fre-
quently perceived as increasingly complex – regarding their school-to-work (STW) tran-
sition and their long-term labour market prospects (Quintini et al, 2007).
The economic recession of the late 2000s and its aftermath exacerbated these challeng-
es, while the on-going Fourth Industrial Revolution, comprising innovations in digitalisa-
tion, artificial intelligence and robotics, is constantly generating new and potentially fun-
damental challenges. In general, these developments have resulted in the following pat-
terns: (i) a dramatic rise of youth unemployment in most countries during the recession,
together with relatively low employment rates; (ii) lengthier, complex, unstable, and
non-linear STW transitions; (iii) a deterioration in the quality of youth employment com-
bined with greater precariousness; (iv) the patchy availability of quality work experience,
which increasingly plays a crucial role in STW transitions; (v) increased inactivity, dis-
couragement and labour market detachment; and (vi) greater labour market vulnerabil-
ity for disadvantaged youth such as the low-skilled, migrants and young people with a
disability, and, more generally, young people not in employment, education or training
(NEETs).
While the wider macro-economic situation, including business cycle fluctuations together
with the recession-related economic deterioration of the late 2000s and the subsequent
‘job-poor’ recovery accounts for these developments, they are also rooted in persistent
structural deficiencies. These include imperfectly performing education and training sys-
tems with poor outcomes and ensuing skills mismatches and segmented labour markets
(resulting in hollowing-out and skill polarisation). Sometimes poor PES (Public Employ-
ment Service) resources prevent the provision of youth-related tailored services in gen-
eral, and in particular concentrating appropriate resources on vulnerable, hard-to-reach
young people, including certain sub-groups of NEETs (European Commission, 2017a).
Yet, unsatisfactory early labour market experience and lengthy, unstable STW transitions
can lead to long-term ‘scarring’ effects on young people in terms of reduced lifetime
earnings, a higher probability of subsequent periods of unemployment, a greater likeli-
hood of precarious employment, and poorer health and well-being (Gregg and Tominey,
2005; Scarpetta et al, 2010; European Commission, 2017a).
The remainder of this section describes the youth unemployment situation in the Euro-
pean Union (EU) and the challenges it poses for youth generally. It also introduces the
Youth Guarantee (YG) and it summarises the joint response to these challenges under-
taken in the EU. An explanation of the objectives and content of the present report as
well as the project in general concludes this section.
1.1. The youth employment challenge in the European Union
In the second quarter of 2018, as many as approximately 3.4 million, out of a total of
about 57 million young people in the 15-24 age group, were unemployed in the EU (lat-
est available data from Eurostat). Whereas this constitutes a substantial decline from the
peak of 5.7 million in January 2013, the numbers still remain high: the average youth
unemployment rate – i.e. the percentage of unemployment in the 15-24 age group com-
pared to the total labour force in that age group – stood at 16.8% in 2017 in the EU 28,
6The Youth Guarantee in light of changes in the world of work:
Youth Guarantee: Intervention Models, Sustainability and Relevance
and the NEET rate (the share of young people neither in employment nor in education or
training) was 10.9%. If young people up to 29 years of age are included, the average
rate of youth unemployment in the EU 28 was 12.7%, while the NEET rate reached
13.4% (amounting to 17.7% specifically within the 25-29 age bracket).
Figures 1 and 2 show the numbers for the 15-24 age group and illustrate the policy chal-
lenge of the youth unemployment rate (Figure 1) and the NEET rate (Figure 2). They
also show the substantial variation across EU countries: as Figure 1 shows, the youth
unemployment rate (Q2 2018) is below 10% in Austria, Germany, Estonia, Denmark, the
Netherlands, the Czech Republic and Hungary. In the majority of EU countries, however,
it ranges from 10% to 20%, while it is above 30% and up to almost 40% in Italy, Spain,
and Greece. Looking specifically at the most recent development by comparing it with
the Q2 2015 youth unemployment rate, however, the figure also shows a general down-
ward trend across all EU Member States, which is quite pronounced in some countries
(Bulgaria, Croatia, Malta and Hungary, for example).
Looking at the NEET rates in Figure 2, this downward trend in the most recent develop-
ment comparing 2015 and 2017 is also clearly visible. Again, there is notable variation
across Member States. On average, EU countries have a NEET rate of around 10.9% as
of 2017 and Ireland and Poland have NEET rates close to the EU average. While the
Netherlands is the only EU country with a rate below 5%, Croatia, Romania, Bulgaria,
and Italy have the highest NEET rates, with the rate reaching almost 20% in Italy.
Figure 1. Youth unemployment rates (15-24 years old) in EU Member States,
2015 compared to 2018
50
45
40
35
30
25
20
15
10
5
0
LV
LT
LU
UK
EE
CZ
BE
RO
BG
IE
CY
ES
EL
AT
SI
HU
EU28
SE
FI
SK
IT
FR
HR
DK
NL
DE
MT
PT
PL
2015Q2 2018Q2
Source: Authors’ illustration based on latest available Eurostat data: youth unemployment rate as percentage
of the active population, quarterly average. Countries are ordered by Q2 2015 rates. Data is seasonally adjust-
ed. For Italy and Cyprus, the Q1 2018 rates are reported (latest available).
7The Youth Guarantee in light of changes in the world of work:
Youth Guarantee: Intervention Models, Sustainability and Relevance
Figure 2. Rates of young people (15-24 years old) not in employment, educa-
tion or training (NEET) in EU Member States, 2015, 2017
25
20
15
10
5
0 LV
LU
LT
EE
UK
HU
ES
EL
RO
BG
CZ
BE
CY
SE
AT
EU28
FR
SK
IE
HR
IT
NL
SI
FI
DK
DE
PL
MT
PT
2015 2017
Source: Authors’ illustration based on latest available Eurostat data, annual averages. Countries are in order of
the 2015 rates.
In addition to these aggregate statistics, the difficulties for youth in the STW transition
can be related to several structural challenges, or market failures. In particular, these
concern: (a) Labour market segmentation – a labour market pattern in which young
people are over-represented in temporary, part-time, non-permanent work; (b) (under-)
performance of the education and training system – the low achievement of a substantial
section of youth in basic and ‘transversal’ (transferable) skills; (c) the limited availability
of ‘quality’ work experience; and (d) insufficient capacity of the Public Employment Ser-
vice (PES) to ensure effective provision of tailored services and support for young people
(see European Commission, 2017a).
1.2. The Youth Guarantee
The significant challenges that young people face in relation to fast, smooth, and effec-
tive STW transitions were exacerbated during and after the recession. Since then they
have also acted as a catalyst for policy change in many Member States. Accordingly, a
YG was introduced following the 2013 Council Recommendation (Council of the European
Union, 2013). Together with associated structural reforms of vocational education and
training (VET) and activation policies that are implemented across the EU, its aim is to
address these challenges. More specifically, following a proposal from the European
Commission, all Member States adhered to the establishment of the YG, committing
themselves to giving every young person a good-quality offer of employment, continuing
education, or an apprenticeship or a traineeship within a period of four months of be-
coming unemployed or leaving formal education (Council of the European Union, 2013).
The idea of YG style policies originated in the Nordic countries, where such initiatives
were first implemented in Sweden in 1984, and then elsewhere in the 1990s (Norway in
1993, Denmark and Finland in 1996, see, for example, Escudero and López Mourelo,
2017).
In a Communication published three years after the launch of the YG by the European
Commission (2016a), it was observed that the YG had become a reality across the EU.
Starting from January 2014, 14 million young people had already registered in YG
schemes by 2016. Around nine million young people had taken up an offer, the majority
8The Youth Guarantee in light of changes in the world of work:
Youth Guarantee: Intervention Models, Sustainability and Relevance
of which were offers of employment; almost two thirds of young people who left the YG
in 2015 took up an offer of employment, education, traineeship or apprenticeship. While
the Commission Communication also concluded that the YG has significantly facilitated
structural reforms and innovation in policy design across Member States, it also asserted
that, nonetheless, youth unemployment remained unacceptably high and many chal-
lenges still need to be addressed by Member States.
1.3. Outline of the project and the present report
The main objective of this project is to undertake an up-to-date review of the current
approaches and implementation of the YG, especially in view of new challenges for youth
in the changing world of work, thereby providing the basis for a future YG model that is
both robust and dynamic.
This report constitutes the first phase of the research project. In the first phase, a com-
prehensive desk review of existing documents and data was undertaken, together with
the construction of a database of indicators for a cluster analysis, as well as supplemen-
tary country case studies. This approach is explained and implemented throughout this
report. Aspects that guide the analysis are: 1) the degree to which EU financing helped
to implement the YG, 2) whether the YG became a sustainable part of national policy
making, 3) the main challenges faced by young people in their transition into the labour
market, 4) the heterogeneity of the NEET population, 5) the design and implementation
features of the YG, and 6) the role of apprenticeships in the YG. Based on these insights,
a typology of YG models is developed and the correlation of these types is assessed re-
garding measures of performance.
The second phase of the research project will address the emerging challenges for young
people’s transition into the world of work, drawing extensively on consultation with
stakeholders both through an online survey and, more importantly, through a stakehold-
er seminar held in Brussels on Oct 1, 2018, during which experiences with the YG were
exchanged and future challenges identified and discussed. The results of this second
phase will be published in a separate report.2 Together, these two reports should inform
reflection on further developments of the YG.
The report at hand is structured as follows. Section 2 has two parts; the first part identi-
fies the main characteristics of YG implementation in context, while the second part de-
fines empirical indicators for these characteristics and their sub-dimensions. In section 3,
these indicators are used for constructing a typology of YG models, also showing how the
different types of models differ regarding performance indicators. Section 4 presents the
conclusions of the analysis.
2European Commission (forthcoming), The Youth Guarantee in light of changes in the world of
work: Emerging challenges related to young people’s transition in the labour market.
9The Youth Guarantee in light of changes in the world of work:
Youth Guarantee: Intervention Models, Sustainability and Relevance
2. Implementation features of the YG and related indica-
tors
This section provides a comprehensive overview of the main features that characterise
YG implementation and assess the main features that are likely to determine its success
in Member States. It has two steps: first, section 2.1 gives an overview of the relevant
dimensions of YG implementation along the six guiding aspects outlined above. Based on
this characterisation, section 2.2 discusses the ways in which each of these aspects can
be represented by a set of empirical indicators and which will be used in chapter 3 for a
YG typology. The list of indicators for each of the six aspects comprise key contextual
characteristics for each Member State as well as implementation-related features such as
partnerships created as a result of YG implementation, or the types of interventions
used. In particular, indicators that characterise Member States at the outset of the YG
(measured in 2012 or 2013) as well as the way the YG was implemented (mostly meas-
ured up until 2016) inform the typology. Indicators of YG performance such as, for ex-
ample, the estimated proportion of the NEET population reached by the YG (the so-called
YG “coverage rate”) are considered outcomes of the way Member States implemented
the YG.
The presentation and discussion of intervention features and corresponding empirical
indicators in section 2 is complemented by selected information from five brief country
case studies. The case studies are a supplementary element in the review exercise that
feeds into this chapter, and they are meant to illustrate the intervention features dis-
cussed throughout the chapter in more detail for selected countries. Based on an ‘ex
ante assessment’ of a set of qualitative and quantitative country indicators, the following
five countries were selected for case studies: Austria, Denmark, Ireland, Italy, and Lat-
via. The countries were selected, firstly, to cover (to the extent that is possible) the ex-
isting types of STW regimes, and secondly to reflect the heterogeneity of the NEET popu-
lation. NEET implementation is characterised by high and low NEET and youth unem-
ployment rates, high and low YG coverage and the financial resources put into its im-
plementation.3
2.1. Features of Youth Guarantee implementation
2.1.1. Financial resources for implementing the Youth Guarantee
The YG is not a funding programme in itself. It is instead a political commitment sup-
ported, among other ways, by financial contributions from the EU and national budgets,
as well as contributions from the private and non-profit sectors. This section on the first
YG implementation aspect, financial resources, briefly outlines the relevance of these
different sources. Specific focus will be given to the Youth Employment Initiative (YEI)
and the European Social Fund (ESF) as the main EU sources to financially underpin the
implementation of the YG.
Youth Employment Initiative: The YEI was established during three informal summits of
EU Heads of State in 2013-14, and then given €3.2 billion for the 2014-15 period. Eligi-
bility for measures funded through the YEI is confined to young people aged 16-254 who
3 It is important to emphasise the ‘ex-ante’ nature of case study selection: they were chosen
based on a preliminary set of indicators at the outset of the study, whereas the full in-depth identi-
fication and discussion of indicators – as presented in this chapter – and their analysis in Chapter 3
becomes a key element of the study itself.
4 The upper age band is 29 in some Member States.
10The Youth Guarantee in light of changes in the world of work:
Youth Guarantee: Intervention Models, Sustainability and Relevance
are not in employment, education or training (‘NEETs’). Funding from the YEI was only
allocated to regions in those Member States where youth unemployment was higher than
25% in 2012.5 Since national allocations are based on the number of unemployed young
people in 2012 in these regions, YEI funds were allocated to a varying extent to each
Member State based on their (regional) unemployment rates (European Commission,
2016a). Spain was the largest recipient of the initial YEI specific allocation receiving
€943.5 million, and Slovenia the smallest receiving €9.2 million. In 2015, in view of the
immensity of the youth-employment challenge, the European Commission took steps to
ensure a quick mobilisation of its funds.6 Specifically, a higher pre-financing rate for the
€3.2 billion YEI specific allocation in 2015 than for other ESF allocations (30% instead of
the original 1-1.5% of the specific allocation for other ESF funds) was introduced.
This led to an amount of around €1 billion in additional pre-financing to Member States
in 2015 (European Commission, 2016a). In the summer of 2017, during the mid-term
review of the EU’s seven-year budget, the YEI was extended until 2020 and it received
an additional financial allocation of €1.2 billion. In addition, it was targeted at regions
where youth unemployment still exceeded 25% in 2016 (Andor and Veselý, 2018). Ac-
cording to the Commission’s report in October 2016, the YEI is seen by Member States
as a key mechanism through which to operationalise national Youth Guarantee schemes.
“In some cases, the YEI is being used to support most or all measures planned under the
YG schemes, while in others it is one funding source amongst others. Countries where
large shares of YG funding comes from the YEI include Lithuania – where 2/3 of all YG
actions are supported by the YEI, Poland – where 3/4 of all YG actions YEI funded, and
Spain – where 80% of all YG actions are funded through the YEI.” (European Commis-
sion, 2016b, p.89).
YEI funds were provided from the EU budget as a top-up to the already available ESF
funds for 2014-2020, to provide additional support for programmes with a specific focus
on NEETs (European Court of Auditors, 2017). However, the funding allocated to each
Member State under the YEI has to be matched by an equal amount from the respective
Member State allocations in the ESF 2014-20 budget. This holds for the initial allocation
in 2013 as well as the additional funds in 2017. Hence, the total budget of the YEI (for
all eligible EU Member States) now totals €8.8 billion for the period 2014-2020.
European Social Fund: In addition to ESF funds that were directly used to match the YEI
contributions (see above), some Member States also utilised additional funds from the
ESF for further employment-related programmes7 directly or indirectly benefiting youth,
but with no specific focus on NEETs. In contrast to YEI funds, which are intended to di-
rectly support NEETs, ESF funds may also be used to support structural reforms. In total,
Andor and Veselý (2018) estimate that approximately €14-15 billion from the EU budget
over the period 2014-20 financed the implementation of the YG through the YEI and ESF
5The exact methodology for allocating Youth Employment Initiative funds among Member States is
set out in Annexe VIII to the ‘Common Provisions Regulation’, i.e. Regulation (EU) No 1303/2013
of 17 December 2013, OJ L 347, 20.12.2013, p. 320–469.
6 An additional reason was that many Member States “raised the issue that they don't have the
national budget necessary to pay advance funding to projects working with young people” (source:
http://europa.eu/rapid/press-release_MEMO-15-5020_en.htm).
7The ESF is Europe’s main instrument for supporting jobs, helping people get better jobs and en-
suring fairer job opportunities for all EU citizens (European Parliament, 2018).
11The Youth Guarantee in light of changes in the world of work:
Youth Guarantee: Intervention Models, Sustainability and Relevance
funds.8 This is a significant share of the total ESF funding of €86.4 billion available to MS
for the 2014-2020 period (including the YEI).
Country case study: Austria
Young people in Austria were already benefiting from special attention before the intro-
duction of the YG. Several measures were set up to facilitate the transition from educa-
tion to the labour market, in particular through a well-established apprenticeship sys-
tem. Reducing the age for early school-leaving existed before the 2013 Council Recom-
mendation. The long-standing existence of policy measures for young people is reflected
in Austria’s relatively successful performance as regards youth employment and STW
transition. The labour market situation of young people in Austria is better than the EU
average and it continues to improve. The rate of youth unemployment (15-24 years old)
went down from 10.6% in 2015 to 9.8% in 2017, which is significantly below the EU
average (16.8%). This good performance is also reflected in the number of NEETs. The
NEET rate in Austria was at 6.5% in 2017, well below the EU average (10.9%).
In addition, evidence shows that Austria is performing better than the rest of the EU as
regards its YG implementation (European Commission, 2018a). It is acknowledged that
Austria has established a comprehensive Youth Guarantee based on effective partner-
ships, targeted policy measures and a robust monitoring system with interconnected
administrative data (European Commission, 2016a). The country’s performance is par-
ticularly outstanding in two dimensions: the NEET coverage and the delivery of a good
quality offer.
Data for 2016 shows that an estimated 82.9% of NEETs in Austria are reached by the
YG, which is the highest figure amongst Member States and almost double the EU aver-
age (42.5%)9. In addition, this “coverage indicator” has been at consistently high levels
since the start of the YG. A second, more suggestive but somewhat less reliable way of
looking at the performance of a YG scheme is trying to estimate the rate of recycling,
i.e. the percentage of NEETS entering the YG with previous YG experience. 10 This recy-
cling rate is rather high in Austria (73.9% compared to 34.1% for EU 28), suggesting
that employment services have little difficulty in ‘staying in touch’ with young people
who already had a YG experience.
The Austrian YG provides a wide range of offers (European Commission, 2016d). It
comprises apprenticeship, traineeship, education and employment offers that are tar-
geted specifically at young people, such as, for example, supra-company apprentice-
ships or production schools. Additionally, the general education, training, apprenticeship
and employment offers are open to young people.
At the same time, it is to be noted that Austria still faces difficulties in integrating cer-
tain sub-groups into the labour market, in particular women, migrants and young peo-
8 This figure is slightly higher than the €12.7 billion stated by the Commission in its October 2016
report which YEI and the ESF are directly investing in “labour market integration measures for
young people in the programming period 2014-2020” (European Commission, 2016a, p. 12).
9 These figures are based on the indicator "average annual stock of young people in the YG pre-
paratory phase / NEET population (annual average)" included in the Indicator Framework for Moni-
toring the Youth Guarantee. This indicator combines administrative and survey data. Whilst this is
not ideal, the indicator is useful to give an approximate indication of the proportion of NEETs regis-
tered in the YG scheme at any point during the year. Results should therefore be interpreted as an
estimation, rather than a definitive measurement, of the extent to which YG schemes achieve the
objective of reaching all young people that become, or are already, NEET.
10 The recycling rate is only experimental data and not officially part of the YG monitoring dataset.
12The Youth Guarantee in light of changes in the world of work:
Youth Guarantee: Intervention Models, Sustainability and Relevance
ple with low skills (European Commission, 2018a). Ongoing efforts for these target
groups need to be intensified as recent measures have not led to sufficient results yet.
Other EU sources: Several other EU budget lines support employment- and education-
related programmes in Member States, including the European Regional Development
Fund (ERDF), the ERASMUS programme as well as Horizon 2020 and the European Glob-
alisation Adjustment Fund (EGF). For an analysis of their job-creation potential and their
relation to the ESF/YEI, see European Parliament (2018). In addition, a range of smaller
EU programmes finance employment-related measures for (young) people, such as the
European Solidarity Corps or the EU Programme for Employment and Social Innovation
(EaSI).11
Three aspects deserve to be highlighted regarding differences across Member States in
financing the implementation of YG activities:
First, as the 2017 European Court of Auditors report on “Youth unemployment – have EU
policies made a difference?” highlights, the level of YEI/ESF funding available would only
address a small proportion of the required amount for the full implementation of a YG.
Member States therefore need to leverage significant additional resources from national
budgets to achieve this goal. However, so far, there has been “no assessment of cost
and available funding by Member States.” (European Court of Auditors, 2017)
Second, the extent to which the YEI/ESF funds simply financed youth-related schemes
that already existed prior to the YG is unclear. They may be funded either by other EU
schemes or Member State national budgets. The European Court of Auditors states that
YEI/ESF should “not replace public or equivalent expenditure by the Member States”
(ibid.). However, the Commission notes in its reply to the report that the YEI provisions
do not deny to Member States finance for measures previously supported by the national
budget or measures that require Member States to increase public spending regarding
certain types of measures or target groups. At the same time, the European Court of
Auditors analysis of seven Member States’ Operational Plans for the YEI/ESF showed that
“[…] the majority of the measures which were to receive YEI financing already existed
prior to the introduction of the Youth Guarantee […]” (ibid., p. 54). In fact, even in 2011,
the Youth Opportunities Initiative proposed by the European Commission (2011) allowed
the governments of Member States to make increased use of the ESF for promoting
youth employment (Tosun et al, 2017). The degree to which additional funds under the
YEI/ESF actually presented additional funds for Member States may therefore vary
greatly and there is, without doubt, also some variation in Member States as to whether
this caused them to step up their efforts regarding youth employment.
Third, despite the frontloading of the YEI in 2017, take-up of the YEI developed slowly in
its early phases of implementation (European Parliament, 2017b). According to Andor
and Veselý (2018) two aspects delayed the implementation of the YG in the start from a
financial perspective: firstly, it took Member States and the Commission time to design
and review the ‘Operational Programmes’ (OPs) specifying how YEI and ESF money
would be used. Most of the Operational Programmes were only approved in late 2014 or
even in 2015. Secondly, several Member States had accumulated delays in absorbing EU
structural funds for 2007-13. Hence, they focused their efforts on implementing these
schemes in order not to lose these allocations (due to the so-called de-commitment
11 For instance, one of the aims of the EaSI programme is to enhance mobility via the “Your first
Eures job”. As these programmes are rather small in scale and not directly linked to the YG, the
study does not provide a detailed overview (see European Parliamentary Research Service 2017).
13The Youth Guarantee in light of changes in the world of work:
Youth Guarantee: Intervention Models, Sustainability and Relevance
rule). Only afterwards did they move on to use YEI funding. An assessment commis-
sioned by the European Parliament concluded that most delays that limited the impact of
the increased pre-financing were due to procedural rather than financial problems (Euro-
pean Parliament, 2017b).
2.1.2. The Youth Guarantee as part of national policy-making
A variety of aspects may be used to determine the degree to which the YG has become a
part of national policy making and, hence, whether the changes introduced by the YG are
likely to be sustained over time. The following discussion focuses on three measurable
factors related to the sustainability of YG-related policy changes. Firstly, whether the
Council Recommendation has spurred on Member States to introduce youth-related la-
bour-market reforms, rather than merely set up an additional offer of active labour mar-
ket measures. Secondly, whether Member States have introduced monitoring and evalu-
ation systems to assess the effectiveness of YG-related measures. Thirdly, to find the
degree to which Member States have attempted to build up (lasting) partnerships be-
tween all relevant stakeholders (such as public and private employment services, gov-
ernment authorities, education and training institutions and so on).
The introduction of youth-related labour-market reforms: the first key factor reflects
whether Member States have attempted to embed the main guidelines of the Council
Recommendation in their national policies. In particular, whether Member States have
used the political momentum created by the YG to introduce structural reforms to mod-
ernise their overall labour market policies in support of young people. Such reforms con-
cern the functioning of the labour market (its institutional and regulatory framework)
and are aimed at better matching supply with demand. The implementation of structural
reforms can be considered a key determinant as to whether the YG can have a long-
term, sustainable impact in Member States beyond the YEI and the ESF funding associ-
ated with the YG.
Information on the nature and intensity of youth-related active labour market policy re-
forms, provided in the LABREF database, indicates that EU Member States are imple-
menting the Recommendation’s policy guidelines unevenly. Figure 3 displays the number
of active labour market policy reforms between 2013 and 2016 across Member States.
The figure indicates, for instance, that virtually all Member States implemented addition-
al ALMP reforms for youth, and that several Member States – such as Bulgaria, France,
Latvia, Lithuania and Greece – have a relatively broad scope of reforms.
Figure 3. Absolute number of youth-related active labour market reforms be-
tween 2013 and 2016
10
8
6
4
2
0
NL
DE
DK
MT
PL
PT
SI
LU
FI
EE
SK
ES
SE
EL
AT
FR
LV
LT
CZ
HR
UK
IT
IE
BE
RO
HU
CY
BG
Note: This figure shows the absolute number of youth-related active labour market policy reforms in the EU
Member States between 2013 and 2016. Identification of youth-related reforms is done via the indicator “Is
the measure targeted at young people” in the LABREF database.
14The Youth Guarantee in light of changes in the world of work:
Youth Guarantee: Intervention Models, Sustainability and Relevance
The introduction of monitoring and evaluation systems: the fifth principal element in the
Council Recommendation on the YG, and the strict reporting guidelines, were aimed at
fostering a culture of policy analysis. Despite the additional administrative burden asso-
ciated with reporting activities, requiring Member States to obtain administrative data on
in- and outflows from the YG as well as follow-up data, the creation of a monitoring and
evaluation system is one of the effects that people in charge of implementing the YG at
the country level have recognised as being positive.12 In fact, many Member States did
not have specialised monitoring systems allowing to track youth on the labour market
and in education, and evaluate activation measures for youth before the Council Rec-
ommendation.
At the same time, the capacity of countries to monitor what happens to young people
after leaving the YG, and the corresponding data quality, varies: in fact, a substantial
share of Member States do not know about young people’s reasons for exiting either the
YG or the labour market, nor do they register the educational status of previous partici-
pants after they exited. This issue is most likely due to a pre-YG lack of policy evaluation
culture, or a lack of capacity to collect data. An additional aspect to consider in this re-
gard is whether Member States attempted to evaluate the effectiveness of specific
measures under the YG using rigorous impact evaluations. The EU helps Member States
conduct impact evaluations on interventions funded by the European Commission, name-
ly the ESF and the YEI, for example, by setting up the Centre for Research on Impact
Evaluation (CRIE) which provides scientific expertise and methodological support to
Member States conducting an impact evaluation (see European Commission (2016b) for
details). Escudero and Murelo (2017) provide an overview of various impact evaluations
of pilot programmes that were set up within the context of the European YG. However,
there does not so far seem to be a systematic account of ongoing or completed impact
evaluations of YG instruments.
Partnership approach: Most Member States make a reference to the partnership ap-
proach in their YG Implementation Plan (YGIP). Table 1 shows the clear differences
based on an assessment of ten selected Member States, conducted by Eurofound
(2015). In addition to the differences within countries, the findings based on this sample
of ten countries also indicate that cooperation with some stakeholders seems to be more
widespread than it is with others. For instance, cooperation between ministries, particu-
larly the ones dealing with employment and education policies, is rather well developed.
In comparison, cooperation is less frequent with non-institutional stakeholders such as
the third sector, notably NGOs, social partners and youth organisations. In 2016, the
European Commission’s three-year assessment came to the conclusion that “while many
Member States have taken steps to support the involvement of a wide range of actors
and established institutional frameworks for partnerships, the functioning of these part-
nerships remains a challenge due to problems of design, which affects their ability to
deliver”. (European Commission, 2016b, p.24)
In addition, previous studies (e.g. Dhéret and Roden, 2016) highlight the strong path-
dependency in how countries or regions apply the partnership approach. While some
countries have put new structures in place to monitor the progress of the YG implemen-
tation and coordinate the work of relevant stakeholders, other countries tend to have
consolidated partnerships that existed before the YG was established.
12Information collected through the interviews organised in the context of the EPC Task Force on
Youth Employment. The results of these interviews are further presented and developed in Dhéret
and Roden (2016).
15The Youth Guarantee in light of changes in the world of work:
Youth Guarantee: Intervention Models, Sustainability and Relevance
There also seems to be some discrepancy between the involvement of stakeholders in
the design, implementation and monitoring of the YG. In some Member States, stake-
holders in the third sector, particularly youth organisations, reported that they were only
consulted in the design phase and never again (European Youth Forum, 2018).13 Recent-
ly, more positive evidence is provided by ETUC (2018), showing that the great majority
of interviewed representatives of unions was at least `somewhat satisfied’ with their
degree of participation in the YG.
Table 1. Overview of actors involved in implementing the YG in 10 Member
States
Ministry of Employment
for
Local youth organisation
re-
for
Other ministry (justice,
defence, interior, health,
PES (either at national,
Youth organisation (repre-
regional or local level)
Ministry responsible
Ministry responsible
sponsible for ESF/YEI
Ministry/organisation
Ministry of Education
(implementation)
Education sector
Social partners
(or equivalent)
social benefits
youth work
sentative)
housing)
BE* XX XX X XX X XXX X X XX
BG XXX XX XX XX XX XX XX XX XX XX
EE XX X XX XXX XXX X XX XX XX X X
EL XXX X X XX X X
XXX
(em-
ES** XXX XX XX XX XX XX X XX X
ploy-
ment)
XXX XX
(em- (em-
FR XXX XX XX X XX X
ploy- ploy-
ment) ment)
IE XX XXX XX XX XX XX X X X
IT XXX XXX XX XX XX XX X X XXX X
PL XX X XXX X XX X
XX
UK XX X X XX X X
(LEP)***
Source: Eurofound (2015a).
Note: XXX means authority/coordinator; XX means principal partner-stakeholders and X means associated
partner/stakeholder; *A distinction needs to be made in Belgium between the federal and local authori-
ty/regional level: social benefits are (still) the responsibility of the federal government, while education and
PES are the responsibility of the regions/local authorities; **Similar to Belgium, in Spain many responsibilities
are delegated to the regional level; ***LEPs - Local Enterprise Partnerships.
13Some more evidence from the European Youth Forum on involvement for a sub-set of countries
can be found under http://tools.youthforum.org/youth-guarantee/.
16The Youth Guarantee in light of changes in the world of work:
Youth Guarantee: Intervention Models, Sustainability and Relevance
2.1.3. Youth labour market challenges
The third key factor of YG implementation is its contribution to, and targeting of, the
young people’s labour market challenges. Given that the recession of the late 2000s (the
‘Great Recession’) and its aftermath exacerbated the difficulties that young people face
in their STW transition and labour market career, this section presents a brief discussion
of these challenges and how YG interventions have sought to address them.
Challenge 1 – Youth unemployment, long-term unemployment and inactivity: The Great
Recession and its immediate effects on youth unemployment – highlighted in section 1 –
also resulted in an increase in youth long-term unemployment, which, although gradual-
ly falling from its peak of 8% in 2013, has remained high (European Parliament, 2015;
European Commission, 2017a). Long-term unemployment can result in well-documented
lifelong consequences and ‘scarring’ effects on those young people who remain unem-
ployed for some time (Eurofound, 2015b; Eurostat, 2015). In addition, a considerable
proportion of the EU’s youth remain economically inactive. Whereas a large share of
them are in education or training, many are discouraged and have become detached
from the labour market, or they have not entered it after leaving education.
The macroeconomic state of the economy also affects the level of demand for young
people where employer absorption capacity in providing training places (such as appren-
ticeships) and jobs for young people may be limited (Eurofound, 2015a). In addition, the
highly variable youth labour market performance across the EU before, during, and after
the Great Recession has been attributed to many factors. These include differences in
the institutional and structural set-up of Member States regarding the education and
training systems, (initial) education and vocational training (IVET), labour market insti-
tutions and labour market policy (such as employment protection legislation - EPL) and
active labour market policies (ALMPs), and social welfare systems (Eichhorst et al, 2013;
O’Reilly et al, 2015, Pohl and Walther, 2005; Pohl and Walther, 2007).
The introduction of the YG – and its underlying philosophy of early intervention with a
personalised approach – across the EU sought to address the issue of rising youth un-
employment, including long-term unemployment and inactivity (Eurofound, 2015a; Eu-
ropean Commission, 2016a). The YG approach precisely addresses these challenges:
providing unemployed, inactive youth with a short-term activation and a perspective in
employment or education.
In the five years since the launch of the YG, youth unemployment rates have improved
considerably, as highlighted in section 1 (see also for example the European Commis-
sion, 2018g; Eurostat, 2018). Although this development is partially attributable to the
recovery from the Great Recession, according to the European Commission this is also
partially due to the YG, together with the effect of the Youth Employment Initiative (YEI)
(European Commission, 2018g).
Challenge 2 – Labour market segmentation: A key challenge facing youth is labour mar-
ket segmentation, often resulting in young people being over-represented in temporary
or part-time forms employment, in particular involuntary part-time, casual, a-typical or
precarious work (European Commission, 2017a, 2017g and 2018i; Eurostat, 2015 and
2018). Although such non-standard forms of employment have increased for all age
groups, the more recent cohorts of younger workers have been particularly adversely
affected (European Commission, 2017g). Specifically, although in 1995 23% of younger
workers in the then EU 15 were on non-standard contracts, by 2016 this proportion had
increased to 32% for the same age group (European Commission, 2017g).
This trend is reflected across the EU 28 where, over the last decade, non-standard forms
of employment among younger workers rose from 26% to 29%, with 3.5 million fewer
17You can also read