Treasury Management Strategy Statement, Minimum Revenue Provision Policy Statement and Annual Investment Strategy Updated - February 2020
←
→
Page content transcription
If your browser does not render page correctly, please read the page content below
Treasury Management Strategy Statement,
Minimum Revenue Provision Policy Statement and Annual
Investment Strategy

Updated – February 2020
INDEX                                                                                                                              Page

  1     INTRODUCTION ...............................................................................................................3
        1.1 Background ..............................................................................................................3
        1.2 Reporting Requirements ...........................................................................................3
        1.3 Treasury Management Strategy ................................................................................4
        1.4 Training.....................................................................................................................4
        1.5 Treasury management consultants ...........................................................................4

  2     THE CAPITAL PRUDENTIAL INDICATORS 2020/21 – 2022/23 ......................................6
        2.1 Capital expenditure ...................................................................................................6
        2.2 The Council’s borrowing need (the Capital Financing Requirement) .........................6
        2.3 Core funds and expected investment balances .........................................................7
        2.4 Minimum Revenue Policy Statement ........................................................................9

  3     BORROWING..................................................................................................................10
        3.1 Current portfolio position .........................................................................................10
        3.2 Treasury Indicators: limits to borrowing activity .......................................................10
        3.3 Prospects for interest rates .....................................................................................11
        3.4 Borrowing strategy ..................................................................................................14
        3.5 Policy on borrowing in advance of need ..................................................................14
        3.6 Debt rescheduling ...................................................................................................15
        3.7 Municipal Bond Agency ..........................................................................................15

  4     ANNUAL INVESTMENT STRATEGY ..............................................................................16
        4.1 Investment policy ....................................................................................................16
        4.2 Creditworthiness policy ...........................................................................................18
        4.3 Other Considerations ..............................................................................................18
        4.4 Investment strategy.................................................................................................16
        4.5 End of year investment report .................................................................................19
        4.6 External fund managers (if applicable) ....................................................................19

  5     APPENDICES .................................................................................................................20
        5.1 Prudential and treasury indicators and MRP statement...........................................21
        5.2 Interest Rate Forecasts 2020 - 2023 .......................................................................23
        5.3 Economic Background ............................................................................................24
        5.4 Treasury Management Practice (TMP1) – Credit and Counterparty Risk Management.33
        5.5 Approved countries for investments ........................................................................35
        5.6 Treasury management scheme of delegation .........................................................36
        5.7 The treasury management role of the section 151 officer ........................................37
        5.8 Glossary .................................................................................................................39
Treasury Management Strategy Statement 2020/21
1 INTRODUCTION
1.1 Background
The Council is required to operate a balanced budget, which broadly means that cash raised
during the year will meet cash expenditure. Part of the treasury management operation is to
ensure that this cash flow is adequately planned, with cash being available when it is needed.
Surplus monies are invested in low risk counterparties or instruments commensurate with the
Council’s low risk appetite, providing adequate liquidity initially before considering investment
return.
The second main function of the treasury management service is the funding of the Council’s
capital plans. These capital plans provide a guide to the borrowing need of the Council,
essentially the longer-term cash flow planning, to ensure that the Council can meet its capital
spending obligations. This management of longer-term cash may involve arranging long or
short-term loans, or using longer-term cash flow surpluses. On occasion, when it is prudent
and economic, any debt previously drawn may be restructured to meet Council risk or cost
objectives.
The contribution the treasury management function makes to the authority is critical, as the
balance of debt and investment operations ensure liquidity or the ability to meet spending
commitments as they fall due, either on day-to-day revenue or for larger capital projects. The
treasury operations will see a balance of the interest costs of debt and the investment income
arising from cash deposits affecting the available budget. Since cash balances generally
result from reserves and balances, it is paramount to ensure adequate security of the sums
invested, as a loss of principal will in effect result in a loss to the General Fund Balance.
Whilst any commercial initiatives or loans to third parties will impact on the treasury function,
these activities are generally classed as non-treasury activities, (arising usually from capital
expenditure),and are separate from the day to day treasury management activities.
CIPFA defines treasury management as:
“The management of the local authority’s borrowing, investments and cash flows, its banking,
money market and capital market transactions; the effective control of the risks associated
with those activities; and the pursuit of optimum performance consistent with those risks.”
Revised reporting wasintroduced in 2019/20 including the introduction of a capital strategy, to
provide a longer-term focus to the capital plans, and greater reporting requirements
surrounding any commercial activity undertaken under the Localism Act 2011. The capital
strategy is being reported separately.
1.2 Reporting Requirements
1.2.1 Capital Strategy
The CIPFA revised 2017 Prudential and Treasury Management Codes require all local
authorities to prepare an additional report, a capital strategy report, which will provide the
following:
• a high-level long term overview of how capital expenditure, capital financing and treasury
management activity contribute to the provision of services
• an overview of how the associated risk is managed
• the implications for future financial sustainability
Responsible Section/Team Financial Services Page 3
Responsible Author Head of Finance Version v1
Date last amended February 2020 Due for review Feb 2021Treasury Management Strategy Statement 2020/21
The aim of this capital strategy is to ensure that all elected members on the council fully
understand the overall long-term policy objectives and resulting capital strategy requirements,
governance procedures and risk appetite.
This capital strategy is reported separately from the Treasury Management Strategy
Statement; non-treasury investments will be reported through the former. This ensures the
separation of the core treasury function under security, liquidity and yield principles, and the
policy and commercialism investments usually driven by expenditure on an asset. The capital
strategy will show:
• The corporate governance arrangements for these types of activities;
• Any service objectives relating to the investments;
• The expected income, costs and resulting contribution;
• The debt related to the activity and the associated interest costs;
• The payback period (MRP policy);
• For non-loan type investments, the cost against the current market value;
• The risks associated with each activity.
Where a physical asset is being bought, details of market research, advisers used, (and their
monitoring), ongoing costs and investment requirements and any credit information will be
disclosed, including the ability to sell the asset and realise the investment cash.
Where the Council has borrowed to fund any non-treasury investment, there should also be an
explanation of why borrowing was required and why the MHCLG Investment Guidance and
CIPFA Prudential Code have not been adhered to.
If any non-treasury investment sustains a loss during the final accounts and audit process, the
strategy and revenue implications will be reported through the same procedure as the capital
strategy.
To demonstrate the proportionality between the treasury operations and the non-treasury
operation, high-level comparators are shown throughout this report.
1.2.2 Treasury Management reporting
The Council is currently required to receive and approve, as a minimum, three main treasury
reports each year, which incorporate a variety of policies, estimates and actuals.
Prudential and Treasury Indicators and Treasury Strategy (this report) - The first, and
most important report covers:
the capital plans (including prudential indicators);
a Minimum Revenue Provision Policy or MRP (how residual capital expenditure is charged
to revenue over time);
the Treasury Management Strategy (how the investments and borrowings are to be
organised) including treasury indicators; and
an Investment Strategy (the parameters on how investments are to be managed).
This report is required to be adequately reviewed and scrutinised by by the Cabinet before
being recommended to the Council.
A Mid Year Treasury Management Report – This will update members with the progress of
the capital position, amending prudential indicators as necessary, and whether the treasury
strategy is meeting the strategy or whether any policies require revision. This is included
within each of the Council’s regular financial monitoring reports presented to the Cabinet.
Responsible Section/Team Financial Services Page 4
Responsible Author Head of Finance Version v1
Date last amended February 2020 Due for review Feb 2021Treasury Management Strategy Statement 2020/21 An Annual Treasury Report – This provides details of a selection of actual prudential and treasury indicators and actual treasury operations compared to the estimates within the strategy. This is included within the Council’s end of year financial monitoring report presented to the Cabinet. 1.3 Treasury Management Strategy for 2020/21 The strategy for 2020/21 covers two main areas: Capital issues the capital plans and the prudential indicators; the Minimum Revenue Provision (MRP) strategy. Treasury management Issues the current treasury position; treasury indicators which will limit the treasury risk and activities of the Council; prospects for interest rates; the borrowing strategy; policy on borrowing in advance of need; debt rescheduling; the investment strategy; creditworthiness policy; and policy on use of external service providers. These elements cover the requirements of the Local Government Act 2003, the CIPFA Prudential Code, the CLG MRP Guidance, the CIPFA Treasury Management Code and the MHCLG Investment Guidance. 1.4 Training The CIPFA Code requires the responsible officer to ensure that members with responsibility for treasury management receive adequate training in treasury management. This especially applies to members responsibe for scrutiny. Financial training for members is undertaken each year in June. The training needs of treasury management officers are reviewed annually. 1.5 Treasury management consultants The Council uses Link Asset Services, Treasury solutions as its external treasury management advisors. However, the Council recognises that responsibility for treasury management decisions remains with the organisation at all times and will ensure that undue reliance is not placed upon our external service providers. It also recognises that there is value in employing external providers of treasury management services in order to acquire access to specialist skills and resources. The Council will ensure that the terms of their appointment and the methods by which their value will be assessed are properly agreed and documented, and subjected to regular review. The scope of investments within the Council’s operations now includes both conventional treasury investments, and more commercial type investments, such as investment properties. The commercial type investments require specialist advisers, and the Council uses Taylor Weaver Ltd in relation to this activity. Responsible Section/Team Financial Services Page 5 Responsible Author Head of Finance Version v1 Date last amended February 2020 Due for review Feb 2021
Treasury Management Strategy Statement 2020/21

2 THE CAPITAL PRUDENTIAL INDICATORS 2020/21 – 2022/23 & MRP
  STATEMENT
      The Council’s capital expenditure plans are the key driver of treasury management activity.
      The capital expenditure plans are reflected in prudential indicators, which are designed to
      assist members’ overview and confirm capital expenditure plans.

2.1     Capital Expenditure

      This prudential indicator is a summary of the Council’s capital expenditure plans, both those
      agreed previously, and those forming part of this budget cycle.

                                                        2017/18                2019/20    2020/21    2021/22       2022/23
                                                                    2018/19
      Capital Expenditure                                Actual               Estimate   Estimate   Estimate      Estimate
                                                                Actual £000
                                                           £000                   £000       £000       £000          £000
      Operational Services:
        Operations & Communities                            472        606      1,684        382         770           790
        Customer Services & IT                                6          -          -          -           -             -
        Regeneration (incl Spinning Point)                6,233      2,496      5,151      7,800           -             -
        Corporate Services and Buildings                    149        200        578        144          75            75
        Housing                                             587        889      2,026      1,000       1,100         1,100
      Commercial Activities: *
        Investment Construction (Council July 18)             -          -      3,898           -             -             -
      Total                                               7,447      4,191     13,337      9,326       1,945         1,965

      * Commercial activities / non-financial investments relate to areas such as capital expenditure
      on investment properties, loans to third parties etc.

      Long term liabilities
      The Council currently has two long-term liabilities in the form of a 25-year PWLB loan from
      2010, for which the annual repayment of principal is £184k, and one from 2019, for which the
      annual repayment is £100k

      The table below summarises the above capital expenditure plans and the available capital or
      revenue resources. Any shortfall of resources results in a funding need (borrowing). The
      main increases in net financing requirement during 2020/21 will be the construction of
      Spinning Point Phase 2, as approved by Council in December 2018, though this may be
      subject to further consideration.

                                                        2017/18    2018/19     2019/20    2020/21    2021/22       2022/23
       Funded by:                                        Actual   Estimate    Estimate   Estimate   Estimate      Estimate
                                                           £000       £000        £000       £000       £000          £000
       Capital receipts                                  2,614        161         686        144        110           110
       Capital grants                                    3,325      3,158       7,323        947        947           947
       Earmarked reserves contributions                    345         49         365           -          -             -
       In-year Revenue contributions (incl S106)           145        100         100         70         50            50
       Total in-year resources                            6,429      3,468      8,474      1,161      1,107         1,107
       Therefore Net financing need for year              1,018       723       4,863      8,165        838           858
       Commercial Activities included above
         Aplication of in-year resources                      -          -         98          -          -             -
         Net financing need                                   -          -      3,800          -          -             -
         Percentage of total net financing need               -          -      78.1%          -          -             -

2.2     The Council’s Borrowing Need (the Capital Financing Requirement)
Responsible Section/Team                    Financial Services          Page                           6
Responsible Author                          Head of Finance             Version                        v1
Date last amended                           February 2020               Due for review                 Feb 2021
Treasury Management Strategy Statement 2020/21
The second prudential indicator is the Council’s Capital Financing Requirement (CFR). The
CFR is simply the total historic outstanding capital expenditure which has not yet been paid for
from either revenue or capital resources. It is essentially a measure of the Council’s
underlying borrowing need. Any capital expenditure above, which has not immediately been
paid for, will increase the CFR.
The CFR does not increase indefinitely, as the minimum revenue provision (MRP) is a
statutory annual revenue charge which broadly reduces the indebtedness in line with each
assets life, and so charges the economic consumption of capital assets to the revenue
account as they are used.
The CFR includes any other long term liabilities (e.g. PFI schemes, finance leases) brought
onto the balance sheet. Whilst this increases the CFR, and therefore the Council’s borrowing
requirement, these types of scheme include a borrowing facility and so the Council is not
required to separately borrow for these schemes. The Council currently has no such schemes
within the CFR.
The Council is asked to approve the CFR projections below:
2017/18 2019/20 2020/21 2021/22 2022/23
2018/19
Capital Financing Requirement (CFR) Actual Estimate Estimate Estimate Estimate
Actual £000
£000 £000 £000 £000 £000
Opening CFR 9,069 8,751 8,203 12,331 20,544 20,548
Movement in CFR - Services (see below) (318) (548) 328 8,213 4 24
Movement in CFR - Commercial Activities - - 3,800 - - -
Closing CFR 8,751 8,203 12,331 20,544 20,548 20,572
Movement in CFR is represented by
Net financing need for the year (see above) 286 723 4,863 8,949 740 760
Less MRP repayments (604) (1,271) (735) (736) (736) (736)
Movement in CFR (318) (548) 4,128 8,213 4 24
The movement in the CFR in 2020/21 is £8,213k, which includes the following major projects:
The completion of construction of an investment property valued at £3.8m, approved in
July 2019.
The Spinning Point Phase 2 development of £7.8m funded by a PWLB loan over 30
years.
The balance of £297k in financing need relates to the operational vehicle replacement
plans, which will be met from internal borrowing for which MRP is already included
within the budgets.
The movement in the CFR could be significantly different dependent on which
investment projects are progressed.
2.3 Core funds and expected investment balances
The application of resources (capital receipts, reserves etc.) to either finance capital
expenditure or other budget decisions to support the revenue budget will have an ongoing
impact on investments and borrowing unless resources are supplemented each year from new
sources (asset sales etc.).
Detailed below are expected opening cash balances and the anticipated cash flow impacts of
the MTFS and the Capital Programme.
Responsible Section/Team Financial Services Page 7
Responsible Author Head of Finance Version v1
Date last amended February 2020 Due for review Feb 2021Treasury Management Strategy Statement 2020/21
2019/20 2020/21 2021/22 2022/23
Cash Flow over the MTFS
£000 £000 £000 £000
Cash Balances at 1st April b/fwd 9,958 3,963 4,582 421
Non- Cash Budget items:
Minimum Revenue Provision 735 736 736 736
Annual Pensions charge 1,500 915 915 915
3-yr Pre-payment of Pensions - (2,745) - -
Revenue Contribution to Capital Outlay 100 75 75 75
Application of Reserves
NNDR - - - -
Other Reserves - MTFS * (511) - - -
Capital Programme (CFR net impact)
Vehicles (863) (439) (675) (690)
Spinning Point Ph 2 - (3,900) (3,900) -
Investment Property Construction (3,800) - - -
Others (200) (810) (105) (105)
Use of Grants received in advance
DFGs (1,026) - - -
Spinning Point Ph 1 (3,163) - - -
Capital receipts 50 50 50 50
PWLB:
Borrowing repayments - current loan (234) (479) (674) (674)
New Borrowing 2,000 7,800 0 0
Repayment of HCA Grant (part 2) (483) (483) (483) -
Contingency / Timing (100) (100) (100) (100)
Cash Balances at 31st March c/fwd 3,963 4,582 421 628
* As per the 2020/21 Technical Resolution.
Detailed below are estimates of the year end balances for each resource following the
anticipated cash flow requirements above.
2017/18 2019/20 2020/21 2021/22 2022/23
2018/19
Year-end Resources Actual Estimate Estimate Estimate Estimate
Actual £000
£000 £000 £000 £000 £000
General Fund balance 1,000 1,000 1,000 1,000 1,000 1,000
Earmarked reserves 6,166 6,017 5,412 5,222 5,125 5,018
Capital receipts 2,480 2,469 1,857 1,763 1,797 1,703
Government Grants Unapplied 890 946 57 25 25 25
Additional Resources to fund the MTFS - - 735 736 736 736
Total Reserves 10,536 10,432 9,061 8,746 8,683 8,482
(Under)/over borrowing (see 3.1) (5,623) (5,259) (7,621) (8,513) (9,191) (9,889)
Expected resources 4,913 5,173 1,440 233 (508) (1,407)
#
Cash Balances (see 2.3 ) 7,339 9,958 8,585 5,732 5,732 5,871
Working capital * 2,426 4,785 7,145 5,499 6,240 7,278
* Working capital balances shown are estimated year end; these may be higher mid-year
#
Given the Council’s current banking portfolio, the Cash and Cash Equivalents has been
combined with Investments, rather than being shown as part of the working capital
Responsible Section/Team Financial Services Page 8
Responsible Author Head of Finance Version v1
Date last amended February 2020 Due for review Feb 2021Treasury Management Strategy Statement 2020/21
2.4 Minimum Revenue Provision Policy Statement
The Council is required to pay off an element of the accumulated General Fund capital spend
each year (the CFR) through a revenue charge (the Minimum Revenue Provision - MRP),
although it is also allowed to undertake additional voluntary payments if required (voluntary
revenue provision - VRP).
DCLG Regulations have been issued which require the full Council to approve an MRP
Statement in advance of each year. A variety of options are provided to councils, so long as
there is a prudent provision. The Council is recommended to approve the following MRP
Statement :
Since the 1st April 2008 all unsupported borrowing (including PFI and finance leases when
applicable) has been repaid using the following MRP policy:
Asset Life Method – MRP will be based on the estimated life of the assets, in accordance
with the proposed regulations (this option must be applied for any expenditure capitalised
under a Capitalisation Direction);
This provides for a reduction in the borrowing need over approximately the same term as the
asset’s life.
MRP Overpayments - A change introduced by the revised MHCLG MRP Guidance was the
allowance that any charges made over the statutory Minimum Revenue Provision (MRP),
Voluntary Revenue Provision (VRP) or overpayments, can, if needed, be reclaimed in later
years if deemed necessary or prudent. In order for these sums to be reclaimed for use in the
budget, this policy must disclose the cumulative overpayment made each year. In 2018/19
the Council made VRP overpayments of £657k.
Responsible Section/Team Financial Services Page 9
Responsible Author Head of Finance Version v1
Date last amended February 2020 Due for review Feb 2021Treasury Management Strategy Statement 2020/21
3 BORROWING
The capital expenditure plans set out in Section 2 provide details of the service activity of the
Council. The treasury management function ensures that the Council’s cash is organised in
accordance with the the relevant professional codes, so that sufficient cash is available to
meet this service activity. This will involve both the organisation of the cash flow and, where
capital plans require, the organisation of approporiate borrowing facilities. The strategy covers
the relevant treasury / prudential indicators, the current and projected debt positions and the
annual investment strategy.
3.1 Current Portfolio Position
The Council’s treasury portfolio position at 31 March 2019, with forward projections are
summarised below. The table shows the actual external debt (the treasury management
operations), against the underlying capital borrowing need (the Capital Financing Requirement
- CFR), highlighting any over or under borrowing.
2017/18 2019/20 2020/21 2021/22 2022/23
2018/19
Borrowing Position Actual Estimate Estimate Estimate Estimate
Actual £000
£000 £000 £000 £000 £000
Debt at 1st April 3,312 3,128 2,944 4,710 12,031 11,357
Debt Repayments (184) (184) (234) (479) (674) (674)
New Debt - - 2,000 7,800 - -
Debt at 31st March 3,128 2,944 4,710 12,031 11,357 10,683
Original PWLB Loan 3,128 2,944 2,760 2,576 2,392 2,208
Futures Park Plot 5 1,950 1,850 1,750 1,650
Spinning Point Ph2 7,605 7,215 6,825
Capital Financing Requirement (CFR) 8,751 8,203 12,331 20,544 20,548 20,572
Under / (over) borrowing 5,623 5,259 7,621 8,513 9,191 9,889
Within the prudential indicators there are a number of key indicators to ensure that the Council
operates its activities within well-defined limits. One of these is that the Council needs to
ensure that its gross debt, does not, except in the short term, exceed the total of the CFR in the
preceding year plus the estimates of any additional CFR for 2020/21 and the following two financial
years. This allows some flexibility for limited early borrowing for future years, but ensures that
borrowing is not undertaken for revenue purposes.
The Head of Financial Services reports that the Council complied with this prudential indicator
in 2019/20. Given the MTFS cash-flow impacts of current commitments, existing plans, and
the proposals in the main budget report, as explained at 2.3 above, the Head of Financial
Services recommends that the limits to borrowing activity are increased as indicated below.
3.2. Treasury Indicators: Limits to Borrowing Activity
The Operational Boundary. This is the limit beyond which external debt is not normally
expected to exceed. In most cases, this would be a similar figure to the CFR, but may be
lower or higher depending on the levels of actual debt.
2017/18 2018/19 2019/20 2020/21 2021/22 2022/23
Operational boundary
£000 £000 £000 £000 £000 £000
Services Debt 4,500 9,500 10,500 18,750 18,750 18,750
Commercial Debt - - 2,000 2,000 2,000 2,000
Total External Debt 4,500 9,500 12,500 20,750 20,750 20,750
Responsible Section/Team Financial Services Page 10
Responsible Author Head of Finance Version v1
Date last amended February 2020 Due for review Feb 2021Treasury Management Strategy Statement 2020/21
The Authorised Limit for external debt. A further key prudential indicator represents a
control on the maximum level of borrowing. This represents a limit beyond which external
debt is prohibited, and this limit needs to be set or revised by the full Council. It reflects the
level of external debt which, while not desired, could be afforded in the short term, but is not
sustainable in the longer term.
1. This is the statutory limit determined under section 3 (1) of the Local Government Act
2003. The Government retains an option to control either the total of all councils’ plans, or
those of a specific council, although this power has not yet been exercised.
2. The Council is asked to approve the following authorised limit:
2017/18 2018/19 2019/20 2020/21 2021/22 2022/23
Authorised limit
£000 £000 £000 £000 £000 £000
Services Debt 7,500 10,500 12,500 20,750 20,750 20,750
Commercial Debt - - 2,000 2,000 2,000 2,000
Debt 7,500 10,500 14,500 22,750 22,750 22,750
In graphical terms the relationship between the total CFR, the current external borrowing and
the suggested authorised and operational debt boundaries can be shown as follows. The
prudent level of future potential borrowing is clearly visible as the gap between the predicted
CFR and the current external borrowing level.
Prudential Indicators
£23,000k
£18,000k
£13,000k Commercial External Debt
Services External Debt
£8,000k Total CFR
Authorised Limit
£3,000k Operational Limit
-£2,000k 2017/18 2018/19 2019/20 2020/21 2021/22 2022/23
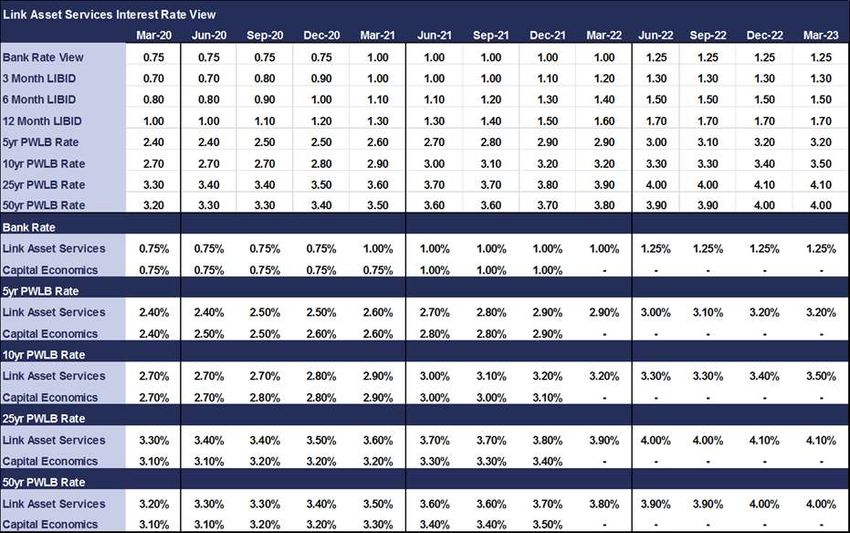
3.3. Prospects for Interest Rates (from Link Asset Services on 31/01/2020).
The Council has appointed Link Asset Services as its treasury advisor and part of their
service is to assist the Council to formulate a view on interest rates. The following table gives
the Link Asset Services central view.
Responsible Section/Team Financial Services Page 11
Responsible Author Head of Finance Version v1
Date last amended February 2020 Due for review Feb 2021Treasury Management Strategy Statement 2020/21
Link Asset Services Interest Rate View
Dec-19 Mar-20 Jun-20 Sep-20 Dec-20 Mar-21 Jun-21 Sep-21 Dec-21 Mar-22 Jun-22 Sep-22 Dec-22 Mar-23
Bank Rate View 0.75 0.75 0.75 0.75 0.75 1.00 1.00 1.00 1.00 1.00 1.25 1.25 1.25 1.25
3 Month LIBID 0.70 0.70 0.70 0.80 0.90 1.00 1.00 1.00 1.10 1.20 1.30 1.30 1.30 1.30
6 Month LIBID 0.80 0.80 0.80 0.90 1.00 1.10 1.10 1.20 1.30 1.40 1.50 1.50 1.50 1.50
12 Month LIBID 1.00 1.00 1.00 1.10 1.20 1.30 1.30 1.40 1.50 1.60 1.70 1.70 1.70 1.70
5yr PWLB Rate 2.30 2.40 2.40 2.50 2.50 2.60 2.70 2.80 2.90 2.90 3.00 3.10 3.20 3.20
10yr PWLB Rate 2.60 2.70 2.70 2.70 2.80 2.90 3.00 3.10 3.20 3.20 3.30 3.30 3.40 3.50
25yr PWLB Rate 3.20 3.30 3.40 3.40 3.50 3.60 3.70 3.70 3.80 3.90 4.00 4.00 4.10 4.10
50yr PWLB Rate 3.10 3.20 3.30 3.30 3.40 3.50 3.60 3.60 3.70 3.80 3.90 3.90 4.00 4.00
The above forecasts have been based on an assumption that there is an agreed deal on
Brexit, including agreement on the terms of trade between the UK and EU, at some point in
time. The result of the general election has removed much uncertainty around this major
assumption. However, it does not remove uncertainty around whether agreement can be
reached with the EU on a trade deal within the short time to December 2020, as the prime
minister has pledged.
It has been little surprise that the Monetary Policy Committee (MPC) has left Bank Rate
unchanged at 0.75% so far in 2019 due to the ongoing uncertainty over Brexit and the
outcome of the general election. In its meeting on 7 November, the MPC became more
dovish due to increased concerns over the outlook for the domestic economy if Brexit
uncertainties were to become more entrenched, and for weak global economic growth: if those
uncertainties were to materialise, then the MPC were likely to cut Bank Rate. However, if they
were both to dissipate, then rates would need to rise at a “gradual pace and to a limited
extent”. Brexit uncertainty has had a dampening effect on UK GDP growth in 2019, especially
around mid-year. There is still some residual risk that the MPC could cut Bank Rate as the UK
economy is still likely to only grow weakly in 2020 due to continuing uncertainty over whether
there could effectively be a no deal Brexit in December 2020 if agreement on a trade deal is
not reached with the EU. Until that major uncertainty is removed, or the period for agreeing a
deal is extended, it is unlikely that the MPC would raise Bank Rate.
Bond yields / PWLB rates. There has been much speculation during 2019 that the bond
market has gone into a bubble, as evidenced by high bond prices and remarkably low yields.
However, given the context that there have been heightened expectations that the US was
heading for a recession in 2020, and a general background of a downturn in world economic
growth, together with inflation generally at low levels in most countries and expected to remain
subdued, conditions are ripe for low bond yields. While inflation targeting by the major central
banks has been successful over the last thirty years in lowering inflation expectations, the real
equilibrium rate for central rates has fallen considerably due to the high level of borrowing by
consumers: this means that central banks do not need to raise rates as much now to have a
major impact on consumer spending, inflation, etc. This has pulled down the overall level of
interest rates and bond yields in financial markets over the last thirty years. We have
therefore seen over the last year, many bond yields up to ten years in the Eurozone actually
turn negative. In addition, there has, at times, been an inversion of bond yields in the US
whereby ten-year yields have fallen below shorter-term yields. In the past, this has been a
precursor of a recession. The other side of this coin is that bond prices are elevated, as
investors would be expected to be moving out of riskier assets i.e. shares, in anticipation of a
downturn in corporate earnings and so selling out of equities. However, stock markets are
also currently at high levels as some investors have focused on chasing returns in the context
of dismal ultra-low interest rates on cash deposits.
Responsible Section/Team Financial Services Page 12
Responsible Author Head of Finance Version v1
Date last amended February 2020 Due for review Feb 2021Treasury Management Strategy Statement 2020/21
During the first half of 2019-20 to 30 September, gilt yields plunged and caused a near halving
of longer term PWLB rates to completely unprecedented historic low levels. There is though,
an expectation that financial markets have gone too far in their fears about the degree of the
downturn in US and world growth. If, as expected, the US only suffers a mild downturn in
growth, bond markets in the US are likely to sell off and that would be expected to put upward
pressure on bond yields, not only in the US, but also in the UK due to a correlation between
US treasuries and UK gilts; at various times this correlation has been strong but at other times
weak. However, forecasting the timing of this, and how strong the correlation is likely to be, is
very difficult to forecast with any degree of confidence. Changes in UK Bank Rate will also
impact on gilt yields.
One potential danger that may be lurking in investor minds is that Japan has become mired in
a twenty-year bog of failing to get economic growth and inflation up off the floor, despite a
combination of massive monetary and fiscal stimulus by both the central bank and
government. Investors could be fretting that this condition might become contagious to other
western economies.
Another danger is that unconventional monetary policy post 2008, (ultra-low interest rates plus
quantitative easing), may end up doing more harm than good through prolonged use. Low
interest rates have encouraged a debt-fuelled boom that now makes it harder for central
banks to raise interest rates. Negative interest rates could damage the profitability of
commercial banks and so impair their ability to lend and / or push them into riskier lending.
Banks could also end up holding large amounts of their government’s bonds and so create a
potential doom loop. (A doom loop would occur where the credit rating of the debt of a nation
was downgraded which would cause bond prices to fall, causing losses on debt portfolios held
by banks and insurers, so reducing their capital and forcing them to sell bonds – which, in
turn, would cause further falls in their prices etc.). In addition, the financial viability of pension
funds could be damaged by low yields on holdings of bonds.
The overall longer run future trend is for gilt yields, and consequently PWLB rates, to rise,
albeit gently. From time to time, gilt yields, and therefore PWLB rates, can be subject to
exceptional levels of volatility due to geo-political, sovereign debt crisis, emerging market
developments and sharp changes in investor sentiment. Such volatility could occur at any time
during the forecast period.
In addition, PWLB rates are subject to ad hoc decisions by H.M. Treasury to change the
margin over gilt yields charged in PWLB rates: such changes could be up or down. It is not
clear that if gilt yields were to rise back up again by over 100bps within the next year or so,
whether H M Treasury would remove the extra 100 bps margin implemented on 9.10.19.
Economic and interest rate forecasting remains difficult with so many influences weighing on
UK gilt yields and PWLB rates. The above forecasts, (and MPC decisions), will be liable to
further amendment depending on how economic data and developments in financial markets
transpire over the next year. Geopolitical developments, especially in the EU, could also have
a major impact. Forecasts for average investment earnings beyond the three-year time
horizon will be heavily dependent on economic and political developments.
Investment and borrowing rates
Investment returns are likely to remain low during 2020/21 with little increase in the
following two years. However, if major progress was made with an agreed Brexit, then
there is upside potential for earnings.
Borrowing interest rates were on a major falling trend during the first half of 2019-20 but
then jumped up by 100 bps on 9th October 2019. The policy of avoiding new borrowing
by running down spare cash balances has served local authorities well over the last few
years. However, the unexpected increase of 100 bps in PWLB rates requires a major
rethink of local authority treasury management strategy and risk management. Now that
Responsible Section/Team Financial Services Page 13
Responsible Author Head of Finance Version v1
Date last amended February 2020 Due for review Feb 2021Treasury Management Strategy Statement 2020/21
the gap between longer term borrowing rates and investment rates has materially
widened, and in the long term Bank Rate is not expected to rise above 2.5%, it is
unlikely that this authority will do any further longer term borrowing for the next three
years, or until such time as the extra 100 bps margin is removed (amend as
appropriate).
While this authority will not be able to avoid borrowing to finance new capital
expenditure, to replace maturing debt and the rundown of reserves, (amend as
appropriate), there will be a cost of carry, (the difference between higher borrowing costs
and lower investment returns), to any new short or medium-term borrowing that causes
a temporary increase in cash balances as this position will, most likely, incur a revenue
cost.
3.4 Borrowing Strategy
The Council has been maintaining an under-borrowed position. This means that the capital
borrowing need (the Capital Financing Requirement), has not been fully funded with loan debt
as cash supporting the Council’s reserves, balances and cash flow has been used as a
temporary measure. This strategy was prudent in the past, however, reserves and cash are
being used to support the MTFS and the Capital Programme, leading to an increasing need
for future borrowing.
Against this background and the risks within the economic forecast, caution will be adopted
with the 2020/21 treasury operations. The Head of Finance will monitor interest rates in
financial markets and adopt a pragmatic approach to changing circumstances:
if it was felt that there was a significant risk of a sharp FALL in long and short term rates,
e.g. due to a marked increase of risks around relapse into recession or of risks of
deflation, then long term borrowings will be postponed, and potential rescheduling from
fixed rate funding into short term borrowing will be considered.
if it was felt that there was a significant risk of a much sharper RISE in long and short term
rates than that currently forecast, perhaps arising from an acceleration in the start date
and in the rate of increase in central rates in the USA and UK, an increase in world
economic activity or a sudden increase in inflation risks, then the portfolio position will be
re-appraised. Most likely, fixed rate funding will be drawn whilst interest rates are still
lower than they will be in the next few years.
Any decisions will be reported to Cabinet at the next available opportunity.
3.5 Policy on Borrowing in Advance of Need
The Council will not borrow more, than or in advance of its needs, purely in order to profit from
the investment of the extra sums borrowed. Any decision to borrow in advance will be within
forward approved Capital Financing Requirement estimates, and will be considered carefully
to ensure that value for money can be demonstrated and that the Council can ensure the
security of such funds.
Borrowing in advance will be made within the constraints that:
It will be limited to no more than 100% of the expected increase in borrowing need (CFR)
over the three year planning period; and
Would not look to borrow more than 18 months in advance of need.
Risks associated with any borrowing in advance activity will be subject to prior appraisal and
subsequent reporting through the mid-year or annual reporting mechanism.
Responsible Section/Team Financial Services Page 14
Responsible Author Head of Finance Version v1
Date last amended February 2020 Due for review Feb 2021Treasury Management Strategy Statement 2020/21
3.6 Debt Rescheduling
As short term borrowing rates will be considerably cheaper than longer term fixed interest
rates, there may be potential opportunities to generate savings by switching from long term
debt to short term debt. However, these savings will need to be considered in the light of the
current treasury position and the size of the cost of debt repayment (premiums incurred).
The reasons for any rescheduling to take place will include:
the generation of cash savings and / or discounted cash flow savings;
helping to fulfil the treasury strategy;
enhance the balance of the portfolio (amend the maturity profile and/or the balance of
volatility).
Consideration will also be given to identify if there is any residual potential for making savings
by running down investment balances to repay debt prematurely as short term rates on
investments are likely to be lower than rates paid on current debt.
All rescheduling will be reported to the Cabinet, at the earliest meeting following its action.
3.7 Municipal Bond Agency
It is likely that the Municipal Bond Agency will be offering loans to local authorities in the
future. The Agency hopes that the borrowing rates will be lower than those offered by the
Public Works Loan Board (PWLB). This Authority may consider use of this new source of
borrowing as and when appropriate.
Responsible Section/Team Financial Services Page 15
Responsible Author Head of Finance Version v1
Date last amended February 2020 Due for review Feb 2021Treasury Management Strategy Statement 2020/21
4 ANNUAL INVESTMENT STRATEGY
4.1 Investment Policy
The MHCLG and CIPFA have extended the meaning of ‘investments’ to include both financial
and non-financial investments. This report deals solely with financial investments, (as
managed by the treasury management team). Non-financial investments, essentially the
purchase of income yielding assets, are covered in the Capital Strategy, (a separate report).
The Council’s investment policy has regard to the following: -
• MHCLG’s Guidance on Local Government Investments (“the Guidance”)
• CIPFA Treasury Management in Public Services Code of Practice and Cross Sectoral
Guidance Notes 2017 (“the Code”)
• CIPFA Treasury Management Guidance Notes 2018
The Council’s investment priorities will be security first, portfolio liquidity second and then
yield, (return).
The above guidance from the MHCLG and CIPFA place a high priority on the management of
risk. This authority has adopted a prudent approach to managing risk and defines its risk
appetite by the following means: -
1. Minimum acceptable credit criteria are applied in order to generate a list of highly
creditworthy counterparties. This also enables diversification and thus avoidance of
concentration risk. The key ratings used to monitor counterparties are the short term and
long-term ratings.
2. Other information: ratings will not be the sole determinant of the quality of an institution;
it is important to continually assess and monitor the financial sector on both a micro and
macro basis and in relation to the economic and political environments in which
institutions operate. The assessment will also take account of information that reflects the
opinion of the markets. To achieve this consideration the Council will engage with its
advisors to maintain a monitor on market pricing such as “credit default swaps” and
overlay that information on top of the credit ratings.
Other information sources used will include the financial press, share price and other such
information pertaining to the banking sector in order to establish the most robust scrutiny
process on the suitability of potential investment counterparties.
Investment instruments identified for use in the financial year are listed in appendix 5.4 under
the ‘Specified’ and ‘Non-Specified’ Investments categories. Counterparty limits will be as set
through the Council’s Treasury Management Practices – Schedules.
4.2 Creditworthiness policy
The primary principle governing the Council’s investment criteria is the security of its
investments, although the yield or return on the investment is also a key consideration. After
this main principle the Council will ensure that:
It maintains a policy covering both the categories of investment types it will invest in,
criteria for choosing investment counterparties with adequate security, and monitoring
their security. This is set out in the Specified and Non-Specified investment sections
below; and
It has sufficient liquidity in its investments. For this purpose it will set out procedures for
determining the maximum periods for which funds may prudently be committed. These
Responsible Section/Team Financial Services Page 16
Responsible Author Head of Finance Version v1
Date last amended February 2020 Due for review Feb 2021Treasury Management Strategy Statement 2020/21
procedures also apply to the Council’s prudential indicators covering the maximum
principal sums invested.
The Head of Finance will maintain a counterparty list in compliance with the following criteria
and will revise the criteria and submit them to Council for approval as necessary. These
criteria are separate to that which determines which types of investment instrument are either
specified or non-specified as it provides an overall pool of counterparties considered high
quality which the Council may use, rather than defining what types of investment instruments
are to be used.
Credit rating information is supplied by Link Asset Services, our treasury advisors, on all active
counterparties that comply with the criteria below. Any counterparty failing to meet the criteria
would be omitted from the counterparty (dealing) list. Any rating changes, rating watches
(notification of a likely change), rating outlooks (notification of a possible longer term change)
are provided to officers almost immediately after they occur and this information is considered
before dealing. For instance, a negative rating watch applying to a counterparty at the
minimum Council criteria will be suspended from use, with all others being reviewed in light of
market conditions.
The criteria for providing a pool of high quality investment counterparties (both Specified and
Non-specified investments) is:
Banks 1 - good credit quality – the Council will only use banks which:
i. are UK banks; and/or
ii. are non-UK and domiciled in a country which has a minimum sovereign long term
rating of AAA
and have, as a minimum, the following Fitch, Moody’s and Standard and Poors
credit ratings (where rated):
i. Short term - F1
ii. Long term – A
Banks 2 – Part nationalised UK banks –Royal Bank of Scotland. These banks can be
included if they continue to be part nationalised or they meet the ratings in Banks
1 above.
Banks 3 – The Council’s own banker for transactional purposes if the bank falls below
the above criteria, although in this case balances will be minimised in both
monetary size and time.
Bank subsidiary and treasury operation -. The Council will use these where the parent
bank has provided an appropriate guarantee or has the necessary ratings outlined
above.
Local authorities, parish councils etc
Money Market Funds – using only those with AAA long-term rating backed up with
lowest volatility rating (MR1+)
Supranational institutions
Rossendale Leisure Trust to a maximum of £100k
Other related parties (where a charge can be placed on land or equity to preserve the
Council’s rights to its resources).
Responsible Section/Team Financial Services Page 17
Responsible Author Head of Finance Version v1
Date last amended February 2020 Due for review Feb 2021Treasury Management Strategy Statement 2020/21
UK banks – ring fencing
The largest UK banks, (those with more than £25bn of retail / Small and Medium-sized
Enterprise (SME) deposits), are required, by UK law, to separate core retail banking
services from their investment and international banking activities by 1st January 2019.
This is known as “ring-fencing”. Whilst smaller banks with less than £25bn in deposits are
exempt, they can choose to opt up. Several banks are very close to the threshold already
and so may come into scope in the future regardless.
Ring-fencing is a regulatory initiative created in response to the global financial crisis. It
mandates the separation of retail and SME deposits from investment banking, in order to
improve the resilience and resolvability of banks by changing their structure. In general,
simpler, activities offered from within a ring-fenced bank, (RFB), will be focused on lower
risk, day-to-day core transactions, whilst more complex and “riskier” activities are required
to be housed in a separate entity, a non-ring-fenced bank, (NRFB). This is intended to
ensure that an entity’s core activities are not adversely affected by the acts or omissions
of other members of its group.
While the structure of the banks included within this process may have changed, the
fundamentals of credit assessment have not. The Council will continue to assess the
new-formed entities in the same way that it does others and those with sufficiently high
ratings, (and any other metrics considered), will be considered for investment purposes.
4.3 Other Considerations
Country and sector considerations
Due care will be taken to consider the country, group and sector exposure of the Council’s
investments. For the forseeable future this Council will only invest in UK based institutions.
Use of additional information other than credit ratings.
Additional requirements under the Code require the Council to supplement credit rating
information. Whilst the above criteria relies primarily on the application of credit ratings to
provide a pool of appropriate counterparties for officers to use, additional operational market
information will be applied before making any specific investment decision from the agreed
pool of counterparties. This additional market information (for example Credit Default Swaps,
negative rating watches/outlooks) will be applied to compare the relative security of differing
investment counterparties.
Time and monetary limits applying to investments.
All investments will be made for no more than 365 days, i.e short-term.
The proposed criteria for Specified and Non-Specified investments are shown in Appendix 5
for approval.
4.4 Investment Strategy
In-house funds. Investments will be made with reference to the core balance and cash flow
requirements and the outlook for short-term interest rates (i.e. rates for investments up to 12
months).
Responsible Section/Team Financial Services Page 18
Responsible Author Head of Finance Version v1
Date last amended February 2020 Due for review Feb 2021Treasury Management Strategy Statement 2020/21
Investment returns expectations.
On the assumption that the UK and EU agree a Brexit deal including the terms of trade by the
end of 2020 or soon after, then Bank Rate is forecast to increase only slowly over the next few
years to reach 1.00% by quarter 1 2023. Bank Rate forecasts for financial year ends (March)
are:
Q1 2021 0.75%
Q1 2022 1.00%
Q1 2023 1.25%
The suggested budgeted investment earnings rates for returns on investments placed for
periods up to about three months during each financial year are as follows:
2019/20 0.75%
2020/21 0.75%
2021/22 1.00%
2022/23 1.25%
2023/24 1.50%
2024/25 1.75%
Later years 2.25%
• The overall balance of risks to economic growth in the UK is probably to the downside
due to the weight of all the uncertainties over Brexit, as well as a softening global
economic picture.
• The balance of risks to increases in Bank Rate and shorter term PWLB rates are broadly
similarly to the downside.
• In the event that a Brexit deal is agreed with the EU and approved by Parliament, the
balance of risks to economic growth and to increases in Bank Rate is likely to change to
the upside.
Investment treasury indicator and limit
Total principal funds invested for greater than 365 days. These limits are set with regard to the
Council’s liquidity requirements and to reduce the need for early sale of an investment, and
are based on the availability of funds after each year-end.
The Council is asked to approve the treasury indicator and limit: -
Maximum principal sums 2020/21 2021/22 2022/23
invested > 365 days £m £m £m
Principal sums invested >
Nil Nil Nil
365 days
4.5 End of year investment report
At the end of the financial year, the Council will report on its investment activity as part of its
Financial Monitoring.
4.6 External fund managers
The Council does not currently use external fund managers.
Responsible Section/Team Financial Services Page 19
Responsible Author Head of Finance Version v1
Date last amended February 2020 Due for review Feb 2021Treasury Management Strategy Statement 2020/21 5 APPENDICES 5.1 Prudential and treasury indicators 5.2 Interest rate forecasts 5.3 Economic background 5.4 Treasury Management practice - specified and non specified investments and limits 5.5 Approved countries for investments 5.6 Treasury management scheme of delegation 5.7 The treasury management role of the section 151 officer and other officers 5.8 Glossary Responsible Section/Team Financial Services Page 20 Responsible Author Head of Finance Version v1 Date last amended February 2020 Due for review Feb 2021
Treasury Management Strategy Statement 2020/21

5.1 THE CAPITAL PRUDENTIAL AND TREASURY INDICATORS
    2020/21 – 2022/23 AND MRP STATEMENT
  The Council’s capital expenditure plans are the key driver of treasury management activity.
  The output of the capital expenditure plans is reflected in the prudential indicators, which are
  designed to assist members’ overview and confirm capital expenditure plans.

5.1.1 Capital expenditure
                                                     2017/18                   2019/20      2020/21      2021/22      2022/23
                                                                 2018/19
   Capital Expenditure                                Actual                  Estimate     Estimate     Estimate     Estimate
                                                             Actual £000
                                                        £000                      £000         £000         £000         £000
   Operational Services:
     Operations & Communities                           472          606        1,684          382          770          790
     Customer Services & IT                               6            -            -            -            -            -
     Regeneration (incl Spinning Point)               6,233        2,496        5,151        7,800            -            -
     Corporate Services and Buildings                   149          200          578          144           75           75
     Housing                                            587          889        2,026        1,000        1,100        1,100
   Commercial Activities: *
     Investment Construction (Council July 18)            -            -        3,898            -            -             -
   Total                                              7,447        4,191       13,337        9,326        1,945        1,965

5.1.3      Affordability prudential indicators
   The previous sections cover the overall capital and control of borrowing prudential indicators,
   but within this framework prudential indicators are required to assess the affordability of the
   capital investment plans. These provide an indication of the impact of the capital investment
   plans on the Council’s overall finances. The Council is asked to approve the following
   indicators:

   a. Ratio of financing costs to net revenue stream
  This indicator identifies the trend in the cost of capital (borrowing and other long term
  obligation costs net of investment income) against the net revenue stream.

                                                      2017/18                   2019/20      2020/21      2021/22      2022/23
    Ratio of financing costs                                       2018/19
                                                       Actual                  Estimate     Estimate     Estimate     Estimate
    to net revenue stream                                      Actual £000
                                                         £000                      £000         £000         £000         £000
    Interest Payable - Services                          149          140          130          247          238          238
    Interest Payable - Commercial Activities                -            -           32           32           32           32
    Interest Receivable                                   (72)         (51)         (96)         (51)         (51)         (51)
    Net cost of capital                                   77           89           66          228          219          219
    Net Revenue Stream                                  9,241       9,182       10,070       10,064       10,104       10,104

    Ratio of financing costs to net revenue stream      0.83%       0.97%         0.66%       2.27%        2.17%        2.17%

   The estimates of financing costs include current commitments and the proposals in this
   budget report.

5.1.4 Maturity structure of borrowing
   These gross limits are set to reduce the Council’s exposure to large fixed rate sums falling
   due for refinancing, and are required for upper and lower limits.
   The Council is asked to approve the following treasury indicators and limits:

Responsible Section/Team                 Financial Services             Page                               21
Responsible Author                       Head of Finance                Version                            v1
Date last amended                        February 2020                  Due for review                     Feb 2021
You can also read