A Broken Social Elevator? How to Promote Social Mobility - OECD
←
→
Page content transcription
If your browser does not render page correctly, please read the page content below

A Broken Social Elevator? How to Promote
Social Mobility
OVERVIEW AND MAIN FINDINGS
                                                                                                                    A Broken Social Elevator?
                                                                                                                    How to Promote Social
This report provides new evidence on social mobility in the context of increased inequalities of income and
opportunities in OECD and selected emerging economies. It covers the aspects of both social mobility between
parents and children and of personal income mobility over the life course, and their drivers. The report shows
that social mobility from parents to offspring is low across the different dimensions of earnings, education,
occupation and health, and that the same prevails for personal income mobility over the life course. There is in
particular a lack of mobility at the bottom and at the top of the social ladder – with “sticky floors” preventing
                                                                                                                    Mobility
upward mobility for many and “sticky ceilings” associated with opportunity hoarding at the top. The lack of
social mobility has economic, societal and political consequences. This report shows that there is space for
policies to make societies more mobile and protect households from adverse income shocks. It discusses the
options and measures that policy makers can consider how to improve social mobility across and within
generations.                                                                                                        OVERVIEW AND MAIN FINDINGS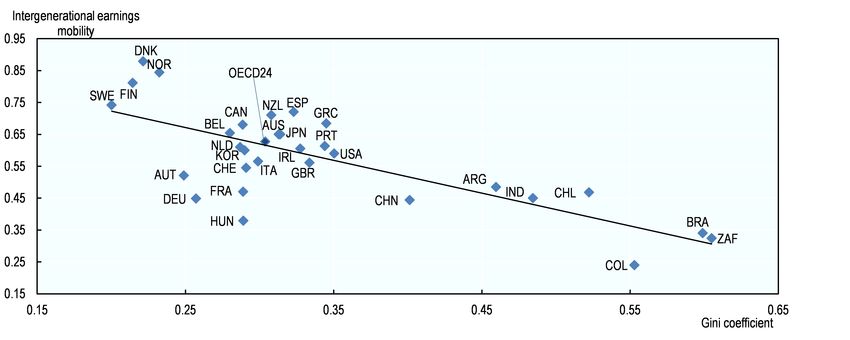
A Broken Social Elevator?
 How to Promote Social
        Mobility

 OVERVIEW AND MAIN FINDINGS

   EMBARGO until 15 June 2018, 11:00
FOREWORD – 3
Foreword
The OECD has been at the forefront of documenting the rise of inequality for several
decades. The data paint a stark picture: the average disposable income of the richest 10% of
the population is now around nine and a half times that of the poorest 10% across the
OECD, up from seven times 25 years ago. Wealth inequality is even more pronounced,
with the top 10% holding half of total wealth, while the bottom 40% holds only 3%. The
financial crisis reinforced these trends, but inequalities still increased and the benefits of
growth still mainly benefited the top of the income distribution in OECD countries even
during the highest periods of global economic expansion before 2008. In many emerging
and developing countries, inequalities remain large despite significant poverty reduction.
We have long emphasised the multi-dimensional nature of inequality. Socio-economic
status heavily influences employment prospects, job quality, health outcomes, education,
and the other opportunities (including access to relevant networks) that matter to people’s
well-being. Children whose parents did not complete secondary school have only a 15%
chance of making it to university compared to a 60% chance for their peers with at least one
parent who achieved tertiary-level education. Disadvantage at the outset can follow
children throughout their life. Educational disadvantage typically means not only smaller
salaries, but, most worryingly of all, shorter lives. A 25 year-old university-educated man
can expect to live almost eight years longer than his lower-educated peer on average across
OECD countries; the difference is 4.6 years for women.
The vicious confluence of poor educational opportunities, low skills and limited
employment prospects can trap people in situations where they are also are far more likely
to be exposed to environmental hazards and violence. As a result of this multidimensional
inequality, while some individuals, cities and regions thrive, others fall further behind.
This is not only unacceptable and unsustainable ethically or socially, inequality also
impacts the prospects of higher productivity and growth. The OECD report on the
Productivity-Inclusiveness Nexus warns that low-income families and lagging regions lack
the means to invest in their own future and the assets needed to succeed in life. In this, and
other publications, we have looked at how to create an enabling environment that can
support people, regions and firms in fulfilling their full potential. This is not only about
redistribution policies, but about the whole economic framework that needs to incorporate
equity considerations from the beginning.
The present report, A Broken Social Elevator? How to Promote Social Mobility sheds
light on another angle of the inequality challenge, that of social mobility. Its findings
confirm the worrisome trends seen in all other dimensions of inequality. Families and
communities in many countries seem to be trapped on the bottom rungs of the social ladder,
particularly since the early 1980s. This means that children born into the bottom of the
income distribution have less chance to move up and improve their occupational status and
earnings than their parents and previous generations. At the other end of the scale, there is a
“sticky ceiling” because inequality also means that those at the top of the income
A BROKEN SOCIAL ELEVATOR? HOW TO PROMOTE SOCIAL MOBILITY © OECD 20184 – FOREWORD
distribution may remain there for a long time. In an “average OECD country”, it could take
five generations for children of poor families to reach the average income in their country.
This report is an important part of the OECD response to these challenges and of the
Organisation’s effort to develop a “people-centred growth model” in which well-being is
the metric of success; where everyone has an equal opportunity to prosper; and where
equity considerations are important in defining effective economic policies. The report
looks at social mobility across generations, in income, education, health and
occupation, and at how these are linked to inequality. It also analyses factors shaping and
determining social mobility over the life course and shows how a good understanding of the
patterns, dimensions and trends of social mobility is crucial for designing better policies
that promote more-inclusive growth. The report assesses the implications of reduced social
mobility and discusses how education, health and family policies, taxes and transfers, and
local and urban policies can best promote equal opportunities for all.
The present volume is the fourth in a series of OECD flagship publications on trends,
causes, consequences and remedies for growing inequalities. Growing Unequal? (2008)
and Divided We Stand (2011) analysed the key features and causes of trends in rising
income inequality in advanced and major emerging economies. In it Together (2015)
looked at the consequences of inequality, including how trends in inequality have affected
economic growth. It also examined the impact on household income inequality of fiscal
consolidation and redistribution policies, of structural labour market changes, and of
persistent gender gaps. It is also part of the OECD’s broader Inclusive Growth Initiative,
that has just released its Framework for Policy Action, with a dashboard of indicators, and
policy tools that have been effective at addressing inequalities. We hope that this report,
along with the new Framework for Policy Action and the Jobs Strategy will help countries
develop and implement policies that improve social mobility and create economies that
work for everyone.
Gabriela Ramos
Chief of Staff and Sherpa
In charge of the Inclusive Growth Initiative and of the New Approaches to Economic
Challenges Initiative
A BROKEN SOCIAL ELEVATOR? HOW TO PROMOTE SOCIAL MOBILITY © OECD 2018ACKNOWLEDGEMENTS – 5
Acknowledgements
This report is the outcome of a collective effort with contributions from a team of
policy analysts from the OECD Jobs and Income Division of the Directorate for
Employment, Labour and Social Affairs (ELS). Michael Förster (Jobs and Income
Division) led the team and co-ordinated the project and the publication. Principal authors of
the chapters were Ana Llena-Nozal (Jobs and Income Division at the time of writing):
Chapters 4, 5 and 6; and Céline Thévenot (Jobs and Income Division): Chapters 2, 3 and 6.
Guillaume Cohen (Statistics Directorate), Luis Cecchi, Alexandre Georgieff, Karolin
Killmeier, Sebastian Königs, Thomas Manfredi, Sebastian Martin, Agnès Puymoyen and
Odile Rouhban (Jobs and Income Division) contributed to all chapters and provided
statistical and research assistance.
Stéphane Carcillo, Head of the OECD Jobs and Income Division, supervised the
preparation of this report, and prepared Chapter 1 with Michael Förster drawing on the
analyses carried out in the other chapters. Lucy Hulett and Liv Gudmundson prepared the
manuscript for publication and Patrick Hamm contributed to the editing of the report.
We are very grateful to Gabriela Ramos (OECD Chief of Staff and Sherpa to the G20),
Stefano Scarpetta (Director of ELS), Mark Pearson (Deputy Director of ELS) and Monika
Queisser (Senior Counsellor in ELS) for their guidance and extensive comments on various
versions of the report. We gratefully acknowledge the many suggestions provided by
members of the Working Party on Social Policy and the Employment, Labour and Social
Affairs Committee of the OECD as well as by experts of the European Commission. We
also thankfully acknowledge the comments and suggestions provided by colleagues from
OECD Directorates: the Economics Department, the Directorate for Education and Skills,
the Directorate for Employment, Labour and Social Affairs, the Centre for Tax Policy and
Administration and the Statistics Directorate. Finally, we are indebted to Professors Rolf
Aaberge (Statistics Norway), Anders Björklund (Swedish Institute for Social Research),
Brian Nolan (Oxford University), Michele Raitano (University La Sapienza) and Sander
Wagner (University Pompeu Fabra) for their comments and suggestions on the initial drafts
of several chapters of this report.
The OECD work on social mobility was carried out with the financial assistance of the
European Union, DG Employment, and the Chilean Ministry of Social Development, and
the OECD would like to thank them for their support. The report also benefited from a
close collaboration with the Social Research Division of Employment and Social
Development Canada, the Hungarian Tárki Social Research Institute and the Keio
University Panel Data Research Center, for country specific analyses.
This document was produced with the financial assistance of the European Union. The
views expressed herein can in no way be taken to reflect the official opinion of the OECD
member countries or the European Union.
A BROKEN SOCIAL ELEVATOR? HOW TO PROMOTE SOCIAL MOBILITY © OECD 2018TABLE OF CONTENTS – 7
Table of contents
Executive summary...................................................................................................................................... 13
Chapter 1. Overview .................................................................................................................................... 19
Introduction ................................................................................................................................................ 20
1.1. Social mobility: Why policy makers should care ................................................................................ 20
1.2. How does social mobility work? Concepts and measurement ............................................................ 24
1.3. What have we found? New evidence from the OECD and emerging economies ............................... 26
1.4. What can be done to foster social mobility? ....................................................................................... 39
Notes........................................................................................................................................................... 57
References .................................................................................................................................................. 58
Chapter 2. Income dynamics and income mobility over the life course ................................................. 63
Introduction ................................................................................................................................................ 64
2.1. Income mobility and inequality ........................................................................................................... 66
2.2. Positional mobility: Sticky floors at the bottom, and sticky ceilings at the top .................................. 69
2.3. Changes in income mobility since the 1990s ...................................................................................... 80
2.4. Emerging economies: More income mobility overall ......................................................................... 89
2.5. Patterns of income changes and their mapping across countries......................................................... 91
2.6. Conclusion ......................................................................................................................................... 100
Notes......................................................................................................................................................... 102
References ................................................................................................................................................ 104
Annex 2.A1. Available data sources to measure income mobility ........................................................... 109
Annex 2.A2. Changes in income mobility since the 1990s – detailed results .......................................... 111
Annex 2.A3. Methodology to estimate Income mobility with pseudo-panels ......................................... 115
Annex 2.A4. Distribution of the population by income quintile over life: Differences between
the cohorts born in 1950 and 1970 ........................................................................................................... 119
Annex Notes ............................................................................................................................................. 122
Chapter 3. Time is money: What drives income mobility? .................................................................... 123
Introduction .............................................................................................................................................. 124
3.1. The big picture: Labour market transitions are more relevant than household changes
for income mobility at the bottom of the income distribution.................................................................. 125
3.2. The role of labour market trajectories in shaping income mobility .................................................. 130
3.3. The role of household events for income changes ............................................................................ 143
3.4. The role of social transfers and income taxes in smoothing income changes ................................... 152
3.5. Conclusion ......................................................................................................................................... 155
Notes......................................................................................................................................................... 156
References ................................................................................................................................................ 157
Annex 3.A1. Data and definitions used in the chapter ............................................................................. 162
Annex 3.A2. Estimates of large income changes ..................................................................................... 163
Annex 3.A3. Estimates of relative positional mobility ............................................................................ 167
Annex 3.A4. Decomposition of income changes by income components and household size effect ...... 175
A BROKEN SOCIAL ELEVATOR? HOW TO PROMOTE SOCIAL MOBILITY © OECD 20188 – TABLE OF CONTENTS
Chapter 4. From one generation to the next: Mobility of socio-economic status ................................ 177
Introduction .............................................................................................................................................. 178
4.1. The link between parents’ and children’s social class....................................................................... 180
4.2. Levels, trends and drivers of earnings mobility for sons................................................................... 191
4.3. Going beyond average father-son correlations: How parental background affects resources at
different points of the distribution and for daughters ............................................................................... 202
4.4. Conclusion ......................................................................................................................................... 212
Notes......................................................................................................................................................... 214
References ................................................................................................................................................ 215
Annex 4.A1. Additional analyses ............................................................................................................. 223
Chapter 5. How parental background affects chances early in life: The transmission of health
and educational outcomes ......................................................................................................................... 229
Introduction .............................................................................................................................................. 230
5.1. To what extent do parents influence their offsprings’ health status and health behaviour? .............. 232
5.2. How much intergenerational mobility in education is there in OECD countries? ............................ 246
5.3. Drivers of intergenerational educational mobility ............................................................................. 261
5.4. Conclusion ......................................................................................................................................... 269
Notes......................................................................................................................................................... 270
References ................................................................................................................................................ 272
Annex 5.A1 .............................................................................................................................................. 278
Chapter 6. Towards social mobility-friendly policies ............................................................................. 287
Introduction .............................................................................................................................................. 288
6.1. Which health and family policies can best foster social mobility? ................................................... 289
6.2. Which education policies can best foster social mobility? ................................................................ 298
6.3. Which labour-market policies can best foster social mobility? ......................................................... 307
6.4. Which tax and transfers system designs can best foster social mobility? ......................................... 318
6.5. Which local development policies help to reduce segregation and improve mobility? .................... 323
6.6. Conclusion ......................................................................................................................................... 332
Notes......................................................................................................................................................... 333
References ................................................................................................................................................ 335
Tables
Table 1.1. Dashboard of relative mobility across different dimensions ....................................................... 38
Table 2.2. Variance decomposition of log incomes by component of income change ................................. 93
Table 2.3. Patterns of income mobility across countries: Synthesis ............................................................. 94
Table 2.A1.1. Availability of major longitudinal income data sources ...................................................... 110
Table 2.A2.1. Share of individuals staying in the same income quintile over four years........................... 111
Table 2.A2.2. Estimated likelihood to stay in the same income quintile controlling by age, education,
country and economic growth ............................................................................................................. 112
Table 2.A2.3. Probability to belong to the bottom and top income quintile four years later, by initial
income quintile.................................................................................................................................... 113
Table 2.A3.1. Data availability for pseudo-panel estimates by year and country....................................... 117
Table 3.A2.1. Probability to have a large income gain (larger than 20%) .................................................. 163
Table 3.A2.2. Probability to have a large income loss (More than -20%) .................................................. 165
Table 3.A3.1. Probability to exit the bottom quintile ................................................................................. 167
Table 3.A3.2. Probability to enter the bottom quintile ............................................................................... 169
Table 3.A3.3. Probability to exit the top quintile........................................................................................ 171
A BROKEN SOCIAL ELEVATOR? HOW TO PROMOTE SOCIAL MOBILITY © OECD 2018TABLE OF CONTENTS – 9
Table 3.A3.4. Probability to enter the top quintile...................................................................................... 173
Table 5.1 Parental background and prenatal effects on health at birth in Canada ...................................... 234
Table 5.2. The impact of parental & socio-economic background on childhood health ............................ 236
Table 5.3. Determinants of the probability of poor health .......................................................................... 240
Table 5.4. Impact of parental education on children's education ................................................................ 260
Table 5.5. Individual and school factors explaining resilience ................................................................... 268
Table 5.A1.1. The impact of early childhood health and other conditions on poor adult self-assessed
health status......................................................................................................................................... 278
Table 5.A1.2. Probability of poor health, controlling for individual fixed effects ..................................... 280
Table 5.A1.3. Impact of parental health on other health status measures ................................................... 281
Table 5.A1.4. Intergenerational health behaviour correlations ................................................................... 282
Table 5.A1.5. Upward educational mobility for the 55-64 and the 25-34 years-old .................................. 285
Table 5.A1.6. Upward mobility from upper secondary or post-secondary non-tertiary to tertiary
education, by parents’ immigrant status (2012 or 2015)..................................................................... 286
Figures
Figure 1.1. More people think it needs well-educated parents to get ahead than two decades ago .............. 21
Figure 1.2. Fewer and fewer people are expecting their incomes to rise in the short term........................... 22
Figure 1.3. Perceived and actual mobility of earnings over one generation ................................................. 22
Figure 1.4. People with a deteriorating economic situation over the past five years are less likely
to feel that their voice counts at country level ...................................................................................... 24
Figure 1.5. At the current level of intergenerational mobility, it takes on average four to five
generations for the offspring of a low-income family to reach the average income ............................. 27
Figure 1.6. Sticky floors in education, occupations and earnings ................................................................. 28
Figure 1.7. Sticky ceilings in occupations and earnings ............................................................................... 30
Figure 1.8. A majority of people remain stuck at the bottom – and at the top of the income distribution ... 31
Figure 1.9. Low-income and high-income persistence over four years across OECD countries.................. 32
Figure 1.10. Risk for lower-, middle- and higher-middle income households to slide down to the bottom. 33
Figure 1.11. Risks to slide down to low income and poverty, by income quintile, OECD average,
1990s and 2010s.................................................................................................................................... 34
Figure 1.12. Inequality of incomes aggregated over several years is lower than in any one year –
but not by that much ............................................................................................................................. 35
Figure 1.13. In most countries, earnings mobility across generations is higher when income inequality
is lower .................................................................................................................................................. 36
Figure 1.14. Educational mobility is higher in countries where public spending on education were
higher .................................................................................................................................................... 39
Figure 1.15. Health mobility is higher in countries where health and social employment is higher ............ 40
Figure 1.16. Participation in ECEC varies across OECD countries, particularly among very young
children ................................................................................................................................................. 41
Figure 1.17. Score in mathematics by socio-economic status of parents, 2015............................................ 42
Figure 1.18. The share of middle income households moving down to the bottom is lower in countries
spending more on active labour market programmes ........................................................................... 51
Figure 1.19. Incidence of training among adults, by skill level .................................................................... 54
Figure 2.1. Cross-sectional inequality and “permanent” income inequality ................................................. 67
Figure 2.2. Cross-sectional inequality and mobility in terms of Gini reduction ........................................... 69
Figure 2.3. Share of income quintiles changes over time ............................................................................. 71
Figure 2.4. Positional income mobility by initial income quintile................................................................ 73
Figure 2.5. Sticky floors: Persistence in the bottom income quintile ........................................................... 75
Figure 2.6. Persistence of low income: Link with economic drivers ............................................................ 76
Figure 2.7. Sticky ceiling at the top: Persistence in the upper income quintile ............................................ 78
A BROKEN SOCIAL ELEVATOR? HOW TO PROMOTE SOCIAL MOBILITY © OECD 201810 – TABLE OF CONTENTS
Figure 2.8. Persistence at the top of the income distribution: Link with economic drivers .......................... 79
Figure 2.9. Sticky floors at the bottom and sticky ceilings at the top: Persistence in the bottom and top
income quintile...................................................................................................................................... 80
Figure 2.10. Widening income distribution: Real income trends at the bottom, middle and top of the
income distribution since the 1980s ...................................................................................................... 81
Figure 2.11. Differences in income mobility between the late 1990s and the early 2010s........................... 83
Figure 2.12. Trends in income persistence in the bottom and top quintile of the income distribution ......... 85
Figure 2.13. Trends in persistence at the bottom and at the top of the income distribution ......................... 86
Figure 2.14. Income quintiles over life by birth cohort and education level ................................................ 88
Figure 2.15. Population share by type of income class in selected emerging economies ............................. 90
Figure 2.16. Sticky floors at the bottom and sticky ceilings at the top in selected emerging economies ..... 91
Figure 2.17. Illustration of the decomposition of income changes ............................................................... 95
Figure 2.18. Real income growth effect and economic growth .................................................................... 96
Figure 2.19. Life-cycle effect: Impact of age on log incomes ...................................................................... 97
Figure 2.20. Variance of unpredictable income shocks by initial income quintile ..................................... 100
Figure 2.A3.1. Trends in income persistence at the bottom and at the top in emerging economies ........... 118
Figure 2.A4.1. Distribution of the population by income quintiles at age 40 ............................................. 119
Figure 2.A4.1. Distribution of the population by income quintiles at age 40 (cont.) ................................. 120
Figure 2.A4.1. Distribution of the population by income quintiles at age 40 (cont.) ................................. 121
Figure 3.1. Impact of labour market transitions and household changes on large income gains
and losses ............................................................................................................................................ 127
Figure 3.2. Impact of labour market and household changes on upward income mobility at different
points of the income distribution ........................................................................................................ 128
Figure 3.3. Impact of labour market transitions and household changes on downward income
mobility at different points of the income distribution ....................................................................... 129
Figure 3.4. Share of employed people experiencing a large income loss when becoming
non-employed ..................................................................................................................................... 131
Figure 3.5. Share of people changing income quintile when becoming non-employed ............................. 132
Figure 3.6. Decomposition of income changes when moving from employment to non-employment ...... 134
Figure 3.7. Decomposition of income changes when moving from non-employment to employment ...... 135
Figure 3.8. Decomposition of income changes when changing job ........................................................... 136
Figure 3.9. Share of non-employed people experiencing a large income gain when becoming
employed ............................................................................................................................................. 137
Figure 3.10. Share of people exiting the first income quintile when becoming employed ......................... 139
Figure 3.11. Share of employed people experiencing a large income gain when changing job ................. 141
Figure 3.12. Odds of a large income gain for transitions from temporary to permanent and
from part-time to full-time employment ............................................................................................. 142
Figure 3.13. Share of people experiencing a large income loss when getting divorced ............................. 145
Figure 3.14. Decomposition of income changes when getting divorced, by gender .................................. 147
Figure 3.15. Decomposition of income changes in the event of childbirth, by gender............................... 148
Figure 3.16. Impact of divorce on women’s incomes one, two and three years after divorce .................... 149
Figure 3.17. Income trajectories following divorce in selected countries .................................................. 150
Figure 3.18. Share of people experiencing a large income loss after childbirth ......................................... 151
Figure 3.19. Incidence of large market and disposable income changes .................................................... 153
Figure 3.20. How redistribution impacts on large income losses at different points of the income
distribution .......................................................................................................................................... 154
Figure 4.1. Absolute social class mobility, 2010s....................................................................................... 183
Figure 4.2. Understanding cross-country variation in absolute class mobility ........................................... 184
Figure 4.3. Absolute class mobility by gender, 2010s ................................................................................ 185
Figure 4.4. Trends of absolute class mobility ............................................................................................. 186
Figure 4.5. Sticky floors and sticky ceilings in occupation ........................................................................ 188
A BROKEN SOCIAL ELEVATOR? HOW TO PROMOTE SOCIAL MOBILITY © OECD 2018TABLE OF CONTENTS – 11
Figure 4.6. Relative persistence in social class ........................................................................................... 190
Figure 4.7. Changes in relative social class persistence over time ............................................................. 191
Figure 4.8. Earnings elasticities for father to son, late 2000s ..................................................................... 195
Figure 4.9. Intergenerational earnings mobility and income inequality ..................................................... 196
Figure 4.10. Individual earnings elasticities by employment status ........................................................... 198
Figure 4.11. Drivers of intergenerational earnings elasticities between fathers and sons, early 2010’s..... 200
Figure 4.12. Cohort analysis of intergenerational earnings persistence...................................................... 201
Figure 4.13. Earnings elasticities for different quantiles of the distribution, early 2010s .......................... 203
Figure 4.14. Percentage of sons in the top and bottom earnings quartile by father’s quartile .................... 205
Figure 4.15. Inheritances and gifts, by net wealth quintile ......................................................................... 207
Figure 4.16. Employment rate for daughters by father’s earnings percentile ............................................. 209
Figure 4.17. Earnings elasticity between fathers and daughters compared with sons ................................ 210
Figure 4.18. Comparing daughters and sons’ income elasticities based on household income, 2011 ........ 211
Figure 4.19. Comparing earnings and income elasticities, late 2000’s ....................................................... 212
Figure 4.A.1.1. Absolute social class mobility by gender, 2010s ............................................................... 223
Figure 4.A.1.2 Changes in absolute class mobility by gender .................................................................... 225
Figure 4.A.1.3 Relative persistence in social class by gender .................................................................... 226
Figure 4.A1.4. Estimates for earnings elasticities for fathers to sons for different specifications
and sources, late 2000s ....................................................................................................................... 227
Figure 5.1. The impact of early childhood health on poor adult self-assessed health status ...................... 238
Figure 5.2. Relation between parental and children’s self-assessed health ................................................ 239
Figure 5.3. Probability of poor health, controlling for individual fixed effects .......................................... 243
Figure 5.4. Impact of parental health on other health status measures ....................................................... 243
Figure 5.5. Association between parental and children’s Body-Mass Index .............................................. 244
Figure 5.6. Intergenerational health behaviour correlations ....................................................................... 246
Figure 5.7. Absolute educational mobility, latest available year ................................................................ 248
Figure 5.8. Upward educational mobility for the 55-64 and the 25-34 years-old ....................................... 248
Figure 5.9. Likelihood of educational attainment by parental education background, OECD average ...... 250
Figure 5.10. Sticky floor at the bottom and sticky ceiling at the top .......................................................... 251
Figure 5.11. Likelihood of educational attainment if neither parent has attained upper secondary
education by year of birth, OECD average ......................................................................................... 252
Figure 5.12. Percent of individuals attaining tertiary education, by PIAAC scores and parental
education ............................................................................................................................................. 254
Figure 5.13. Intergenerational educational persistence ............................................................................... 257
Figure 5.14. Intergenerational educational persistence by age group ......................................................... 258
Figure 5.15. Intergenerational educational persistence by gender .............................................................. 259
Figure 5.16. Variance decomposition of test scores ................................................................................... 262
Figure 5.17. Score in mathematics by socio-economic status of parents, 2015.......................................... 264
Figure 5.18. Which school policies explain the gap in student achievement by background? ................... 266
Figure 5.19. Percentage of top-performing students with a low socio-economic background ................... 267
Figure 5.A1.1. Likelihood of educational attainment if neither parent has attained upper secondary
by year of birth .................................................................................................................................... 284
Figure 6.1. Educational mobility is higher in countries where public spending on education was higher . 299
Figure 6.2. Educational mobility is lower in countries where returns to tertiary education are higher ...... 308
Figure 6.3. Regional disparities in household disposable income have increased in half of the OECD
countries .............................................................................................................................................. 325
Figure 6.4. Public spending by regional and local government is substantial ............................................ 326
Figure 6.5. Relative size of the social rental housing stock ........................................................................ 331
A BROKEN SOCIAL ELEVATOR? HOW TO PROMOTE SOCIAL MOBILITY © OECD 201812 – TABLE OF CONTENTS
Boxes
Box 2.1. Is positional mobility a zero-sum game? ........................................................................................ 70
Box 2.2. Pseudo panel techniques: Estimates of positional mobility based on cross-sectional data ............ 87
Box 2.3. Decomposition of income changes................................................................................................. 95
Box 3.1. The monetary impact of health shocks ......................................................................................... 130
Box 3.2. Decomposing income changes following labour market transitions ............................................ 134
Box 3.3. Young people: How much do early careers matter? .................................................................... 140
Box 3.4. Women, labour and income mobility ........................................................................................... 143
Box 3.5. Decomposing income changes following household-related life events...................................... 146
Box 4.1. Different approaches to classifying social class ........................................................................... 181
Box 4.2. How to analyse mobility using social class categories................................................................. 182
Box 4.3. Models for relative social class mobility rates ............................................................................. 189
Box 4.4. Measurement issues to calculate earnings elasticities .................................................................. 193
Box 4.5. The Great Gatsby Curve ............................................................................................................... 196
Box 4.5. Decomposing intergenerational earnings elasticity ...................................................................... 199
Box 4.6. Correction for sample selection when calculating daughters’ individual elasticities ................... 208
Box 4.7. How moving from earnings to income affects the intergenerational association......................... 212
Box 5.1. Birthweight determinants ............................................................................................................. 234
Box 5.2. Empirical specification of intergenerational transmission of health inequalities ......................... 242
Box 5.3. Better-off parents are able to protect their children even if they have poor skills........................ 253
Box 5.4. Assessing the inheritance of education ........................................................................................ 256
Box 5.5. Does additional parental schooling have a causal impact on children's schooling? ..................... 260
Box 5.6. Decomposing variation in PISA test scores ................................................................................. 265
Box 6.1. Social spending and intergenerational mobility ........................................................................... 297
Box 6.2. Developing innovative recruitment methods to foster social mobility ........................................ 315
Box 6.3. Income volatility and new forms of employment: the case of freelance journalists in Finland ... 323
A BROKEN SOCIAL ELEVATOR? HOW TO PROMOTE SOCIAL MOBILITY © OECD 2018EXECUTIVE SUMMARY – 13
Executive summary
Social Mobility: Why policy makers should care?
In a number of countries, there is a growing perception that social mobility across
generations has declined and that, increasingly, parents’ fortunes and advantages play a
major factor in people’s lives. There is also growing pessimism about the chances of
improving one’s own financial situation over the life course and this trend appeared well
before the global financial crisis. These perceptions do somewhat square with actual
measures of social mobility in various dimensions, such as income, occupation, health or
education. For instance, countries where people are more pessimistic about mobility
prospects are often those where parental situations in terms of education or income are
more strongly correlated with the situation of sons and daughters. Of course, perceptions
and expectations about mobility are influenced by a range of country- and individual-
specific factors, but these perceptions matter in themselves, as they have economic, social
but also political consequences.
In the context of increased inequalities of income and opportunities, lack of upward
mobility at the bottom of the income distribution means that many potential talents are
missed out or remain under-developed. It also means that many investment opportunities go
unexploited and potential businesses never see the light. This undermines productivity and
economic growth as highlighted in the OECD Productivity-Inclusiveness Nexus. At the
opposite end, a lack of mobility at the top may translate into persistent rents for a few at the
expense of the many, due to unequal access to educational, economic or financial
opportunities. Success for those at the top and for their children should not be achieved at
the expense of others: opportunity hoarding is bad for society and incurs high efficiency
costs. More broadly, there is evidence suggesting that prospects of upward mobility also
have a positive influence on life satisfaction and well-being. Inversely, high risks of
downward mobility and loss of social status tend to reduce life satisfaction and undermine
individual self-esteem, social cohesion and people’s feeling that their voice counts,
particularly among middle- and lower-income people. This reduces trust in the socio-
political system with potential negative consequences on democratic participation. This also
strengthens political extremisms or populism.
How does social mobility work?
Social mobility is a multi-faceted concept. For one thing, it can be understood as
mobility between parents and children or grand-children – the so-called inter-generational
mobility. Alternatively, the concept can encompass only personal life course perspectives –
this is intra-generational mobility. This report covers both aspects, although for most
people the big picture across generations counts probably more when thinking about
mobility than what happens over shorter time periods: when assessing their chances of
mobility people tend to compare how they live at present times with how they grew up and
how their parents lived.
A BROKEN SOCIAL ELEVATOR? HOW TO PROMOTE SOCIAL MOBILITY © OECD 201814 – EXECUTIVE SUMMARY
Besides, the large majority of people understand mobility as upward mobility much
more than downward mobility. But in practice high mobility rates can reflect as much
upward opportunities as downward risks. As a matter of fact, there has been substantial
upward mobility in most OECD and emerging economies – in absolute terms. That is, in
many countries we live better than our parents did: we benefit from higher income levels,
we often did better studies than them, we often live in better houses and own better
appliances, we enjoy better quality services, etc. As economic and social outcomes
progress, most people benefit to varying degrees from such improved living conditions, and
absolute mobility goes upward. This can potentially keep on for a long time when
considering only income, thanks to continuous productivity gains, even though productivity
growth has slowed considerably in the OECD area over the past decade. But for other
important dimensions of mobility there is less scope for further major improvements in
advanced economies, while the emerging economies certainly have more margins for
improvements. As countries reach high levels of development, progress necessarily slows
down in some key dimension, such as education or health: not everybody can or wants to
hold a PhD and health cannot improve indefinitely.
Therefore, the issue of relative mobility gains more and more importance in the public
debate, especially in the more advanced economies: to what extent am I susceptible to reach
a better – or worse – position in the distribution of income as well as education, occupation
or health than that of my peers? This report therefore considers both absolute and relative
mobility outcomes, with a special emphasis on the latter. Metaphorically speaking, mobility
acts as a set of escalators: everybody goes up, but some groups move faster than others and
therefore their relative positions vary upward or downward over time. And we find that the
speed of the escalators, and therefore the chances of upward or downward mobility, is
not evenly distributed in the population.
Key findings
“Sticky floors” prevent people from moving up
Children with a disadvantaged background struggle a lot to move up the ladder, and this
is true for many different important aspects of life.
• Having grown up in families with little or no wealth and having parents with poor
health are the two main predictors of own poor health.
• Four-in-ten people with low-educated parents have lower secondary education
themselves, and only one-in-ten continues on to tertiary education – compared to
two-thirds of children with high-educated parents.
• In terms of occupation, about a third of children from manual workers remain
manual workers themselves. Furthermore, absolute class mobility tended to decline
in half of the countries under study and not change much in the other half, partly
because younger generations now face less favourable occupational upward
mobility prospects than their parents.
• While two-thirds of people with low-earnings parents succeed to move to a higher
status, for almost half among them, upward earnings mobility is limited to the
neighbouring earnings group. As a result, in an “average OECD country” it would
take around four to five generations for children from the bottom earnings decile to
attain the level of mean earnings.
A BROKEN SOCIAL ELEVATOR? HOW TO PROMOTE SOCIAL MOBILITY © OECD 2018EXECUTIVE SUMMARY – 15
• Upward mobility for people with lower educated parents tended to increase for
individuals born between 1955 and 1975, but then stagnated for those born after
1975 – sticky floors persist.
Opportunity hoarding leads to “sticky ceilings”
Those at the top of the distribution are effective in ensuring that advantages are passed
on to their children.
• Individuals with higher educated parents tend to have better educational outcomes
in terms of literacy and numeracy than those whose parents have low educational
achievement. For instance, numeracy scores are almost 20% higher for those with
parents with higher socio-economic status, representing more than three years of
equivalent additional schooling.
• Children end up in similar occupations to their affluent parents. Half of children
whose parents are in the managerial class become managers themselves, but only
less than a quarter of children of manual workers have a chance to become
managers.
• There is also persistence in the top of the earnings distribution with four-in-ten sons
of rich fathers remaining in the top quartile in all OECD countries. Downward
mobility from the top earnings quartile is particularly low in some countries, such
as the United States and Germany.
Sticky floors and ceilings also apply to income mobility over the individuals’ life
course
This report also finds large inequalities across groups in the chances to move along the
income ladder over shorter periods of time: sticky floors and sticky ceilings also apply to
income perspectives over the individuals’ life course.
• Over a four-year period, about 60% of people remain stuck at the bottom 20% of
the income distribution. When there is upward income mobility at the bottom, this
is largely due to unpredictable income changes, not sustained careers.
• At the top, the persistence of advantages is even stronger – 70% remain there for
four years. And those whose parents are at the top are much more likely to remain
there for their whole life – in the US and in Germany, almost half of the sons of rich
fathers are in the top earnings quartile themselves.
• Since the 1990s, there is a general trend towards more persistence of income
positions at the bottom and at the top of the distribution. This translates into both
lower chances to move upward for those at the bottom, and into even lower risks to
fall down from the top. Although income inequality increased since that time, it has
not been compensated by greater income mobility.
There are risks and opportunities in the middle
Income mobility is higher for those living in the middle class. This not only translates
into more opportunities for them compared with other groups, but also into greater risks to
fall down the ladder following unexpected life events such that unemployment or divorce.
• There is thus substantial risk for middle-income households to fall into low income
and poverty over their life course: one-in-seven of all middle class households, and
A BROKEN SOCIAL ELEVATOR? HOW TO PROMOTE SOCIAL MOBILITY © OECD 201816 – EXECUTIVE SUMMARY
one-in-five of those living closer to lower incomes slide into the bottom 20% over a
four-year period.
• There are also signs that these risks have increased over the past two decades. In
particular, a further divide among the middle classes appeared in several countries:
for those closer to lower incomes and part of the “bottom 40%”, the risk to further
slide down over the life course has increased.
• At the same time, those closer to the middle and the more affluent members of the
middle class today have somewhat lower risks to fall into low income and poverty.
There are thus signs that the middle class may be fracturing.
Income inequality does not foster mobility
• There is no evidence that greater inequality would bring higher income mobility to
people. Rather, higher mobility over the life course is associated with lower
inequality within countries when measured over several years – so called
“permanent” inequality.
• Across generations, earnings mobility prospects tend to be usually weaker in
countries where income inequality is high, and stronger in countries where
inequality is low. Only a few European countries buck this trend, combining both
low inequality and low earnings mobility, e.g,. Austria, France, Germany and
Hungary.
Mobility patterns vary a lot across countries and country groups
The mobility record varies across countries depending on the dimension of mobility
considered, but also whether the focus is on mobility at the bottom or at the top. Some
general patterns arise from broad country groupings when considering mobility across
generations.
• Social mobility, notably in terms of earnings, occupation and education, is very
high in most Nordic countries, and rather low in many Continental European
countries, especially in terms of earnings, as well as in emerging economies. For
instance, it would take only about two generations for children from the bottom
earnings decile to attain the level of mean earnings in the Nordic countries, but
between four to six generations in Continental European countries, and many more
in emerging economies.
• Most Southern European countries also show relatively low mobility indicators in
terms of education or occupation, but fare somewhat better in terms of earnings
mobility.
• Some English-speaking countries fare relatively well in terms of earnings mobility
(Canada, New Zealand) or occupation (USA, United Kingdom), but performances
vary a lot along the other dimensions.
• In Japan and Korea, educational mobility is high but earnings mobility is around
average. Both sticky floors and sticky ceilings in terms of earnings persistence over
generations are more pronounced in Germany and in the United States than in other
countries.
A BROKEN SOCIAL ELEVATOR? HOW TO PROMOTE SOCIAL MOBILITY © OECD 2018You can also read