Delivering Last-Mile Solutions - A feasibility analysis of microhubs and cyclelogistics in the GTHA - Pembina Institute
←
→
Page content transcription
If your browser does not render page correctly, please read the page content below
Delivering Last-Mile
                                        Solutions
                                        A feasibility analysis of microhubs
                                        and cyclelogistics in the GTHA

                                        Janelle Lee
                                        Carolyn Kim and Lindsay Wiginton
                                        June 2019
photo: Carolyn Kim, Pembina Institute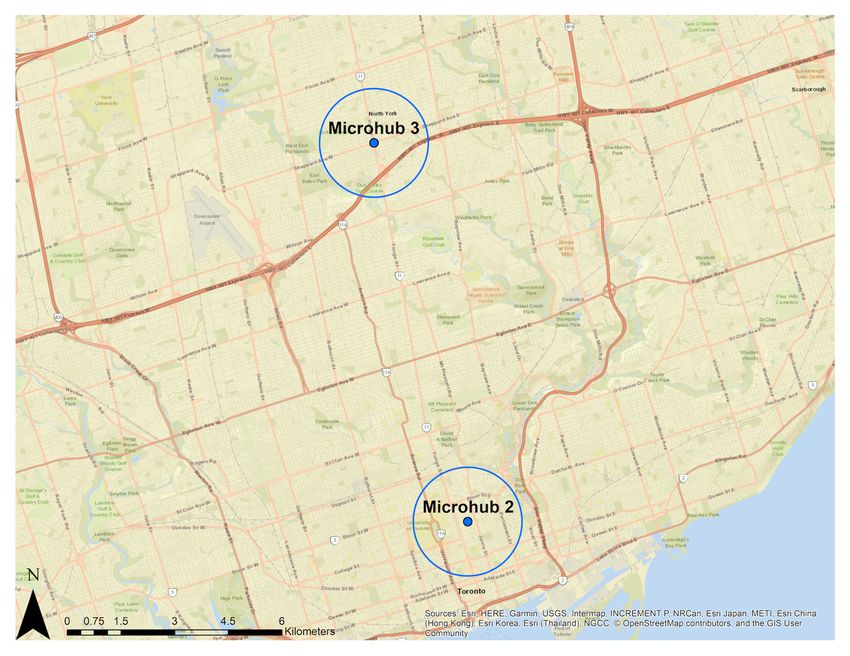
About the Pembina Institute
The Pembina Institute is a national non-partisan think tank that advocates for strong,
effective policies to support Canada’s clean energy transition. We employ multi-faceted
and highly collaborative approaches to change. Producing credible, evidence-based
research and analysis, we consult directly with organizations to design and implement
clean energy solutions, and convene diverse sets of stakeholders to identify and move
toward common solutions.

The Pembina Institute
219 19 Street NW
Calgary, AB
Canada T2N 2H9
Phone: 403-269-3344

Acknowledgements
We would like to thank the Technical and Policy Project Advisory Group, consisting of
Transport Canada, Ontario Ministry of Transportation and UPS Canada, who generously
provided their knowledge and perspectives on this subject matter, to inform this
research.

The research was generously supported by the Metcalf Foundation, The Atmospheric
Fund, Ontario Trillium Foundation and Transport Canada.

Special thanks to UPS Canada who provided some of the data used in the modelling
work for this research. Also thanks to Nitish Bhatt who supported the background
research in this report.

This report benefitted from the contributions of Dr. Darren Scott, Professor at the
School of Geography and Earth Sciences at McMaster University, who supported the
modelling work for this research.

Pembina Institute                                              Delivering Last-Mile Solutions | ii
The views expressed in this publication are the views of the Pembina Institute and do
not necessarily reflect those of the Government of Canada, Government of Ontario, or
other organizations that were engaged in the research and development of this report.

Pembina Institute                                             Delivering Last-Mile Solutions | iii
Contents
Executive summary ..............................................................................................................................1
1.     Introduction ...................................................................................................................................4
2.     Context: Understanding the last mile ........................................................................................9
     2.1      What is the last mile? ............................................................................................................9
     2.2      Disruptions in last-mile deliveries .......................................................................................9
     2.3      Last-mile challenges in urban centres ............................................................................. 11
3.     Addressing last-mile delivery challenges with microhubs.................................................... 13
     3.1      Defining microhubs............................................................................................................ 13
     3.2      Policy context for the implementation of microhubs.................................................... 19
     3.3      Conditions for success ....................................................................................................... 21
4.     Low-carbon last-mile delivery vehicles.................................................................................... 23
     4.1      Regulatory context for cargo cycles ................................................................................. 24
     4.2      Safety implications of cargo cycles................................................................................... 27
5.     Modelling microhubs and low-emission vehicles scenarios ................................................ 29
     5.1      Purpose and scope ............................................................................................................. 29
     5.2      Results.................................................................................................................................. 31
6.     Future research ......................................................................................................................... 41
7.     Conclusions and recommendations........................................................................................ 42
Appendix A.             Freight-planning documents in Ontario................................................................ 45
Appendix B.             E-bike and cargo cycle regulations ........................................................................ 48
Appendix C.             Modelling methods .................................................................................................. 51
Appendix D.              Modelling outputs.................................................................................................... 62
Appendix E.             Vehicle routing outputs ........................................................................................... 69

List of Figures
Figure 1. Types of urban logistics spaces ....................................................................................... 14
Figure 2. KoMoDo's operations in Berlin use independently operated microhub spaces ...... 16
Figure 3. Gnewt Cargo's operations in Central London use a mixed multi-carrier
     consolidation approach ........................................................................................................... 16
Figure 4. La Petite Reine's operations in Paris use a full multi-carrier consolidation approach
     ..................................................................................................................................................... 17
Figure 5. Different types of e-assist cycles ..................................................................................... 25

Pembina Institute                                                                                             Delivering Last-Mile Solutions | iv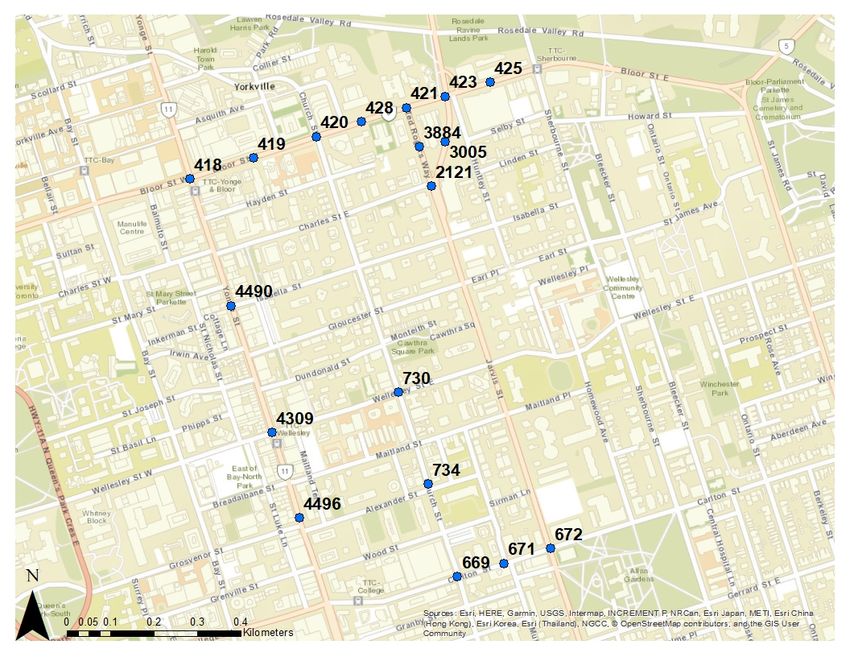
Figure 6. Map of Microhub 1 in the City of Hamilton .................................................................... 32
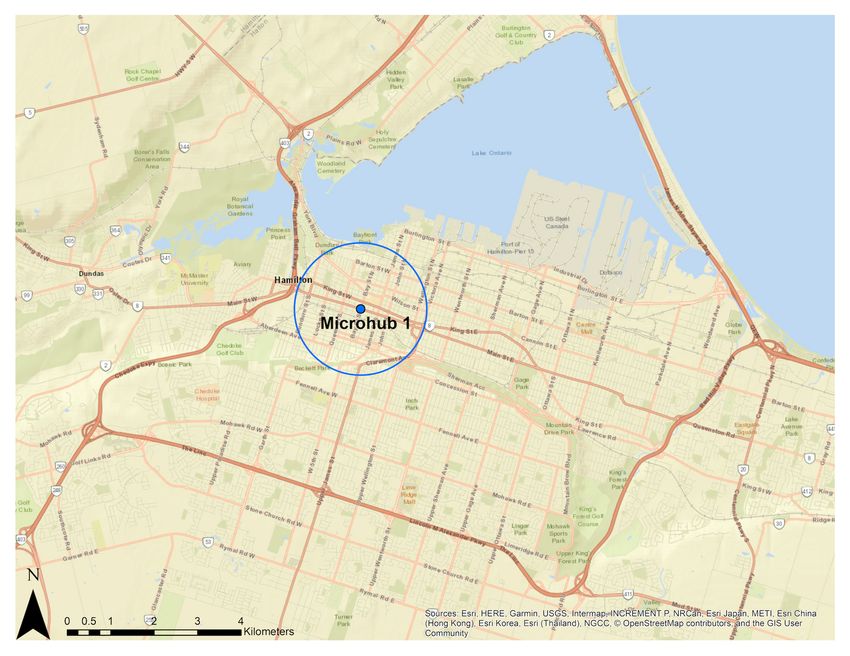
Figure 7. Map of Microhubs 2 and 3 in the City of Toronto ......................................................... 32
Figure 8. Total operational time under normal congestion, high demand conditions ............ 36
Figure 9. Total operational time under high congestion, high demand conditions ................. 36
Figure 10. Total operational time under normal congestion, low demand condition ............. 36
Figure 11. Total operational time under high congestion, low demand conditions................. 36
Figure 12. Average scenario costs under high demand conditions ............................................ 39
Figure 13. Average scenario costs under low demand conditions ............................................. 40
Figure 14. Map of the top 20 candidate locations in Hamilton. .................................................. 64
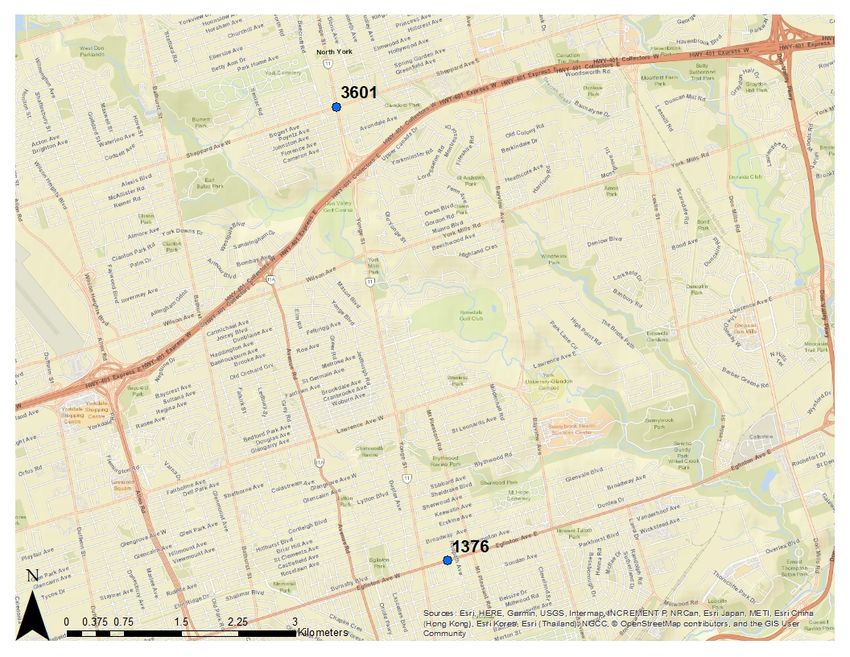
Figure 15. Map of 18 of the top 20 candidate locations in Toronto............................................ 67
Figure 16. Map of the remaining 2 of the top 20 candidate locations in Toronto. ................... 68
List of Tables
Table 1. Examples of microhub models.......................................................................................... 18
Table 2. Selected candidate locations for delivery scenarios ...................................................... 31
Table 3. Vehicle kilometres travelled (VKT) under different levels of delivery demand ........... 33
Table 4. Number of routes and optimal fleet size for different delivery scenarios under
normal congestion levels ......................................................................................................... 38
Table 5. Freight-planning documents in Ontario........................................................................... 45
Table 6. Delivery vehicle assumptions ............................................................................................ 55
Table 7. Delivery volume assumptions ........................................................................................... 56
Table 8. Calculations for costs and emissions ............................................................................... 59
Table 9. Inputs into cost and emission calculations for each delivery mode ............................ 60
Table 10. Top 20 candidate locations for microhubs in Hamilton .............................................. 62
Table 11. Top 20 candidate locations for microhubs in Toronto ................................................ 65
Table 12. Scenario names and corresponding abbreviations. .................................................... 69
Table 13. Scenario outputs for selected microhub in Hamilton (location ID 360) .................... 70
Table 14. Scenario outputs for selected microhub in Toronto (location ID 730) ...................... 72
Table 15. Scenario outputs for selected microhub in Toronto (location ID 3601) .................... 74
Pembina Institute Delivering Last-Mile Solutions | v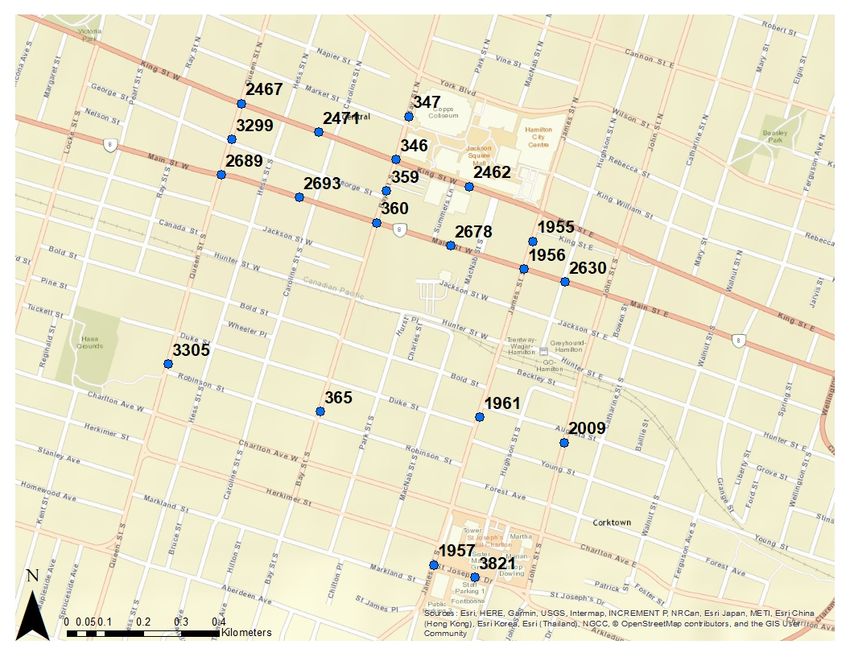
Executive summary
Transportation is responsible for approximately one-third of greenhouse gas emissions
in Ontario. Freight transportation in particular is a major contributor to emissions — by
2030, it is expected that freight emissions in Canada will exceed passenger emissions.
As e-commerce activity and the demand for same-day and home deliveries increases, it
is expected that more freight vehicles will be on the road, not only contributing to
increased emissions, but also traffic congestion, noise on our streets, and greater
competition for the curbside.

In order to keep up with increasing demand for goods movement while mitigating the
negative impacts of freight activity in dense urban areas, some businesses are
rethinking their delivery operations. This report focuses on two emerging operating
models that are being integrated into the goods movement network in North American
and European cities to improve the efficiency of deliveries in congested urban areas:
delivery microhubs and cyclelogistics. Delivery microhubs (or simply microhubs) are
logistics facilities for micro-consolidation, which is the bundling of goods at a location
near the final delivery point (e.g. within 1 to 5 km from the final destination).
Cyclelogistics is the integration of bicycles, tricycles, or other multi-wheeled cycles for
goods movement purposes (also referred to as cargo cycles).

The purpose of this report is to assess whether alternative operating models such as
microhubs and cyclelogistics are feasible, and secondly help clarify the conditions under
which microhubs and cyclelogistics are successful. Based on delivery practices in other
jurisdictions and findings from the Pembina Institute’s research and modelling work,
microhubs and cyclelogistics have the potential to reduce operational costs for
businesses and mitigate freight emissions in the Greater Toronto and Hamilton Area
(GTHA).

Under the specific delivery conditions studied in this research, our modelling results
suggest that microhubs and the use of electric-assist (e-assist) cargo cycles can be good
alternatives to conventional package cars in the following ways:
    •    Cost effective: In certain cases, delivery operations are more cost effective
         when using e-assist cargo cycles than when using conventional package cars.

Pembina Institute                                                Delivering Last-Mile Solutions | 1
Executive summary
• Operational efficiency: Although cargo cycles tend to require longer travel
times to complete all deliveries, their service time (e.g. time to unload the
vehicle and get the package to the customer) is much lower compared to package
car operations. This is because cargo cycles are smaller and more nimble, making
it quicker for the operator to park and unload deliveries compared to package
cars.
• High productivity: Cargo cycle operations require more delivery trips compared
to package cars due to their smaller payload volume, however, cargo cycle
operations do not necessarily require a larger fleet than package car operations.
• High asset utilization: Using cargo cycles for deliveries results in higher asset
utilization compared to package cars. This is because package cars often carry
loads that are below their full capacity.
• Addresses curbside demands: Not only are cargo cycles beneficial for
improving operational efficiency for businesses, but they also decrease the
number of trucks on the road and impeding loading activities in dense urban
areas or districts, thereby freeing up curbside space for other road users.
• Lower freight emissions: Package cars can produce up to 53 kg CO2 per day
depending on the level of delivery demand. Replacing conventional package cars
with cargo cycles or electric vans will eliminate tailpipe emissions, resulting in
benefits for both climate and urban air quality.
Although our modelling work indicates that microhubs and e-assist cargo cycles are
potentially feasible in the GTHA, examples in other North American and European
jurisdictions demonstrate that multi-sectoral collaboration and enabling policies and
regulations are necessary to help create an environment where these low-carbon
alternative delivery solutions can be piloted and implemented at scale. In order for
businesses to test and integrate new logistics models and delivery modes into their
operations, they need be certain of the policy and regulatory conditions under which
these approaches are financially and operationally viable.
Finding solutions to make urban deliveries more efficient and less carbon intensive
requires leadership across public, private and non-governmental sectors. Governments
play an important role to help spur innovation and co-design solutions with businesses
to address last-mile freight challenges. In doing so, governments can realize public
policy objectives, such as alleviating congestion, managing curbside competition, and
decreasing transportation emissions. Here are several ways that governments can create
an environment in which businesses can introduce more efficient and sustainable
freight practices:
Pembina Institute Delivering Last-Mile Solutions | 2Executive summary
• Provide incentives or financial supports for businesses to test and implement
low-carbon alternative delivery solutions in dense urban areas, including seed
funding:
o to offset the high real estate cost of establishing microhubs in dense
urban areas or districts
o integrate cargo cycles into their delivery operations.
• Align and clarify legislation, regulations, and policies at all levels of government
in order to reduce barriers and restrictions on the use of e-assist cargo cycles.
• Invest in expanding and improving cycling infrastructure, urban design, and
educational campaigns to better accommodate the safe use and integration of
cargo cycles with other road users.
• Explore policies aimed at increasing the supply of zero-emission commercial
delivery vehicles in the Canadian market (e.g., zero emission vehicle mandates).
• Explore policies and incentives to encourage uptake of zero- or low-emission
delivery vehicles (e.g., purchase incentives, government procurement policies).
• Develop or modernize land use and transportation plans and strategies (e.g.,
freight and goods movement strategies, low-emission zones, mobility pricing in
dense urban areas) as well as economic development strategies to promote the
use of efficient and sustainable urban freight practices.
Businesses can accelerate the adoption of efficient and sustainable urban freight
practices by doing the following:
• Establish ambitious goals and commitments to reduce freight emissions by
transitioning towards low- or zero-emission freight vehicles.
• Transition towards the use of low- or zero-emission freight vehicles (e.g., cargo
cycles, electric vehicles) for last-mile deliveries, taking into account different
urban settings.
• Where possible, explore the potential for investing in and sharing microhub
spaces with other businesses to consolidate shipments to final destinations.
• For businesses in multi-unit buildings, explore opportunities for pooled ordering
to consolidate shipments of specific goods (e.g. one delivery for office supplies
for an entire building).
Pembina Institute Delivering Last-Mile Solutions | 31. Introduction Rapid urbanization and the growth of e-commerce have put tremendous pressure on businesses to meet increasing demands for goods movement in cities. Canadians will continue to shop online in greater numbers, with sales in Canada to reach $55.78 billion by 2020.1 To compare, brick-and-mortar sales grew by 2% in 2016, while online retail sales grew by 15%. As growth in e-commerce and increased demand for faster deliveries — particularly home deliveries — disrupt freight activity, some researchers note that it is uncertain whether these trends will result in greater vehicle movement in cities.2,3 The delivery of goods directly to customers’ homes, for example, may reduce the number of shopping trips that people make by car. Nevertheless, there is a strong likelihood that increasing demand for goods movement (both business to business and business to customer) will result in more freight vehicles on the road and consequently increased traffic congestion, noise pollution, air pollution, and greenhouse gas (GHG) emissions. However, such externalities can be mitigated with the willingness and ability of business to modernize their freight practices to become more efficient and sustainable, and with government efforts to develop goods movement strategies and plans that create the conditions whereby innovative delivery solutions can be piloted and scaled. According to Environment and Climate Change Canada, overall freight emissions in Canada (which include trucks, rail, air and marine) are projected to eclipse passenger emissions by 2030.4 In Ontario, the volume (tonne-kilometres) of road freight activity grew by 154% between 1990 and 2016.5 It is not surprising then that in 2016, 35% of 1 Canada Post, Growing E-Commerce in Canada: unlocking the online shopper opportunity (2016), 10. https://www.canadapost.ca/web/assets/pdf/blogs/canada-post-growing-e-commerce-in-canada- 2016_en.pdf 2 Johan Visser, Toshinori Nemoto and Michael Browne, “Home Delivery and the Impacts on Urban Freight Transport: A Review,” Procedia – Social and Behavioral Sciences 125 (2014), 26. 3 Kenneth Boyer, Andrea M. Prud’homme and Wenming Chung, “The Last Mile Challenge: Evaluating the Effects of Customer Density and Delivery Window Patterns,” Journal of Business Logistics 30, no. 1 (2009), 196. 4 Environment and Climate Change Canada, Canada’s Second Biennial Report on Climate Change (2016), Annex 1. https://www.ec.gc.ca/ges-ghg/default.asp?lang=En&n=02D095CB-1#BR-SecAnnex1 5 Natural Resources Canada, Comprehensive Energy Use Database, “Table 11: Freight Road Transportation Secondary Energy Use and GHG Emissions by Energy Source.” Pembina Institute Delivering Last-Mile Solutions | 4
Introduction
total GHG emissions in Ontario were attributed to transportation, making it the
highest-emitting economic sector in the province.6 On-road heavy-duty trucks alone are
responsible for just over 10% of provincial emissions.7 These trends have major
implications on the quality of life of Ontarians since trucks are a leading source of
criteria air contaminants, polluting the air that we breathe.8
The freight sector, however, is a core part of Ontario’s economy, given that 38% of the
province’s economy comes from freight-intensive industries, and trade between Ontario
and the United States was worth $284 billion in 2011.9 That is why there is a need for
policy actions and practical solutions that decouple the contributions of the goods
movement sector to Ontario’s economy from freight emissions. One way to do this is to
decrease urban freight emissions even in the face of increased freight and goods
movement activity.
Urban freight refers to the various activities involved in the delivery of goods —
including collection, storage, consolidation, and transport — in cities or other urban
contexts.10 Delivering goods in cities, including the “last mile” of such deliveries, is
increasingly difficult due to traffic congestion, curbside competition, and rising land
costs to accommodate logistics facilities close to urban centres. Delivery vehicle
operators often spend hours stuck in traffic and must compete with other road users,
such as cyclists, motorists, and ride-hailing vehicles, for the same road and curbside
space. Some municipalities have recognized the extent of these issues and are making
efforts to address them through better land use and transportation plans and policies.
The City of Toronto, for example, is implementing a Curbside Management Strategy that
includes actions to manage curbside space in a way that improves mobility and access
http://oee.nrcan.gc.ca/corporate/statistics/neud/dpa/showTable.cfm?type=CP§or=tran&juris=on&rn=1
1&page=4. Freight activity measured in tonne-kilometres.
6
Environment and Climate Change Canada, National Inventory Report 1990-2016: Greenhouse Gas Sources
and Sinks in Canada (2018) Part 3, Table A12-7. https://unfccc.int/documents/65715. The transportation
sector category includes domestic aviation, road transportation, railways, marine and off-road
transportation.
7
Ibid. This number does not include on-road movements by commercial light-duty vehicles.
8
Environment Canada (2017). “Air pollutants – Criteria Air Contaminants.”
https://www.ec.gc.ca/air/default.asp?lang=En&n=7C43740B-1.
9
Ontario Ministry of Transportation, Freight-Supportive Guidelines, (2016), Chapter 1.
http://www.mto.gov.on.ca/english/publications/freight-supportive-guidelines.shtml. Information from
Transport Canada.
10
Damian Stantchev and Tony Whiteing, Urban Freight Transport and Logistics: An overview of the European
research and policy (European Communities, 2006), 2.
https://trimis.ec.europa.eu/sites/default/files/brochure/20060831_105348_30339_Urban_freight.pdf
Pembina Institute Delivering Last-Mile Solutions | 5Introduction for people and goods movement activity.11,12 This curbside management strategy is meant to complement the City of Toronto’s forthcoming freight and goods movement strategy. As a part of the wide range of solutions that are needed to address the challenges associated with increased urban freight activity, consideration should be given to the implementation of microhubs and cyclelogistics. Microhubs are facilities for micro- consolidation, which is the bundling of goods at a location near the final delivery point. Given that 48% of Canadian online shoppers live in dense urban areas,13 there is a significant opportunity to increase the efficiency of last mile deliveries by reorganizing distribution networks. Microhubs are an example of a delivery operations model that can improve delivery efficiency and reduce urban freight emissions by allowing businesses to consolidate goods closer to their final destination and therefore reduce the number of vehicle kilometres traveled in an urban area. Research has shown that the use of more efficient urban delivery systems that consolidate and coordinate between freight carriers can result in 12–14% savings in operational costs.14 Microhubs also grant businesses the flexibility to shift modes in the supply chain so that more nimble and cleaner vehicles, such as electric light-duty vehicles and e-assist cargo cycles, can be used to conduct last-mile deliveries.15 Cargo cycles are bicycles, tricycles, or other multi-wheeled cycles that are equipped with a cargo unit to store and move goods or people (e.g. children). Conducting goods movement by cycling is referred to as cyclelogistics. Many businesses in Europe — and now also in a few North American markets, including Canada — have integrated microhubs and cyclelogistics into their goods movement practices to increase efficiency, reduce operational costs, and mitigate adverse impacts on cities. In doing so, some businesses have demonstrated significant reductions in last-mile vehicle kilometres traveled and “empty” truck distances, thereby 11 City of Toronto, Curbside Management Strategy: Improving How Curbside Space Is Used (2017). https://www.toronto.ca/legdocs/mmis/2017/pw/bgrd/backgroundfile-109153.pdf 12 City of Toronto, City Council Issue Notes 2018-2022 (2018), 109. https://www.toronto.ca/wp- content/uploads/2018/12/9598-City-Council-Issue-Notes-2018-2022.pdf 13 Canada Post, Growing E-Commerce in Canada: unlocking the online shopper opportunity (2016), 5. https://www.canadapost.ca/web/assets/pdf/blogs/canada-post-growing-e-commerce-in-canada- 2016_en.pdf 14 Mireia Roca-Riu, Miquel Estrada and Elena Fernandez, “An evaluation of urban consolidation centers through continuous analysis with non-equal market share companies,” Transportation Research Procedia 12 (2012), 371. 15 Carolyn Kim and Nitish Bhatt, Modernizing urban freight deliveries with microhubs (Pembina Institute, 2019), 2. https://www.pembina.org/reports/microhubs-factsheet-v4-online.pdf Pembina Institute Delivering Last-Mile Solutions | 6
Introduction

lowering transportation-related emissions and air pollution.16 While there is no one-
size-fits-all solution to address urban freight challenges — microhubs and cyclelogistics
may not be applicable in all contexts — our research demonstrates that given the right
context and conditions, these alternative delivery models can be viable and practical.
More broadly, our research highlights that there are significant opportunities and
untapped potential for Ontario businesses and cities to adopt more efficient logistics
models and delivery modes.

In order for businesses to integrate new logistics models and delivery modes into their
operations, they need to know the policy and regulatory conditions under which these
approaches are financially and operationally viable. The purpose of this report is to
assess the feasibility of microhubs and cyclelogistics and identify the conditions under
which these mechanisms can be successfully implemented. To inform our research, we
model the feasibility of microhubs and cyclelogistics in the Greater Toronto and
Hamilton Area of Ontario. More specifically, we model various scenarios under which a
microhub delivery system, with deployment of small electric vans or e-assist cargo
cycles for last-mile delivery trips, could viably operate, and compare them to a
business-as-usual delivery system (deployment of package cars) in select locations
within the cities of Toronto and Hamilton.

Our modelling work includes sensitivity analyses to test the feasibility of microhubs and
cyclelogistics under various levels of delivery demand and levels of congestion. Based
on this modelling exercise, we are able to determine the optimal fleet size, total vehicle
kilometres traveled, and total time it takes to conduct a given number of deliveries
under different conditions, and to estimate the operational cost and GHG emissions
associated with each delivery scenario. While this feasibility study is scoped to
illustrative cases in the GTHA, it provides a good first step for policy and planning
practitioners in the public and private sectors to understand the conditions under which
microhubs and cyclelogistics can be most effective across different Canadian urban
contexts.

Finally, this report also draws on experiences from international jurisdictions to identify
the range of policies and regulations that have helped incentivize sustainable and
efficient urban goods movement solutions such as microhubs and cyclelogistics. The

16
  Sam Clarke and Jacques Leonardi, Final Report: Multicarrier consolidation - Central London trial (Greater
London Authority, 2017), 49. https://www.london.gov.uk/sites/default/files/gla-agile1-finalreport-
02.05.17.pdf

Pembina Institute                                                            Delivering Last-Mile Solutions | 7
Introduction

high cost of delivery operations in cities means that private, government, and non-
governmental organizations and actors all play a crucial role to get it right.17

17
  CIVITAS , Smart choices for cities: Making urban freight logistics more sustainable (2015), 10.
https://civitas.eu/sites/default/files/civ_pol-an5_urban_web.pdf

Pembina Institute                                                               Delivering Last-Mile Solutions | 8
2.           Context: Understanding the
             last mile
2.1 What is the last mile?
The “last mile” of urban goods movement refers to the delivery of goods from some type
of consolidation centre (e.g. a warehouse, distribution centre, or microhub) to its final
destination (e.g. a retailer’s store or customer’s home). Unlike other segments of the
supply chain, the last mile is unique because each good being delivered has its own
destination. A multitude of delivery destinations make last-mile deliveries time-
consuming and complex because many stops are required and delivery operators must
devise the most efficient route between delivery locations, considering time and costs.
Due to increasing traffic congestion, a lack of loading zones, curbside conflicts and
other inefficiencies, businesses spend a large share of their time and costs conducting
last-mile deliveries. While the vehicle kilometres traveled of conducting urban
deliveries is a small portion of the total distance traveled in the overall supply chain,
last-mile distribution represents around 28% of total logistics costs.18 Addressing
inefficiencies in last-mile deliveries is therefore critical for businesses to reduce their
costs.

2.2 Disruptions in last-mile deliveries
The shift in consumer preferences toward online shopping, plus increasing expectations
for fast and convenient shipping, is disrupting the nature of freight and goods
movement. Increased internet access and sophisticated e-commerce platforms and
technologies that simplify customer shopping on mobile devices have increased online
sales. In addition to online purchases by customers (business-to-consumer or B2C),
business-to-business (B2B) e-commerce is an emerging trend between corporate sellers
and buyers. According to a study commissioned by Purolator, B2B online selling is a
major part of business in Canada, with over half of Canadian B2B sellers reporting that

18
  Roca-Riu et al., “An evaluation of urban consolidation centers through continuous analysis with non-
equal market share companies,” 371.

Pembina Institute                                                          Delivering Last-Mile Solutions | 9
Context: Understanding the last mile
over 25% of their overall sales occur online.19 These megatrends have collectively put
upward pressure on the volume of goods being shipped by trucks and the number of
delivery locations being served.20 Business surveys indicate that an increasing diversity
of products are being sold online, including products that have typically required an in-
person shopping experience, such as furniture and appliances.21
E-commerce has not only increased the volume of online sales, but also increased the
demand for expedited and same-day shipping. E-commerce and retailers in North
America and globally are in fierce competition to drive down the default standard
shipping times, and are now trending towards one-day standard shipping.22 This is a
marked change from customer expectations from only a couple of years ago; in 2016,
most customers considered fast shipping to be within two days, and in 2015, the
expectation was three or four days.23 Even as customers’ expectations for fast delivery
increases, their willingness to pay for it has fallen — 64% of shoppers are unwilling to
pay additional fees for two-day shipping.24 The growth of online retail has also
generated an increase in the volume of items being returned by customers from their
homes.25 As such, businesses need to optimize their last-mile distribution networks for
both delivery and pick-up operations.
The megatrends and disruptions in e-commerce as well as evolutions in the way
customers are buying groceries and day-to-day retail or other discretionary goods has
had a tremendous impact on how goods are being moved in cities. As will be discussed
later in this report, transportation and goods movement planning strategies are
19
Forrester, “Canada Rises to the B2B E-Commerce Challenge: Canadian B2B Sellers Embrace E-Commerce
and Prepare For the Future”, (2016). https://www.purolator.com/assets/pdf/white-papers/b2b-ecommerce-
challenge.pdf
Deloitte, “The future of freight: How new technology and new thinking can transform how goods are
20
moved.”
21
Chaturvedi Nitin, Mirko Martich, Brian Ruwadi, Nursen Ulker, “The future of retail supply chains,”
McKinsey,
https://www.mckinsey.com/~/media/mckinsey/dotcom/client_service/retail/articles/future_of_retail_supply_
chains.ashx
22
Shannon Liao, “Amazon says it’s working on free one-day Prime shipping,” The Verge, April 25, 2019.
https://www.theverge.com/2019/4/25/18516795/amazon-prime-free-one-day-shipping-update-earnings
23
Deloitte, “The future of freight: How new technology and new thinking can transform how goods are
moved.” (2017). https://www2.deloitte.com/insights/us/en/focus/future-of-mobility/future-of-freight-
simplifying-last-mile-logistics.html
24
Ibid.
25
Ibid.
Pembina Institute Delivering Last-Mile Solutions | 10Context: Understanding the last mile increasingly important so that cities can adapt to these changing shopping patterns and accommodate growth in goods movement activity in an efficient and sustainable manner. 2.3 Last-mile challenges in urban centres Based on our interviews with industry experts in urban freight and logistics, last-mile delivery trips are particularly challenging in dense urban areas for a number of reasons. First, delivery vehicles require curbside space to either park or make a temporary stop (e.g. in a loading zone) when making deliveries. In dense urban centres, curbside space — defined as the access point between the road and the sidewalk — is in high demand not only by delivery vehicles, but also other curbside users including ride-hailing vehicles, cyclists, buses, taxis, garbage trucks, emergency services, food trucks, and construction workers.26 Due to the high demand for limited curbside space, it is not uncommon for delivery vehicles to circle around a delivery zone in attempt to find a designated place to stop to load/unload deliveries. This is costly for businesses because it increases delivery times and fuel costs. It also increases freight related GHG emissions and air pollutants in cities. A lack of dedicated curbside space for goods movement vehicles has also resulted in inefficient traffic operations as delivery operators often make illegal and ad hoc stops along streets. This impedes the right of way of other road users, particularly cyclists, transit vehicles, and motorists. In 2006, it was estimated that three major courier companies in the City of Toronto were fined a total of $1.5 million in parking tickets.27 This number has likely increased given the increased demand for curbside space and goods movement activity in Toronto since 2006. Another major challenge of conducting last-mile deliveries in urban centres is that often customers are not home during delivery times, resulting in a “missed delivery”. Canada Post reports that 35% of Canadian households do not have anyone at home 26 City of Toronto, Transportation Services, “Staff report: Curbside Management Strategy: Improving How Curbside Space is Used.” (2017). https://www.toronto.ca/legdocs/mmis/2017/pw/bgrd/backgroundfile- 109153.pdf 27 Murtaza Haider, Lindsay Lalonde, Mateen Mehboubi, Christopher Livett and Derick Spenard, Challenges facing express delivery service in Canada’s urban centres (Institute of Housing & Mobility, Ted Rogers School of Management, Ryerson University, 2009), 1-2. Pembina Institute Delivering Last-Mile Solutions | 11
Context: Understanding the last mile

during the day to receive deliveries.28 Packages may be left outside the customer’s home
if no one is available to receive them, but this makes them susceptible to theft and could
potentially create liability issues for couriers and suppliers. However, industry experts
note that multi-unit residential buildings (e.g. apartment towers) are becoming
increasingly strict around the types of goods that are allowed to be left in the building
when people are not home.29 If a delivery operator is unable to leave packages
unattended at the customer’s home (e.g. for contractual obligations with the customer),
then businesses must spend additional time and money to return the items to a
consolidation depot and re-deliver them the next day. Missed deliveries are also
problematic because it is expensive for businesses to hold items and other inventory
due to the high cost of space in dense urban areas. It also means customers need to
make a trip to the consolidation depot to pick up packages. This also presents
challenges from a regional and city-wide goods movement perspective because it means
that up to three or four vehicle trips must be made to receive one missed parcel.

28
  Marc Smith, “Canada Post eCommerce Growth Insights and Impact on Logistics and Delivery,” presented
at the Toronto Region Board of Trade e-Commerce Movement of Goods Roundtable, Toronto, October 30,
2018, 17.
29
  Janelle Lee, Modernizing Urban Freight Deliveries Workshop: Workshop Summary Notes (Pembina Institute,
2019), 12. https://www.pembina.org/reports/modernizing-urban-freight-workshop-summary-notes-
final.pdf

Pembina Institute                                                        Delivering Last-Mile Solutions | 12
3.              Addressing last-mile delivery
                challenges with microhubs
3.1 Defining microhubs
Microhubs are logistics facilities for micro-consolidation, which is the bundling of
goods at a location near the final delivery point (e.g. within 1 to 5 km from the final
destination).30,31 In other words, microhubs provide an additional transhipment point in
the supply chain that is located in the heart of an urban area.32 Other terms are also
used to refer to different types of micro-consolidation operations and the facilities
where micro-consolidation occurs, including micro-consolidation centres, vehicle
reception points, goods reception points, and mobile depots. In this report, we use the
term “microhubs” to broadly refer to such facilities.

Microhubs are different than urban consolidation centres (UCCs), which are logistics
facilities that are typically located just outside a city’s border or in a city’s suburbs
where goods coming from outside of the city can be consolidated before being delivered
within the city.33 In many cases, one UCC is used to serve an entire urban area34 and
therefore a UCC is often relatively large, ranging from approximately 500,000 ft2 to over
5 million ft2 depending on the jurisdiction.35 In contrast, microhubs have smaller

30
  Milena Janjevic and Alassane Balle Ndiaye, “Development and Application of a Transferability Framework
for Micro-consolidation Schemes in Urban Freight Transport,” Procedia – Social and Behavioral Sciences 125
(2014), 285.
31
     Susanne Balm, Amsterdam University of Applied Sciences, personal communication, April 2, 2019.
32
  Janjevic et al., “Development and Application of a Transferability Framework for Micro-consolidation
Schemes in Urban Freight Transport,”, 285.
33
  Bram Kin, Sara Verlinde, Tom van Lier and Cathy Macharis, “Is there life after subsidy for an urban
consolidation centre? An investigation of the total costs and benefits of a privately-initiated concept,”
Transportation Research Procedia 12 (2016), 358.
 Julian Allen, Michael Browne, Allan Woodburn and Jacques Leonardi, “The Role of Urban Consolidation
34

Centres in Sustainable Freight Transport,” Transport Reviews 32 (2012), 480.
35
  Michael Gogas and Eftihia Nathanail, “Evaluation of Urban Consolidation Centers: A Methodological
Framework,” Procedia Engineering 178 (2017), 462.

Pembina Institute                                                            Delivering Last-Mile Solutions | 13
Addressing last-mile delivery challenges with microhubs
footprints that can range from approximately 1,000 ft2 to 10,000 ft2 (see Figure 1).36,37
Although UCCs are one of the most common consolidation schemes in city logistics,
many businesses are experimenting with different consolidation practices, including
micro-consolidation, to reimagine the size, function, and location of logistics
facilities.38,39
Suburban Urban Consolidation
Microhub Lockers
Warehouse Centres
Larger footprint Smaller footprint
Farther from urban Closer to urban
delivery zone delivery zone
Figure 1. Types of urban logistics spaces
Microhub operations may use a permanent building or a mobile structure, operate on a
permanent or temporary basis, and may be operated by one or more businesses in
parallel. In general, though, microhub operations have five common characteristics40:
• Intend to reduce the number of vehicle trips in an urban area
• Focus on the delivery of smaller and lighter loads
• Allow goods to be transferred to a cleaner mode of transport, such as cycling or
walking, for the last mile of delivery
• Are typically operated by privately owned transportation companies
• Facilities are located within an urban area near the final delivery point
36
Sam Clarke and Jacques Leonardi, Agile Gnewt Cargo: parcels deliveries with electric vehicles in Central
London (Greater London Authority, 2017), 46.
https://westminsterresearch.westminster.ac.uk/download/53a6644ba063a519a34b7cc11806396479d756214f
5f785b2588c71d25dadd1c/2484777/GLA-Agile1-DataReport-3May2017.pdf
37
Michael Browne, Julian Allen, Toshinori Nemoto, Daniele Patier, and Johan Visser, “Reducing social and
environmental impacts of urban freight transport: A review of some major cities,” Procedia – Social and
Behavioral Sciences 39 (2012), 30.
38
Janjevic et al., “Development and Application of a Transferability Framework for Micro-consolidation
Schemes in Urban Freight Transport,” 285.
39
Smart choices for cities: Making urban freight logistics more sustainable, 42.
40
Janjevic et al., “Development and Application of a Transferability Framework for Micro-consolidation
Schemes in Urban Freight Transport,” 286.
Pembina Institute Delivering Last-Mile Solutions | 14Addressing last-mile delivery challenges with microhubs Many of these characteristics of microhub operations are not new to the urban freight landscape in Canadian cities. Canada Post’s depots, for example, are facilities closer to the final delivery point for consolidating and transferring goods into a smaller vehicle for transport. As another example, Rexall and Well.ca have partnered together so that customers can conveniently pick up their online purchases at Rexall locations.41 Similarly, PenguinPickUp is a business that offers convenient pick-up locations in high density mixed-use and commercial areas for customers to collect their online purchases from a variety of retailers. Section 3.1.1 presents additional examples of different microhub models in Europe and North America. Although microhubs and parcel lockers are similar in some ways, we differentiate them in this report based on the self-serve characteristic of lockers. Lockers are very small storage units that are located close to the final delivery point in urban or rural areas, and which can be conveniently accessed by customers without the help of a staff person (see Figure 1). This is different than microhubs, where goods are delivered onward to the final destination or where staff is usually available to hand off items to customers for pickup. Lockers are often located inside retail banking locations, grocery stores, transit stations, or condominium lobbies. 3.1.1 Microhub models Businesses may implement a variety of operational models to integrate microhubs into their logistics and supply chain operations. When choosing an operational model, a key consideration is whether microhubs are to be used solely for one business or designed in a manner that allows a mix of multi-carrier consolidation efforts. Microhub operations are practiced in many European cities, including Berlin, London and Paris. Figures 2 to 4 below illustrate some examples of different microhub models, each with a different micro-consolidation approach. Table 1 provides more details on the different features of each microhub example, including the type of cargo delivered from the microhub, the mode used for last-mile delivery, and different government contributions to support microhub operations. 41 Rexall, “Newsroom,” November 20, 2018. https://www.rexall.ca/newsroom/view/33/New-Well.ca-Order- Pick-Up-at-Rexall-Launches-Across-Canada-Just-in-Time-for-the-Holiday-Season Pembina Institute Delivering Last-Mile Solutions | 15
Addressing last-mile delivery challenges with microhubs
Company 1 High density
delivery district
Company 2 1
2
Company 3 3
4
Company 4 5 Each company does
its own deliveries
Company 5 Can be two-way last-mile
system: pick-ups and drop-offs
Delivery via by low- and zero-carbon vehicles
company vehicles
Warehouse Microhub Delivery District
(located far from city centre) (independent spaces) (contained region served by microhub)
Figure 2. KoMoDo's operations in Berlin use independently operated microhub
spaces
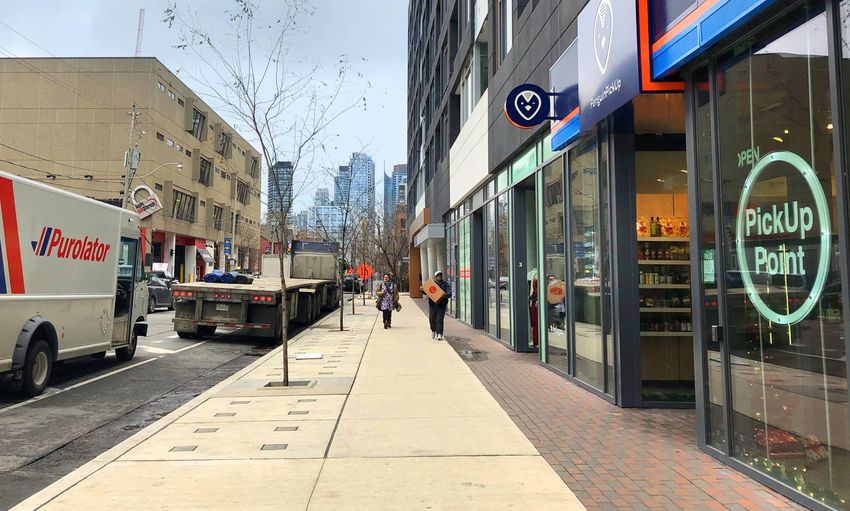
Multicarrier High density
consolidation delivery district
1
Company 1
2
Company 2
3
Company 3 One company makes
all the deliveries
4
All deliveries to microhubs by individual Can be two-way last-mile
company trucks (off-peak deliveries) system: pick-ups and drop-offs
by low- and zero-carbon vehicles
Warehouse Microhub Delivery District
(located far from city centre) (independent and shared spaces) (region served by microhub)
Figure 3. Gnewt Cargo's operations in Central London use a mixed multi-carrier
consolidation approach
Pembina Institute Delivering Last-Mile Solutions | 16Addressing last-mile delivery challenges with microhubs
Multicarrier High density
consolidation delivery district
Company 1
1
Company 2
2
Company 3 One company makes
all the deliveries
All deliveries to microhubs by individual Can be two-way last-mile
company trucks (off-peak deliveries) system: pick-ups and drop-offs
by low- and zero-carbon vehicles
Warehouse or local shop Microhub Delivery District
(located far from city) (shared spaces) (region served by microhub)
Figure 4. La Petite Reine's operations in Paris use a full multi-carrier consolidation
approach
Pembina Institute Delivering Last-Mile Solutions | 17Addressing last-mile delivery challenges with microhubs
Table 1. Examples of microhub models
Vehicle
Specific
Registration Delivery Last-mile Time of Multicarrier Delivery zone Government
Type of cargo delivery
within delivery type* delivery mode resupply consolidation density contributions
routes
zone
Non-perishable,
KoMoDo, Low-emission E-assist cargo Large areas > Free logistics space
B2C non-food Unknown No Yes
Berlin zone cycles 25,000 people/km2 in city centre
parcels
Gnewt
Low-emission Non-perishable,
Cargo, B2C and Electric Predominantly Operational funding
zone; congestion non-food Off-peak Yes Yes
London B2B vehicles (EVs) > 7,000 people/km2 of EUR 288,000
charge parcels
Central
Restricting on- Discounted
Mixed; includes Pedal-only Off-peak Predominantly
La Petite peak large B2C and underground ULS;
perishable food cargo cycles (before Yes No > 12,500
Reine, Paris vehicle entry into B2B analysis and
deliveries and EVs morning peak) people/km2
city centre feasibility study
Mobile depot
TNT Mobile Non-perishable, Operational funding
Low-emission E-assist cargo arrives at Predominantly
Depot, B2C non-food No Yes of an unknown
zone cycles delivery zone > 9,700 people/km2
Brussels parcels amount
at 9:15 am
Mixed; includes Predominantly No
PenguinPick > 8,000 households
N/A B2C perishable food customer pick Unknown Yes (customer None
Up, Canada in 500m radius
deliveries up pick up)
UPS Access Non-perishable, No
Customer pick
Points, N/A B2C non-food Unknown No (customer Varies None
up
Canada parcels pick up)
Canada Post Non-perishable, Small delivery
Canada Post is a
depots, N/A B2C non-food trucks and Unknown No Yes Varies
Crown corporation
Canada parcels vans
*B2C: business to customer; B2B: business to business
Pembina Institute Delivering Last-Mile Solutions | 183.2 Policy context for the implementation of
microhubs
Several policy documents guide freight planning in Ontario, including the Ontario
Ministry of Transportation’s Freight-Supportive Guidelines, Metrolinx’s GTHA Urban
Freight Study, and the Region of Peel’s Goods Movement Strategic Plan. Although many of
the strategies and actions in these documents focus on supporting truck movements
(e.g. establishing a strategic truck route network, improving road infrastructure to
accommodate the movements of large freight vehicles), some recommendations
specifically speak to the need for smaller consolidation facilities or alternative delivery
approaches in dense urban areas. While these policies do not explicitly include terms
such as ‘microhubs’ or ‘micro-consolidation’, they support the essential characteristics
of micro-consolidation — namely, reducing the number of vehicle trips and allowing
goods to be delivered in smaller vehicles.
Action 11 in Metrolinx’s GTHA Urban Freight Study, for example, identifies the
opportunity and need to establish “localized package drop-off stations” in shopping
centres, business parks, or near residential neighbourhoods. Such facilities would allow
couriers to consolidate trips and avoid missed deliveries. Similarly, the Region of Peel’s
Goods Movement Strategic Plan identifies a set of actions to consolidate urban freight
trips in order to improve delivery efficiency and reduce freight-related traffic. Other
policies support the operations of smaller freight vehicles by providing more designated
loading zones and/or off-street parking that make it easier for these vehicles to make
stops along the curb. Metrolinx’s 2041 Regional Transportation Plan further recognizes
the potential for bicycles to be used for goods movement. Table 5 in Appendix A
identifies the relevant documents and specific strategies and plans in Ontario that
support opportunities for microhubs and alternative ways to move goods along the last
mile.
3.2.1 International policy examples
In Europe, some jurisdictions are more prescriptive than Ontario in their approach to
improving goods movement efficiency and reducing freight-related emissions by
imposing the conditions necessary for businesses to adopt alternative goods movement
practices. Low-emission zones (LEZ), for example, are commonly implemented in
European cities to restrict the use of certain polluting vehicles in specific parts of a
Pembina Institute Delivering Last-Mile Solutions | 19Addressing last-mile delivery challenges with microhubs city.42 In London, trucks are subject to a high fee for operating within LEZs if they do not meet the city’s particulate matter emissions standard. An ultra-low emission zone (ULEZ) was also recently implemented in central London where a congestion charge is also in effect. A charge of £12.50 (approximately $21 CAD) is applied to most vehicle types (e.g. cars, van, and motorcycles) under 3.5 tonnes and a £100 charge (approximately $170 CAD) to heavier vehicles (e.g. trucks and buses) over 3.5 tonnes that do not meet European ULEZ emissions standards based on vehicle type and fuel.43 Prohibiting or disincentivizing the use of larger polluting vehicles through LEZs, ULEZs, or similar vehicle access restrictions encourages businesses to adopt micro- consolidation approaches that use small, less-polluting vehicles for goods movement. There is growing appetite for similar policies in the Unites States. New York City recently approved congestion pricing in crowded parts of Manhattan, becoming the first city to implement such a policy in North America.44 Although many details of New York’s congestion charge still need to be determined, it is anticipated that trucks will pay a higher charge than cars. In France, the government has been actively involved in conducting research to understand urban freight activity and supporting the establishment of micro- consolidation spaces.45 The country’s national research program developed a typology of different urban logistics spaces (Espace Logistique Urbain or ELU) based on their location, size, and function. One such ELU is a local logistics point, Espace Logistiques de Proximité or ELP, which is a kind of micro-consolidation facility located within an urban area, ranging in size from 500 to 1,000 m2. As will be discussed in the following section, municipal governments in France provide businesses with a cheaper rental price than the market value for micro-consolidation spaces to ensure that such facilities are available in dense urban areas. 42 Alison Conway, Pierre-Emmanuel Fatisson, Penny Eickemeyer, Jialei Cheng and Diniece Peters, “Urban micro-consolidation and last mile goods delivery by freight-tricycle in Manhattan: Opportunities and challenges,” in Proceedings of the 91st Transportation Research Board Annual Meeting, Washington, DC, USA, 22-25 January 2012, 9-10. 43 City of London, “Ultra Low Emission Zone (ULEZ),” 2019. https://www.cityoflondon.gov.uk/business/environmental-health/environmental-protection/air- quality/Pages/ultra-low-emission-zone.aspx Steven D’Souza, “'A tsunami to get this done': How New York finally accepted congestion pricing,” CBC 44 News, April 14, 2019. https://www.cbc.ca/news/world/new-york-congestion-tax-explained-1.5097217 Browne et al., “Reducing social and environmental impacts of urban freight transport: A review of some 45 major cities,” 29-31. Pembina Institute Delivering Last-Mile Solutions | 20
Addressing last-mile delivery challenges with microhubs

Yokohama, Japan is another example of a place where governments are supporting
urban freight activity in innovative ways.46 The Yokohama City Government and local
police have supported an association of retailers in one of the major shopping districts
in the city to establish a cooperative delivery system and shared consolidation centre.
The local government also subsidized the low-emission vehicles that serve the
consolidation centre.

In Ontario and Canada more broadly, the applicability of microhubs and cyclelogistics
depends on the policy and regulatory environment (e.g., policies governing weight
requirements for e-assist cargo cycles, subsidized microhub spaces in dense urban
areas), as well as the ability for businesses to modify their operations to allow for multi-
carrier consolidation where it makes sense.

3.3 Conditions for success
There are three key elements to consider when evaluating the potential success of
microhub operations: relevance, suitability, and feasibility.47 Relevance is defined as the
need for micro-consolidation in a given area, which is determined by the current and
potential demand for goods delivery. Dense urban areas tend to have higher relevance
since there are more businesses and households, increasing the potential demand for
deliveries. Research shows that denser areas experience the least vehicle kilometres
traveled per delivery since delivery locations are located closer together.48 If demand for
goods movement in an area is too low, there is little reason for companies to establish a
microhub since the level of demand will not justify its operational costs.

Suitability is the second condition for success. It refers to the physical attributes of a
service area that make it more or less favourable to microhub operations. These
attributes include accessibility to and within the service area, availability of loading and
unloading infrastructure, and design of the transportation network. Areas that are best
suited for micro-consolidation operations are difficult to access by larger delivery
vehicles (either due to limited road space, high congestion levels, or vehicle
restrictions), have limited space available for delivery vehicles to stop along the
curbside, and prioritize infrastructure designed for pedestrians, cyclists, and transit

46
     Ibid., 25.
47
  Janjevic et al., “Development and Application of a Transferability Framework for Micro-consolidation
Schemes in Urban Freight Transport,” 294.
48
  Boyer et al., “The Last Mile Challenge: Evaluating the Effects of Customer Density and Delivery Window
Patterns,” 195.

Pembina Institute                                                          Delivering Last-Mile Solutions | 21
You can also read