Consumer Adoption of Plug-In Electric Vehicles in Selected Countries
←
→
Page content transcription
If your browser does not render page correctly, please read the page content below
Article
Consumer Adoption of Plug-In Electric Vehicles in
Selected Countries
John D. Graham and Eva Brungard *

                                           O’Neill School of Public and Environmental Affairs, Indiana University, Bloomington, IN 47405, USA;
                                           grahamjd@indiana.edu
                                           * Correspondence: evabrung@iu.edu

                                           Abstract: The transition to plug-in electric vehicles is examined from the consumer’s perspective.
                                           Since risk-averse consumers perceive disadvantages as well as advantages, consumers are reluctant
                                           to choose electric propulsion without significant nudges from the government. Norway, California,
                                           Germany and China are analyzed to determine why and how electric vehicles are promoted by public
                                           policies. Each jurisdiction has accomplished rates of electric-vehicle penetration that are far above
                                           the global average. This success is largely attributed to various policies which range from vehicle
                                           mandates, producer and/or consumer subsidies, or taxation in respective regions—otherwise PEVs
                                           remain relatively unappealing to risk-averse consumers. Demand and supply side policies have been
                                           effective tools in spurring adoption of the new electric propulsion system. Norway is one notable
                                           jurisdiction that has PEV penetration exceeding 80% of new vehicle sales despite no supply side
                                           incentives. Germany has recently surpassed California and China in PEV penetration rate, though all
                                           three jurisdictions exceeded 10 percent by 2020 or early 2021. Research is recommended to identify
                                           ways to encourage consumer adoption of electric vehicles.

                                    Keywords: electric vehicle; PEV; consumer preference; commercialization; marketing; pro-PEV; incentives
Citation: Graham, J.D.; Brungard, E.
Consumer Adoption of Plug-In
Electric Vehicles in Selected Countries.
Future Transp. 2021, 1, 303–325.           1. Introduction
https://doi.org/10.3390/                        When entrepreneurs bring an invention to the marketplace, they are often stunned to
futuretransp1020018                        learn that many consumers are not interested in their invention. The harsh reality is that 60%
                                           of new products in the economy are no longer sold within three years [1]. Marketing experts
Academic Editor: Antonio Comi              argue that inventors do not focus enough on understanding how customers evaluate
                                           products and make purchase decisions [2].
Received: 27 June 2021
                                                The modern plug-in electric vehicle (PEV) is an invention that is gaining market
Accepted: 29 July 2021
                                           momentum but not at the rate that politicians desire to address urgent societal concerns
Published: 10 August 2021
                                           such as poor urban air quality, global climate change and energy insecurity. The global
                                           penetration rate of PEVs in the new vehicle market grew from virtually 0% in 2010 to about
Publisher’s Note: MDPI stays neutral
                                           4.6% in 2020 [3].
with regard to jurisdictional claims in
                                                We use the umbrella term “plug-in electric vehicles” (PEVs) to encompass all-electric
published maps and institutional affil-
                                           vehicles and plug-in hybrid-electric vehicles (PHEVs). Conventional hybrid electric vehicles
iations.
                                           (HEVs) are not PEVs because they do not access the grid for electricity. The term battery-
                                           electric (BEV) is also used to refer to all-electric vehicles.
                                                Except for a few premium PEVs (e.g., the Tesla Model S and the BMW i3), the actual
                                           number of sales of first-generation PEVs fell far short of the corporate sales goals established
Copyright: © 2021 by the authors.
                                           by vehicle manufacturers [4]. Table 1 compares the corporate sales plans for each first-
Licensee MDPI, Basel, Switzerland.
                                           generation modern PEV with the number of PEVs actually sold in the US or globally.
This article is an open access article
                                           In general, the affordable PEVs aimed at the mainstream retail market (the MiEV, the
distributed under the terms and
                                           Chevrolet Volt, and the Nissan Leaf) fell far short of achieving their sales goals. The upscale
conditions of the Creative Commons
Attribution (CC BY) license (https://
                                           PEVs aimed at the luxury-sedan segment did better, with the Tesla Model S selling better
creativecommons.org/licenses/by/
                                           than Tesla’s goal. The shortfalls suggest that the companies selling the more affordable
4.0/).                                     PEVs underestimated—by a big margin—how difficult it would be to sell them.

Future Transp. 2021, 1, 303–325. https://doi.org/10.3390/futuretransp1020018                             https://www.mdpi.com/journal/futuretransp
Future Transp. 2021, 1 304
Table 1. First-Generation Modern PEVs: Sales Targets vs. Actual Sales [5] (p. 35).
Model Year Goal Set Sales Goal Time Frame Region Actual Sales Sales Year
Mitsubishi MiEV 2008 30,000 2013 Global 8181 2011–2013 *
Chevrolet Volt 2009 50,000 Per year US 20,592 2012–2018 **
Chevrolet Volt 2009 500,000 Cumulative—2016 Global 187,000 2010–2016
Nissan Leaf 2010 20,000 2012 US 9819 2012
Nissan Leaf 2010 1,500,000 Cumulative—2016 Global 470,000 2010–2017
BMW i3 2011 30,000 Per year Global 26,315 2014–2018 **
Tesla Model S 2012 20,000 Per year US 23,038 2014–2019 **
* Average annual sales in top markets (US, Canada, Japan and Australia) ** Annual average of sales.
Some cities, countries and regions have experienced rapid penetration of PEVs, espe-
cially where policy makers create strong incentives for consumers to select a PEV and/or
strong disincentives to purchase a conventionally powered vehicle. In 2020, for example,
the rate of PEV penetration of new vehicle sales was almost 75% in Norway, 13.5% in Ger-
many, 8.1% in California and about 5.4% in China [6]. Table 2 illustrates the discrepancies
in EV uptake across various regions around the world.
Table 2. Market penetration of PEVs by region 2010–2020 [6].
Region 2010 2011 2012 2013 2014 2015 2016 2017 2018 2019 2020
Norway 0.31 1.32 3.24 5.89 13.3 21.1 26.6 37.1 49.1 55.9 74.70%
California 0.00 0.50 1.30 2.50 3.20 3.10 3.60 4.80 8.97 8.26 8.10%
China 0.00 0.00 0.06 0.08 0.36 0.98 1.39 2.30 4.60 4.90 5.40%
Europe 0.01 0.08 0.23 0.53 0.75 1.41 1.35 1.74 2.50 3.60 11.40%
France 0.00 0.12 0.33 0.53 0.70 1.18 1.44 1.76 2.20 2.80 11.20%
Germany 0.00 0.01 0.11 0.23 0.42 0.72 0.73 1.59 2.00 3.00 13.50%
USA 0.00 0.17 0.43 0.71 0.77 0.70 0.98 1.26 2.30 2.10 2.20%
Japan 0.06 0.33 0.58 0.65 0.69 0.59 0.50 1.23 1.10 0.90 0.60%
Global Average 0.01 0.07 0.17 0.25 0.38 0.62 0.86 1.30 1.10 2.60 4.60%
In this article, we explore the challenges of mass commercialization of PEVs and offer
insights as to why different jurisdictions are at different stages of commercialization. To the
best of our knowledge, this is the first academic paper to compare these four jurisdictions
in terms of motivations for PEV policy and the mix of pro-PEV policies that they chose to
adopt. We build on the substantial pre-existing literature that evaluates the effectiveness of
different policy instruments; see [7–11].
We start from the perspective of the mainstream retail purchaser of light-duty pas-
senger vehicles. We identify the salient advantages and disadvantages of a modern PEV
compared to conventionally powered vehicles. For each disadvantage, we describe inno-
vations underway to reduce or minimize the disadvantage. We then consider how risk
aversion among ordinary consumers complicates efforts to sell PEVs to mainstream buyers,
especially since conventional hybrid electric vehicles (HEVs) and plug-in hybrid electric
vehicles (PHEVs) are viable alternatives to all-electric vehicles. In the last section of the
paper, we describe steps policy makers are taking to stimulate commercialization of PEVs.
We focus on policy innovations in Norway, California, Germany and China. We conclude
with some future research needs related to consumer adoption of PEVs.Future Transp. 2021, 1 305
2. Consumer Perspectives
In 2015 an expert committee of the US National Research Council identified the
possible advantages and disadvantages of PEVs from the consumer’s perspective [12].
These factors are not societal concerns (pollution, climate change and energy insecurity)
because most consumers evaluate PEVs based on private considerations rather than societal
concerns. An exception is the “early adopter” community which sometimes has societal
symbolism in mind when they purchase their vehicle. The State of California found,
for example, that some early buyers of the Nissan Leaf (38%) and Chevrolet Volt (18%)
cited “reducing environmental impacts” as the most important reason for their vehicle
choice [13].
There is a substantial literature on the perceptions and characteristics of early adopters
of PEVs in different countries. Early adopters are crucial to creating the positive “word
of mouth” praise that boosts the commercial fortunes of new technologies. Once PEV
commercialization proceeds beyond the early adopters, it becomes more important for the
PEV to have a tangible value proposition related to a household’s transport needs [14].
2.1. Advantages
2.1.1. Sporty Performance
The instant response of the electric motor in a PEV creates a meaningful difference in
pedal response for consumers who notice acceleration. It shows in street-start acceleration—
also called the “rolling start” test—from 5 to 60 miles per hour (mph). While rolling with
the car in gear, testers floor the accelerator at 5 mph and shift quickly at the optimal shift
point. One test compared the Tesla Model 3 to the gasoline powered BMW 330i, a popular
sporty sedan. In the rolling start test, the Model 3 consumed 5.1 s, 1.4 s faster than the
330i [15].
One of the reasons that PEVs have penetrated the near-premium and premium sedan
market is that consumers of such vehicles tend to value performance. This is also the reason
that PEVs may have promise in the large US market for pick-up trucks, where acceleration
and towing capability are important dimensions of performance.
2.1.2. Lower Operating Costs
The PEV’s most tangible advantage is lower operating cost. In the United States, where
gasoline taxes are relatively low, consumers pay USD 2 to USD 4 per gallon for gasoline
(depending on the state); since electricity prices are quite low, travel-equivalent operating
cost of a PEV is about 60–70% smaller than a gasoline vehicle. Given travel patterns in
the US, a consumer can expect to save USD 500–1000 per year, assuming the consumer
can access low residential electricity rates (which usually requires at-home charging) [16].
The comparison in most of Europe is even better for PEVs because electricity prices are
not much higher than the US, but fuel prices (due to heavy taxation) are two to three
times higher than US fuel prices. China’s fuel prices are an intermediate case between the
extremes of the US and Europe.
2.1.3. Lower Maintenance and Repair Costs
The PEV’s design is simpler than a gasoline- or diesel-powered vehicle due to fewer
moving parts that can wear out and no oil changes or emissions-system repairs [17]. In
the US, a consumer might save an average of USD 400 per year in maintenance and repair,
assuming the PEV’s battery does not fail and require replacement (discussed below under
disadvantages) [18]
As policy makers require vehicle manufacturers and suppliers to address the full
lifecycle costs of batteries (e.g., disposal of battery wastes and/or recycling of batteries), the
prices of lifecycle management will need to be reflected in the purchase price of the PEV.Future Transp. 2021, 1 306
2.1.4. Convenience in Daily Use
For owners of PEVs that can charge their vehicles at home and/or work, they avoid
the hassle of making special trips to gasoline refueling stations. Even for motorists that lack
home and workplace charging, a well-developed public charging system may allow them
to routinely charge while engaged in other activities such as grocery shopping, medical
visits, and shopping mall trips.
However, if PEV owners make extensive use of public charging during peak times,
peak loads on the grid will rise and more capacity may be required. A smart grid network
is likely to include time-of-day pricing for electricity that encourages charging at off-peak
times (e.g., nighttime charging). Thus, there is a tradeoff between making charging conve-
nient for PEV owners and smoothing the demand for electricity for electricity providers.
2.1.5. Less Internal Vehicle Noise
During vehicle operation, a PEV is quieter than a gasoline- or diesel-powered vehi-
cle [19]. A study of taxi drivers suggests that a PEV’s quieter driving experience contributes
to enhanced mental health due to reduced stress and greater happiness [20]. PEVs are so
quiet that regulators in Europe and the US have set minimum standards for external noise
to protect the safety of unsuspecting pedestrians (e.g., the blind).
2.2. Disadvantages
If PEVs had no disadvantages, the five advantages would likely be compelling enough
to trigger a rapid transition to PEVs. The hard truth is that PEVs do have some disadvan-
tages, though efforts are underway to minimize those disadvantages.
2.2.1. Higher Purchase Cost
A 2018 comparison of manufacturer suggested retail prices (MSRPs) in the US market
found that the average price premium for a PEV, within vehicle segment, ranged from
USD 6000 to USD 17,000 [21]. Since some automakers are selling PEVs at a loss to achieve
regulatory compliance, it is likely the observed price premiums are temporarily deflated
below break-even levels.
The biggest single contributor to the cost of a PEV is the lithium-ion battery pack, and
70–90 percent of pack costs are battery-cell costs [22]. Average battery cell costs declined
by 80% from USD 1000 per kWh in 2010 to USD 200–300 per kWh in 2018 [23]. The
price declines in 2019–2020 continued, with the lowest prices in the industry below USD
150 per kWh [24]. A rule of thumb in the industry is that PEV applications for sedans might
achieve cost parity with gasoline vehicles if battery prices fall below USD 100 per kWh [25].
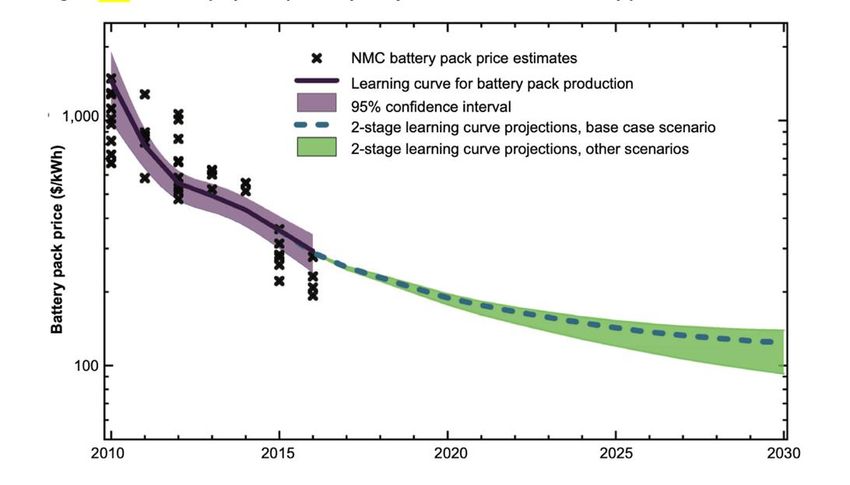
Figure 1 displays the projected decline in battery-cell prices over the next decade (e.g., as
new battery chemistries curtail the use of expensive cobalt) but experts disagree about
how much and how fast. The production costs of electric motors, inverters and electronics
should also fall significantly by 2030 due to economies of scale in production.Future Transp. 2021, 1, FOR PEER REVIEW 5
Future Transp. 2021, 1 307
Figure 1. Past and projected price trajectory for lithium-ion NMC battery packs [26].
Figure 1. Past and projected price trajectory for lithium-ion NMC battery packs [26].
Naïve forecasts suggest that PEVs may be cheaper than gasoline vehicles within a
Naïyears.
few ve forecasts
Those suggest thatignore
forecasts PEVs may somebecountervailing
cheaper than gasoline
trends thatvehicles
willwithin
put a floor on
a few years. Those forecasts ignore some countervailing trends
battery-cell prices: rising prices for raw materials (which account for a largerthat will put a floor share of
on battery-cell prices: rising prices for raw materials (which account for
cell costs than they did ten years ago); regulations on mining companies that minimize a larger share
of cell costs than they
environmental did tenofyears
damages ago);
mining; regulations
regulations onrequire
that mininglesscompanies that min-materials
use of hazardous
imize environmental damages of mining; regulations that
in cell design and end-of-life battery waste-management plans (includingrequire less use of hazard-recycling of
ous batteries
materialsor incomponents);
cell design andnew end-of-life battery waste-management plans (includ-
battery designs that can simultaneously increase driving
ing range
recycling
whileof batteries
reducingor components);
charging time; andnewenhanced
battery designs
coolingthat can simultane-
systems to further reduce
ously increase driving
heat-related batteryrange
failurewhile
and reducing
safety risks charging time; and enhanced
[27]. Completely new battery cooling
designs (e.g.,
systems
solid to further
state reduce
batteries) areheat-related
promising but battery failure
unlikely and safety
to achieve risks [27].
significant marketCom- penetration
pletely new battery designs (e.g., solid state batteries) are promising
prior to 2030. Given the above, it seems likely that PEVs will be more costly to but unlikely to produce
achieve significant market penetration prior to 2030. Given the above, it seems
than gasoline vehicles for the foreseeable future. The cost issue is especially concerning for likely
thatlight
PEVs will be
trucks moreminivans
(SUVs, costly toandproduce
pickup than gasoline
trucks) since vehicles for the
such vehicles foreseeable
require relatively large
future. The packs
battery cost issue is especially
because concerning
of their weight for light
and vehicle trucks
profile (SUVs,
(poor minivans and
aerodynamics). Consumer
pickup
demandtrucks)
forsince
light such
trucksvehicles
is growingrequire relatively
faster large battery
than demand for sedanspacks because
in the of
US, Europe and
theirChina
weight and vehicle profile (poor aerodynamics). Consumer demand for light
[28].
trucks is growing faster than demand for sedans in the US, Europe and China [28].
2.2.2. Limited Driving Range
2.2.2. Limited Driving
Why have Range
PEVs with driving ranges less than 100 miles not been successful commer-
cially
Why have PEVs withaverage
successful? The drivingnumber
ranges of miles
less thanof100travel
milespernot
daybeen
varies across countries
successful
but all the averages are far below 100 miles per day (Japan 14 miles,
commercially successful? The average number of miles of travel per day varies across Germany 25 miles, US
countries but all the averages are far below 100 miles per day (Japan 14 miles, Ger- to meet
27 miles and China 30 miles) [29]. The reason is that consumers purchase vehicles
manytheir
25 predictable
miles, US 27peak transport
miles needs,
and China not their
30 miles) average
[29]. needsis[30].
The reason that Think of consumers
consumers
who buy
purchase a four-wheel
vehicles to meetdrive
theirvehicle because
predictable peakit snows several
transport needs,times
nota their
year or drive a pickup
average
needs [30]. Think of consumers who buy a four-wheel drive vehicle because it snows uses are
truck because they can tow their trailer a few weeks in the summer. Extreme
highly
several salient
times to consumers
a year [5] (pp.truck
or drive a pickup 34–64).
because they can tow their trailer a few
weeks in the summer. Extreme uses are highlythat
American households want vehicles can to
salient make long trips
consumers [5] during the Memorial
(pp. 34–64).
Day, Independence Day, Labor Day, Thanksgiving and Christmas
American households want vehicles that can make long trips during the Memo- holidays. Even in Europe,
where intercity train service is much better than the US, many households own (or rent) a
rial Day, Independence Day, Labor Day, Thanksgiving and Christmas holidays.
private vehicle to drive from northern Europe for extended vacations in Spain, southern
Even in Europe, where intercity train service is much better than the US, many
France, Italy and Greece. Additionally, marketing PEVs in colder climates is especially
households own (or rent) a private vehicle to drive from northern Europe for ex-
challenging because cold weather reduces the driving range of the PEV.
tended vacations in Spain, southern France, Italy and Greece. Additionally, market-
In multiple-vehicle households, a short-range PEV could be used for commuting and
ing PEVs in colder climates is especially challenging because cold weather reduces
local shopping while a second vehicle handles long-distance trips. If it is not a diesel or
the driving range of the PEV.
gasoline vehicle, it could be an HEV, PHEV or fuel cell electric vehicle. For modest-income
In multiple-vehicle households, a short-range PEV could be used for commut-
households that can afford only one vehicle, a short-range PEV is not appealing.
ing and local shopping while a second vehicle handles long-distance trips. If it is notFuture Transp. 2021, 1 308
Automakers now recognize that mass commercialization of PEVs will not occur
without longer driving range. The more recent PEV offerings provide greater range. The
second-generation Leaf (base version) has a range (151 miles) more than double the first-
generation Leaf (73 miles). The price of the Leaf has not declined significantly in the last ten
years, despite the 80% decline in battery-cell prices, in part because those savings have been
poured into packs that achieve longer driving range and lower risk of battery degradation
(which contributes to shorter driving range in real-world use) [5] (pp. 458–459).
How long must range be to satisfy consumers? The second-generation Leaf is not
selling especially well. The Chevrolet Bolt has not been a big seller even though its driving
range is more than 250 miles. The best-selling PEV in the world is the Model 3, which has
a driving range of 263 miles (base version) or 353 miles (Long Range version)—the 2021
models. Keep in mind that Tesla owners also can access a proprietary charging network that
curbs some of the disadvantages of limited driving range. However, the pricing of Tesla
products is too high to achieve mass commercialization beyond premium markets [31].
2.2.3. Long Charging Time
The three levels of available charging can achieve a full charge in 12–18 h (Level 1, no
cost), 3-6 h (Level 2, USD 1500–2000 for home system), and 80% charge in 30 min (Level 3,
USD 40,000 for commercial system). Porsche has introduced the Taycan with “ultra-fast
charging” (80% in 15–20 min). The capability for ultra-fast charging raises the cost of
producing battery cells and creates risks of accelerated battery degradation (which reduces
range). For a vehicle in the Taycan’s price range (>USD 100,000), ultra-fast charging is
viable; it may be many years before ultra-fast charging is offered on an affordable PEV [32].
None of these options competes with the 3 to 7 min it takes to refuel most gasoline
tanks. This is a significant marketing disadvantage for the PEV. GM officials have stated
that ultra-fast charging will be necessary to achieve mass commercialization of PEVs [33].
A Level 2 arrangement can suffice for a consumer that can charge daily at home
or work. Reliance on public charging has drawbacks. Outdoor public charging exposes
motorists to all the elements: frigid temperatures, freezing rain, snow and hot humid
air. This is not an issue in much of coastal California where the weather is relatively dry
and moderate throughout the year. Reliance on public charging also exposes motorists to
elevated electricity prices and potential waiting lines for stations.
China is exploring battery swapping stations as well as public charging stations [34].
At the end of 2020, China had 555 battery swapping stations in operation, 81% more than
in 2019. Both established and startup Chinese companies are planning to work with the
central government on a large-scale pilot project of battery swapping.
The barriers to widespread implementation of battery swapping are formidable. There
is no standardization in the design and location of battery packs in vehicles. Automakers
and their suppliers resist standardization because they are seeking competitive advan-
tage with innovation in battery design and location. One Western start-up (Better Place)
attempted battery swapping but went bankrupt, in part due to an inability to recruit partic-
ipation by automakers and consumers. Moreover, the fixed costs of a battery-swapping
station are substantial because space is required for a large inventory of battery packs and
specialized equipment is required to manipulate, charge, and repair battery packs. China
may have more success with battery swapping for urban delivery vehicles and taxi fleets
than with retail customers.
2.2.4. Uncertain Battery Life
The big uncertainty about the PEV’s repair-cost advantage is the low-probability,
high-cost outcome of battery failure and replacement. The frequency of battery failure is
unknown because few real-world PEVs have been used for more than a decade. It is the
second decade of a vehicle’s lifetime when battery failure might be most likely to occur.
Battery replacement is expensive. Replacement of the Leaf’s battery pack costs USD
5499 plus installation costs (2011–2014 models). The Chevrolet Bolt’s battery pack costs USDFuture Transp. 2021, 1 309
15,734 to replace [35]. The Tesla Model 3 has sixteen separate battery modules; replacing
one of them costs USD 5000 to USD 7000 [36]. Replacement costs are a bigger concern
for individual retail buyers than fleet buyers. Fleet buyers (e.g., car sharing companies
or rental car companies) can build the costs of replacements into the average price of car
sharing or car rentals.
To relieve consumer concern about battery failure, the affordable PEVs in the US were
sold largely on three-year leasing arrangements. Even Tesla introduced a leasing option
in 2019. For PEV buyers, the typical warranty is for 8 years or 100,000 miles, which is
slightly greater than half of the average vehicle’s life in the US [37]. Tesla’s warranties are
not entirely reassuring, as they do not cover the first 30% of battery degradation within the
warranty period—100,000 miles for the Model 3; 150,000 miles for the Model S and X [38].
Battery failure may be a smaller risk for premium vehicles with large battery packs
and long driving range. Each cell experiences less load in a pack that achieves longer
range. Larger packs may also experience fewer full charging events, which means that
they will less frequently experience the low rates of charge that trigger accelerated battery
degradation. For affordable PEVs with short driving range, battery degradation is a real
issue, and this has been confirmed in real-world experiences with the Nissan Leaf [39].
2.2.5. Poor Resale Value
With the exception of the Tesla products, the annual depreciation rates of PEVs
are significantly larger than for conventional vehicles [40]. This is partly a reflection of
government purchase incentives for PEVs, which typically apply to new PEVs but not used
PEVs. However, it may also reflect the fact that PEVs have a constrained resale market.
Lower-income households are a big force in the market for used vehicles. They may be able
to afford only one vehicle, and it must meet their short- and long-distance needs. Moreover,
lower-income households are less likely to own a private garage where they can charge
at home. Public charging, even if available, will have elevated electricity prices, which
attenuates the PEV’s operating-cost advantage. Tesla vehicles hold their value because
Tesla’s sales have been production constrained, and numerous early adopters that cannot
obtain one new are happy to buy them used. Moreover, an early adopter that cannot afford
a new Tesla product will entertain a used Tesla purchase. One of the good signs in the PEV
market is that the depreciation rates for PEV products appear to be declining over time [41].
Nonetheless, for the retail buyer that studies resale values, the PEV will look a bit risky.
3. The Risk Averse Consumer and the Hybrid Alternative
Early adopters of automotive technology are not very risk averse because they are
wealthy enough to own multiple vehicles and they can trade in a troublesome vehicle for a
new vehicle before the troubled vehicle has serious problems. They also enjoy owning the
most recent automotive technology, and they accept some of the inevitable risks of new
technology [42].
For the mainstream retail buyer, risk aversion is a common attitude in car buying. The
car purchase is the second largest investment a typical household makes after the home
purchase. The mainstream buyer is not necessarily inclined to pay a premium price for a
new propulsion system with so many potential risks: uncertain battery life, insufficient
public charging, especially on rural roads and highways that connect cities, and fears of
public charging in poor weather with long waiting times [43]. Additionally, these buyers
may not be able to afford Tesla products and their associated proprietary charging system.
A risk-averse consumer, even if they are prepared to innovate, might be more inclined
to purchase an HEV or PHEV rather than an all-electric vehicle. The HEV accomplishes
significant (20–30%) savings in operating costs compared to a conventional vehicle but
without all the complications associated with home, workplace and public charging [44].
The purchase premium of the HEV today is less than half of the purchase premium of
an all-electric vehicle. Additionally, HEVs pose little risk of battery failure because theirFuture Transp. 2021, 1 310
battery-management systems are designed to preclude deep discharges and charges. The
batteries in the Toyota Prius typically last longer than the life of the vehicle [45].
Given these considerations, it should not be surprising that Toyota’s HEV sales in
Europe and the USA have grown explosively in the last two years, serving as a real
competitor to electric vehicles [46]. For related reasons, the PHEV has made a comeback in
Europe in the last two years, and it has also gained some traction in the Chinese market.
Whether HEVs and PHEVs can compete in the long run (when battery technologies are
improved and PEV prices lower) is less certain, since the consumer must purchase two
propulsion systems rather than one.
4. Spurring Pev Adoption through Public Policies
Politicians are not satisfied with the current rates of PEV penetration because they en-
vision PEVs meeting the needs of society as well as the daily transport needs of consumers.
Those societal needs may be urban air quality, climate-change mitigation, energy security
and/or industrial policy. In this section, we explore why and how selected jurisdictions are
stimulating PEV penetration. For illustrative purposes, we chose Norway, Germany, China,
and California because they have each achieved above-average rates of PEV penetration.
Other countries with above-average PEV penetration rates that we do not address are
Iceland, Sweden, Finland, France, Denmark, the Netherlands and the UK.
4.1. Norway
Norway does not have a severe energy-insecurity or air-quality issue. Nor does it have
a significant auto industry or a plan to develop one. Since the 1980s and 1990s, Norwegian
politicians have been pioneers of—and proponents of—progressive climate policies [47].
This may seem surprising since oil and gas development is the country’s largest industry.
Norway’s major oil company, Stateoil, is a publicly traded company but the government
owns a 67% interest, which it manages through a dedicated ministry. Additionally, since
Stateoil sells most of its oil outside of Norway, PEVs in Norway are not a significant threat
to Stateoil’s commercial future. Thus, there are no powerful interests in Norway opposed
to PEVs.
Several features of Norway explain why this small country has been highly effective
in promoting electric vehicles. Norway is a wealthy country where 75% of consumers park
their cars on land that they own and another 12% park their car less than 100 m away
from their home [48]. As a result, home charging is more feasible in Norway than in most
other countries. Most of the population lives in the Oslo metropolitan area or in a series of
smaller mid-sized cities and towns where public charging networks are feasible.
Average gasoline prices in Norway are among the highest in the world, around USD 7
per gallon, due to heavy taxation [49]. Electricity prices are quite low (around USD 0.14 per
kWh in 2019), among the lowest in Europe. Hydropower supplies 96% of the country’s
electricity, and is a clean, renewable energy source [50].
In June 1991 a PEV startup, TH!NK Global, launched in Norway [51]. With the
assistance of French automakers, it made limited production runs of PEVs with nickel-
cadmium batteries. The original owners of the TH!NK vehicles contributed to the nucleus
of the Norwegian Electric Vehicle Association (NEVA), which formed in the 1990s to
advocate pro-PEV policies. TH!NK Global struggled through four bankruptcies and
multiple owners before ceasing operations in 2011. In the interim, however, the TH!NK
experience demonstrated that Norway’s city centers might be good niche markets for
improved PEVs. Several global automakers responded by offering PEVs in Norway:
Mitsubishi in 2010; Nissan and the French automakers in 2011; and BMW, Volkswagen and
Tesla in 2012–2013.
Two key turning points occurred in Norway’s pro-PEV policies. In 1996 the govern-
ment decided to exempt PEVs from the country’s large registration tax. Without this broad
exemption, a USD 50,000 Tesla Model 3 would have cost a Norwegian consumer USD
100,000 to purchase. In contrast, gasoline- and diesel-power cars were penalized with theFuture Transp. 2021, 1 311
initial registration tax (now a CO2 tax on vehicles), annual vehicle ownership fees, and
high gasoline taxes and road ferry tolls.
The second turning point occurred in 2012 when the Norwegian government prepared
its first comprehensive White Paper on climate policy [52]. The Paper included a compre-
hensive plan to promote PEVs in Norway. Parliament acted on the Paper and extended
pro-PEV incentives for five years (2014–2018) or until 50,000 PEVs were sold, whichever
came first [53].
Table 3 compares Norway’s retail prices (USD) of PEVs to competitive gasoline vehi-
cles in 2017. The Norwegian consumer saves about USD 3500 by selecting a VW e-Golf
over a conventional VW Golf. A consumer also saves almost USD 6000 by selecting a
Tesla Model 3 over a gasoline-powered Audi A-7, a popular executive sedan in Norway.
Considering Norway’s high fuel prices and low electricity prices, a consumer will also save
an additional USD 1500 to USD 2000 per year in operating costs with a PEV. If the consumer
lives and works in the Oslo area, the PEV owner can save up to USD 5000 per year in
parking fees and USD 1400 per year in toll road charges, depending on the consumer’s
precise circumstances. To top it off, during times of day when Oslo is congested with traffic,
the PEV owner accessed the uncongested bus lanes.
Table 3. The Retail Prices [USD] of BEVs Compared to Competitor Gasoline Vehicles in Norway, 2017 [54].
PRICE FACTOR [USD] VW GOLF VW E-GOLF AUDI A-7 TESLA MODEL S
IMPORT PRICE 18,062.40 25,990.00 31,946.40 63,600.00
CO2 TAX 3182.70 - 12,525.30 -
NOX TAX 226.30 - 152.50 -
WEIGHT TAX 2152.60 151.00 10,919.80 -
SCRAPPAGE FEE 240.00 240.00 240.00 240.00
25% VAT 5966.00 - 13,946.00 -
FINAL RETAIL PRICE 29,830.00 26,381.00 69,730.00 63,840.00
The cumulative effect of Norway’s policies was a powerful incentive for consumers to
select a PEV. Consumers responded. The PEV’s penetration rate of new vehicle sales rose
from virtually 0% in 2010 to 21% in 2015 and to over 75% in 2020 [55]. The PEVs sold in
Norway are the same products offered by global automakers around the world. The top
sellers in 2019 were the Tesla Model 3, the VW e-Golf, the Nissan Leaf, the Hyundai Kona
EV and the Renault Zoe.
A key point about Norway’s success with PEV commercialization is that it occurred
with a tangible value proposition, not simply a symbolic appeal. Surveys of Norwegian
consumers indicate that 72% chose a PEV for economic reasons; 26% for environmental
reasons and 2% for other reasons [56].
Indeed, the financial case for PEVs in Norway is so overwhelming that it is difficult
to imagine why 20–25% of consumers do not choose PEVs. Two factors may help explain
the continued sales of conventional vehicles. Few PEVs have been offered in the SUV
market, yet SUVs are growing in popularity in Norway. In addition, the northern regions
of Norway have extremely cold weather and inadequate charging networks, both factors
known to discourage PEV sales.
One feature of Norway’s pro-PEV policies may not be generalizable to other countries.
The PEV’s purchase-price advantage was accomplished by heavy taxation of gasoline- and
diesel-powered vehicles rather than public subsidies of PEV purchases. Subsidies can have
the same effect on the government’s balance sheet but the electoral risks to politicians
are less for subsidies than for taxation of conventional vehicles. Such harsh taxation of
conventional vehicles seems politically implausible in the US.Future Transp. 2021, 1 312
4.2. California
California has three reasons for promoting PEVs: improved air quality in cities, control
of greenhouse gases linked to climate change, and economic development in the State
through a PEV industry. Unlike Norway, California has employed both supply side and
demand-side policies to stimulate the PEV market.
California’s major challenge is to expand PEV penetration in the mainstream vehicle
market. Sales data for 2020 reveal that Tesla is the dominant seller of PEVs in the state,
accounting for approximately half of all new PEV sales and four of the five top selling PEV
models [57]. See Table 4. In each segment that Tesla entered, it penetrated primarily the
premium end of the segment. Tear-down studies indicate that Tesla is making a profit not
on the base version of the Model 3 (offered in 2021 for about USD 41,190 without much
content; the long-range model starts at USD 50,190) but on its long-range and performance
versions that include numerous upgrades [58]. Tesla has announced no concrete plans to
offer an affordable PEV for mainstream consumers in the US. The announced plans for
Tesla’s new plant in Austin, Texas include an upscale pickup truck (the Cybertruck), a
Class 8 semi-truck (the Semi), and additional volume of its premium Model 3 sedan and
Model Y SUV [59].
Table 4. Tesla’s Share of the California Market for PEVs, 2020–2021 [60].
Tesla Models Sales Volume, 2020 Sales Volume, 2021, Q1
Model 3 38,580 9731
Model Y 20,124 13,786
Model X 7452 1745
Model S 4,718 889
Total Tesla 70,874 26,151
Total CA PEVs 132,772 53,261
Tesla Share 53% 49%
The early adopters of Tesla products in California may be seeking the most advanced
automotive technology and the Silicon Valley brand as much as electric propulsion per se.
The significant commercial success of Tesla’s products in premium markets does not ensure
that PEVs will soon penetrate the large-volume affordable segments of the California
market [58]. By affordable, we mean buyers looking for a new vehicle that costs less than
USD 40,000, the median transaction price for a new passenger vehicle in the US in 2020 [61].
Nissan and Chevrolet have made the most concerted efforts to penetrate California’s
mainstream vehicle market [5] (pp. 413–422, 452–455). The affordable Nissan Leaf has
struggled for commercial success in California, despite almost a decade of focused mar-
keting in the state, eligibility for a USD 7500 federal tax credit, access to HOV lanes, and a
second-generation model with longer driving range. Chevrolet began with the affordable
Volt, a PHEV, but it was terminated in early 2019 due to poor sales volume. The Chevrolet
Bolt, now in its second generation, is an affordable BEV but its California sales volume is
limited (8230 in 2020); with assistance from aggressive manufacturer discounts, Bolt sales
in California (2839) increased in the first quarter of 2021 [62]. The other affordable PEVs
offered by global automakers (e.g., the Fiat 500e, the Toyota Prius Prime, the Mitsubishi
Outlander PHEV, the BMW MINI Electric Hardtop, the Hyundai Ioniq Electric, the Kia
Niro PHEV, the Honda Clarity PHEV, and the Volkswagen ID.4) are not selling in California
as well as they are selling in Europe [5] (pp. 61–62).
Preliminary data for the first quarter of 2021 show that California’s PEV share continue
to increase (10.8%), now above 10% for the first time. Much of the increase is attributable
to expanded sales of the Tesla Model Y, a premium crossover priced at USD 53,190 (Long
Range model), rather than greater PEV penetration by affordable models. Several premium
models offered by Tesla’s competitors (the Ford Mustang Mach-E, the Porsche Taycan, and
Jaguar I-PACE) are also attracting interest [63].Future Transp. 2021, 1 313
On the supply side, if automakers want to sell vehicles in California, they must comply
with the State’s zero emission vehicle (ZEV) mandate [5] (pp. 348–349, 458–459). They
must sell enough PEVs, or purchase credits from other automakers that sell more than
the required number of PEVs. In recent years, Tesla has earned large volumes of credits
and sold them to Honda, Chrysler and other companies with few PEV offerings [64].
California’s current ZEV mandate was first issued in 2011 and reaffirmed in 2017 [65]. It
was intended to accomplish a PEV penetration rate of up to 15% by 2025, yet California
regulators have recently announced bold plans to achieve 60% PEV penetration by 2030
and 100% by 2035 [66].
On the demand side, California employs several policies: consumer rebates for PEVs,
high gasoline taxes, low carbon fuel credits for PEVs, access to carpool lanes for PEV
owners, and subsidies for charging stations.
California’s 2019 consumer rebate was USD 2000 for BEVs and USD 1000 for PHEVs
(except low-income consumers are eligible for even larger rebates) [67]. The California
rebate supplements the US consumer tax credit of USD 7500 for a qualified PEV purchase.
The federal credit expires when a company sells 200,000 PEVs, a threshold that Tesla and
GM surpassed before other automakers.
California has adopted the largest gasoline taxes in the country, causing fuel prices
to average USD 4.14 per gallon in October 2019, much larger than the national average
of USD 2.65 per gallon. Other factors that contribute to higher fuel prices in California
are stringent fuel-quality standards and occasional outages at West Coast refineries. The
high fuel prices offset one of the few PEV disadvantages in California’s: high electricity
prices (USD 0.21 per kWh, residential, April 2021) that have been increasing steadily in
recent years.
California has adopted a relatively new program to encourage sales of PEVs through
the state’s low-carbon fuel standard (LCFS). The standard’s primary purpose is to en-
courage biofuels, but electric utilities can generate compliance credits if they produce
low-carbon electricity for use by PEV owners. Utilities are expected to share some of the
credits with PEV purchasers through a point-of-sale rebate. In November 2020 CARB and
the state’s electric utilities offered a new USD 1500 point-of-sale rebate for PEV buyers, on
top of the long-standing CVRP rebate [68]. Those rebates ranged from USD 200 to USD 599
in 2017 but are expected to gradually increase between now and 2030 [69].
Since California freeways are heavily traveled, access to the less-congested carpool
lanes is highly desired by motorists. In 2013, California withdrew HEV access to carpool
lanes, reserving the privilege for PEVs and FCVs (fuel cell vehicles). It is estimated that
25% of the PEV sales in California are buyers seeking access to carpool lanes [70].
On charging infrastructure, the California Energy Commission has authorized utilities
to expend almost USD 1 billion on a buildout of the state’s network of public charging sta-
tions. The program is financed by a general rate increase on users of electricity throughout
the state [71].
In summary, California has promoted PEVs with multiple policies since 1990. Mean-
ingful progress did not occur until after 2010, when lithium-ion battery technology spilled
over from consumer electronics to automobiles. Tesla is the dominant seller of PEVs in
California, but other startups and established automakers are now contesting Tesla with
competitive offerings. In 2020 the PEV penetration rate in California was 8.1%, about
four times larger than the national average and far ahead of any of the other 49 states.
The pro-PEV policies of the Obama administration from 2009 to 2016 provided tailwinds;
anti-PEV policies by the Trump administration created headwinds from 2017–2020. It is
not entirely clear how California intends to persuade 60% of consumers to purchase PEVs
by 2030 but the Biden administration is likely to assist California where they have the legal
authority and resources to do so.Future Transp. 2021, 1 314
4.3. Germany
German automakers and the Merkel government showed limited interest in PEVs
until the Volkswagen emissions-cheating scandal broke in 2015. As early as 2007, BMW
boasted a long-term R&D program to bring a new line of PEVs to the megacities of the
world but did not make dramatic progress on commercialization (the i3 was one of the few
successful first-generation PEVs) [72]. Prior to 2015, Daimler and Volkswagen offered some
low-volume PEVs but without serious plans for mass commercialization [73].
The Merkel government set national goals for PEV penetration starting in 2009 but did
not back those goals with the aggressive policies adopted in Norway and California [74].
The Merkel team was concerned about poor urban air quality (especially NO2 ), GHG
emissions, and energy insecurity. They were also concerned that the German auto industry
might underestimate the threat posed by advances in lithium-ion battery technology.
Despite the concerns, the Merkel administration from 1998 to 2015 joined with other auto-
producing countries in Europe to moderate the European Commission’s CO2 regulatory
agenda, ensuring that German automakers could meet CO2 standards with diesels. The
Merkel government also touted hydrogen fuel cell electric vehicles as a more promising
long-run technology than PEVs based on lithium-ion batteries; the European Commission
followed Germany’s lead with more R&D on hydrogen than lithium-ion batteries [75].
Volkswagen’s direct-injection diesel engine was so commercially successful in Europe
that the company prepared an ambitious plan to bring the technology to the US market,
where consumers had rejected GM’s clumsy diesels in the 1980s. VW saw the diesel
as a superior alternative to the hybrid electric vehicle that Toyota championed with the
Toyota Prius. Additionally, VW proved in Europe that the diesel could outsell HEVs [5]
(pp. 329–353).
There was a simple flaw in the VW plan: EPA and California refused to give the
compliance break on NOx emissions that was provided to diesel-engine suppliers in
Europe and Japan. Despite intense pressure from upper management, VW’s creative
engineers could not devise a technology to meet California NOx standards (which were
slightly more demanding than US EPA standards).
Volkswagen decided to cheat rather than comply [76]. Software was written that
turned off the VW emissions controls unless the vehicle was undergoing laboratory testing
on a chassis dynamometer. During a short test, the VW lean NOx trap worked fine but
it was not durable and effective in continuous use. Incredibly, the VW diesels were sold
worldwide for almost ten years with NOx emissions in real-world driving conditions
10–40 times the amounts permitted by applicable standards.
The cheating was ultimately detected but not by the German government or the
European Commission. The key comparison of laboratory and real-world testing was done
by a team of engineers at West Virginia University operating under contract to John German
and colleagues at the International Council on Clean Transportation [5] (pp. 322–360). ICCT
published the results and shared them with VW, CARB and EPA. CARB and EPA verified
the results and then confronted VW. VW admitted to the presence of the illegal software on
3 September 2015; VW CEO Martin Winterkorn resigned on 23 September 2015 but denied
knowledge of the cheating.
“Dieselgate” provided an enormous, unexpected boost to the nascent global PEV
industry. The VW Group, the world’s largest automaker, flip-flopped its product planning
to favor PEVs instead of diesels. In the US, the legal settlement required VW to build USD
2.7 billion in charging infrastructure throughout the country. BMW and Daimler, caught
by the ripple effects of Dieselgate, moved to make expanded offerings of PEVs but in a
more nuanced way than VW. Angela Merkel, angered by the scandal, called a summit of
stakeholders, and announced a new suite of pro-PEV policies. The European Commission,
no longer constrained to protect diesel technology, adopted much stricter post-2021 CO2
standards that could not be met without significant PEV penetration in Europe [77]. The
Commission did not adopt a ZEV-style mandate like California or China, but did include
some compliance incentives for automakers that sell large volumes of PEVs. In the publicFuture Transp. 2021, 1 315
furor over Dieselgate, some politicians began to utter the unthinkable: a ban on the internal
combustion engine [78].
The regulatory pressure from the European Commission is important but the size
and duration of the German purchase incentives for PEVs should not be overlooked.
The Merkel government started in 2016 with a PEV purchase incentive of 3000 euros for
BEVs, 2000 euros for PHEVs. The German incentives do not apply to cars priced above
60,000 euros; they are explicitly aimed at mass commercialization of affordable PEVs. Funds
were also authorized to electrify 20% of the government vehicle fleet. When consumer
interest did not pick up quickly, the purchase incentives were doubled starting 2020 and
extended to 2025. The Value Added Tax on car purchases was reduced from 19% to 16%
for 2020, which clips another 1,000 euros off the purchase cost of an affordable PEV [5]
(pp. 34–64). Additionally, the tax on company cars, a big source of sales in Germany, was
curbed if the car is a PEV.
The Merkel administration also focused on charging infrastructure. From 2017 to 2020,
investments in fast-charging and slow-charging infrastructure were 200 million euros and
100 million euros, respectively. The infrastructure packaged was enlarged in 2020. About
USD 2.5 billion was made available, with a goal of increasing the number of charging
stations from 28,000 in 2020 to 1 million in 2030 [79].
A major challenge for Germany and the European Commission is to resolve the
commercial future of the PHEV technology. General Motors, Mitsubishi, Toyota and
Renault pioneered PHEV offerings, but German companies have become major sellers of
PHEVs in Europe. In the German market, for example, the PEV share in December 2020
was 26.6%, split almost evenly between PHEVs and BEVs [80]. Globally, the PHEV share of
PEV sales is much smaller, less than 20% [81]. Companies with especially high PHEV/BEV
ratios in Germany (2020) are Mercedes Benz, Audi, BMW, SEAT, Skoda, Volvo and Kia.
The PHEV design is appealing to consumers because it neutralizes several disadvan-
tages of BEVs [3]. The total driving range of a PHEV equals or exceeds the total driving
range of a comparable gasoline-powered vehicle. Table 5 presents the all-electric ranges
and total driving ranges of a selection of prominent PHEV models. The typical gasoline
powered vehicle will make it 300–400 miles before a refueling stop is required, but some
popular SUVs and pickup trucks with large fuel tanks can travel 500–700 miles on a tank
of gasoline [5]. Moreover, if a PHEV owner does not have time to wait while a depleted
battery pack is charged, he or she can instead refuel the gasoline tank in 5 min. In the
early stages of PEV commercialization, when the public charging network is not yet fully
developed, the PHEV has a notable advantage: It protects the owner from the “range
anxiety” that BEV owners experience.
Table 5. The All-Electric and Total Driving Ranges of Selected PHEVs [82].
Model All-Electric Range (Miles) Total Range (Miles)
Chevrolet Volt (2016) 53 420
BYD Tang PHEV (2021) 69 652
Toyota RAV4 Prime (2021) 42 600
Chevrolet Volt (2014) 38 380
Volkswagen Passat GTE PHEV (2021) 34 650
Ford Escape PHEV (2021) 37 520
Toyota Prius Prime (2021) 25 640
Mitsubishi Outlander PHEV (2021) 24 320
Range Rover Sport PHEV (2021) 19 480
Toyota Prius PHEV (2015) 11 540
The environmental advantages of the PHEV may not be nearly as large as the European
Commission compliance values suggest. The Commission’s compliance values are based
on laboratory tests and engineering judgment, not the actual, real-world behavior of PHEVFuture Transp. 2021, 1 316
owners and their drivers. If a battery pack of a PHEV is never charged, then its fuel
consumption and CO2 emissions will be like a conventional vehicle with a similar gasoline
engine. In a study of the real-world use of 100,000 PHEVs in China, Europe and North
America, the investigators found that average fuel consumption and CO2 emissions were
two to four times larger than the compliance values approved in the European Union [83].
The share of real-world driving that is electric was about half as large as the value assumed
by the European Union in compliance values. The compliance gap was especially large
for PHEVs sold in Germany, the Netherlands and China, where subsidies for PHEVs
have been generous. The study points to three strategies to address the compliance gap:
reduce the power of gasoline engines, increase the all-electric range of PHEVs, and increase
the frequency of charging by owners. Some environmental groups are urging an end to
subsidies for PHEVs and stricter EU regulation of PHEV design [84]. The most recent
Commission proposal for 2030 does not call for any change in how PHEVs are treated
in compliance calculations, but the Commission recognizes that the real-world data on
PHEVs must be monitored carefully in the future. The Commission is considering a
complete phaseout of conventional engines by 2040, which—absent some exemption—
would terminate the commercial future of PHEVs [85].
The cumulative effect of the European CO2 standards, the new pro-PEV positioning
of German automakers, and the new pro-PEV subsidies has been explosive in Germany.
In 2015 the PEV share of the new vehicle market in Germany was slightly less than 1%.
In 2020 it was 13.5%, with most of the increase occurring in 2020. A distinctive feature of
the German market is that plug-in hybrid electric vehicles (PHEVs) have captured almost
half of the PEV market, a much higher PHEV share than seen in Norway, California or
China [86]. Overall, Germany has accomplished more PEV penetration in a few years
than California did in 30 years; in 2020 Germany also outpaced China’s fast start in
PEV penetration.
4.4. China
In China the environmental rationales for PEVs are secondary compared to the
industrial-policy and energy-security rationales. In fact, China was already developing its
plans for PEVs (2004–2012) before the central government demonstrated seriousness about
the problems of poor urban air quality and China’s contribution to [82]. Indeed, PEVs in
China are much more effective at reducing oil consumption than reducing air pollution,
since when PEVs access the grid they contribute to air pollution at China’s numerous
coal-fired powerplants [87].
For decades Chinese central planners envisioned a globally competitive auto industry
that could sell vehicles and parts around the world [88]. They were openly envious of what
GM did for the US, Toyota for Japan, and Volkswagen for Germany.
The original industrial strategy was joint ventures between China’s state-owned
automakers and foreign automakers. The theory was that Chinese auto companies would
learn about advanced technologies through the joint ventures and become more competitive
manufacturing enterprises. Once dominated by Russian, Japanese and other foreign
automakers, Chinese automakers have gradually gained market share in China’s large and
growing domestic market. However, Chinese planners remain disappointed that Chinese
companies cannot compete globally with gasoline and diesel engines. A strategic decision
was made gradually from 2010 to 2015 to “leapfrog” the internal combustion engine and
become a global leader in PEVs and the supply chains that support PEVs [89].
Security planners in China also voiced grave concerns about dependence on petrol-
based vehicles [5] (pp. 443–445). China became a net importer of oil in 1993. Due to its
booming economy, in 2017 China became the largest importer of oil in the world [90].
China’s oil-import share is projected to rise from 70.9% in 2018 to 80% in 2030, unless
policies are changed. China’s oil imports come largely from the politically volatile Mideast.
Despite rapid improvements in China’s Navy, security planners concluded that the
country could not reliably defend the long sea lanes (about 3557 nautical miles) fromFuture Transp. 2021, 1 317
Kuwait in the Persian Gulf through the Indiana Ocean to the South China Sea and China’s
prosperous eastern cities [91]. Of particular concern was the potentially hostile US Navy
in war-time scenarios. Even if the US Navy could not interdict, it could harass the oil
transports and reduce the rate of supplies that reach China.
Security planners became interested in PEVs because China has plenty of coal and
can produce it cheaply to support electricity production. In an October 2019 public speech
to energy policy makers, China’s Premier Li Keqiang underscored that development of
China’s coal industry is critical to the country’s energy security [92].
To guide a possible transition to PEVs, China in 2009 selected ten cities that each
pledged to put 1000 PEVs into operation within three years (2010–2013) [93]. The central
government pledged USD 8800 of subsidy for each PEV purchased for government use,
while provinces and municipalities supplemented with additional resources. The cities
tried different methods of promoting PEVs. In 2010 a separate pilot in five cities provided
a similar subsidy to private purchasers of PEVs. In 2012 the program was expanded to
25 cities, with lessons from the initial cities shared with all 25. Evaluations of the city
demonstrations were mixed but uncovered three key insights: cities that denied inner-city
access to non-PEV vehicles were more successful in finding willing PEV users; purchase
incentives were important; and public charging was especially critical for private buyers
because most Chinese live in high-rise apartments and lack a private garage where they
can charge their PEV at night.
From 2013 to 2015, the central government extended the purchase subsidies nation-
wide but varied the size of the subsidy depending on vehicle design characteristics (USD
5656 to USD 9695 per vehicle) [94]. The subsidies are quite large relative to the typical
prices of new small cars in China, which can be as low as USD 5000. The practical effect
of the subsidy policies was to reduce the average prices of a BEV and PHEV by 50% and
25%, respectively. Chinese automakers, both startups and established automakers, raced to
expand production of PEVs. Foreign automakers complained that they could not access
the subsidies unless they assembled the vehicle in China through a joint venture. Tesla was
not simply ineligible for subsidies; it faced a 25% Chinese tariff when it tried to export the
Model 3 from the US to China [95]. Tesla now avoids the tariff with its huge new assembly
plant outside Shanghai.
The leaders of China’s six large eastern cities boosted PEV sales with licensing/registration
policies. These cities were already curbing the number of cars with access to the inner-city
to reduce congestion and lessen air-quality problems. Some cities were auctioning off
vehicle licenses to the highest bidder; others used lottery systems [96]. In early 2020, for
example, 3.3 million Beijing residents applied for city license plates but only 6300 appli-
cants were selected monthly, a selection rate of 0.2%. Even if an applicant is selected, they
then need to pay a registration fee that ranges from USD 4000 in Tianjin to USD 12,000 in
Shanghai. To give PEVs a big boost, six cities exempted owners of PEVs from the inner-city
access restrictions and the vehicle registration fee. Since auto ownership opens numerous
employment opportunities in Chinese cities, the PEV exemptions were a potent stimulus
to PEV sales. In 2017 alone, 21% of all PEV purchases in the world occurred in six Chinese
cities, all which restricted vehicle use in the city unless it was a PEV [97]. The restrictions
were eased temporarily during the COVID pandemic, but city planners are now adjusting
the ratios of PEV and non-PEV licenses to achieve the desired mix of vehicles.
The major challenge for China is to make PEVs a practical technology for high-rise
urban apartment dwellers that have no place at home to charge a PEV. One strategy is
to rely on the network of public charging stations but, while useful as a supplement to
home and workplace charging, public charging is not attractive as a primary source of
daily charging. Public charging takes too long (even at a Level 2 or Level 3 charger) and
the PEV owner is vulnerable to unpredictable waiting times at public stations. Moreover,
the price of electricity at public charging stations is typically set at commercial rates that
are much higher than residential rates.You can also read