TERTIARY STUDENTS' PUBLIC TRANSPORT SAFETY IN MELBOURNE, AUSTRALIA - PART OF A 17-CITY INTERNATIONAL STUDY
←
→
Page content transcription
If your browser does not render page correctly, please read the page content below
TERTIARY STUDENTS’
                                             PUBLIC TRANSPORT
                                             SAFETY IN MELBOURNE,
                                             AUSTRALIA

                                             PART OF A 17-CITY INTERNATIONAL STUDY

                                             CAROLYN WHITZMAN
                                             REWA MARATHE
                                             JASON THOMPSON

                                             TRANSPORT, HEALTH AND URBAN DESIGN RESEARCH HUB
                                             FACULTY OF ARCHITECTURE, BUILDING AND PLANNING
                                             JANUARY 2019

TERTIARY STUDENTS’ PUBLIC TRANSPORT SAFETY
IN MELBOURNE, AUSTRALIA
                                                                           TRANSPORT, HEALTH AND URBAN
                                                                                  DESIGN RESEARCH HUB    1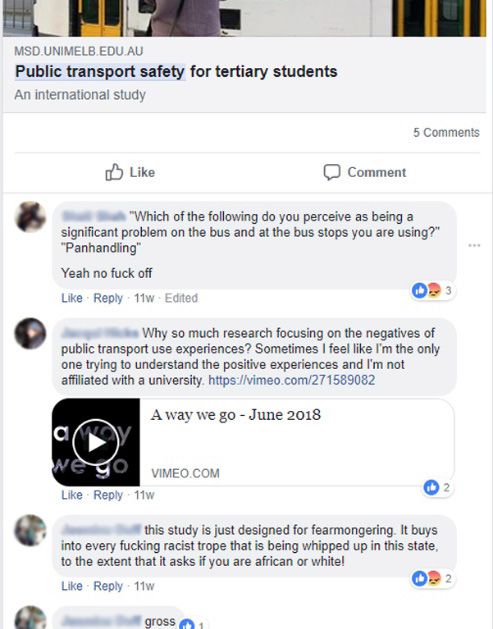
SUMMARY

    This report summarizes the results of a survey of 517 tertiary students in Greater Melbourne on public
    transport safety undertaken from April to June 2018. The Melbourne survey was part of a 17-city
    international study on this topic.

    In line with other recent research in this area, we found extremely high rates of victimisation in relation to
    public transport. Almost four fifths (79.4%) of female students surveyed and an equivalent proportion
    of LGBTI+ students, said that they had been the victims of unwanted sexual gestures, comments,
    advances, exposed genitals, groping, or being followed on public transport over the previous three
    years. Over half (51.7%) of men reported having been victimised.

    Only 5.7% of those who had been victimised reported this to anyone in authority. This is hardly
    surprising. The public safety messages from police, transport authorities, and tertiary educational
    institutions do not encourage reporting incidents, instead providing information that emphasises the
    responsibility of potential victims to protect themselves.

    A large proportion of female students report a climate of fear on public transport. A little less than half
    (45.1%) of female students report feeling ‘rarely’ or ‘never’ safe on public transport after dark, as compared
    to 11.3% of men. A similar proportion of women (58.9%) say they use a plethora of behaviours (from
    avoiding certain lines and stops, to ensuring they are met at a stop, to constant alertness) to mitigate their
    risk of victimisation. A little less than half (45.4%) of female students report fear of victimisation as a reason
    keeping them from using public transport.

    While concerns around infrequent, unreliable, poorly coordinated, and overcrowded services were seen as
    bigger concerns than safety by all users, women were less likely to use all modes and more likely to drive cars
    and use ridesharing services than men, at least partially because of night time concerns.

    The report concludes with recommendations that put the onus on public transport authorities and
    providers, police, and tertiary educational institutions to embark on a coordinated campaign to encourage
    reporting of offences and prosecution of offenders.

2   TERTIARY STUDENTS’ PUBLIC TRANSPORT SAFETY
    IN MELBOURNE, AUSTRALIA
                                                                                            TRANSPORT, HEALTH AND URBAN
                                                                                                   DESIGN RESEARCH HUB
TABLE OF CONTENTS

1. Introduction                                                                                4
        a. The Research: Tertiary students’ safety on public transport                         4
        b. The Melbourne Context: An increasingly international ‘knowledge city’               5
            highly economically dependent on tertiary students
        c. Public Transport Provision in Greater Melbourne: A tale of two cities               7
        d. Public Transport Governance: Who is in charge of safety?                            8

2. Tertiary students’ safety on public transport: an intersectional approach                   11
        a. International Research                                                              11
        b. Previous Australian and Melbourne research                                          12

3. Results – Use of Public and Private Transport                                               15
        a. Methods                                                                             15
        b. Gender, Sexuality, ‘Race’ and Age of Respondents                                    16
        c. Location of Respondents’ Homes, Commuting Times and Modal Choice                    18

4. Results – Results: Experiences of Crime, Harassment and Fear                                22
        a. Experiences of Victimization                                                        22
        b. Reporting Assault and Harassment                                                    24
        c. Fear and Avoidance                                                                  26
        d. Safety and Transport Mode Choice                                                    28
        e. Respondents’ Recommendations for Improvement                                        29

5. Discussion and Recommendations                                                              30
        a. Rates of self-reported victimisation and fear experienced by
            tertiary students                                                                  30
        b. The Influences of gender, sexuality and ethnicity                                   31
        c. Consequences of Victimization and Fear                                              31
        d. Whose problem is it and what are the solutions?                                     32

TERTIARY STUDENTS’ PUBLIC TRANSPORT SAFETY
IN MELBOURNE, AUSTRALIA
                                                                                   TRANSPORT, HEALTH AND URBAN
                                                                                          DESIGN RESEARCH HUB    3
1
INTRODUCTION
THE RESEARCH: TERTIARY STUDENTS’ SAFETY ON PUBLIC TRANSPORT
In June 2018, the worst-case scenario for women using public transport happened in Melbourne. Eurydice
Dixon, a 23-year-old woman, took a tram home at 11 pm from performing stand-up comedy in downtown
Melbourne. She was walking from the tram to her home, through a well-used park just north of the central
city, when the young man who had allegedly stalked her after her performance (Smith 2018) is alleged to have
raped and murdered her. In January 2019, a similar worst-case scenario occurred, when another young man
is alleged to have raped and murdered Aiia Maasarwe, a 21-year-old Palestinian-Israeli exchange student, 100
metres from the tram she took home from downtown Melbourne (ABC News, 2019).
The immediate response from the police after the murder of Eurydice Dixon was to put the onus on potential
victims. “Make sure you have situational awareness. Be aware of your own personal safety. If you’ve got a
mobile phone, carry it; if you’ve got any concerns, call the police,” they said in a public announcement to
other women (Eurydice Dixon was allegedly carrying a phone and her last text told her boyfriend that she was
nearly home). Similarly, Aiia Maasarwe was also allegedly on her phone to her sister as she was attacked. As
Sally Rugg, the Executive Director of Change.org pointed out, these messages “suggest that the police can’t
stop men from raping people, so it’s up to the women to take precautions, which is insulting to men, unhelpful
and untrue.” (Smith 2018). Many women pointed out that despite intimate partner violence being more
common than victimization by a stranger, everyday harassment by men creates a climate of fear in public
space. Women constantly police themselves to avoid being blamed for male violence, by authorities who
are supposed to support their safety. The continuum between ‘everyday’ misogynist behaviour and violence
was further underlined when the site of Eurydice Dixon’s death was vandalised just before a vigil held in her
memory the following week, and abusive messages left on the Facebook page of the organizers (Alcorn 2018).
Mobility, as freedom of movement, is a human right. The legal emphasis in the past has been the ability to
move from one jurisdiction to another rather than on intra-city commuting (UN 1948: right 13, Blomley 1994),
but there is increasing interest in a rights-based approach to mobility within the city (Urry 2016, Sheller 2016,
Coggin and Pieterse 2016). Security of the person is also upheld by the UN Declaration of Human Rights
(1948: right 3). The ability to travel freely within a city, without risk of bodily harm, is necessary to develop
educational and economic capabilities, and experiencing a sense of control over one’s environment is essential
for full development of wellbeing (Nussbaum 2011). However, the unequal politics of mobility often affects
speed, mode, safety, and comfort of journeys, with intersectional aspects of gender, age, ethnicity, sexual
orientation, income, and abilities affecting use and experience of urban transport (Cresswell 2010; Whitzman,
2013, Ceccato 2013, Loukaitou-Sideris, 2015).
This report analyses the responses of 517 tertiary students in Melbourne, Australia, to a survey on experiences
and perceptions of crime on public transport undertaken April-June 2018. It is part of a 17-city global
victimisation study, the first cross-cultural study to focus on college students’ experiences of gender,
crime and mobility.
4 TERTIARY STUDENTS’ PUBLIC TRANSPORT SAFETY
IN MELBOURNE, AUSTRALIA
TRANSPORT, HEALTH AND URBAN
DESIGN RESEARCH HUBThe Melbourne report focuses on four research questions:
1. What are rates of self-reported victimization and fear experienced by tertiary students in Greater
Melbourne?
2. How do gender, ethnicity and sexuality identities intersect to influence use and experience of transport?
3. How does victimisation and fear affect transport use?
4. In a governance context where public transport is privately provided by international companies with
loose state government steering (Stone 2014), where university students have reported the journey
between home and study to be riddled with experiences of violence and harassment (AHRC, 2017) and
where tertiary education is economically essential to the remaking of Melbourne as a ‘knowledge city’
(Yigitcanlar O’Connor and Westerman 2008), whose responsibility is it to improve safety on public
transport?
THE MELBOURNE CONTEXT: AN INCREASINGLY INTERNATIONAL ‘KNOWLEDGE CITY’ HIGHLY
ECONOMICALLY DEPENDENT ON TERTIARY STUDENTS
As of the 2016 Census, Greater Melbourne had a population of 4.7 million, comprising over 85% of the
population of the state in which it is situated, Victoria (ABS 2017). Melbourne is the second most populous city
in Australia, which has a total population of 24.2 million. With an annual growth rate of over 2% in the past
decade, Melbourne is projected to overtake Sydney as Australia’s most populous city within the next 10 years
(Bagshaw 2017). Greater Melbourne is a highly spatially dispersed metropolis, with a geographic area of over
2500 square kilometres extending between 35 and 55 kilometres from the central city to the west, north and
southeast (Hancock and Nuttman 2014: 64).
Melbourne’s economy is highly dependent on higher education, as part of a larger ‘knowledge city’ strategy
that has been supported by all three levels of government since the decline of the traditional manufacturing
sector in Greater Melbourne during the 1980s and early 1990s (Yidgitcanlar, O’Connor and Westerman 2008).
Like other ‘knowledge city’ strategies in Barcelona, Stockholm and Dublin, policies focus on clustering
institutions, promoting culture and liveability, and supporting diversity and social inclusion. The aims of
these policies are to support employment in Information and Communications Technologies (ICT), cultural
industries, and medical research, as well as education. Providing and improving these elements has been a
crucial part of the 2002 Metropolitan Melbourne planning strategy (Yidgitcanlar, O’Connor and Westerman
2008) as well as its successor, Plan Melbourne (Victorian State Government 2017), with sub-regional
employment centres associated with suburban university-hospital clusters. In the 2014 state election, the
successful candidate for Premier promised to change Victoria’s license plates to read ‘The Education State’,
reflecting “a rock-solid foundation for our economic future” (Davey 2014).
Much of Melbourne’s recent population growth has been fuelled by tertiary students, especially international
students. As of the 2016 census, there were over 1.4 million university students in the country, with 26%, or
TERTIARY STUDENTS’ PUBLIC TRANSPORT SAFETY
IN MELBOURNE, AUSTRALIA
TRANSPORT, HEALTH AND URBAN
DESIGN RESEARCH HUB 5almost 400,000, being international students. Over a third of these students are from China, with a further 25%
from South-East Asia and 15% from South Asia (Universities Australia 2018). Greater Melbourne contains all
three of Australia’s largest universities in Melbourne - Monash, with 60,000 students, University of Melbourne,
with 48,000 students, and RMIT University with 47,000 students (Australian Government 2017). The State of
Victoria’s GDP from international students alone was $9.1 billion dollars in 2016 (Universities Australia 2018). In
2002, Melbourne had the fourth largest population of international students in the world – after London, New
York, and Los Angeles (Yidgitcanlar, O’Connor and Westerman 2008: 67) and the Times Higher Education section
recently ranked Melbourne as the third most popular city in terms of enquiries about student accommodation,
after London and Sydney (Minsky 2016).
Tertiary students are, to some extent, the vanguard of a changing demography of Melbourne and Australia
in “the Asian century” (Rizvi 2017). While the Australian census focuses on country of origin and parents’
country of origin, a broader definition of those self-identifying as Asian-Australian used by the Diversity Council
suggests that 17% of the population are now of Asian origin. The Chinese-origin community is over 1.2 million
people in Australia, and Indian-origin Australians number over 650,000. Between 2006 and 2011, businesses
owned by Chinese-origin Australians increased by 40% and businesses owned by Indian-origin Australians
increased by 72%. Most of these businesses are small to medium sized enterprises, driving new developments
in international education, tourism, professional and technical services, the creative industries, and the retail
trade of cultural goods (Rizvi 2017: 113-114).
In 2016, the innermost of 32 municipalities in Greater Melbourne, the City of Melbourne, had 227,000 students
living and/or studying within the municipality, with 45,000 students calling the central city home. A third of
these students are international fee-paying students (City of Melbourne 2016: 4). Within a population of a little
under 150,000 in 2016, this meant that a little less than a third of central city residents are tertiary students,
many of whom live in purpose-built student apartment complexes. Student housing is generally privately
provided, in close proximity to the two universities with the largest central city campuses, Melbourne and RMIT,
and is very high priced: $400/week for a 15 square metre apartment not much larger than a car parking space
(Dow, 2016). The predominance of international students in these purpose-built apartments is partly explained
by the Australian tradition of students going to university in their hometown, and thus often living with their
parents during the university years. International student placement agents in home countries also are known
to advise that much of Melbourne, including its public transport system, is unsafe and that it is difficult to find
housing other than in these apartments (Fincher and Shaw 2009).
Higher education is the sixth biggest employer in Victoria. Eight percent of Victoria’s paid workforce, or 23,555
people in 2010, worked in the higher education sector. But this is only one aspect of the economic impact
of tertiary education. Tertiary students are both purchasers and part-time staff in the retail and hospitality
industry, and transport, housing, and entertainment offerings are also strongly influenced by tertiary students’
needs and preferences (City of Melbourne 2012: 10). Australia’s 43 universities had almost $28 billion in total
revenue in 2014, with about 120 non-university tertiary sector organisations bringing in a much smaller $1.6
billion in revenue. International students alone provide $5.7 billion in annual revenue, in part due to high
overseas student fees (Norton 2016: 41).
6 TERTIARY STUDENTS’ PUBLIC TRANSPORT SAFETY
IN MELBOURNE, AUSTRALIA
TRANSPORT, HEALTH AND URBAN
DESIGN RESEARCH HUBPUBLIC TRANSPORT PROVISION IN GREATER MELBOURNE: A TALE OF TWO CITIES
In Australia, the Bureau of Statistics captures journey to study within its journey to work data. Greater
Melbourne shows similar trends to other large Australian cities in journey to work, with continuing heavy
reliance on private vehicles and longer commuting distances than other OECD countries. Almost three quarters
(74%) of commuting journeys are by car, with an average commuting distance of 18.6 kilometres. Only 18%
of commuting journeys are by public transport, and 6% are via walking or cycling. Despite attempts to create
more education-related employment near suburban housing, and more housing near education employment
centres in two metropolitan planning strategies, self-containment (that is, living near one’s workplace) has
not changed since the 2011 census (ABS 2018). There are strong preferences shown in Melbourne between
public transport modes. In 2014, there were 225 million journeys by train, 183 million journeys by tram and 118
million journeys by bus in Greater Melbourne (BITRE 2014).
Unlike the US and Europe, almost 90% of Australian born students attend a tertiary institution in their
home city. Over 35% of tertiary students live with their families during their tertiary education, with smaller
proportions living with a partner (26%), living in a group household (15%), living alone (5%) and living in a hall
of residence (3%) (ABS 2013).
There are nine universities with campuses in Greater Melbourne: Melbourne, RMIT, Swinburne, Federation,
Australian Catholic, Victoria, Latrobe, Deakin, and Monash. Four of these universities (Swinburne, RMIT,
Victoria, Federation) also offer Technical and Further Education (TAFE) courses, the equivalent of community
colleges in North America. There are six further TAFE-only institutions: William Angliss, Melbourne Polytechnic,
Box Hill, Kangan, Chisholm, and Holmesglen. With 18 tertiary institutions located throughout Greater
Melbourne, several with multiple campuses, public transportation to tertiary education is an issue that touches
on social equity, environmental sustainability and economic productivity.
The current situation in most tertiary institutions is one of car dependence. For instance, in the largest campus
of Deakin University, in the middle suburb of Burwood, 61% of students and staff drove alone to work in 2012
(Hancock and Nuttman 2014). Conditions in the peripheral suburbs of Melbourne are far worse, with 50%
of these areas having ‘very low’ or ‘low’ public transport frequency. Yet they have very high needs for public
transport in terms of proportion of adults without cars, including many tertiary students – a concept called
‘transport disadvantage’ (Currie 2010: 34). Mahmoud and Currie (2010), in relation to transport safety research
with young people based at suburban Monash University, argue that students living in middle and outer
Melbourne tend to be more dependent on public transport and are more likely to travel in the evenings than
other residents, two risk factors for victimisation and fear.
The picture emerges, as is often the case, of ‘two Melbournes’. In central Melbourne, some local students
live with parents, but most international and many local students live in small, expensive and sometimes
overcrowded accommodation. However, these students are in walking or short public transport distance to
a suite of campuses in the central city and inner suburbs. Melbourne and RMIT are the largest central city
universities, but there are also central city campuses of William Angliss TAFE, Federation, Australian Catholic,
Victoria and Monash Universities. Middle and outer suburban Melbourne has a suite of campuses scattered
and often poorly served by public transport: Monash’s largest campus, Deakin, Latrobe, Swinburne, and most
of the TAFEs. Many local students continue to live with their families (out of choice or because they are locked
out of the expensive rental market), while other local and international students live in shared accommodation
(including unlicensed rooming houses), with much more limited transport options. Whether in central city
purpose-built student housing or suburban shared housing, international students often complain of being
segregated from local students and being treated as ‘outsiders’ to Australia (Fincher and Shaw 2009).
TERTIARY STUDENTS’ PUBLIC TRANSPORT SAFETY
IN MELBOURNE, AUSTRALIA
TRANSPORT, HEALTH AND URBAN
DESIGN RESEARCH HUB 7PUBLIC TRANSPORT GOVERNANCE: WHO IS RESPONSIBLE FOR TRANSPORT SAFETY?
Over a century, from European colonialization to the 1920s, Melbourne built up one of the most extensive tram
and train networks in the world. However, in the second half of the 20th century, Melbourne’s public transport
use fell further and faster than any other city of the Global North, with the exception of Auckland, New Zealand.
The decline in public transport use was related to the development of more kilometres of urban freeways than
other cities in Australia (Stone 2014: 389-90).
Melbourne’s success in developing and managing both a public transport and a freeway network was due to a
strong metropolitan planning authority (the Metropolitan Melbourne Board of Works) from the 1880s onwards.
However, metropolitan governance was dismantled in favour of direct state government planning in the late
1980s. Under an ideologically driven neoliberal state government in the 1990s, trains, trams and bus networks
were separately sold off – the trains and trams to international conglomerates, and the buses to several local
companies. Independent transport policy expertise was lost, as the public transport agency took on the role of
a franchise regulator, instead of a direct provider (Stone 2014: 396).
There are currently 15 train lines along almost 1000 km of track run by Metro, a company majority owned by
Hong Kong-based MTR (Metro Trains 2018a). The 24 tram routes along 250 km of track, the most extensive tram
network in the world, are managed by Keolis, a French-based company (Yarra Trams 2018a, 2018b). There are
more than 300 bus routes in Melbourne, operated by three companies (PTV 2018a). Seven regional rail lines,
still operated by the State Government, also play their part in public transport in an increasingly dispersed
city-region (V/Line 2018). All public transport travel on metropolitan buses, trams and train lines incur the same
cost, $4.30 for a two hour unlimited transfer pass (zones have been phased out, with the exception of regional
rail), and all use the Myki smartcard ticketing system to automatically deduct that sum. There is free travel
within the central business district, an area of approximately two square kilometres.
The train and tram systems run from approximately 5 am to 1 am on weekdays. Buses tend to run infrequently
during the day (until 7-9 pm), and often not at all on weekends. On weekends, a Night Network was introduced
in 2016, and has since been expanded. It consists of trains running every 60 minutes, trams running every 30
minutes on six (of 24 total regular) lines, and 21 bus routes that run every 30 to 60 minutes (PTV 2018b).
Public Transport Victoria, the agency charged with managing the private contractors, provides ‘single
stop’ information on safety for public transport users. Its website (PTV 2018c) publicizes several different
mechanisms to keep passengers safe. From 6 pm until train services stop (usually between midnight and
1 am), there are at least two Protective Service Officers at 200 of the total of 321 metropolitan and regional
rail stations. They patrol the platforms, trains, and associated car parks, dealing with “anti-social behaviour,
property damage, alcohol and transport related offences as they arise”. Authorized Officers (usually known
as ‘ticket inspectors’) primarily check ticket validity on trains and trams, but are also trained to respond to
incidents. The tram, train and bus networks all have closed circuit television (CCTV) cameras. At metropolitan
train stations there are emergency assistance buttons on every platform and in train carriages, and emergency
buttons are also located on trams and buses. Some metropolitan train stations have yellow marked “safety
zones” that are well-lit, located near emergency assistance buttons and are in the line of sight for CCTV
cameras. In addition, a 2018 campaign focuses on cooperation between police officers and transport operators
(PTV 2018d). The underlying message of this information is that PTV treats safety seriously. However, there is
no information on this page on how to report incidents or who to contact about safety concerns on the system.
Metro Trains, the franchisee whose majority ownership is the Hong Kong-based MTR group, has its own page,
which focuses on ‘night safety’ instructions for train users. These include: boarding the first car on a train,
closest to the driver, if alone; trying to sit near other customers; checking timetables on the PTV application
before leaving home; and waiting in the yellow safety zones (Metro Trains 2018). There is no information on this
page on how to report incidents or who to contact about safety concerns.
The state government has an independent safety regulator, Transport Safety Victoria, whose mandate is to
license and accredit all transport operators (e.g. school and tourist buses as well as public transport), including
the provision of training for operators on how to respond to personal safety concerns (TSV 2018a). Once again,
there is no information on this page for how the public might report safety concerns.
8 TERTIARY STUDENTS’ PUBLIC TRANSPORT SAFETY
IN MELBOURNE, AUSTRALIA
TRANSPORT, HEALTH AND URBAN
DESIGN RESEARCH HUBThe Bus Association, an industry body representing bus operators in the state, has its own bus safety
information and a community nominated Favourite Bus Driver award. The award, last given in 2016,
commended drivers who provided safe spaces, as nominated by a school child and a person with a disability
(BAV 2016). This is an excellent initiative, but again the page does not tell bus users who to contact about
incidents or concerns.
The Victoria Police (2016) has additional and extensive safety instructions for tram and bus users, including
“observe the conditions and any persons around you” when boarding trams and buses, “portraying
confidence” in your body language, and being “friendly and confident” when talking to other passengers, but
not providing personal information. They suggest to passengers that if they are being harassed, they should
tell the person to stop in a loud and assertive voice, to report the person, to consider moving to another spot
nearer other passengers, and to trust their instincts. Again, despite recommendations to report the person,
they do not provide information as to how best to report incidents or concerns.
Crime Stoppers, a national non-profit crime prevention organisation, the Victoria Police and Public Transport
Victoria, launched a very short-lived (two week) campaign called ‘Hands Off’ in 2017 to “stamp out sexual
offending and bring those responsible to justice” (Crime Stoppers 2017). The program was criticised for
focusing on a small number of individual offenders, whose photographs were included on posters, and by
focusing on physical assault, when the range of harassing and coercive behaviours encountered is more
extensive (Fileborn 2017). Perhaps more importantly, a two-week campaign is hardly a comprehensive
response.
Almost every tertiary education institution has its own advice page for students. Monash University, for
example, has a series of short YouTube videos on personal safety, with subtitles in Chinese (simplified and
traditional), Indonesian and Malay. The “personal safety when out” video (Monash University, 2016) instructs
riders to let people know where you are going and when you will be back; plan public transport journeys
beforehand; immediately locate safety features in stations and vehicles; carry keys in your hand when you
alight from transport; walk with friends or a group if possible; choose clear and well-lit paths; be alert and avoid
texting and talking on your mobile phone; keep one ear free if listening to music; do not carry large amounts
of cash; walk away from confrontations; and move to well-lit areas and alerting authorities when feeling
threatened.
Study Melbourne (2018), the State Government website for prospective out of state and international students,
advertises a bewildering array of apps that alert friends and police if you are in trouble, or simply allow you to
be tracked. The onus is thus on riders as potential victims who must be constantly vigilant. They are in need
of protection from “others” (authorities, friends, other travellers). This paternalistic trope is unfortunately still
common in assault prevention education targeted to women (Fileborn and Vile-Gray 2017).
The overall impression from this plethora of safety instructions from different agencies, companies, and
associations is of a complex and relatively uncoordinated public transport system, with no clear
mechanisms to report incidents and no accountability to respond to incidents. While it is good to have
multiple sources of information on personal safety from public transport operators, police, and universities,
they are hardly consistent or empowering messages. Some of the information available to public transport
users appears to increase choices and options, treating users as rational actors. For instance, the PTV
information tells users what safety measures they have taken. However, there is no link to ‘customer feedback’
on that site to suggest improvements or make complaints, let alone links to the police or counselling services
if you have had a distressing incident, a disturbing omission given the very low rates of reporting of sexual
harassment and assault (AHRC 2017).
Other information, such as the advice offered by Monash University, puts a remarkable level of onus on
potential victims to avoid being victimised, rather than saying what the organizations themselves are doing to
improve safety, let alone encouraging any form of collective action for safety or putting the focus on offenders
(see Whitzman 2007: 91-94 for a description of paternalistic versus empowerment approaches). Nowhere
in any of these universities’ personal safety instructions for transport users is an acknowledgement that the
TERTIARY STUDENTS’ PUBLIC TRANSPORT SAFETY
IN MELBOURNE, AUSTRALIA
TRANSPORT, HEALTH AND URBAN
DESIGN RESEARCH HUB 9harasser or assailant might be known to the victim, such as a student at the same university, despite the
evidence of the Australian Human Rights Commission (2017 – see below) that the majority of harassers and
attackers on public transport are students at the same university as the victim. While Monash and the other
universities have separate material on consent in a dating context, there were no instructions on how not to
harass fellow students on transport, or materials on sanctions should that sort of incident be reported.
In the last two decades, there has been a remarkable shift in response to family violence. It is much easier to
report violence by an intimate partner, police are treating assault within relationships much more seriously,
there are public campaigns aimed at changing behaviour of assailants, and there is a coordinated prevention
strategy (Victorian State Government 2017). This kind of coordinated response, focusing on primary
prevention and enabling women’s rights, has not yet occurred in relation to harassment and assault on
public transport in Melbourne.
10 TERTIARY STUDENTS’ PUBLIC TRANSPORT SAFETY
IN MELBOURNE, AUSTRALIA
TRANSPORT, HEALTH AND URBAN
DESIGN RESEARCH HUB2
TERTIARY STUDENTS’ SAFETY ON PUBLIC
TRANSPORT: AN INTERSECTIONAL APPROACH
INTERNATIONAL RESEARCH
Researchers on violence, harassment and fear have long identified intersectional differences in experience and
impact, based on gender, age, abilities, sexuality and sexual identity, race/ethnicity, and income. While men
are more likely to experience violence from strangers and acquaintances, women are more likely to experience
repeated violence from intimate partners and other family members. Women are also more likely to be sexually
harassed than men. Women are more likely to fear crime and violence and constrain their behaviours based
on these concerns. Young people are more likely to be victims of violence and harassment but older people,
particularly women, are more likely to constrain behaviours because of fear. People with disabilities face higher
rates of violence from partners, family and caregivers as well as strangers and acquaintances. LGBTI+ people
are more likely to experience violence and harassment, as are people from cultural/ religious/ ethnic minorities.
Lower income people face constraints on housing, transport, and employment choices and often are more
exposed to harassment and crime as a result of these constraints (Pain 2001, Moser 2004, Garcia-Moreno et al
2004, AHRC 2017).
Particularly over the past decade, this intersectional approach has been applied to safety in relation to active
(walking and cycling), public, and private transport. Loukaitou-Sideris (2016) provides a typology of gendered
barriers to equal transport mobility. These include cultural barriers, such as women being more likely to be
responsible for providing care to children and elders, leading to trip-chaining (multiple stops, for instance,
picking up a child at childcare or school on the way from work to home) and carrying bulky items such as
groceries or prams. There can be economic barriers, such as less access to private cars and more expensive but
better located housing. There can be physical barriers, including absence of land use mix and local services,
leading to more complex trip chaining. And there can be psychological barriers, such as women being told that
they bear responsibility for their own safety from male violence and harassment, leading to avoidance of some
modes and routes, going out only during daylight or only accompanied by others. There are also differences
by age, with young women and men more likely to be dependent on public transport. Women with disabilities,
lesbians, and some racialized communities (for instance, Muslim women) are more likely to fear harassment and
violence on public transport, and lower income women have fewer transport and housing choices and increased
fear for that reason (see also Whitzman 2013, Ceccato 2017).
Barriers created by violence, harassment and fear have impacts on individuals, including avoidance of
particular transport modes and routes, and foregoing educational and employment opportunities. Assault
and harassment on transport can have physical and mental health, as well as economic, impacts (Ceccato 2017).
There are also collective or societal impacts to assaults and fear related to public transport. Currie et al
(2010) mentions the impact of media coverage of several attacks on Indian male students in 2009 on perceptions
of safety on Melbourne transport, including an incident in May 2009 where a brutal beating of a student by five
men in hoodies on a train carriage was captured by CCTV. Wade (2015) discusses the extensive coverage of these
attacks in Indian media that year – 50 major reports between May and July 2009 alone. By the following year,
65% of Indians polled agreed with the statement that “Australia was a dangerous place for Indian students”
(Wade 2015), and there was a 50% drop in Indian student visa applications in the second half of 2009, as
compared to the same period in the previous year, after a senior Indian government official advised students not
to study in Australia. The situation was not helped by the Victorian Police Commissioner advising Indian students
to “look poor” (Wade 2015), a comment analogous to the victim blaming that often occurs after well-publicized
attacks on women such as the murder of Eurydice Dixon.
TERTIARY STUDENTS’ PUBLIC TRANSPORT SAFETY
IN MELBOURNE, AUSTRALIA
TRANSPORT, HEALTH AND URBAN
DESIGN RESEARCH HUB 11The most comprehensive methodology on tertiary students’ public transport safety comes from a recent
study in New York City. The exploratory survey of 140 female undergraduate and postgraduate students at
one central city college took a ‘whole of journey’ approach: walking from home to a public transport stop or
station, waiting for public transport, riding on public transport, sometimes alighting and transferring (which
may involve additional walking and waiting), and then walking from the public transport stop/station to
college (Natarajan et al 2017: 171). A little over three quarters (77%) of students had experienced or witnessed
sexual harassment using public transport, with 7% having been touched or groped. The students rated sexual
harassment as less serious than assault, but more serious than robbery, theft or racial harassment – and given
that only a little over a quarter of respondents identified as ‘White’ or European origin, many have presumably
experience experienced both sexual and racial harassment (ibid: 173). Reported protective behaviours
ranged from carrying pepper spray to wearing ‘modest’ clothes, avoiding travelling alone, not making eye
contact, and constantly reporting to family and friends where they were going (ibid: 175). A relevant aspect of
recommendations for improvement was the emphasis on joint college/ transit authority responsibility
for taking complaints seriously, and having more visible police and public safety officers, and better lighting,
throughout the entire journey (ibid: 177-178).
PREVIOUS AUSTRALIAN AND MELBOURNIAN RESEARCH
In 2016, a comprehensive national study engaged 30,000 students in all 39 Australian Universities (but not
other tertiary education institutions). Change the Course: National Report on Sexual Assault and Sexual
Harassment at Australian Universities (AHRC 2017) underscored the high prevalence of assault and harassment
of young women in tertiary education. University settings included concerns related to the journey to and
from education. Around half of all university students (51%) were sexually harassed on at least one occasion
in 2016, and 6.9% of students were sexually assaulted on at least one occasion in 2015 or 2016 (AHRC 2017:
3). Women were twice as likely to have been sexually harassed, and three times as likely to have been sexually
assaulted, as men (ibid: 6). The majority of students who were sexually assaulted or sexually harassed in
a university setting in 2015 or 2016 said that the perpetrator of the most recent incident was male (71% for
sexual harassment and 83% for sexual assault). Approximately half of students who were sexually harassed
or assaulted in a university setting knew some or all of the perpetrators of the most recent incident, most
commonly a fellow student (ibid: 8).
Gender was not the only basis for differences in victimization. Forty four percent of students who identified
as bisexual and 38% of students who identified as gay, lesbian or homosexual were sexually harassed in a
university setting in 2016, compared with 23% of students who identified as heterosexual. Trans and gender
diverse students (45%) were more likely to have been sexually harassed in a university setting in 2016 than
women and men. Though sample sizes were small, Aboriginal and Torres Strait Islander students and students
with disability were more likely to have been sexually harassed in 2016 than non-Indigenous students and
students without disability. Domestic students (27%) were slightly more likely than international students
(22%) to have been sexually harassed in a university setting in 2016. Increased risk of sexual assault followed
similar patterns (ibid: 6-7).
The report included travelling to and from education as part of the university setting, and in fact public
transport was the most common location for sexual harassment – 22% of incidents, as opposed to 14% on
university grounds and 13% on a university teaching space. However, the usual stereotype of ‘stranger danger’
in public space was confounded by the fact that 57% of perpetrators of sexual harassment against women were
identified as students from their university. Students who were sexually assaulted in a university setting in 2015
or 2016 were most likely to have experienced the most recent incident at a university or residence social event
(21%), but public transport to or from university was the location in 15% of incidents (ibid: 7-8).
Forty of the 1849 written submissions described sexual harassment or assault on public transport, including
staring, leering, unwanted physical contact, and offensive comments of a sexual nature. For instance, one
woman described being slapped on the bottom by a fellow student as she was waiting to scan her ticket
12 TERTIARY STUDENTS’ PUBLIC TRANSPORT SAFETY
IN MELBOURNE, AUSTRALIA
TRANSPORT, HEALTH AND URBAN
DESIGN RESEARCH HUBbefore exiting a train station. Another, who regularly took a bus at the same time as her professor, was kissed
without consent or permission. After that incident, she arranged for her sister to call her and stay on the phone
throughout the 20-minute bus ride to avoid communicating with her professor (ibid: 70).
As is common in victimization surveys, only 2% of students who experienced sexual harassment and 9% of
students who experienced sexual assault in a university setting in 2015 or 2016 said that they had made a
formal report or complaint to the university (ibid: 11).
This study also builds on recent Melbourne-based research on tertiary students’ safety in public transport. A
2009 survey of 239 young people aged 18-25 (79% of whom were full-time or part-time students and 71% of
whom were female) was publicized through Monash University’s student newspaper and related social media.
The survey found that 40% of respondents felt unsafe or very unsafe using public transport after dark.
Like our survey, there were specific questions asked about experiences and concerns in relation to trains, trams
and buses. While 30% felt unsafe waiting at a train stop, and 23% felt unsafe travelling to and from trains,
buses and especially trams were felt to be safer. Four per cent of respondents had been directly attacked, 27%
had been threatened, over 30% had seen someone attacked, and over 60% had seen someone threatened.
Over 70% had felt threatened at some time (Currie, Delbosc, and Mahmoud 2010: 4). The survey also found that
availability, reliability and frequency rated as slightly more important than personal safety for respondents, and
these factors were also rated lower in performance than safety during the day or night (Mahmoud and Currie
2010: 5). In terms of factors deterring young people from waiting at train stations, for instance, long waiting
periods as well as ‘people drinking alcohol/drunk people’ and poor lighting were concerns (ibid: 6).
There was a low response rate for international students (only 7% of respondents), but these young people
rated safety at night as a higher priority than local students (Mahmoud and Currie 2010: 6). The study
found that more than gender, country of birth, or experiencing or witnessing violence, the most significant
explanatory variable was ‘feeling uncomfortable with strangers on public transport’ (Currie, Delbosc, and
Mahmoud 2010: 7). This finding suggests that the young people surveyed may have been unused to public
transport, having relied on the ‘mom taxi’ to primary and secondary school, an increasing reality in a
metropolis with poor linkage of public transport and education provision (Carver, Timperio and Crawford 2012).
The first ranked measure to improve safety while waiting at train stations was visible security guards in those
stations, and similarly, the first ranked measure on trains was increased security guards (Mahmoud and Currie
2010: 9). The overall emphasis was on protection, rather than empowerment.
A crowdsourced online mapping project in 2016 focused on the safety of young women aged 18-25 but
attracted responses from older women as well as men. ‘Free to Be’, developed by Plan International, a
children’s charity, and Monash University, asked participants to identify safe and unsafe places in Melbourne
through dropping colour coded pins on a map. The majority of the places identified were in central Melbourne.
Of the 1300 pins, supported by 600 comments, 14% of all the annotations were connected in some way to
public transport. Very few of these pins referred to buses, but over 60% referred to rail transport, and more than
a third related to safety issues with trams (Plan International and XYX Lab, 2017). Another 2015 survey of 292
Melbourne women who had experienced sexual harassment found just over half of the participants indicated
they commonly encountered harassment on public transport (Fileborn 2017).
The location that received the highest number of ‘unsafe’ pins and comments was Melbourne’s main commuter
rail station since the 19th century, Flinders Street. While commended for an increasing number of visible Public
Security Officers, it also recorded the highest number of sexual harassment and assault (groping) incidents.
The crowded nature of platforms and escalators was noted, as was the presence of seemingly inebriated
people. A nearby train station, Melbourne Central, is below a busy shopping centre with an extensive food court
and has a more modern and open design. Perhaps for those reasons, it is preferred to Flinders Street (Plan
International, 2017). Other train stations with less frequent service were also described as unsafe, particularly
those accessed via ramps and underpasses. At least one tram route (the 57 tram, from central Melbourne to the
western suburbs) was targeted for particular animus, partly because of the ‘unpredictable’ behaviour of people
who seemed drunk or on drugs. Participants described a number of avoidance or protective behaviours,
ranging from taking an Uber rather than a train to get home at night, or speed-walking, keeping keys between
the fingers, or having 000 (the Australian emergency phone number) on speed dial (Plan International and XYX
Lab, 2017).
TERTIARY STUDENTS’ PUBLIC TRANSPORT SAFETY
IN MELBOURNE, AUSTRALIA
TRANSPORT, HEALTH AND URBAN
DESIGN RESEARCH HUB 13To summarize previous research, there is a growing interest in tertiary students’ transport safety, and a growing
understanding that the everyday micro-aggressions of harassment as well as experiences of assault shape
constraints in behaviour, including avoiding perceived risk. There is a trend towards understanding public
transport safety as encompassing a ‘whole journey’ from home to destination, and to consider transport from
home to education as a responsibility that encompasses transport authorities, tertiary institutions, and all
levels of government. Research suggests that differences in experiences based on gender, age, sexuality and
sexual identity are clear cut. Differences based on race/ethnicity, income, and disability are more equivocal
and/or under-explored.
14 TERTIARY STUDENTS’ PUBLIC TRANSPORT SAFETY
IN MELBOURNE, AUSTRALIA
TRANSPORT, HEALTH AND URBAN
DESIGN RESEARCH HUB3
FINDINGS - GENERAL
METHODS
As discussed in the first section, this survey is part of a 17-city study in four different continents, using the
same survey instrument, entitled “Transit safety among college students: an international assessment”.
The international study is led by Professor Vania Ceccato, from KTE Royal Institute of Technology, based in
Stockholm, Sweden. The surveys were conducted during mid-2018 in:
• Europe: Stockholm and Haninge, Sweden; London, UK; Paris, France; Milan, Italy; Lisbon, Portugal;
• North and Central America: Los Angeles and San Jose, US; Mexico City, Mexico; Vancouver, Canada;
• South America: Sao Paolo and Rio Claro, Brazil; Bogota, Columbia;
• Asia- Pacific: Tokyo, Japan; Guangzhou, China; Manila, Philippines; Melbourne, Australia.
The Melbourne study made minor changes to the international survey instrument, substituting the Australian
term ‘public transport’ for the American term ‘transit’, and including a set of questions about trams (the
international instrument differentiated buses and heavy rail, but not tram or light rail). After receiving ethics
approval from the University of Melbourne (ethics approval #1851286.1), the survey was online from April 15-
June 30, 2018.
Links to the online survey were distributed using three mechanisms. First, we sent emails followed by phone
calls to the student service centres of nine universities and nine TAFEs in Greater Melbourne. Second, we
posted on local and international social media sites, including student organisations, urban and transport
interest groups with heavy Melbourne usage. These include: “Urban Happiness”, a Melbourne-based urban
planning and design group with over 5,000 members; “Where are Our Mates, Melbourne’s PT Ticket Wardens,
Today?”, a 30,000 member group tracking the behaviour of tram and train ticket inspectors, who have a very
poor reputation in Melbourne; and New Urbanist Memes for Transit Oriented Teens (NUMTOTs), an international
transport interest group with over 100,000 members, many from Australia. In addition, the research assistant
handed out flyers at the State Library and the main tram terminus for Melbourne University with a QR code.
The survey was created using Qualtrics, an online tool, which allowed easy statistical analysis of results.
TERTIARY STUDENTS’ PUBLIC TRANSPORT SAFETY
IN MELBOURNE, AUSTRALIA
TRANSPORT, HEALTH AND URBAN
DESIGN RESEARCH HUB 15GENDER, SEXUALITY, ‘RACE’ AND AGE OF RESPONDENTS
Eight hundred and eight students responded to the survey, but almost 300 did not complete the very long set of
questions, which ended with demographic information. Of the 517 completed responses, a little more than two
thirds were from women (Figure 1). This over-representation of women in terms of responses to safety surveys
is common in both international (Natarajan 2017) and Melbourne (Currie, Delbosc, and Mahmoud 2010) studies,
and points to greater concerns by women about personal safety.
63+31+123
1.0%
Other 1.7%
0.4% Prefer not to say
Transgender
29.2%
Male
67.7%
Female
Figure 1. Responses by Gender
The survey asked respondents whether they identified as LGBTQI+, to which 21.5% replied yes (Figure 2). This
is a higher proportion of sexual diversity than described in the 2016 Australian census (ABS 2018a and b).
However, given that young people are more likely to self-define as gender and sexually diverse (ABS 2018b), and
also that rates of concern around personal safety are higher amongst LGBTQI+ students (AHRC 2017), the over-
representation of this group is not surprising.
73.3+21.5+5.2
5.2%
Prefer not to say
21.5%
LGBTQI
73.3%
Straight
Figure 2. Responses by sexuality
A little over two thirds of students who responded to the survey reported their ethnicity as ‘White/ Caucasian’.
Of the remaining respondents, 23.8% identified as ‘Asian’ and 8.5% as other ethnicities, including indigenous
Australian students (Figure 3). This is a roughly representative proportion of the student body in Australian
universities (see Rizvi 2017 and Australian Government 2018).
16 TERTIARY STUDENTS’ PUBLIC TRANSPORT SAFETY
IN MELBOURNE, AUSTRALIA
TRANSPORT, HEALTH AND URBAN
DESIGN RESEARCH HUB67.5+23.5+8
8.2%
Other
23.9%
Asian
68.0%
European
origin
Figure 3. Ethnic origin of respondents
A slightly higher proportion of male Asian students responded to the survey than was the case for non-Asian
respondents (34.1% of Asian respondents were male, as compared to 27.7% of all others). There was also
a lower proportion of self-identifying LGBTQI+ Asian students (13.8%, as compared to 23.9% for all other
students). An equal proportion of LGBTQI+ men and women responded to the survey.
As almost 90% of respondents were from the 18-29 age group, we did not include ‘age’ as part of our
intersectional approach. There were a number of other limitations to the international survey, including not
differentiating between local and international students, not asking about disabilities, not asking for postcode
or other anonymised location of the respondents’ dwelling, and not asking which tertiary institution they
attended.
It is worth mentioning that there were some strong negative reactions to the international survey instrument,
particularly in relation to asking about ‘race’ of respondents (Figure 4). The most positive online responses to
the survey came from international students’ associations, while the negative comments were clustered in the
group New Urbanist Memes for Transit Oriented Teens.
Figure 4. Negative comments in response to the survey
TERTIARY STUDENTS’ PUBLIC TRANSPORT SAFETY
IN MELBOURNE, AUSTRALIA
TRANSPORT, HEALTH AND URBAN
DESIGN RESEARCH HUB 17LOCATION OF RESPONDENTS’ HOMES AND MODAL CHOICE
Unfortunately, the international survey did not ask respondents questions about their suburb/ neighbourhood
or postcode, nor did it ask which tertiary institution they attended. An attempt to differentiate students’
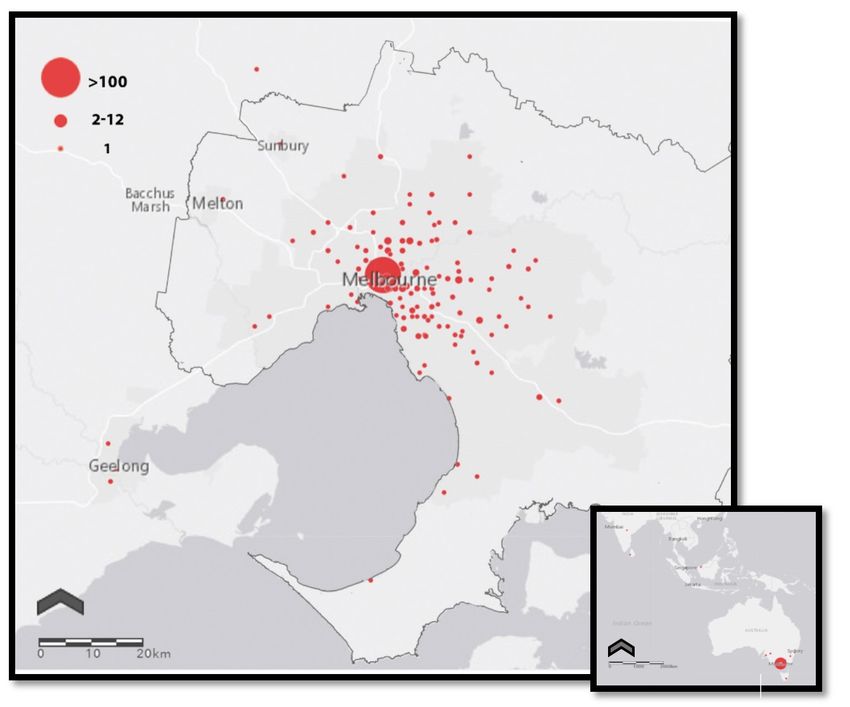
locations by known IP addresses is found in Figure 5. Most respondents’ IP addresses were clustered in central
Melbourne, with fewer respondents from outer suburbs. Several IP addresses were from other states and
South-east Asia, but the survey was live in mid to late June, when many students go on vacation or visit their
parents.
Figure 5. Respondent locations according to IP addresses
The central Melbourne home location of many students is suggested by the fact that the most commonly used
mode of public transport was trams (figure 6): 60.9% of respondents use them frequently (3 or more times a
week). Trains were the second most common public transport mode, with 49.5% of respondents using trains
frequently. Only 27.5% of respondents use buses frequently, and 38.4% never used buses.
18 TERTIARY STUDENTS’ PUBLIC TRANSPORT SAFETY
IN MELBOURNE, AUSTRALIA
TRANSPORT, HEALTH AND URBAN
DESIGN RESEARCH HUBThese results differ from the general population in Melbourne in two significant ways. First, tertiary students
appear to use public transport much more frequently than the general population, where only 18% use public
transport for their ‘journey to work’ (although the question asked is different - our survey asked about all
journeys, not just journey to study) (ABS 2018). This finding is similar to other Australian studies, which find that
young people are the most likely group to take public transport to work or study (ABS 2014). Second, trains are
the most used public transport mode for the general population. The surveyed students’ preference for trams
is not surprising, given the respondents’ IP addresses were clustered in the inner suburbs, where tram service
is concentrated. The relatively low use of buses is typical of the Greater Melbourne population, where previous
studies have shown that poor frequency is particularly resented by tertiary students (PTUA 2018).
100%
80.0%
60.9%
60.0%
49.5%
40.0%
27.5%
20.0%
0.0%
Bus Tram Train
Figure 6. Frequent (3 times a week or more) use of public transport, by mode
Men were slightly more likely than women to use each public transport mode frequently (Figure 7). LGBTQ+
students (68.5%) and Asian students (70.7%) were more likely than other students to use trams frequently,
suggesting that they may be more likely to live in central city locations serviced by trams.
100%
80.0%
64.2%
60.0%
60.0% 51.7%
48.6%
40.0%
26.9% 29.1%
20.0%
0.0%
Female Male Female Male Female Male
Bus Tram Train
Figure 7. Gender Differences, frequent use of public transport
Turning to private transport options, about one in four of students say they use cars at least three times per
week, with a significant difference between male (21.2%) and female (27.1%) respondents (Figure 8). There is
significantly less car use amongst LGBTQI+ (21.6%) and Asian (12.2%) students. Car use figures are much lower
than the general population for driving to work in Greater Melbourne, 77% (ABS 2018), although the question
TERTIARY STUDENTS’ PUBLIC TRANSPORT SAFETY
IN MELBOURNE, AUSTRALIA
TRANSPORT, HEALTH AND URBAN
DESIGN RESEARCH HUB 19asked is different (asking about all journeys, not only the journey to work/ study). A much higher proportion
(45.3% of respondents) do not own cars than the general population of Greater Melbourne, where only 8.5%
of households do not own one vehicle (.id 2018). This again points to absence of choices for tertiary students,
although some might still live at their parents’ home and have occasional access to a family vehicle, and others
might be part of car-sharing schemes.
100%
80.0%
60.0%
40.0%
27.1%
21.2% 22.5%
20.0%
12.3%
0.0%
Female Male Female Male
Car Bike
Figure 8. Private transport use by gender: ‘frequent’ (3 or more times a week) travel by car and bicycle
Women use cars frequently much more than men, while the obverse is true of bicycles. This finding is in line
with other Australian studies that show that women are more likely to drive passenger vehicles to work or study
than men (ABS 2014), and a recent Sydney study that found that only 26% of cyclists identified as female, with
women having greater concerns about traffic safety (Bicycle NSW 2016). Again, LGBTQI+ (12.6%) and Asian
(10.6%) students were less likely than other students to frequently ride bicycles.
There is also a clear gender difference in terms of frequent (in this case, at least once a week) use of taxis and
ridesharing services such as Uber (Figure 9). There is still much less use of taxis and rideshares than other
forms of transport, and the likelihood is that these services are used at night, rather than a daytime journey to
study. However, the reality of taxis and ride sharing being an increasingly popular student option is recognised
by Study Melbourne, the State Government website, which talks about “many people using this form of
transport for special occasions, at night, in bad weather or if the destination is not close to public transport.”
(Study Melbourne 2018b). Women are less likely to use taxis and more likely to use ridesharing services
than men. LGBTQI+ students (17.1%) were most likely to frequently use ridesharing, which may suggest
greater concerns around night time safety. Asian students (9.8%) were less likely than other students to use
ridesharing services.
100%
80.0%
60.0%
40.0%
20.0%
6.6% 14.0% 11.9%
2.6%
0.0%
Female Male Female Male
Taxi Rideshare
Figure 9. Private Transport: frequent (once a week or more) Taxi and Rideshare use
20 TERTIARY STUDENTS’ PUBLIC TRANSPORT SAFETY
IN MELBOURNE, AUSTRALIA
TRANSPORT, HEALTH AND URBAN
DESIGN RESEARCH HUBYou can also read