CITY LIMITS Setting Safe Speed Limits on Urban Streets - Summer 2020 - National Association of City Transportation Officials
←
→
Page content transcription
If your browser does not render page correctly, please read the page content below
CITY LIMITS
Setting Safe Speed Limits on Urban Streets

Summer 2020
NACTO    City Limits          City Limits   NACTO

    Acknowledgements
    NACTO MEMBER WORKING GROUP                      Lily Reynolds, Deputy Director of Complete     ABOUT NACTO                                        NACTO PROJECT TEAM
                                                    Streets, Philadelphia oTIS
    Christopher Cairns, City Transportation         Gustave Scheerbaum, P.E., Director             NACTO’s mission is to build cities as              Corinne Kisner, Executive Director
    Engineer, City of Orlando                       of Strategic Initiatives, Transportation,      places for people, with safe, sustainable,
                                                                                                                                                      Kate Fillin-Yeh, Director of Strategy
                                                    Philadelphia oTIS                              accessible, and equitable transportation
    Najah Casimir, Communications Manager,
                                                                                                   choices that support a strong economy and          Zabe Bent, Director of Design
    City of Cambridge Traffic, Parking &            Brad Topol, Interim Vision Zero Coordinator,   vibrant quality of life. We do this by:
    Transportation                                  Seattle Department of Transportation                                                              Jenny O’Connell, Program Manager
                                                                                                     •     Communicating a bold vision for 21st
    Charlotte Castle, Deputy Chief of Staff,        Liliana Quintero, Senior Transportation                                                           Matthew Roe, Technical Lead
                                                                                                           century urban mobility and building
    Managing Directors Office, Philadelphia         Engineer, City of Vancouver                            strong leadership capacity among city      Alex Engel, Communications Manager
    oTIS
                                                                                                           transportation officials.
                                                    Kelley Yemen, Director of Complete Streets,                                                       Sindhu Bharadwaj, Policy Associate
    Dongho Chang, City Traffic Engineer,            Philadelphia Office of Transportation,           •     Empowering a coalition of cities to lead
    Seattle Department of Transportation            Infrastructure, and Sustainability                                                                Celine Schmidt, Design Associate
                                                                                                           the way on transportation policy at the
    Ethan Fawley, Vision Zero Program                                                                      local, state, and national levels.
    Coordinator, City of Minneapolis Public
                                                                                                     •     Raising the state of the practice for
    Works                                           EXTERNAL REVIEWERS                                     street design that prioritizes people
    Tim Frémaux, Senior Transportation                                                                     walking, biking, and taking transit.
    Engineer, Valley and Western District           Sarah Abel, Technical Programs Manager,
    Operations, Los Angeles Department of           Institute of Transportation Engineers
    Transportation                                  Jessica Cicchino, Vice President, Research,    NACTO EXECUTIVE BOARD
    Lacey Hirtle, Senior Traffic Safety Engineer,   IIHS
    City of Vancouver                               Charlotte Claybrooke, Active Transportation    Janette Sadik-Khan, NACTO Chair
                                                    Program Manager, Washington State              Principal, Bloomberg Associates
    Matt Kelly, Vision Zero Specialist, Porltand
    Bureau of Transportation                        Department of Transportation
                                                                                                   Robin Hutcheson, NACTO President
    Julia Kite-Laidlaw, Director of Strategic       Jackie DeWolfe, Director of Sustainable        Director, Minneapolis Department
    Initiatives, New York City Department of        Mobility, Massachusetts Department of          of Public Works
    Transportation                                  Transportation
                                                                                                   Eulois Cleckley, NACTO Vice President
    James Le, Senior Civil Engineer, Seattle        Wen Hu, Senior Research Transportation
                                                                                                   Executive Director, Denver Department of
    Department of Transportation                    Engineer, IIHS
                                                                                                   Transportation & Infrastructure
    Brooke McKenna, Assistant Director for          Beth Osborne, Director, Transportation for
    Street Management, City of Cambridge            America                                        Michael Carroll, NACTO Secretary
    Traffic, Parking & Transportation                                                              Deputy Managing Director, Office of
                                                    Leah Shahum, Executive Director, Vision
                                                                                                   Transportation and Infrastructure Systems,
    Richard Montanez, P.E., Deputy                  Zero Network
                                                                                                   City of Philadelphia
    Commissioner for Transportation,                Eric Sundquist, Director, State Smart
    Philadelphia oTIS                               Transportation Initiative, University of       Robert Spillar, NACTO Treasurer
    Ryan Noles, Senior Transportation Planner,      Wisconsin                                      Director of Transportation, City of Austin
    City of Boulder                                 Veronica Vanterpool, Principal, V Squared
                                                                                                   Joseph Barr, NACTO Affiliate Member
    Ryan Reeves, Vision Zero Program Lead,          Strategies
                                                                                                   Representative; Director, Traffic, Parking, &
    Sustainable Streets Division, San Francisco                                                    Transportation, City of Cambridge
    Municipal Transportation Agency

2                                                                                                                                                                                             3
NACTO     City Limits     City Limits   NACTO

                                                                                                  Table of Contents
    Key Terms & Definitions                                                                       Acknowledgements                                                      2
                                                                                                  Key Terms & Definitions                                               4
    Absolute Speed Law: A legal environment in which drivers must never drive faster
    than the posted speed limit, regardless of what they deem safe for conditions.                Speed Limits Conversions                                              4
                                                                                                  Executive Summary                                                     6
    Basic Speed Law: A legal environment in which drivers must never drive faster
    than is safe for present conditions, regardless of the posted speed limit.                    About This Document                                                   7

    Design Speed: The speed on which the geometry or physical elements of the
    roadway is based.
                                                                                                  1 The Need                                                           8
    Operating Speed: The speed at which vehicles are traveling along a roadway.
                                                                                                    Rethinking Safety                                                  11
    Posted Speed Limit: The maximum lawful speed as displayed on a regulatory sign.                 Speed Kills                                                        14
    Statutory Speed Limit: The speed limit established under law, which applies in                  How Speed Kills                                                    15
    the absence of a posted speed limit.                                                            Designed to Fail: The problem with percentile-based speed limits   18
    Target Speed: The highest speed that designers intend drivers to go on a specific               Speed Limit Changes Have Big Impacts                               22
    street or road.

                                                                                                  2 The Tools                                                          26
                                                                                                    Tools to Change Speed Limits                                       28

    Speed Limits Conversions                                                                        Authority to Change Speed Limits
                                                                                                    Combining Tools
                                                                                                                                                                       29
                                                                                                                                                                       31
                                                                                                    Case Studies in Lowering Speed Limits                              35

      10                  15                          25                  40
                                                                          KPH
      MPH                 KPH                         MPH
                                                                                                  3 The Right Speed Limits                                             40
                                                                                                    Recommended Speed Limits                                           42
      15                  25                          30                  50
                                                                          KPH
      MPH                 KPH                         MPH                                           Default Speed Limits                                               44

      20                  30
                          KPH
                                                      35                  60                        Defining Slow Zones                                                52

      MPH                                             MPH                 KPH

                                                                                                    Corridor Speed Limits / Conducting Safe Speed Surveys              56

                                                                                                  4 Checklists                                                         90

4                                                                                                                                                                           5
NACTO     City Limits            City Limits   NACTO

    Executive Summary                                                                                        About This Document
    We cannot reduce traffic fatalities on US city       setting speed limits in urban areas. In many        In 2018, NACTO convened a working group             with commercial, residential, or retail uses
    streets without reducing speeds.                     places, cities have turned to increased police      of major US cities to develop new robust            along one or both sides. This guidance is
                                                         enforcement to compensate for restrictive           guidance for setting speed limits on urban          also applicable on streets like these in non-
    More than 35,000 people die in traffic crashes
                                                         engineering and speed limit setting policies,       streets that could provide an alternative to the    urban areas. This guidance is not applicable
    on US roads each year, and millions more are
                                                         a practice that is not proven to reduce serious     highway-focused federal recommendations.            on limited access streets, even within cities,
    seriously and often permanently injured. The
                                                         injuries or fatalities, and often increases risk    Over the course of the following 18 months,         or on rural or very low density streets with
    United States has the highest fatality rate in
                                                         for Black, Indigenous, and people of color          transportation staff from 19 cities helped to       limited multimodal use.
    the industrialized world; double the rate in
                                                         (BIPOC) on city streets.                            write and review the guidance and provided
    Canada and quadruple that in Europe. While                                                                                                                   Finally, the speed limit setting guidance
                                                                                                             technical expertise based on their experience
    traffic fatalities may seem like an intractable      This document, City Limits, is intended to                                                              contained in City Limits is only one piece of
                                                                                                             developing speed management strategies
    issue, city governments have the power to            provide city practitioners with guidance on                                                             a larger, essential discussion around how
                                                                                                             and programs and implementing lower speed
    reduce the frequency and severity of traffic         how to strategically set speed limits on urban                                                          to make streets truly safe for everyone.
                                                                                                             limits in their own cities.
    crashes by reducing motor vehicle speeds.            streets, using a Safe Systems approach,                                                                 Speeding vehicles pose a significant, specific,
                                                         to reduce traffic fatalities and injuries.          The resulting guidance, City Limits, provides       and deadly threat, but comprehensive safety
    Addressing speed is fundamental to making
                                                         Recognizing that city authority to set speed        cities with clear technical and policy guidance     on city streets and public spaces involves
    streets safer. Vehicle speed increases both
                                                         limits varies by jurisdiction, City Limits offers   on setting safe speed limits on city streets. All   a more holistic consideration of risks—
    the likelihood of a crash, as well as the severity
                                                         three tools for setting speed limits on urban       of NACTO’s Member Agencies (81 members              from accessibility to gender identity-based
    of the crash, as it diminishes drivers’ ability
                                                         streets:                                            at the time of final review) have approved          harassment to racial violence. In particular,
    to recognize and avoid potential conflicts. In
                                                                                                             this guidance. The technical guidance and           speed enforcement as currently practiced
    addition, on streets with higher speeds and
                                                                                                             recommended maximum speed limits in this            poses additional, disproportionate health
    higher speed limits, traffic engineers have             Setting Default Speed Limits on many             document are based on input from NACTO              and safety risks especially to Black and
    fewer design options to increase safety.                streets at once.                                 member agencies, academic studies about             Latinx people. Manual police enforcement is
    In cities, transportation agencies have long                                                             speeds that minimize conflict and risk, and         a less effective way to manage speeds down
    understood that motor vehicle speed plays a                                                              best practices in cities across the world.          over time than street design and engineering
                                                            Designating Slow Zones in sensitive
    key role in fatal and serious crashes, and have                                                                                                              changes, and can create dangerous physical
                                                            areas.                                           Unlike existing national guidance, City Limits
    sought to reduce speeds through design and                                                                                                                   and mental health impacts for Black,
                                                                                                             focuses on urban streets, which pose the most
    regulation in order to save lives. But speed                                                                                                                 Indigenous, and people of color (BIPOC), as
                                                                                                             challenging scenarios for determining speed
    limit reductions have remained out of bounds                                                                                                                 well as other marginalized road users. This
                                                            Setting Corridor Speed Limits on high            limits and are where the majority of pedestrian
    for many city transportation agencies because                                                                                                                resource touches on speed enforcement, but
                                                            priority major streets using a Safe Speed        and cyclist fatalities occur. In this document,
    authority over speed limits, even on city                                                                                                                    it is not the focus of this guidance. City Limits
                                                            Study.                                           urban streets refer to most of the categories
    streets, is often held at the state level, and is                                                                                                            addresses speed limit setting policy which,
                                                                                                             of streets found in North American cities,
    commonly tethered to the practice of using the       City Limits maps a new path for US cities,                                                              paired with street design, is the best tool for
                                                                                                             including local, primarily residential streets,
    existing speeds on a street to determine what        codifying speed limit setting best practices                                                            reducing the health and safety risks posed by
                                                                                                             mixed use corridors, transit corridors, high
    the speed limit should be. This flawed model         that have been tested and documented in                                                                 vehicular speeds.
                                                                                                             density downtown streets, and urban arterials
    uses the current behavior of individuals to          cities across North America. Cities can create
    determine the speed limit, instead of allowing       better and safer outcomes for all by adopting
    engineers and planners to set the limit at           these speed limit setting practices as part of
    the speed that will create the best, safest          their traffic fatality reduction or Vision Zero
    conditions for all road users. The result is         programs. By managing speeds, cities can
    higher speeds and speed limits over time.            save lives.

    Practitioners often find themselves with
    limited recourse to address these challenges
    because they lack an alternative method for

6                                                                                                                                                                                                                    7
NACTO   Setting Safe Speed Limits   NACTO   Setting Safe Speed Limits
 NEW YORK CITY

Photo: City of New York

                                                                                                  1
                                                                                                  The
                                                                                                  Need
The Need    NACTO     City Limits                            City Limits   NACTO                                                                   The Need

     SEATTLE
                                                               Rethinking Safety
                                                               In 2018 alone, drivers killed 36,560 people on          US streets are becoming especially
                                                               US roads and seriously injured millions more.1,2        dangerous for people walking and biking.
                                                               These tragedies are the result of a failed              Between 2009 and 2018, pedestrian deaths
                                                               approach to traffic safety that prioritizes             from traffic crashes in the US grew by 46%,
                                                               speed and convenience over human lives.                 reaching a nearly 3-decade high of 7,354
                                                                                                                       people killed by vehicles in 2018 alone.4,5
                                                               Experience from other industrialized countries
                                                                                                                       This rate means that people walking and
                                                               shows that fewer traffic deaths and safer roads
                                                                                                                       biking are an increasingly large percentage
                                                               are possible. Rather than focusing on individual
                                                                                                                       of all fatalities on the road. For the past
                                                               behavior, these countries focus on changing
                                                                                                                       five years, pedestrians and cyclists have
                                                               the policies and engineering decisions that
                                                                                                                       accounted for almost 20% of all road
                                                               create unsafe conditions. This technique, also
                                                                                                                       fatalities, despite making up only 11% of
                                                               known as a Safe Systems approach, is the
                                                                                                                       road users.6,7 And this number is on the rise.
                                                               guiding philosophy behind the safer streets in
                                                                                                                       From 2008 to 2018, cyclist and pedestrian
                                                               European Union and Scandinavian countries,
                                                                                                                       fatalities increased by 38% versus a 12%
                                                               which have, on average, a per capita traffic
                                                                                                                       decline for vehicle occupants.8
                                                               fatality rate that is half and a third, respectively,
                                                               of that in the United States.3                          Compounding these statistics, reliance on
                                                                                                                       increased police enforcement to address
                                                                                                                       dangerous driving in the name of “safety”
                                                               Safety for all road users must be set                   has contributed to the disproportionate
                                                                                                                       number of Black people stopped, injured,
                                                               as the foremost goal, and all decisions
                                                                                                                       and killed by the police.9
                                                               must be made based on how well they
                                                               advance work toward zero deaths.

                                                               PEDESTRIAN FATALITIES HAVE BEEN STEADILY RISING SINCE 2009

                                                               7,000

                                                               6,000

                                          Pedestrians killed
                                                               5,000

                                                               4,000

                                                                       2000                    2005                    2010                  2015

                 Photo: City of Seattle

10                                                                                                                                                                      11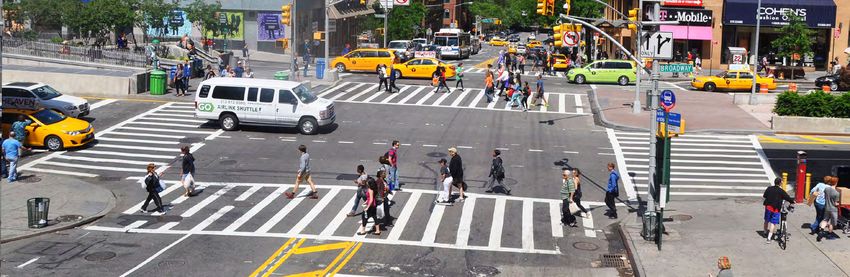
The Need NACTO City Limits City Limits NACTO The Need
In cities, where the vast majority of pedestrians infrastructure to support that speed. PHILADELPHIA
and cyclists are killed, transportation agencies Instead of being forced upward over time,
have long understood that motor vehicle speeds, and fatalities, would go down as
speed plays a key role in fatal and serious they have in the countries that use such
crashes, and have sought to reduce speeds approaches.
and save lives. But speed limit reductions
To reduce traffic deaths and severe injuries
have remained out of bounds for many city
in the US, transportation policymakers must
transportation agencies because authority
change their approach. Safety for all road
over speed limits, even on city streets, is
users must be set as the foremost goal, and
often held at the state level, and is commonly
all decisions—about speed, infrastructure,
tethered to the practice of using the existing
allocation of parking and other curbside
speeds on a street to determine what the
uses, enforcement, and maintenance—
speed limit should be. This method results in
must be made based on how well they
higher speeds and speed limits over time.10
advance work toward zero deaths. By taking
If the US approached speed limit setting a holistic, Safe Systems approach to street
using a Safe Systems approach, engineers design, cities can reduce speeds, build safer Photo: Charles Mostoller
would determine the speed that is safest streets, and save lives.
for all people using the street and then build
RACISM EXACERBATES THE DANGERS OF SPEEDING
Structural and individual racism exacerbate to a White pedestrian actively crossing in the
TRAFFIC FATALITIES ARE DECLINING IN MOST OTHER INDUSTRIALIZED the dangers posed by speed. In their 2019 crosswalk only about 3% of the time versus
COUNTRIES, BUT RISING IN THE US11 Dangerous by Design report, Smart Growth 21% of the time for a Black pedestrian.16
America finds that Black, Indigenous, and
25 Finally, relying on traffic stops as a primary
Latinx people are more likely than White people
method for managing speeds can hinder
to be struck and killed by a driver.12 Street
larger efforts to improve overall community
conditions are often worse in low-income
safety on streets and deepen the role
20 neighborhoods and those where people of
of transportation in structural poverty,
color are the majority. Historically, in many
where enforcement targets low-income
Deaths per 100,000
cities, redlining justified underinvestment in
communities. According to the Department
15 public services for communities of color, while
of Justice, about half of all interactions with
Russia past and current highway siting decisions,
police begin with a traffic stop or crash.17
United suburban-focused traffic engineering
But data shows that when enforcing traffic
States practices, and disinvestment in urban cores,
10 laws, police disproportionately stop Black
result in substandard, dangerous streets in
Sweden Spain people and other people of color, sometimes
predominantly low-income, immigrant, and
UK Italy with fatal consequences.18 By focusing only
BIPOC communities.13
5 Norway Canada on reducing traffic fatalities at the cost of
Mexico Japan
Recent studies from Portland State University increasing risk of fatalities due to police
Austria Australia
Netherlands
and the University of Nevada, have found violence and undue stress, transportation
0 racial bias in how quickly or frequently drivers planners, engineers, and practitioners
‘95 ‘97 ‘99 ‘01 ‘03 ‘05 ‘07 ‘09 ‘11 ‘13 ‘15 ‘17 yield to pedestrians in crosswalks.14,15 In erode their credibility with the communities
particular, in higher-income neighborhoods, they serve and undercut the momentum for
researchers found that drivers failed to yield safer streets as a whole.
12 13
The Need NACTO City Limits City Limits NACTO The Need
Speed Kills How Speed Kills
Speed is a central factor in traffic deaths. The Higher speeds are more likely to result in crashes
National Highway Traffic Safety Administration because the amount of time a driver has to hit the
1 2
reports that speed was a factor in a quarter of brakes or swerve decreases at higher speeds,
all fatal crashes in 2018.19 As speed limits and while vehicle braking distances increase.23,24 A
speeds increase, so do fatalities. Researchers driver going 40 mph travels twice as far as a driver
from the Insurance Institute for Highway traveling at 25 mph before coming to a complete Crashes at higher speeds Drivers traveling at
Safety (IIHS) found that a 5 mph increase in the stop.25,26,27 Research also shows that drivers have are more forceful and thus higher speeds have a
maximum speed limit was associated with an less peripheral awareness at higher speeds and
more likely to be fatal narrower field of vision
8% increase in the fatality rate on interstates are less likely to see or predict potential conflicts
and freeways, and a 3% increase in fatalities such as people crossing the street or children
on other roads.20 playing.28 Meanwhile, crashes are more likely to
be fatal at higher speeds because these crashes
25
Vehicle speed at the time of impact is directly MPH
are more forceful.
correlated to whether a person will live or die. 100 O
45
Force
A person hit by a car traveling at 35 miles per As a result, evidence shows that small
65 O MPH
hour is five times more likely to die than a reductions in speed result in large safety gains.29
person hit by a car traveling at 20 miles per The Highway Safety Manual reports that a 1 mph
hour.21 The risk of death at every speed is reduction in operating speeds can result in a 17%
higher for older pedestrians and pedestrians decrease in fatal crashes.30 A separate study
Speed
hit by trucks and other large vehicles.22 found that a 10% reduction in the average speed
resulted in 19% fewer injury crashes, 27% fewer
High speed crashes are more likely to occur
severe crashes, and 34% fewer fatal crashes.31
than crashes at lower speeds and, when they
do occur, they’re more likely to be deadly.
THE LIKELIHOOD OF FATALITY INCREASES EXPONENTIALLY WITH VEHICLE SPEED32 3 4
Drivers traveling at higher Vehicles traveling at
100% Hit at 50 mph,
speeds travel further higher speeds have
Common Speed 75% of people
Limits on Urban will die before they can react longer braking distances
Arterials
75%
Likelihood
50%
20 63 ft
of Death MPH
Hit at 32 mph,
25% of people
Hit at 23 mph,
will die 30 119 ft
25% 10% of people MPH
will die
0%
40 164 ft
MPH
15 25 35 45 55
MPH MPH MPH MPH MPH
thinking braking
Impact Speed
14 15
The Need                                                               NACTO    City Limits       City Limits   NACTO                                                               The Need

                                                                                                       PITTSBURGH

     High speed driving is particularly deadly        Urban arterials are typically signed for 35-
     where different types of road users share        45 miles per hour or higher, and are designed
     space and must interact frequently. In the       to support high speeds by featuring wide,
     US, fatal crashes are disproportionately         highway-width lanes, sweeping turn radii,
     clustered on a small group of high speed,        and few places to stop for people to cross.
     auto-oriented streets, known as urban            In many cities, urban arterials often lack
     arterials. Between 2014 and 2018, urban          basic protections for people outside of cars,
     arterials accounted for 29% of all fatal         such as sidewalks, even when bus stops
     crashes in the US and half (49%) of all fatal    are present or when the adjacent retail/
     crashes involving people biking or walking,      commercial land uses encourage people to                                                                             Photo: City of Pittsburgh
     despite making up only 6% of US roadways.33      go there.

                                                                                                      TWO TAKES ON SAFETY-FIRST SYSTEMS APPROACHES

         INCREASING VEHICLE SIZE COMPOUNDS THE DANGERS OF SPEED                                       Vision Zero saves lives                            US Aviation makes an impact
         In the US, the trend toward larger           and they have a taller frame, which             Shifting an entire system from unsafe to safe      By nearly every measure, commercial
         vehicles compounds the problems posed        increases the likelihood that, if struck, a     is not just an aspiration. Many US cities have     aviation is the safest transportation mode
         by excessive speeds. In 2017, 43% of         person (especially a child) will be pulled      adopted safety-first programs, to varying          in the United States. There were 3 fatal
         pedestrian and cyclist fatalities involved   under the vehicle rather than pushed            degrees of success. Vision Zero, Injury            crashes between 2010 and 2017, compared
         an SUV, pickup truck or other light          onto the hood.                                  Minimization, and Safe Systems programs            to 17 fatal crashes in 1960 alone.38 These
         truck.34 In 2015, the National Highway                                                       affirm safety as the top transportation priority   safety gains are the result of systemwide,
                                                      The US trend toward larger, more                and the most effective way to eliminate traffic    interdisciplinary approaches to managing
         Traffic Safety Administration found that
                                                      dangerous vehicles is only growing.             fatalities. Establishing a safety-first program:   risk on the part of regulators and the
         pedestrians are two to three times more
                                                      SUVs and pickup trucks outsold sedans                                                              commercial aviation industry.
         likely to die when hit by an SUV or pickup                                                    > Signals a commitment to zero traffic
                                                      more than three-to-one in 2019, and
         than by a passenger car.35                                                                      deaths on city streets                          In 1997, the White House Commission on
                                                      companies like Ford and Fiat Chrysler
                                                                                                       > Asserts a belief that such a goal               Aviation Safety & Security and the National
         Larger vehicles are more lethal than         have announced that they will stop
                                                                                                         is attainable                                   Civil Aviation Review Commission released
         smaller ones for two main reasons: they      producing the vast majority of their
                                                                                                       > Accepts the role of officials,                  reports calling for the Federal Aviation
         are heavier, which increases the force of    sedans and compact cars.36
                                                                                                         engineers, and planners in                      Administration (FAA) and airlines to work
         the impact when combined with speed;
                                                                                                         making streets safer                            together to reduce fatal accidents.39 In
                                                                                                      Safety-first programs recognize that although      response, the FAA partnered with airlines to
           CLEVELAND
                                                                                                      human error is inevitable, fatalities and severe   form the Commercial Aviation Safety Team
                                                                                                      injuries are preventable through street design     (CAST), which uses incident data to discern
                                                                                                      and management choices. Successful safety          safety priorities, deploys interdisciplinary
                                                                                                      programs systematically change the way             teams to determine underlying crash
                                                                                                      streets operate to keep users safe, even when      causes, and applies interventions based on
                                                                                                      individuals make mistakes.                         their findings.

                                                                                                      Sweden has created one of the most                 In 2009, Continental Flight 3407 crashed,
                                                                                                      successful Vision Zero programs to date. In        killing all 49 people on board and one
                                                                                                      1997, when Sweden adopted its Vision Zero          person on the ground. Pilot error and fatigue
                                                                                                      program, there were more than 7 traffic            were the listed causes. By 2013, the FAA
                                                                                                      deaths per 100,000 people. Today, despite          dramatically increased both training and
                                                                                                      more than 20 years of growth in traffic            rest requirements for pilots.40 Humans in
          Photo: Angie Schmitt, @schmangee                                                            volume, this number has dropped to 3 people        the commercial aviation industry make
          on Twitter, Cleveland, OH                                                                   per 100,000.37                                     mistakes. However, a systems approach to
                                                                                                                                                         safety has resulted in substantive safety
                                                                                                                                                         gains across the entire industry.

16                                                                                                                                                                                                       17
The Need NACTO City Limits City Limits NACTO The Need
Designed to Fail
THE PROBLEM WITH PERCENTILE-BASED SPEED LIMITS
Current speed limit setting practice in the US Two issues are at play. First, percentile-based Posting higher speed limits does not increase wider range of speeds. This can increase
uses a percentile-based method, typically set models are designed to respond to extremes. compliance with the law. Even when higher the likelihood of crashes because people
at the 85th percentile, to determine speeds. When enough people drive faster than the speed limit signs are posted, some number are traveling at increasingly different
Traffic engineers record how fast vehicles are set percentile, the model rewards them by of people will still choose to drive 5-15 mph speeds, and increases the likelihood that
traveling on a road, determine the speed that instructing traffic engineers to increase the faster than the posted limit. These “high- crashes will be fatal because they occur at
85 percent of drivers are traveling at or below, posted speed. end” speeders travel even faster as speed higher speeds.
then set the new speed limit by rounding from limits rise and typically spread out over a
Second, people decide how fast to drive based
that speed to the nearest 5 mph increment.
on both the street’s design and cues such as
Traffic engineers who use the 85th percentile
the posted speed and other drivers’ speeds.
method are instructed to raise the speed limit USING PERCENTILES TO DETERMINE SPEED LIMITS
Researchers originally recommended using = 5 vehicles (out of 100)
when more than 15% of drivers are driving RESULTS IN INCREASED SPEEDS OVER TIME recorded in speed study
the 85th percentile approach to determine
faster than posted signs. This method forces
posted speeds, assuming that drivers always
engineers to adjust speed limits to match
travel at reasonable speeds.41 But a growing
observed driver behavior instead of bringing
body of research shows that drivers base their
driver behavior in line with safety goals and the
decisions at least partially on the posted speed
law. When it comes to safety, this method is
limit.42,43 When they see higher posted limits,
designed to fail. 50
and see the resulting increased speed of their
MPH
Percentile-based speed limit setting methods peers, they drive faster too, which results in an
fail at keeping people safe because they set a increased speed of the street overall.44
85th
permanently moving target based on current
percentile
human behavior, not safety. speed
45
MPH
People choose their speed
depending on posted speed
85th
Traveling Speed
signs and keeping up with
percentile
other drivers (aka “going the speed
Based on observed DRIVERS SPEED 40
speed of traffic”). MPH
traffic speeds,
cities set new,
higher posted
85th
speed limits. percentile
35
MPH
speed
NEW POSTED SPEED SPEED STUDY
Cities measure
the speed of 30
MPH
40 traffic and
MPH identify the 50th
or 85th
percentile speed.
1st Speed Study 2nd Speed Study 3rd Speed Study
18 19The Need NACTO City Limits City Limits NACTO The Need
RURAL CONNECTICUT
In cities and other urban contexts, time to 45 mph. While other additional factors
percentile-based speed limit setting may also have played a role in speeds inching h t t p s : //p o r t a l .
methods are particularly dangerous because up over time, absent any design or land use c t . g o v /_ D
ht tps://w w w.f lickr.com/photos/sdot O T /84729324 37/
photos/4
they are based on outdated research that changes, the increase suggests that the 85th General/History/
in/photolist-2gRos3r-JKvGUx-FCFnYi-X6Q7rc-XeTjss-qNCj7y-
22Aq162-X6Q7oX-24fbPXm-2gzqxCf-Fs1iyb-2heaNTc-F9RfHF-
is inapplicable in urban settings.45 The percentile operating speed can shift over time Historical-
YDvPkW-2gpDWfU-26LhFYP-2782jkJ-JcjwdW-JTaKBN-EFFU3x-
Lt y1HD-FPTsK T-2eYkhnj-PYQBt x-pdzXdo-NKmLcp-M4FpVM-
1940s-era research supporting the 85th in accordance with the posted speed limit. Merritt-Parkway-
Miz x zr-HLVuzC-QLov4C-2cgMt3u-GmW8Ve-VzTaYd-qw8AtG-
HsowEc-PKUEzE-DPMzCq-Pq3bKJ-PKUEfw-YnQFbN-MGtVgT-
percentile relied on self-reported crash Notably, this time period in LA corresponded to Images
NKmLoM-2bNarFf-eQ1xmX-2cgMt1f-2a4Laue-Pq3c1o-PYQBwZ-
data and was conducted on two-lane rural a 92 percent increase in pedestrian fatalities.48 28mz4Eo-Huyy81
highways, devoid of multimodal activity.46
The most commonly cited alternative for
But these historic roads are a far cry from the
the 85th percentile is USLIMITS2, an online
vibrant streets and arterials that typify city Photo: State of Connecticut DOT
tool developed by the Federal Highway
streets today. In particular, rural roads and
Administration that incorporates other factors The research supporting the use of the 85th percentile method was conducted on rural,
highways lack the type or volume of conflicts
when determining speed limits. USLIMITS2 is two-lane highways.
found in cities, such as people crossing the
a step forward in that it allows practitioners to
street, and people biking, walking, or rolling at
also consider the street’s most exposed users.
a variety of speeds. They also lack driveways,
However, it still relies on the 85th or, more
loading, parking, and double-parking.
commonly in urban areas, the 50th percentile AUSTIN
Los Angeles’ experience with Zelzah Avenue operating speed, which is often still much
provides a telling example of the dangers higher than is safe. Relying on a percentile-
of percentile-based speed limit setting. based system focused on current driver
In 2009, Los Angeles conducted a traffic behavior, rather than a defined safety target
speed study and raised the speed limit on to set speed limits, significantly limits cities’
Zelzah Avenue from 35 mph to 40 mph.47 In ability to reduce traffic deaths.
2018, the city again studied existing traffic
speeds, and again raised the speed limit, this
Relying on a percentile-based system focused on
Photo: Capital Metro
current driver behavior, rather than a defined safety
target to set speed limits, significantly limits cities’ But streets in cities are full of people walking, biking, using transit, and driving all in close
ability to reduce traffic deaths. proximity. The 85th percentile method for setting speed limits has never accounted for
these types of conditions.
20 21The Need NACTO City Limits City Limits NACTO The Need
Speed Limit Changes SPEED LIMIT REDUCTIONS ALONE CAN REDUCE SPEEDS AND CRASHES
Have Big Impacts CASE STUDY CASE STUDY
TORONTO SEATTLE
Rethinking how urban speed limits are set Reducing the posted speed limit unlocks a
improves safety for people in a number of variety of engineering and design tools that can
ways. Even changing the posted speed limit further increase safety on a street and support Seattle DOT replaced existing 30 mph
In Toronto, Researchers at The Hospital
sign creates safety benefits and allows other policy goals. Typically, the posted speed signs spaced 1 mile apart with 25 mph
for Sick Children found that on streets
cities to provide more and better safety of a street dictates what infrastructure and signs placed 1/4 mile apart on a 1.3 mile
where speed limits were lowered from
treatments, and improve overall quality of safety elements can be included in the final stretch of Greenwood Ave. North /
40 kph to 30 kph, there was a 28%
life. street design. For example, if the posted speed Phinney Ave. North, and saw reductions
decrease in the number of collisions
is 30 mph, a wider curb radius will be required in 85th and 50th percentile speeds, as
A growing body of research shows that speed between pedestrians and motor
than if the posted speed is 25 mph. The wider well as all crashes and injury crashes.
limit changes alone can lead to measurable vehicles and a 67% decline in the
curb radius increases exposure and risk for During this time, the city did not
declines in speeds and crashes, even absent number of fatal and serious injuries on
people walking and biking.51 All too often, increase marketing or enforcement, nor
enforcement or engineering changes. For streets with speed limit reductions.
essential pieces of safety infrastructure— did they make any engineering changes.
example, a 2017 Insurance Institute for
raised crossings, bike lanes, corner bulb-
Highway Safety study in Boston found that
outs—are ironically ineligible for inclusion in a
just reducing the citywide speed limit to 25
street redesign because drivers are currently
mph from 30 mph reduced speeding overall
going too fast. In effect, the street is too
and dramatically decreased the instances of
high-end speeding (vehicles traveling faster
dangerous to build safety infrastructure. 40 30 30 25
KPH KPH MPH MPH
than 35 mph).49 Reducing posted speeds creates opportunities
for safer street designs that also support other
Similarly, in Canada, researchers at The Decreases in... Decreases in...
policy goals. Similar to curb radii decisions,
Hospital for Sick Children found measurable
often infrastructure that supports transit
safety gains after Toronto lowered speed
and other sustainable modes like biking and PEDESTRIAN-VEHICLE FATAL & SERIOUS 85TH PERCENTILE
limits from 40 kilometers per hour (~25 mph) COLLISIONS INJURIES SPEED ALL CRASHES
walking, cannot be included in a design if the
to 30 kilometers per hour (~20 mph) on a
posted speed is too high. City policies around
number of local streets.50 34 MPH 30
safety, economic sustainability, equity, carbon
Recent efforts in Seattle underscore emissions reductions, and increased transit,
31 MPH
this pattern. There, the Department of bike, and walk mode share are interconnected.
Transportation saw significant speed and Rethinking speed limits unlocks the door
crash reductions when they lowered the for better design and safer streets, which
21
speed limit to 25 mph and increased the increases opportunities for all.
density of speed limit signs on select streets. -28%
All too often, essential pieces of safety infrastructure—
raised crossings, bike lanes, corner bulb-outs—are
ironically ineligible for inclusion in a street redesign -67%
before after before after
because drivers are currently going too fast.
22 23The Need NACTO City Limits City Limits NACTO The Need
Section 1 Endnotes
1. National Highway Traffic Safety Administration. 15. Coughenour, Courtney, et al. (January 29. Poole, B., Johnson, S., and Thomas, L. 41. Federal Highway Administration (2012). Methods and
Fatality Analysis and Reporting System. Retrieved 2017). Examining racial bias as a (December 2017). An Overview of Automated Practices for Setting Speed Limits: an Informational
from: https://www.nhtsa.gov/es/research-data/ potential factor in pedestrian crashes. Enforcement Systems and Their Potential for Report. Retrieved from: https://safety.fhwa.dot.gov/
fatality-analysis-reporting-system-fars. Accident Analysis & Prevention, 98, pp. Improving Pedestrian and Bicyclist Safety. speedmgt/ref_mats/fhwasa12004.
96-100. Retrieved from: https://www. Pedestrian and Bicycle Information Center.
2. National Highway Traffic Safety Administration. sciencedirect.com/science/article/abs/pii/ Chapel Hill, NC. Retrieved from: http://www. 42. Hu, W. and J. Cicchino (2019). Lowering the speed
Table 54: Persons Killed or Injured, by Person Type S000145751630361X?via%3Dihub#abst0010. pedbikeinfo.org/cms/downloads/WhitePaper_ limit from 30 to 25 mph in Boston: effects on vehicle
and Injury Severity, 2017. Retrieved from: https:// AutomatedSafetyEnforcement_PBIC.pdf. speeds. Insurance Institute for Highway Safety.
cdan.nhtsa.gov/SASStoredProcess/guest. 16. Ibid. Retrieved from: https://www.iihs.org/topics/
30. American Association of State Highway and bibliography/ref/2168.
3. World Health Organization. Global Health 17. US Department of Justice (October 2018). Transportation Officials (2010). Highway
Observatory data repository: Road traffic deaths. Contacts Between Police and the Public, 2015. Safety Manual. Retrieved from: http://www. 43. Fridman, L., Ling, R., Rothman, L. et al. (2020). Effect
Retrieved from http://apps.who.int/gho/data/node. Retrieved from: https://www.bjs.gov/content/ highwaysafetymanual.org/. of reducing the posted speed limit to 30 km per hour
main.A997. pub/pdf/cpp15.pdf. on pedestrian motor vehicle collisions in Toronto,
31. Nilsson, G. (2004). Traffic safety dimensions and Canada - a quasi experimental, pre-post study. BMC
4. National Highway Traffic Safety Administration 18. Stanford Open Policing Project. Retrieved from: the Power Model to describe the effect of speed on Public Health 20, 56. Retrieved from: https://doi.
(October 2019). 2018 Fatal Motor Vehicle Crashes: https://openpolicing.stanford.edu/findings/. safety. Traffic Engineering. Retrieved from: https:// org/10.1186/s12889-019-8139-5.
Overview. Retrieved from: https://crashstats.nhtsa. lup.lub.lu.se/search/ws/files/4394446/1693353.
dot.gov/Api/ Public/ ViewPublication/812826. 19. National Safety Council. Motor Vehicle Safety 44. National Traffic Safety Board (25 July, 2017).
pdf.
Issues: Speeding. Retrieved from: https:// Reducing Speeding-Related Crashes Involving
5. National Highway Traffic Safety Administration. injuryfacts.nsc.org/motor-vehicle/motorvehicle- 32. Tefft, B.C. (2011). Impact Speed and a Pedestrian’s Passenger Vehicles. Retrieved from: https://www.
Fatality Analysis and Reporting System. Retrieved safety-issues/speeding/. Risk of Severe Injury or Death. AAA Foundation ntsb.gov/safety/safety-studies/Documents/SS1701.
from: https:// www.nhtsa.gov/es/research-data/ for Traffic Safety. Retrieved from: https:// pdf.
fatalityanalysis-reporting-system-fars. 20. Farmer, Charles (April 2019). The effects of
aaafoundation.org/impact-speed-pedestrians-
higher speed limits on traffic fatalities in the 45. Taylor, Brian D. and Yu Hong Hwang (30 June, 2020).
risk-severe-injury-death/.
6. Ibid. United States, 1993–2017. Retrieved from: Eighty-Five Percent Solution: Historical Look at
https://www.iihs.org/api/datastoredocument/ 33. National Highway Traffic Safety Administration. Crowdsourcing Speed Limits and the Question of
7. National Household Travel Survey (2017). Number of bibliography/2188. Fatality Analysis and Reporting System. Retrieved Safety. Transportation Research Record. Retrieved
Person Trips by Mode. Retrieved from: https://nhts.
from: https://www.nhtsa.gov/es/research-data/ from: https://doi.org/10.1177/0361198120928995.
ornl.gov/ person-trips. 21. Tefft, B.C. (2011). Impact Speed and a Pedestrian’s
fatality-analysis-reporting-system-fars.
Risk of Severe Injury or Death. AAA Foundation 46. Federal Highway Administration (2012). Methods and
8. National Highway Traffic Safety Administration. for Traffic Safety. Retrieved from: https:// 34. National Highway Traffic Safety Administration Practices for Setting Speed Limits: an Informational
Fatality Analysis and Reporting System. Retrieved aaafoundation.org/impact-speed-pedestrians- (2018). Traffic Safety Facts: Pedestrians. Retrieved Report. Retrieved from: https://safety.fhwa.dot.gov/
from: https:// www.nhtsa.gov/es/research-data/ risk-severe-injury-death/. from: https://crashstats.nhtsa.dot.gov/Api/Public/ speedmgt/ref_mats/fhwasa12004.
fatalityanalysis-reporting-system-fars.
ViewPublication/812681.
22. Ibid. 47. California state law requires localities to evaluate
9. Stanford Open Policing Project. Retrieved from:
35. National Highway Traffic Safety Administration 85th percentile speeds on a given street every seven
https://openpolicing.stanford.edu/. 23. Transportation Research Board (2012). NCHRP
(2015). New Car Assessment Program years in order for the speed limit to be enforceable.
Report 600: Human Factors Guidelines for Road
10. National Traffic Safety Board (25 July, 2017). (Docket No. NHTSA–2015–0119). Retrieved According to the law, the city must identify the 85th
Systems. Retrieved from: http://onlinepubs.trb.
Reducing Speeding-Related Crashes Involving from: https://www.federalregister.gov/ percentile speed on the street and set speed limits to
org/onlinepubs/nchrp/nchrp_rpt_600second.pdf,
Passenger Vehicles. Retrieved from: https://www. documents/2015/12/16/2015-31323/new-car- the nearest multiple of five.
pp. 5-12.
ntsb.gov/safety/safety-studies/Documents/SS1701. assessment-program.
48. California Highway Patrol.Statewide Integrated
pdf. 24. American Association of State Highway and
36. Ulrich, Lawrence (12 September, 2019). S.U.V. vs. Traffic Records System. Retrieved from: http://
Transportation Officials (2001). A Policy on
11. Organisation for Economic Co-operation and Sedan, and Detroit vs. the World, in a Fight for iswitrs.chp.ca.gov/Reports/jsp/userLogin.jsp/.
Geometric Design of Highways and Streets.
Development. Road accidents. Retrieved from the Future. The New York Times. Retrieved from:
Retrieved from: https://www.bestmaterials.com/ 49. Hu, W. and J. Cicchino (2019). Lowering the speed
https://data.oecd.org/transport/road-accidents. https://www.nytimes.com/2019/09/12/business/
PDF_Files/geometric_design_highways_and_ limit from 30 to 25 mph in Boston: effects on vehicle
htm. suv-sedan-detroit-fight.html.
streets_aashto.pdf, pp. 56. speeds. Insurance Institute for Highway Safety.
12. Smart Growth America (2019). Dangerous by Design. 37. International Transport Forum (2019). Road Safety Retrieved from: https://www.iihs.org/topics/
25. National Highway Traffic Safety Administration
Retrieved from: https://smartgrowthamerica.org/ Annual Report 2019: Sweden. Retrieved from: bibliography/ref/2168.
(August 2015). Safety Facts. Retrieved from:
app/uploads/2019/01/Dangerous-by-Design-2019- https://www.itf-oecd.org/sites/default/files/
https://one.nhtsa.gov/nhtsa/Safety1nNum3ers/ 50. Fridman, L., Ling, R., Rothman, L. et al. (2020). Effect
FINAL.pdf. sweden-road-safety.pdf.
august2015/S1N_Aug15_Speeding_1.html. of reducing the posted speed limit to 30 km per hour
13. Cusick, Daniel (21 Jan, 2020). “Past Racist ‘Redlining’ 38. US Department of Transportation, Bureau of on pedestrian motor vehicle collisions in Toronto,
26. University of Pennsylvania School of Engineering
Practices Increased Climate Buden on Minority Transportation Statistics (2014). Table 2-9: U.S. Air Canada - a quasi experimental, pre-post study. BMC
(April 2015). Vehicle Stopping Distance and Time.
Neighborhoods”. E&E News. Retrieved from: https:// Carrier Safety Data [table]. Retrieved from: https:// Public Health 20, 56. Retrieved from: https://doi.
Retrieved from: https://nacto.org/wp-content/
www.scientificamerican.com/article/past-racist- www.bts.gov/archive/publications/national_ org/10.1186/s12889-019-8139-5.
uploads/2015/04/vehicle_stopping_distance_
redlining-practices-increased-climate-burden-on- transportation_statistics/table_02_09.
and_time_upenn.pdf. 51. Seattle DOT (July 2020). Speed Limit Case
minority-neighborhoods/.
39. National Civil Aviation Review Commission Archive Studies. Retrieved from: https://www.seattle.
27. Layton, Robert, and Karen Dixon (April 2012).
14. Goddard, Tara et al. (August 2015). Racial gov/Documents/Departments/SDOT/VisionZero/
Stopping sight distance. Retrieved from: https:// 40. Josephs, L (13 Feb, 2019). The Last Fatal US Airline
bias in driver yielding behavior at crosswalks. SpeedLimit_CaseStudies_Report.pdf.
cce.oregonstate.edu/sites/cce.oregonstate.edu/ Crash Was a Decade Ago. Here’s Why Our Skies are
Transportation Research Part F: Traffic Psychology files/12-2-stopping-sight-distance.pdf. Safer. CNBC. Retrieved from: https://www.cnbc. 52. Federal Highway Administration. Curb Radius
and Behaviour, 33, pp 1-6. Retrieved from: https://
com/2019/02/13/colgan-air-crash-10-years-ago- Reduction. Retrieved from: https://safety.fhwa.dot.
www.sciencedirect.com/science/article/abs/pii/ 28. National Association of City Transportation
reshaped-us-aviation-safety.html. gov/saferjourney1/library/countermeasures/09.htm.
S1369847815000923. Officials. (2013). Urban Street Design Guide. New
York, NY: Island Press.
24 25The Need NACTO City Limits
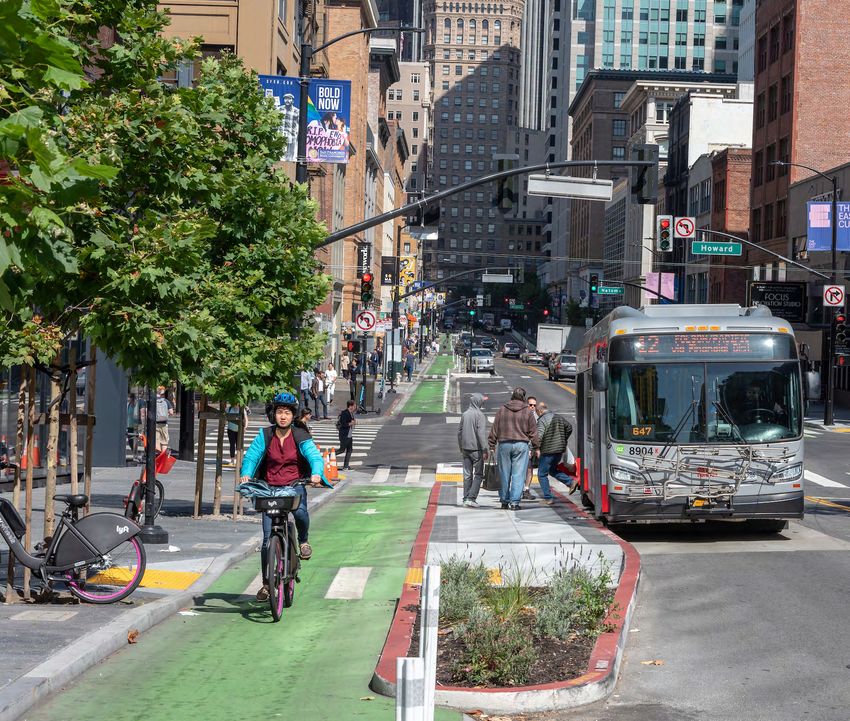
SAN FRANCISCO
Photo: SFMTA
2
The
Tools
26The Tools NACTO City Limits City Limits NACTO The Tools
Tools to Change Speed Limits Authority to Change Speed Limits
The tool or combination of tools a city uses or state legislation determines statewide
There are three primary tools for will depend on their authority to set speed speed limit setting requirements. In the
setting speed limits in urban areas. limits. In some cases, state law already absence of legislative or administrative
grants cities authority to set speed limits that requirements, city authority depends on
comply with the guidance in City Limits. In engineering practice or law at the city level.
others, state departments of transportation
Default Speed Limits* If the city has...
Set default speed limits
State-granted If possible, start by setting citywide default speed
on many streets at once.
authority to lower limits at 25 mph or below.
speed limits through
If desired or more politically feasible, set default speed
a locally-defined
limits by category of street (e.g., 25 mph on arterials, 20
process or across
mph on non-arterials).
many streets at once.
*Applicable on all streets—
major, minor, and shared Use a Safe Speed Study (see page 58) to lower speed
streets / alleys limits below the citywide or category default on high-
crash or otherwise high priority corridors. Consider using
a Safe Speed Study to evaluate a batch of similar streets
to lower speed limits on many streets of one type all at
once (e.g., local streets).
Slow Zones
Designate slow zones
in sensitive areas. Designate slow zones. Slow zones can be linear
(along a street) or cover all streets within a specific
neighborhood or business district.
If state or local legislation prevents any of the above,
but conducting Safe Speed Studies and lowering default
limits is desired, seek the authority to do so.
If the city has...
Corridor Speed Limits* Limited authority Seek a written change in practice (leveraging City
to lower speed limits Limits may help).
Set corridor speed limits on
using a locally-
high priority major streets
defined process or
using a Safe Speed Study
across many streets Request that some streets be exempt from the 85th
(see page 58).
at once. percentile requirement (e.g., streets near schools or other
sensitive areas like parks or neighborhood downtowns).
*Applicable on
major streets only
Once the authority is established, see actions above.
28 29The Tools NACTO City Limits City Limits NACTO The Tools
Combining Tools
Cities that have authority to set default speed to use a locally-defined process such as the
limits have a number of options to improve Safe Speed Study method outlined on page
safety on their streets. In some cities, setting 58, that is different from the 85th percentile
the default limit citywide is the most effective method. In some cases, cities have used this Cities can combine these proactive speed management
approach. Citywide defaults provide a uniform, same tactic to set default citywide or category- strategies to create safe conditions for their city.
predictable limit that applies everywhere. based speed limits by conducting “bulk studies”
They are relatively easy to implement and on a representative sample of similar streets in
easy to explain to the public. Citywide limits order to assess the appropriate speed for that Default
Slow Zones Limit
can be combined with slow zones and with category of street.
EXAMPLE COMBINATION: CITY A (e.g., schools, Priority
corridor limits on specific corridors to address
conditions where a speed lower than the
In the states where jurisdictions must set speed
limits on most streets based on 85th percentile City A has explicit authority to set default
parks)
25 Corridors
citywide default is necessary. MPH
In cities where there is clear differentiation
speeds, some cities have requested exemption
from using the 85th percentile for specific streets
speeds and has chosen to set a citywide
default limit of 25 mph on all streets. In
20 20
MPH MPH
between major arterial streets and local or (for example, streets identified in a high-injury addition, they have identified a few high-
minor streets, cities may choose to set speeds network analysis). In these places, robust crash, crash corridors and have set 20 mph corridor
by street type or category. Category-based fatality, and injury data collection is particularly limits on those streets to reduce fatalities
limits allow cities to address significantly important to make the case for exemptions. and injuries. They also have established 20
different street contexts but still create mph slow zones in key areas around schools
In almost all states, cities have authority to or parks to provide additional protection for
a predictable regulatory environment for
create school slow zones. For example, in children.
drivers. Like citywide defaults, category-based
California, which codifies the use of the 85th
defaults can be combined with slow zones and
percentile method to determine and enforce
with corridor limits on specific streets.
speed limits on streets across the state, the
Category 1: Category 2:
In some states, cities do not have explicit Vehicle Code allows all local jurisdictions to EXAMPLE COMBINATION: CITY B Arterial Non-Arterial
authority to set their own default speed limits. lower speeds in school zones that meet specific
These cities have different playbooks for criteria. In 2019, Sacramento used this authority City B has explicit authority to set default
aligning speed limits with their safety goals. to reduce speed limits from 25 to 15 mph on 225 speed limits and has clear differentiation 25 20
street segments across the city, even without between major or arterial streets and minor MPH MPH
In states where the process for engineering
the explicit authority to reduce default speeds or local streets. They have chosen to set
studies is not codified in state law or practice,
citywide. category speed limits at 25 mph for arterials
cities have asked for (or assumed) permission
and 20 mph for non-arterials. Like City A,
they may choose to also establish slow zones
in key areas.
SACRAMENTO
EXAMPLE COMBINATION: CITY C Category 1: Category 2: Priority
Residential Arterial Streets
City C does not have explicit authority to
set default speeds. The state requires a
speed study but does not lay out an explicit
20 25 20
MPH MPH MPH
process. They have chosen to conduct a
bulk engineering study and to use a locally-
defined process for setting speeds by street
category. At the same time, using authority
to set speed limits on a case-by-case basis,
Photo: City of Sacramento
they have conducted a Safe Speed Study to
determine appropriate speed limits for a few
priority corridors.
30 31The Tools NACTO City Limits City Limits NACTO The Tools
RECENT NOTABLE
LEGISLATIVE CHANGES OREGON MINNESOTA
Implementing the speed limit tools Oregon (Senate Bill 558) allows all cities in Minnesota Statute (Section 169.14, Subd. 5h - Speed
recommended in this guidance may require the state to establish a 20 mph speed limit limits on city streets) allows cities to establish
state-level legislative permission. A growing on all non-arterial streets in residence speed limits on city streets based on the city’s safety,
group of US states have passed legislation districts under city jurisdiction. Rule 734- engineering, and traffic analysis. Speed limits must be set
granting cities the flexibility to set safer 020-0015 allows the use of 50th percentile in a consistent and understandable manner.
speed limits. These supportive policies studies instead of 85th percentile studies
generally take one of two forms: on non-residential streeets.
Authority to set context-
sensitive speed limits using
a locally-defined process.
Several states have passed laws that
enable cities to create, adopt, and utilize
an approach for setting urban speed limits
that places safety as the top priority. Cities
that leverage this authority do so in different
ways, often by lowering default limits on MASSACHUSETTS
some or all streets and also by updating
local engineering guidance to redefine Massachusetts (MGL c. 90 § 17C) allows
speed study procedures. “thickly settled” cities and towns to adopt a
WASHINGTON STATE 25 mph default speed limit by ordinance for
all streets unless otherwise posted. Cities and
Washington State has two pieces of towns can also set 20 mph safety zones, which
enabling legislation that, together, allow they can use their own criteria to create.
cities to set safe speed limits:
RCW 46.61.415 allows local agencies to
establish/alter maximum limits on local
streets. NEW YORK STATE
Authority to reduce default
New York State Assembly Bill 10144/Senate
speed limits. WAC 468-95-045 is a modification to
Bill 7892 amended section 1642 of the Vehicle
the State MUTCD that provides local
Some states have passed laws that explicitly and Traffic Law to allow New York City to set a
jurisdictions with considerations about
allow cities to lower their default citywide speed limit of 25 miles per hour, down from 30
what requirements they need to meet to
speed limits (e.g., from 30 mph to 25 mph) or mph, on streets that are not part of the State
revise the posted speed limit.
speed limits on a specific category of streets highway system. This was followed by NYC
(e.g., “residential streets” at 20 mph). Local Law 54 of 2014, which enacted a citywide
speed limit of 25 mph unless otherwise posted.
32 33The Tools NACTO City Limits City Limits NACTO The Tools
Case Studies
POLICY HURDLES
A city’s ability to change speed limits is impacted by rules and practices around
enforcement, signage, and design requirements.
in Lowering Speed Limits
NEW YORK
Enforcement
A city’s ability to enforce the posted speed limit depends on whether
speed limits in the state are Absolute, Prima Facie, Basic Speed Law,
or a combination of the three. When drivers are ticketed in a state
with absolute speed limits, the ticket will typically stand on face
value. In states with prima facie, or presumed, speed limits, drivers
Photo: Logan Hicks
can contest tickets in court on the basis that their speed was safe for
the conditions. In basic speed law states, drivers are required only to
travel at a safe speed, regardless of the posted speed limit. A growing Recognizing the importance of lowering speed limits to improve safety, a number of cities
body of evidence shows that drivers respond to posted speed limits have successfully amended their speed limits in recent years. The four cities highlighted
even without changes to enforcement; cities may want to make speed below present interesting lessons learned for other municipalities looking to lower speed
limit changes even when enforcement is difficult. limits on their streets.
Signage SEATTLE
In some states, a city must install a sign on every block if the posted
In 2016, Seattle lowered its default speed limit from 25 to 20 mph on neighborhood streets
speed limit is anything other than the citywide default. This is feasible
and from 30 to 25 mph on arterials. The City has also begun to reduce speed limits within
when the city lowers the limit on a small number of segments, but
urban villages, where lots of people walk, bike, drive and use transit.
becomes prohibitively expensive at a large scale (e.g., across all
residential streets). Resources: Seattle DOT Speed Limits Website, Seattle DOT Blog
NEW YORK CITY
Design
In some states, cities must implement physical design changes to In 2014, New York City lowered its default citywide speed limit from 30 to 25 mph, which
streets in order to justify lower speed limits. Requiring engineering complemented a Neighborhood Slow Zone program implemented in 2011.
changes before cities can change the posted limit can make it difficult
Resources: 2014 NYC Vision Zero Action Plan, Borough Pedestrian Safety Action Plans,
for cities to change speed limits on a large number of streets because
Families for Safe Streets
of the cost. Other cities must reduce speed limits before they can
make design changes, since the design speed is set in relation to the
posted speed on a given street. CAMBRIDGE
In 2016, the City of Cambridge lowered its default citywide speed limit from 30 to 25 mph. In
the years since, Cambridge has leveraged authority to further reduce speed limits to 20 mph
in Safety Zones to reduce speed limits to 20 mph on nearly every street in the city.
Resources: City of Cambridge Speed Limits Website
PORTLAND
In 2018, Portland lowered the default speed limit on residential streets from 25 mph to 20
mph. This change complements 20 mph speed limits in business districts.
Resources: Portland Bureau of Transportation Speed Limits Website, 50th Percentile
Allowance on Non-Residential Roads
34 35You can also read