Abbotsford City Centre and Historic Downtown Commercial Market Study - For: City of Abbotsford
←
→
Page content transcription
If your browser does not render page correctly, please read the page content below
Abbotsford City Centre and Historic
    Downtown Commercial Market Study

                For: City of Abbotsford

February 2017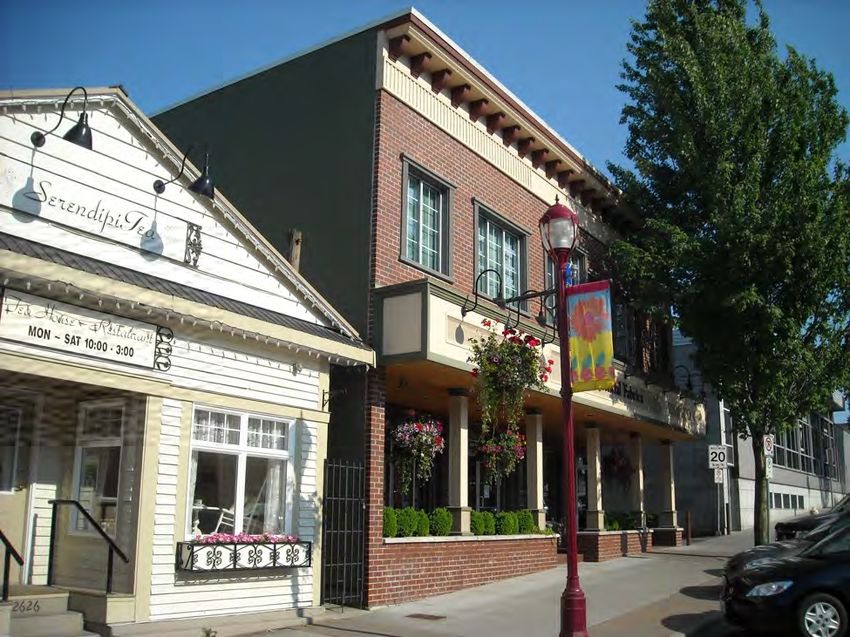
C i t y C e n t r e & H i s t o r i c D o w n t o w n C o m m e r c i a l S t u d y | ii

                     THIS PAGE LEFT INTENTIONALLY BLANK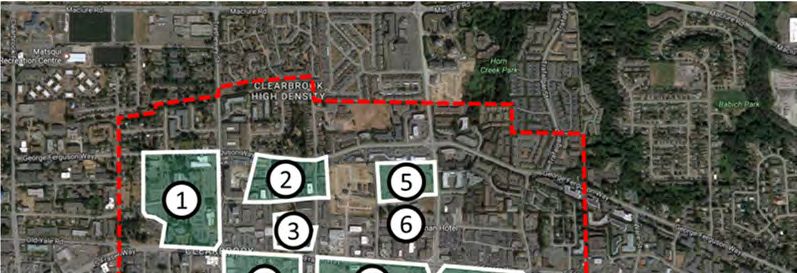
C i t y C e n t r e & H i s t o r i c D o w n t o w n C o m m e r c i a l S t u d y | iii

Executive Summary

This report has identified the trends and factors that govern the market for commercial
space in Abbotsford’s City Centre and Historic Downtown. The two neighbourhoods
have very different strengths and weaknesses, but both serve unique roles within
Abbotsford’s economic landscape:

      •     The City Centre is the City’s main commercial hub. It has three large malls and
            several standalone anchors, which allow it to draw spending from across the
            City. Its retail market is strong, although its office market is overbuilt and in low
            demand at present. Although its retail sector is thriving, it is also highly generic
            and unspecialized, which leaves it vulnerable to competition from new space
            throughout the City. Its urban design is not conducive to walking, which may
            stunt its growth in the long run.

      •     The Historic Downtown is a popular shopping district because of its unique urban-
            style design and comfortable public realm. It is attractive to small locally owned
            businesses both in the retail and office sectors, and space in the Historic
            Downtown is in demand. Although its urban design is good, it could still be
            improved on Essendene Avenue and around Jubilee Park. More residential
            development, more restaurants and entertainment, and eventually a grocery
            store anchor would help the area fulfill its potential.

Within this overall context, GPRA projects demand for the following commercial uses in
the Study Areas according to the following timeline:

Demand Summary for the City Centre (Additional per period)
                            2017 – 2020    2021 – 2025    2026 – 2030    2031 – 2035    2036 - 2040
    Retail Total             17,800 ft2     47,900 ft2     79,500 ft2     135,800 ft2    171,600 ft2
    Convenience Retail       17,800 ft2     40,400 ft2     61,800 ft2     72,300 ft2     85,600 ft2
    Comparison Retail           0 ft2          0 ft2          0 ft2       42,600 ft2     56,600 ft2
    Restaurants &
                                0 ft2        7,500 ft2      17,700 ft2    20,900 ft2     25,100 ft2
    Entertainment
    Auto-Related                0 ft2          0 ft2          0 ft2          0 ft2       4,300 ft2
    Office Total1               0 ft2           1,951 – 16,700 ft2          101,857 – 105,200 ft2
    Accommodation
                              0 rooms        0 rooms        0 rooms       0 rooms       100 rooms
    Total

1In the office category, the 2021 – 2030 category actually refers to 2021 – 2031
demand, and the 2031 – 2040 actually refers to 2032 – 2041, arising from the City
employment estimate used.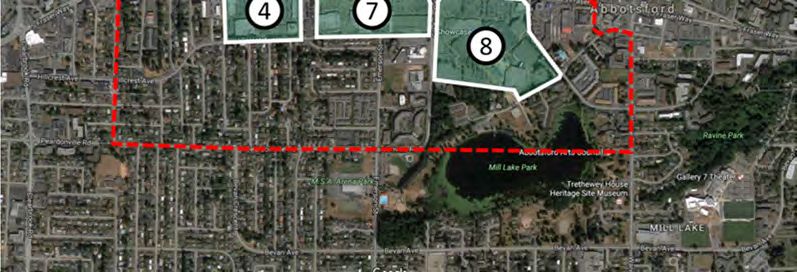
C i t y C e n t r e & H i s t o r i c D o w n t o w n C o m m e r c i a l S t u d y | iv

Demand Summary for the Historic Downtown (Additional per period)
                         2017 – 2020    2021 – 2025    2026 – 2030   2031 – 2035    2036 - 2040
    Retail Total          12,500 ft2      9,700 ft2     38,500 ft2    49,400 ft2     55,500 ft2
    Convenience Retail      0 ft2         1,100 ft2     15,000 ft2    17,900 ft2     21,600 ft2
    Comparison Retail       0 ft2           0 ft2        7,700 ft2    12,700 ft2     11,300 ft2
    Restaurants &
                           12,500 ft2    8,600 ft2      13,800 ft2    16,400 ft2     19,800 ft2
    Entertainment
    Auto-Related             0 ft2         0 ft2         2,000 ft2    2,400 ft2       2,800 ft2
    Office Total2            0 ft2          34,000 – 44,400 ft2          51,600 – 53,200 ft2
    Accommodation
                           0 rooms      100 rooms        0 rooms      0 rooms         0 rooms
    Total

The Historic Downtown exhibits a present shortage of restaurant and entertainment
uses, and the City Centre could support additional convenience retail in the next four
years. Starting in the 2021 – 2025 period, additional convenience and comparison retail
will both be supportable in the Historic Downtown as well as auto-related retail
(although this type of commerce is unlikely to suit the neighbourhood from a planning
or design perspective, and GPRA does not recommend encouraging it). In the City
Centre, new comparison retail uses will not be needed until the early 2030s, as the
neighbourhood’s three large malls more than accommodate this type of vendor. No
additional demand for auto-related commercial space is anticipated in the City
Centre.

About 18,000 additional ft2 of commercial space is supportable in the City Centre in the
next four years, mostly in the convenience retail category. After that present need is
met, demand for new space will rise to about 48,000 ft2 in the 2021 – 2025 period (made
up of convenience retail and restaurant and entertainment space) before
accelerating continuously over the next 15 year as a consequence of population and
income growth.

In the Historic Downtown, about 12,500 ft2 of restaurant and entertainment space is
called for in the next four years. After this gap is met, about 10,000 ft2 of space will be
needed in the 2021 – 2025 period of a mix of types. This number is expected to rise to
about 38,500 ft2 in the 2026 – 2030 period, and continue rising over the next ten years as
Abbotsford grows.

In terms of office space, the City Centre is quite overbuilt, and will only require up to
17,000 ft2 before 2030, but in the following 15 years will require more than 100,000 ft2,
demand having caught up with the present surplus. By comparison, the Historic
Downtown is expected to require more office space much sooner. GPRA projects

2In the office category, the 2021 – 2030 category actually refers to 2021 – 2031
demand, and the 2031 – 2040 actually refers to 2032 – 2041, arising from the City
employment estimate used.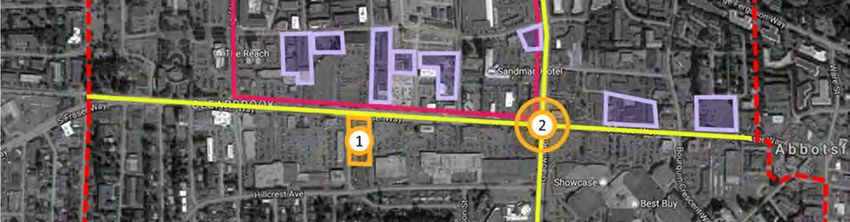
City Centre & Historic Downtown Commercial Study |v

demand for up to 44,000 ft2 of office space before 2030, but only about 53,000 ft2 of
new space in the following 15 years, the Historic Downtown being small and with lower
overall employment than the City Centre.

Finally, GPRA projects demand for one new hotel of about 100 rooms (although this is
likely to be quite flexible) in each of the Study Areas. The Historic Downtown is likely to
be ready for a new hotel before the City Centre, so GPRA has placed the former in the
2021- 2025 period, and the latter in the 2036 – 2040 period.

Although addressing future supportable retail outside of the Historic Downtown and the
City Centre is outside of this report’s scope, it is important to acknowledge that
development outside of the Study Area can profoundly affect the vitality of retail in the
City Centre and the Historic Downtown.

While Abbotsford has limited influence on many internal and external growth factors,
the City does have the power to restrict major new retail projects outside of the Study
Areas and concentrate future development around existing retail nodes. This report
acknowledges that a number of convenience-oriented retail nodes will likely be
necessary as Abbotsford’s population grows over the next 25 years, but if the City
wishes to strengthen existing retail centres such as the Historic Downtown and the City
Centre it is important not to dilute the competitive landscape with power centres and
shopping centres that draw consumer spending.

Decisions to limit comparison big box & shopping centre development may be fiscally
painful in the short-term but will promote long term vitality of the Study Areas.
C i t y C e n t r e & H i s t o r i c D o w n t o w n C o m m e r c i a l S t u d y | vi

Table of Contents
Executive Summary ...................................................................................................................... iii
1     Introduction ............................................................................................................................ 1
    1.1       Project Overview .......................................................................................................... 1
    1.2      Geographical Terminology .......................................................................................... 2
      1.2.1          Study Areas............................................................................................................. 2
      1.2.2          Neighbourhoods ................................................................................................... 3
2     Abbotsford City Centre and Historic Downtown .............................................................. 4
    2.1      Overall trends and factors ............................................................................................ 4
    2.2      The City Centre .............................................................................................................. 5
      2.2.1         City Centre Description ......................................................................................... 5
      2.2.2         City Centre Forces and Trends ............................................................................. 7
    2.3      The Historic Downtown .................................................................................................. 8
      2.3.1         Historic Downtown Description ............................................................................. 8
      2.3.2         Historic Downtown Forces and Trends ............................................................... 10
      2.3.3          Barriers to Commercial Development in the Historic Downtown ................. 12
3      Retail and Service Commercial ....................................................................................... 14
    3.1      Trends and Factors in Study Area Commercial Space .......................................... 14
    3.2      Definition and types of retail and service commercial .......................................... 15
    3.3      Existing retail and service commercial ..................................................................... 16
    3.4      Retail and Service Commercial Projection .............................................................. 27
4      Office ................................................................................................................................... 48
    4.1      Trends and Factors in the Office Market .................................................................. 48
      4.1.1          The Abbotsford Office Market ........................................................................... 48
      4.1.2          The City Centre Office Market........................................................................... 49
      4.1.3          The Historic Downtown Office Market .............................................................. 49
    4.2      Current Office Inventory ............................................................................................. 50
    4.3      Office Demand Projection ......................................................................................... 54
      4.3.1         Employment Projection ....................................................................................... 54
      4.3.2          Current Office Employment ............................................................................... 55
      4.3.3          Abbotsford Office Demand Projection ............................................................ 56
      4.3.4          Study Area Office Demand Projection ............................................................ 57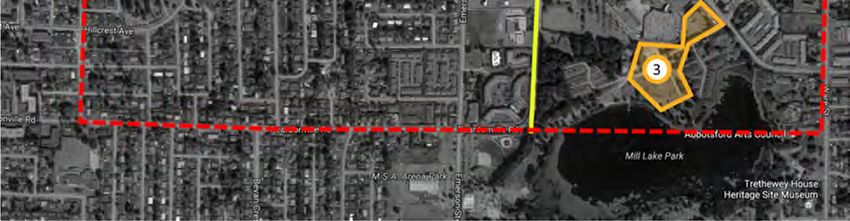
C i t y C e n t r e & H i s t o r i c D o w n t o w n C o m m e r c i a l S t u d y | vii

5     Hotel ...................................................................................................................................... 59
    5.1       Abbotsford Accommodation Supply ...................................................................... 59
    5.2       Trends and Factors in the Accommodation Market ............................................. 61
      5.2.1          Bed & Breakfasts in Abbotsford ......................................................................... 61
      5.2.2          Hotels in Abbotsford ............................................................................................ 61
      5.2.3          Hotels in the Study Areas .................................................................................... 62
      5.2.4          Online Accommodation Websites.................................................................... 62
    5.3       Abbotsford Accommodation Demand Projection ............................................... 63
6     Best Practices in Downtown Planning ............................................................................. 68
    6.1       Urban Design ............................................................................................................... 68
    6.2       Market Dynamics ........................................................................................................ 69
    6.3       Business Mix .................................................................................................................. 70
    6.4       Consistent and Engaged Leadership ...................................................................... 71
7     Opportunities for Development and Improvement ...................................................... 72
    7.1       Commercial Demand Projection Summary............................................................ 72
    7.2       Development and Improvement in the City Centre ............................................. 74
      7.2.1          Developable Land in the City Centre .............................................................. 74
      7.2.2          Other Improvements in the City Centre ........................................................... 75
    7.3       Development and Improvement in the Historic Downtown ................................ 76
      7.3.1          Developable Land in the Historic Downtown ................................................. 77
      7.3.2          Other Improvements in the Historic Downtown .............................................. 78
    7.4       Policy Outside of Study Areas ................................................................................... 79
8     Conclusion .......................................................................................................................... 80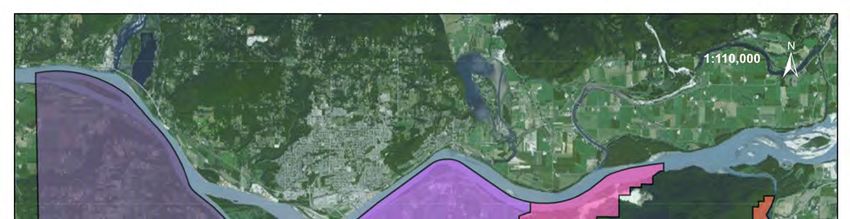
City Centre & Historic Downtown Commercial Study |1

1              Introduction

1.1            Project Overview

G. P. Rollo & Associates (GPRA) has been retained by the City of Abbotsford (the City)
to complete a Commercial Market Study of the Historic Downtown and City Centre
(the Study Areas) with the aim of assessing the current supply and projected demand of
commercial uses (retail, service commercial, office, entertainment and tourism uses) in
each area to assist in the planning of these areas. As part of this study, GPRA has:

    •    Assessed commercial development trends, constraints, and opportunities for new
         and revitalized commercial development in the Historic Downtown and City
         Centre neighborhoods

    •    Provided an accurate GIS-based and -illustrated inventory of commercial space
         which has allowed detailed analysis and understanding of the supply of
         commercial space in these two neighbourhoods, and has been combined with
         a City-provided population projection to produce a commercial demand
         forecast for each

    •    Created an inventory of office space covering all of Abbotsford, including the
         Study Areas, with the aim of understanding their importance and role within
         Abbotsford’s office market. Informed by a City-provided employment projection
         as well as numerous interviews with stakeholders such as realtors and developers,
         GPRA then used this inventory to create an office demand projection for the
         Study Areas

    •    Analyzed Abbotsford’s supply of accommodation businesses such as hotels, inns,
         and bed & breakfasts, including interviews with staff representatives of most
         large accommodation operations, and used this information to create an
         accommodation demand projection for Abbotsford, with commentary on its
         implications for the Study Areas

    •    Provided analyses and recommendations on land use and urban design that are
         market-driven.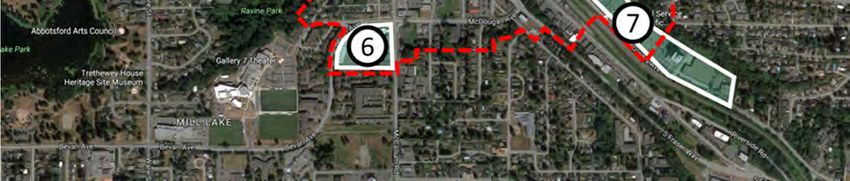
City Centre & Historic Downtown Commercial Study |2

1.2           Geographical Terminology

 “Study Area” and “Neighbourhood” are two terms that will be frequently referred to
throughout this report, especially in Section 3. The Study Areas, or the focus of this study,
are the City Centre and the Historic Downtown. It is important to note that although
these two study areas share the same name as two of Abbotsford’s Neighbourhoods,
they share fundamentally different purposes.

1.2.1         Study Areas

Study Areas refer to the geographical extent or boundaries of the focus of this study.
These areas contain some of Abbotsford’s most vibrant commercial areas. In the 21st
Century commercial nodes of the magnitude seen in both Study Areas can rarely be
sustained on the local community alone, and therefore rely on spending inflow from
varying distances that can range from neighbourhood (e.g. convenience store), city-
wide (e.g. home improvement store) to even state or province wide (e.g. super
regional mall such as Metropolis at Metrotown).

The City Centre and Historic Downtown Study Areas are both contained within their
respective Neighbourhoods, as can be seen in Figure 1.

Figure 1: Location of Study Areas within central Abbotsford neighbourhoods
City Centre & Historic Downtown Commercial Study |3

Commercial districts across Abbotsford exert a varying degree of competitive influence
on the two Study Areas. This competitive influence is factored into this report, however
market demand for commercial growth outside of the two Study Areas is not explored
in detail.

1.2.2        Neighbourhoods

Neighbourhoods refer to each of the 20 neighbourhoods as identified by the City of
Abbotsford, as shown in Figure 2. For the purpose of this exercise, neighbourhoods serve
a primarily demographic function. Neighbourhoods are used to estimate current and
future demographics, including population, income, and retail expenditures. The
importance of this demographic data is to project where retail expenditures in the
Study Areas are sourced from and allows the forecast of retail demand.

Figure 2: City of Abbotsford neighbourhoods
City Centre & Historic Downtown Commercial Study |4

2            Abbotsford City Centre and Historic Downtown

This section defines and describes the two Study Areas after commenting on the
general trends and factors that govern commercial development in Abbotsford.

2.1          Overall trends and factors

With a 2016 Census population of 141,397, the City of Abbotsford is the fifth most
populous city in British Columbia, and the most populous city outside of Metro
Vancouver. It is the most populous municipality in the Fraser Valley Regional District
(FVRD), which is the third most populous region in British Columbia after Vancouver and
Victoria. Abbotsford makes up about 47% of the District’s population.

Abbotsford and the FVRD are immediately to the east of Metro Vancouver, and play
an important role as the “next stop” along the Trans-Canada Highway. Consequently,
of the non-residents who visit Abbotsford, most stay near Highway 1 and this corridor
has emerged as the primary location for hotels. Beyond mere Highway proximity, other
activities that bring visitors to Abbotsford include government-related travel, sporting
events, concerts and performances (mostly at the Abbotsford Centre) and a growing
assortment of festivals and celebrations such as the Tulip Festival in April and the
Downtown Christmas Tree Lighting in November. The Fraser Valley Trade & Exhibition
Centre (Tradex) is another important event venue. In general, stakeholders such as
hotel staff, bed & breakfast operators, and property developers acknowledge that
Tourism Abbotsford has done a good job of attracting events to the City, and that the
overall impact of this effort has been positive.

Although it is growing, the impact of visitor spending on Abbotsford’s commercial
sectors remains small. Most spending in Abbotsford is by Abbotsford residents, and
therefore the pace of commercial development in the City has been tied to residential
growth, a dependency which is expected to continue. Residential development in
Abbotsford is in turn tied to the residential market trends of British Columbia’s other
regions, most notably Metro Vancouver where an ongoing housing shortage has
increased residential prices beyond the reach of many residents, driving growth
outward, including to the Fraser Valley. For many young people and young families in
particular, ownership of a detached house has become unachievable within Metro
Vancouver, so purchasing a home in Abbotsford is an attractive alternative. This
dynamic has been a key engine of growth in Abbotsford in the last several years,
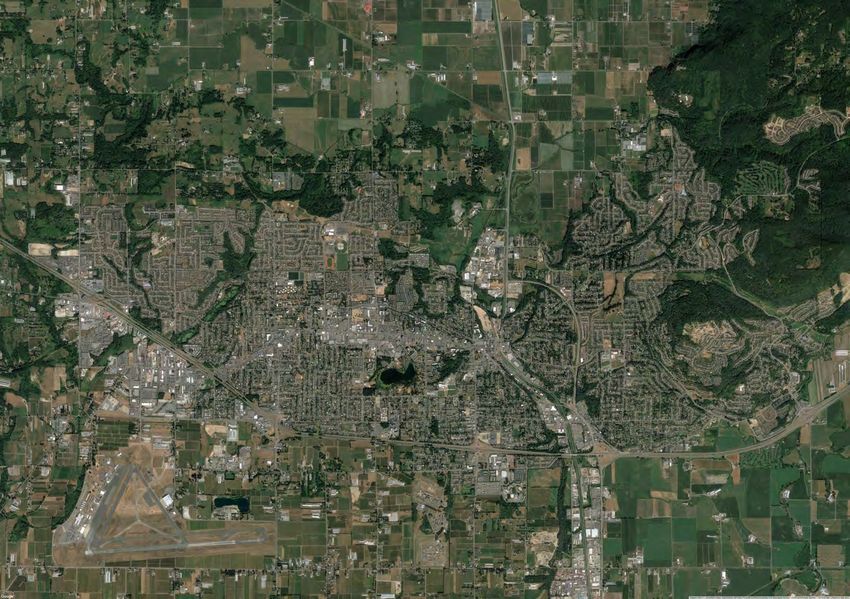
City Centre & Historic Downtown Commercial Study |5

although with recent changes to the Province’s foreign purchasing3 and first-time
homebuyer lending practices4, the near future of the housing market is unclear.

However the market develops in the immediate future, the long-term trend of
residential development in Abbotsford is cyclical. With successive waves of
development, Abbotsford will densify and mature, making more specialized
commercial operations viable.

2.2           The City Centre

2.2.1         City Centre Description

Figure 3: The City Centre (see next page for key)

3Effective 2 August 2016, a 15% additional transfer tax is applicable to purchases of
residential properties in Metro Vancouver by foreign entities.
See Ministry of Finance (2016). Additional Property Transfer Tax on Residential Property
Transfers to Foreign Entities in the Greater Vancouver Regional District.
http://www2.gov.bc.ca/assets/gov/taxes/property-taxes/property-transfer-tax/forms-
publications/is-006-additional-property-transfer-tax-foreign-entities-vancouver.pdf
4 Effective 16 January 2017, a loan of up to 5% of the home’s price is available to first-
time homebuyers in British Columbia under various conditions.
See British Columbia Housing Action (2017). B. C. Home Owner Mortgage and Equity
Partnership. https://housingaction.gov.bc.ca/tile/home-owner-mortgage-and-equity-
partnership/
City Centre & Historic Downtown Commercial Study |6

Abbotsford’s City Centre (shown in Figure 3 in red) is the roughly rectangular area
bordered approximately by Peardonville Road and Mill Lake to the south; Ware Street,
Mill Lake Road, and Horn Street to the east; Parkview Street and Tims Street to the west;
and to the north by a line running between and roughly parallel to George Ferguson
Way and Maclure Road.

The neighbourhood is centred on South Fraser Way which is its commercial backbone
and main thoroughfare, and contains:

   •    Abbotsford’s civic core (indicated as point 1 in Figure 3), including:
          o Abbotsford City Hall
          o Abbotsford Court Services
          o Abbotsford School District
          o Abbotsford Police Department
          o Abbotsford Fire Department
          o Clearbrook Library
          o The Reach Museum
          o ICBC Claim Centre

   •    Three major malls to the south of South Fraser Way:
           o Clearbrook Town Square (indicated as point 4 in Figure 3)
           o West Oaks Mall (indicated as point 7 in Figure 3)
           o Sevenoaks Shopping Centre (indicated as point 8 in Figure 3)

   •    A number of major retailers to the north of South Fraser Way such as:
           o Canadian Tire (indicated as point 3 in Figure 3)
           o Real Canadian Superstore (indicated as point 5 in Figure 3)

   •    A community services and health hub centred on Cruickshank Street between
        George Ferguson Way and Simon Avenue (indicated as point 2 in Figure 3)

   •    Numerous other restaurants, retailers, offices, and a Sandman Hotel (indicated as
        point 6 in Figure 3)

   •    Many residential properties in a range of typologies and ages.

As such, the neighbourhood is among Abbotsford’s most important commercial
centres, and offers goods and services of every kind. It is a successful commercial
neighbourhood because it is central and accessible to most of Abbotsford, and
specializes in large “national” retailers and restaurant chains as well as a surplus of well-
tenanted mall space with an abundance of parking. It primarily serves Abbotsford
residents rather than through-traffic.
City Centre & Historic Downtown Commercial Study |7 2.2.2 City Centre Forces and Trends The City Centre exhibits a car-oriented built form that privileges certain kinds of activities and development (malls, big box retailers, chain restaurants, etc.) while discouraging others (walkable development, density, mixed-use, etc.). This is expected to remain true for many years, although small interventions to improve the pedestrian realm are possible, most notably beautification and improvements to street lighting for safety. As is discussed in Section 3, the City Centre exhibits a retail and service commercial vacancy rate of about 5.4%, which is within the normal range of 5% - 8%, and suggests a thriving commercial neighbourhood. Although this is the case, GPRA’s interviews with developers and realtors suggest that little to no new space is currently needed, at least for several years. One developer reports that they recently sold two commercial lots across the street from City Hall after more than a year of looking for a purchaser. Similar reports from other realtors and developers suggest that there is no pressing need for new development, although more demand will emerge as Abbotsford grows. Unlike the Historic Downtown (which is discussed in Section 2.3), the City Centre serves a generalized rather than specialized commercial role, and is therefore sensitive to competing commercial development elsewhere in the City. As such, large developments in other parts of Abbotsford may threaten its commercial vibrancy or at least slow its commercial growth. In fact, this has already occurred in the office sector, as discussed in Section 4. When demand does emerge, it is likely to seek out affordable land to the north of South Fraser Way where lots are smaller and more fragmented, and where the existing supply of buildings is older and nearer to the end of its economic life. By comparison, the area to the south of South Fraser Way is more fully developed and currently occupied by three successful malls. Unlike the Historic Downtown, realtors and developers report that there is developable land available in the City Centre, although much of the area’s most attractive land has already been developed and therefore development should not be expected to occur rapidly even under ideal market conditions. Although land is available, realtors report that land costs are often prohibitively high due to speculation regarding residential towers on South Fraser Way. Although the concrete tower built form is not yet viable in this location, many land owners believe that it might be. This causes a psychological effect that keeps some developable land beyond the reach of commercial rents. Realtors and developers report that there are no other barriers to commercial development in the City Centre beyond those identified above, and that the City’s
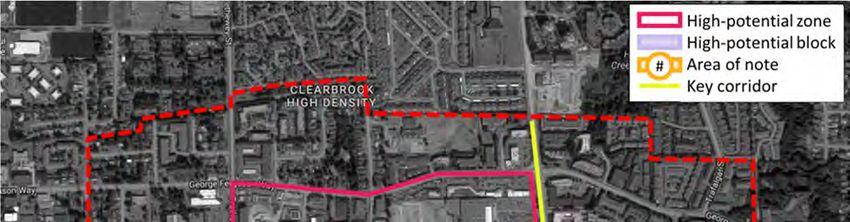
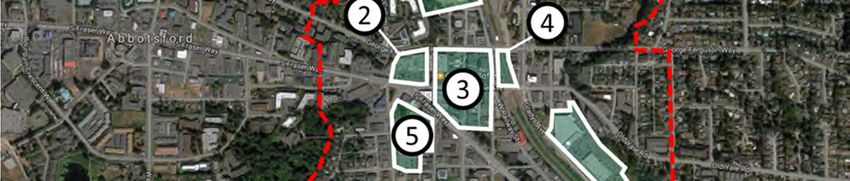
City Centre & Historic Downtown Commercial Study |8

policies are favourable to development. It is therefore expected that more
development will occur in time.

2.3          The Historic Downtown

2.3.1        Historic Downtown Description

Figure 4: The Historic Downtown (see next page for key)

Abbotsford’s Historic Downtown (shown in Figure 4 in red) is the area bordered
approximately to the north by Morey Avenue and the green belt south of the Gateway
Christian Reformed Church; to the east by green belt west of Sheffield Way, George
Ferguson Way, and Park Drive; to the west by McCallum Lane, Ravine Park, Cannon
Avenue, and Bevan Avenue; and to the south by a jagged line capturing both the
Correctional Services of Canada building on Gladys Avenue and the Fabricland strip
mall on Bevan Avenue and McCallum Road.

The neighbourhood is centred on four blocks of high-density urban-style commercial
space (bounded by George Ferguson Way to the north, West Railway Street & Montvue
Avenue to the east, Gosling Way and South Fraser Way to the south, and Pauline Street
to the west), which act as the neighbourhood’s commercial and cultural core
(indicated as point 3 in Figure 4). These four blocks (which GPRA calls “the Downtown
Core”) are the location most commonly associated with the name “Historic Downtown”
in the minds of stakeholders, and they provide Abbotsford’s most walkable commercial
City Centre & Historic Downtown Commercial Study |9

environment which has proven ideal for restaurants, cafés, book stores, food stores,
spas, kitchen and home furnishing stores, dance studios, and other establishments
generally associated with downtown areas.

The Historic Downtown also contains:

   •    A City-owned parking lot adjacent to the Downtown Core, on the east side of
        West Railway Street, between George Ferguson Way and Essendene Avenue
        (indicated as point 4 in Figure 4)

   •    A swath of developable land of about 17 acres to the north of the Downtown
        Core, the former Clayburn Brick Factory (indicated as point 1 in Figure 4)

   •    A zone with a good location but facing socio-economic challenges (indicated
        as point 5 in Figure 4), which includes:
           o Jubilee Park
           o A City-owned parking lot
           o Travelodge Abbotsford

   •    A string of large-footprint office and thrift retail uses, all with significant amounts
        of parking, in a car-dependent section of Gladys Avenue near the Historic
        Downtown’s southeast corner (indicated as point 7 in Figure 4), including:
            o The Mennonite Central Committee (MCC) Thrift Store complex
            o Canada Post office building
            o Correctional Services of Canada office building
            o The former grain elevator office building
            o An office building at 34079 Gladys Road
            o The Salvation Army complex.

   •    Two under-utilized strip malls, each with at least 25% vacancy (which is well
        beyond the healthy range of 5% - 8%):
           o One immediately to the west of the Downtown Core, anchored by a
              Dollar Tree and a branch of Sprott Shaw College (indicated as point 2 in
              Figure 4)
           o One in the Historic Downtown’s southwest corner, anchored by a
              Fabricland and SKT Farm Market (indicated as point 6 in Figure 4)

And throughout the area that surrounds the Downtown Core, the following uses are
common:

   •    Government and social services
   •    Small and medium-sized strip malls, most of them old
   •    Small restaurants and retail operations
   •    Single family homes and multi-family residential buildings.
C i t y C e n t r e & H i s t o r i c D o w n t o w n C o m m e r c i a l S t u d y | 10 2.3.2 Historic Downtown Forces and Trends The Historic Downtown uses its built form well: it is walkable and has comfortable building heights and block lengths as well as good overall urban design. It is both central and accessible to the City as a whole, making it an attractive destination. Although it is now considered successful by most of the stakeholders interviewed by GPRA, the Historic Downtown was not always so vibrant. Realtors and developers report that 10 years ago the Downtown Core was aging poorly, had little street life, and attracted only the most cost-sensitive tenants. Since then it has been refurbished, renovated, and revitalized. This process is ongoing, with four or five buildings currently under renovation. Figure 5: A renovated building in Historic Downtown According to GPRA’s interviewees, this transformation is largely the result of a community of local entrepreneurs who believe in the neighbourhood’s potential and have invested in it through renovation (see Figure 5 for an example), opening small businesses, and participating in the Downtown community. This cohort is made up of people aged 30 – 50, many of whom are starting small businesses for the first time. Some
C i t y C e n t r e & H i s t o r i c D o w n t o w n C o m m e r c i a l S t u d y | 11

grew up in the Fraser Valley and are now returning from elsewhere, either to start
families or for other personal reasons. Others simply see Abbotsford as good place to
establish themselves and their careers. It is a diverse and enthusiastic group, and the
City should continue to leverage it to drive positive change in the Historic Downtown.

This surge of local enthusiasm has positively impacted the Historic Downtown from a
commercial perspective, but growth and change in the area has also been aided by
successful City policies. Developers report that the Historic Downtown Revitalization Tax
Exemption5 and cash-in-lieu of parking policy6 have both been critical in enabling
development by rendering projects more financially viable. Tourism Abbotsford’s efforts
to attract events have also been successful at bringing people to the Historic
Downtown, which has been noticed and appreciated by local business owners. In
summary, the City’s focus on the Historic Downtown has paid off, resulting in a good
relationship between the City and the Abbotsford Downtown Business Association, at
least according to one developer.

The Downtown Core is trendy and appealing to many businesses. According to one
realtor, this has resulted in a lower commercial vacancy rate for the Historic Downtown
than in Abbotsford generally. Although this may be true for the Downtown Core in
particular, GPRA’s commercial inventory (see Section 3) reveals that the Historic
Downtown actually has a very high retail vacancy rate of about 14%. However, this
does not indicate a weak retail market in the Historic Downtown as a whole, but rather
reflects very high vacancy in two separate strips malls (indicated in Figure 4, pg. 8 at
points “2” and “6”), as mentioned in Section 2.3.1. This is discussed in greater detail in
Section 3.

By virtue of its age and urban design, the Historic Downtown is mostly appropriate for
small commercial units and firms seeking such units. This is true in both the retail and
office sectors. Most businesses in the area are small locally-owned operations with a
particular interest in the community and neighbourhood. Larger operations and
franchises tend to locate elsewhere in the City. Small businesses are drawn to the
Historic Downtown because small units are what is available there, but they have also

5City of Abbotsford (2015). Historic Downtown Revitalization Tax Exemption Application
Form.
https://www.abbotsford.ca/Assets/2014+Abbotsford/Planning+and+Development/Plan
ning/Application+Forms/Historic+Downtown+Revitalization+Tax+Exemption+Application
+Form.pdf
6“Where a new building is constructed on a vacant lot within the area designated
Historic Downtown Abbotsford… the owner may remit a cash payment to the City in
the amount of $3,000 per off-street parking space in lieu of the required off-street
parking, up to a maximum of 10 spaces.” From Abbotsford Zoning Bylaw No. 2400-2014,
Section 150.5.1c. https://abbotsford.civicweb.net/document/11742
C i t y C e n t r e & H i s t o r i c D o w n t o w n C o m m e r c i a l S t u d y | 12

been drawn to the area due to low costs arising from older, less expensive rental space.
Insofar as older unrenovated buildings remain in the area, cost-conscious firms will
continue to go there. However, if renovation and replacement of older buildings
continues apace, this will be less true over time, and cost-conscious firms will need to
locate elsewhere. Already a shift has occurred away from lower-end businesses
towards higher-end, more boutique operations drawing on the Downtown Core’s
trendiness, and the supply of old buildings suitable for replacement or refurbishment is
dwindling. City policies that promote renovation and redevelopment will tend to
expedite this transition.

2.3.3           Barriers to Commercial Development in the Historic Downtown

2.3.3.1         Parking

The most commonly mentioned barrier to commercial development in the Historic
Downtown (and to the neighbourhood’s success generally) is the perceived lack of
parking in the area. One realtor claims that he is losing tenants due to lack of parking,
and points to downtowns in other communities that have fared poorly against
competing commercial centres with more parking space, for example Downtown
Langley with respect to Willowbrook Shopping Centre. Many stakeholders argue that
visitors to the Historic Downtown expect to be able to park within a block of their
destination and are unwilling to walk further, park underground, or pay very much.
Larger commercial tenants may also be unwilling to locate in the Historic Downtown as
they typically require a great deal of parking.

Although GPRA recognizes that the perceived lack of street parking can be a barrier to
commercial success in multiple ways, there are options for addressing this barrier.
Options include:

   •      Pricing street parking, which would free up parking spaces but increase visitor
          costs
   •      Building one or more City-owned parking structures in the Downtown Core
   •      Requiring more privately owned parking as part of development, either on the
          street or underground, which would deter development in either case
   •      Continuing with the current policy, which means some visitors use City-owned
          lots and walk several blocks to their destinations.
C i t y C e n t r e & H i s t o r i c D o w n t o w n C o m m e r c i a l S t u d y | 13 2.3.3.2 Jubilee Park The Historic Downtown – particularly the area around Jubilee Park – is frequented by a population of vulnerable individuals, many of them homeless. Some stakeholders identified this group and the services that cater to them as a barrier to the neighbourhood’s commercial vibrancy, primarily due to security concerns. Addressing this potential barrier goes beyond the scope of this research, though design improvements to Jubilee Park and adjacent areas could go a long way in making it a safer place. 2.3.3.3 Lack of Anchors One realtor pointed out that unlike the City Centre, the Historic Downtown lacks large retailers or “anchors” that would act as draws on customers, bringing people to the neighbourhood who would then spend time and money there en route. In particular, he recommended placing at least two large anchors in the Historic Downtown – ideally one on either side of the Downtown Core, which would encourage visitors to pass through the Core en route, and would stimulate more spending. Addressing this barriers is complicated by a general lack of large developable lots in the Historic Downtown. Placing more anchor tenants in the Historic Downtown might have the positive impact described here. 2.3.3.4 Design of Essendene Avenue Some stakeholders identified Essendene Avenue as a challenging location, because it passes right through the Downtown Core but has the width, traffic volume, and traffic speeds of an arterial road. The Avenue is therefore poorly designed for pedestrians and feels unsafe as a consequence. Traffic calming and further pedestrian improvements on Essendene Avenue might improve the Downtown Core from a commercial perspective. 2.3.3.5 Lack of Neighbourhood Residents There are residences in the Historic Downtown, but there could be more. Adding more residents to the neighbourhood would be a positive change. The financial impact of residential growth on Downtown businesses will be relatively minor, but the psychological impact will be positive, since it will create an established presence, ownership of the neighbourhood, and eyes on the street to enhance safety.
C i t y C e n t r e & H i s t o r i c D o w n t o w n C o m m e r c i a l S t u d y | 14

3               Retail and Service Commercial

This section presents GPRA’s research on existing retail and service commercial usage,
supply, and market conditions in the Study Areas, and then describes our process for
producing a 25-year retail and service commercial space projection for each.

3.1             Trends and Factors in Study Area Commercial Space

Retail within the City Centre study area is well established and is a highly successful
automobile oriented node. Retail is well built out within this Study Area, and typically
development within this neighbourhood involves replacement or renovation of an
existing building. The City Centre study area has seen a handful of small retail projects in
the past few years including the Wendy’s 2015 replacement, the 2014 demolition of
former pad tenant Earls replacement by a new two storey CIBC outlet, and the
ancillary restaurant operations to Sandman’s 2010 hotel development, Denny’s and
Moxie’s. Retail development can also be found at the ground floor level of mixed use
projects such as The Mark, Alwood Professional Centre, and the under construction La
Galleria which will introduce a further 40,000 SF inventory to the City Centre.

City Centre’s major retail centre, Sevenoaks Shopping Centre is currently performing
well with a low vacancy rate. Despite the mall’s last major renovations occurring in
2000, the centre will likely remain the premier comparison retail destination in
Abbotsford for the foreseeable future. To the west of Sevenoaks is the West Oaks
Shopping Centre, a convenience oriented strip centre anchored by Save on Foods and
London Drugs. The centre contains a small portion of enclosed retail space which is
struggling, however the exterior big box units appear to be performing well.

The Historic Downtown is currently seeing a renaissance driven by smaller, locally
operated retailers in contrast with the City Centre’s predominantly national /
international chains. Retailers historically situated in the Historic Downtown due to more
affordable rents, although this pattern is reversing quite rapidly with various retailers and
restaurateurs opening in the Historic Downtown, driving several small-scale infill
developments. Examples of such development can be seen with Yale Crossing (2010),
Pioneer Square (2013), and the Flatiron Building (2017), each introducing mixed use
development into the area, with at grade retail below residential or office uses.

Although boutique retailing in the Historic Downtown continues to see growth, everyday
convenience retail continues to be under represented. As a critical mass of residents
emerges over coming years this will likely change as a small format grocery store will
likely seek to fill this niche market.

Recent developments outside of the Study Areas include Phase I of McCallum Junction,
a 130,000 ft2 strip centre anchored by destination hunting, fishing, and outdoor
C i t y C e n t r e & H i s t o r i c D o w n t o w n C o m m e r c i a l S t u d y | 15

recreation store Cabela’s, a first in the Lower Mainland. Phase II of McCallum Junction is
expected to introduce numerous pad units and CRUs with confirmed tenants including
McDonald’s, Starbucks, and numerous commercial services.

Another major recent development is the High Street, a 600,000 ft2 unenclosed
shopping centre at Highway 1 and Mt. Lehman Road. Anchor tenants include a
Walmart, London Drugs, Old Navy, and Cineplex. The centre’s tenant mix has a high
proportion of chain food and beverage operators and introduces several first to market
casual and quick service eateries including Canadian Brewhouse, Famoso Pizzeria,
Mucho Burrito, and Cupcake. Food and beverage outlets are clustered to the west of
the project and help to facilitate foot traffic between the centre’s convenience uses
past low to mid-market apparel, accessories, and cosmetic / beauty retailers.

Other notable retail deals over the past couple of years include the tenanting of the
former Target location in Abbotsford Power Centre as part of a national expansion by
home improvement store Lowe’s, and the shuttering of the adjacent Rona.

3.2             Definition and types of retail and service commercial

Retail and service commercial businesses cater to consumers rather than other
businesses. This category of commerce excludes:

   •     Accommodation
   •     Business services such as industrial equipment rental
   •     Care facilities
   •     Construction and trades
   •     Logistics operations such as shipping and storage
   •     Above-ground office space, which is addressed separately in Section 4.

Most businesses with storefronts or “public” offices can be considered retail or service
commercial. The four primary categories of retail and service commercial are:

   •     Convenience retail, typically associated with daily needs including grocery
         stores, pharmacies, liquor stores, service commercial (businesses selling services
         rather than tangible goods), healthcare services, and financial services
   •     Comparison retail, which sells higher order items such as clothing, furniture,
         household appliances, jewelry and watches etc.
   •     Automotive, including dealerships, auto parts and servicing, and gas stations
   •     Food and beverage & entertainment and leisure, which includes restaurants,
         bars, entertainment (passive e.g. movie theatre), and leisure (active e.g.
         gymnasium)
C i t y C e n t r e & H i s t o r i c D o w n t o w n C o m m e r c i a l S t u d y | 16 3.3 Existing retail and service commercial GPRA has created an inventory of existing retail and service commercial space in Abbotsford based on the following sources of data: • The City’s business license database • Colliers’ 2015 Commercial Study (OCP) • Building footprints extracted from Open Street Map data • A walking inventory of the Study Areas completed by GPRA • Online sources such as Google Streetview and mall websites • Interviews with local realtors & developers. Tables 1, 2, and 3 present the complete inventory of retail and service commercial space in Abbotsford, divided into the four primary categories as well as 22 secondary categories. It is an approximate estimation of currently used space, with vacant space shown as a separate item. The amount of space used by each category of commercial activity is indicated for Abbotsford in general, and for the Study Areas. Figures 6, 7, and 8 on the following pages map the location of retail and service commercial in both Study Areas, City Centre, and Historic Downtown, respectively. Figure 9 outlines key retail nodes within Abbotsford outside of the Study Areas.
C i t y C e n t r e & H i s t o r i c D o w n t o w n C o m m e r c i a l S t u d y | 17

               Table 1: Retail and service commercial space in Abbotsford by neighbourhood
                                                                                                                       South                                                              Bradner-
                                                  Historic Marshall-                            Immel-                                       Sumas                              Matsqui              Sumas     South                 West      Sumas
                                   City Centre                         U District Clearbrook              Townline   Clearbroo   Fairfield             Clayburn McKee Whatcom                Mt.                        Aberdeen                           Total
                                                 Downtown McCallum                             McMillan                                       Way                               Prairie              Prarie   Poplar               Abbotsford Mountain
                                                                                                                         k                                                                Lehman
Convenience Retail                   649,200      240,400    19,200      4,900     138,700      115,100   216,100      18,100      1,200     191,600    50,400   -    130,400   10,700     10,800    23,300     9,100      3,000        -         -      1,832,300
Grocery & Supermarkets               319,100       52,900     3,100      1,600      20,300       39,700    99,500       4,100      1,200     142,800    17,700   -     79,400    2,600      1,700    20,000     4,400      3,000         -        -        813,200
Pharmacy                              31,900        3,200     1,100         -        7,100        1,600    19,500          -         -        10,500     3,500   -      4,600       -       2,000        -         -          -          -        -         85,000
Alcohol                               16,400       11,700        -          -        2,700       10,100    10,500          -         -         2,000        -    -      7,700       -          -         -         -          -          -        -         61,200
Services                             117,300      124,300     5,300      3,300      60,600       39,000    31,600      14,000        -        11,100    14,900   -     17,300    3,100      4,600     3,300     4,700         -          -        -        454,500
Financial Services                    99,500       17,100        -          -       31,800       19,700    35,600          -         -        25,100     3,500   -     14,600    5,000      1,500        -         -          -          -        -        253,500
Healthcare Services                   65,000       31,200     9,700         -       16,200        5,000    19,400          -         -            -     10,600   -      6,800       -       1,000        -         -          -          -        -        164,900
Comparison Retail                    879,600      264,700    70,000     16,300     168,500       13,000   252,200      18,300      9,200     525,900     3,500   -     12,700      -        3,800       -      10,700        500        -         -      2,249,000
Apparel                              241,000       46,600        -          -       45,400           -    112,100       1,800      6,000      55,700        -    -         -        -          -         -         -          -          -        -        508,500
Cosmetics, Health, Bath & Beauty      69,400        3,000        -          -           -         1,600    18,000          -         -        19,500        -    -      5,500       -          -         -         -          -          -        -        117,000
Electronics & Appliances             157,800       13,000        -          -        9,200        7,600    36,800       2,600        -        33,100        -    -      2,700       -       1,900        -         -          -          -        -        264,700
Footwear & Accessories                29,800        2,700        -          -        7,600           -      3,500         400      1,400      14,600        -    -         -        -          -         -         -          -          -        -         60,000
Home Furnishings                     168,500       45,800        -          -       31,200           -     54,400       3,100      1,800     148,500        -    -      1,800       -          -         -         -          -          -        -        455,300
Home Improvement                      50,000       42,700        -          -       55,300           -         -        2,600        -       217,000        -    -         -        -          -         -     10,700         -          -        -        378,400
Jewellery & Watches                    9,000        2,200        -          -           -            -         -           -         -            -         -    -         -        -          -         -         -          -          -        -         11,200
Multimedia, Books & Music             29,800        7,800        -          -        4,700           -         -           -         -         1,200        -    -         -        -          -         -         -          -          -        -         43,500
Sports & Recreational Goods           46,700       45,100    70,000     16,300          -         3,800        -        7,800        -            -         -    -         -        -          -         -         -          -          -        -        189,800
Pet Goods, Toys, Hobbies              77,700       55,700        -          -       15,100           -     27,400          -         -        36,200     3,500   -      2,600       -       1,900        -         -         500         -        -        220,600
F&B, Entertainment & Leisure         246,200      205,300    10,800    165,200      76,100       45,000   158,900      21,600        -        62,900    18,500   -     15,900    1,900     11,500     8,800    25,100      6,700      2,500       -      1,082,900
F&B                                  143,300      129,400    10,800     20,200      73,800       45,000    49,000      21,600        -        61,400    14,900   -     14,600    1,900     10,600     8,800    20,500      6,700      2,500       -        635,000
Entertainment                             -        26,300        -     145,000          -            -     47,800          -         -            -         -    -         -        -          -         -         -          -          -        -        219,100
Leisure                              102,900       49,600        -          -        2,300           -     62,100          -         -         1,500     3,500   -      1,300       -         900        -      4,700         -          -        -        228,800
Auto Rela ted                        161,500       53,200     9,200      9,000      50,000        3,400     8,400      93,700        -        41,700     2,900   -      2,400    1,200    171,300     3,900   146,300     16,400     10,300       -        785,000
Gas Station                            6,500        1,000     5,600      4,000       5,000        3,400     8,400       7,100        -         9,100     2,900   -      2,400       -       6,600     3,900    56,200     14,300     10,300       -        146,700
Motor Vehicles and Parts Dealers      62,000        5,900        -          -       32,500           -         -       24,700        -        12,700        -    -         -        -     164,000        -     62,800         -          -        -        364,400
Auto Service                          93,000       46,400     3,700      5,000      12,500           -         -       61,900        -        19,900        -    -         -     1,200        800        -     27,300      2,100         -        -        273,800

Vacant                               110,300      124,100     2,600      2,100      21,200          -       77,300        -          -        88,800      -      -      9,400    2,900        -         -         -         -            -        -       438,500

Total Retail                       2,046,800      887,700   111,900    197,500     454,400      176,600   712,800     151,800    10,500      910,900    75,300   -    170,800   16,700    197,400    36,000   191,200     26,600     12,800       -      6,387,600

               The above table outlines the breakdown of Abbotsford’s retail by Neighbourhood. Abbotsford’s retail is typically
               concentrated in the City’s more central, urban neighbourhoods. City Centre is Abbotsford’s commercial heart containing
               over 2 million ft2 of retail. Sumas Way is home to Abbotsford’s second highest amount of retail floorspace, contained
               primarily in big box retail.
C i t y C e n t r e & H i s t o r i c D o w n t o w n C o m m e r c i a l S t u d y | 18
Table 2: Retail and service commercial space in Study Areas (% shown as total of
citywide inventory)
Historic Non Study Abbotsford
Predominant Retail Category (SF) City Centre % % %
Downtown Area Total
Convenience Retail 632,200 35% 181,800 10% 1,018,300 56% 1,832,300 100%
Grocery & Supermarkets 316,400 39% 35,800 4% 461,000 57% 813,200 100%
Pharmacy 30,700 36% 3,200 4% 51,100 60% 85,000 100%
Alcohol 16,400 27% 11,700 19% 33,100 54% 61,200 100%
Services 110,000 24% 91,000 20% 253,400 56% 454,400 100%
Financial Services 99,500 39% 14,800 6% 139,200 55% 253,500 100%
Healthcare Services 59,200 36% 25,300 15% 80,400 49% 164,900 100%
Comparison Retail 873,300 39% 153,900 7% 1,221,800 54% 2,249,000 100%
Apparel 241,000 47% 34,600 7% 233,000 46% 508,600 100%
Cosmetics, Health, Bath & Beauty 69,400 59% 3,000 3% 44,600 38% 117,000 100%
Electronics & Appliances 156,600 59% 6,900 3% 101,200 38% 264,700 100%
Footwear & Accessories 29,800 50% 2,700 4% 27,500 46% 60,000 100%
Home Furnishings 168,500 37% 42,300 9% 244,500 54% 455,300 100%
Home Improvement 50,000 13% 2,600 1% 325,800 86% 378,400 100%
Jewellery & Watches 9,000 80% 2,200 20% - 0% 11,200 100%
Multimedia, Books & Music 29,800 68% 7,800 18% 5,900 14% 43,500 100%
Sports & Recreational Goods 41,500 22% 14,600 8% 133,700 70% 189,800 100%
Pet Goods, Toys, Hobbies 77,700 35% 37,200 17% 105,700 48% 220,600 100%
Restaurants & Entertainment 241,000 22% 134,000 12% 707,800 65% 1,082,800 100%
F&B 138,100 22% 95,400 15% 401,400 63% 634,900 100%
Entertainment - 0% 21,500 10% 197,600 90% 219,100 100%
Leisure 102,900 45% 17,100 7% 108,800 48% 228,800 100%
Auto Related 140,800 18% 24,600 3% 619,700 79% 785,100 100%
Motor Vehicles and Parts Dealers 56,900 16% 2,200 1% 305,300 84% 364,400 100%
Auto Service 77,300 28% 21,400 8% 175,100 64% 273,800 100%
Gas Station 6,500 4% 1,000 1% 139,200 95% 146,700 100%
Vacant 104,900 24% 101,300 23% 232,300 53% 438,500 100%
Total Retail 1,992,200 31% 595,600 9% 3,799,800 59% 6,387,600 100%
Table 2 reveals that the City Centre Study Area contains almost one third of Abbotsford
retail, while the Historic Downtown contains just under 10%. The City Centre accounts
for over half of citywide inventory levels in many comparison categories (such as
cosmetics, electronics, multimedia, and footwear and accessories).
Most auto related retailers can be found outside of the Study Areas (predominantly at
Abbotsford’s auto mall), along with food and beverage (distributed throughout
Abbotsford) and entertainment retailers (including at the High Street).
The above inventory totals are by Study Areas, which are geographically smaller than
Neighbourhoods, and therefore differ from inventory numbers seen in Table 1 which
shows retail by Neighbourhood.C i t y C e n t r e & H i s t o r i c D o w n t o w n C o m m e r c i a l S t u d y | 19
Table 3: Retail and service commercial space in Study Areas (% shown as total of retail
composition by area)
Historic Non Study Abbotsford
Predominant Retail Category (SF) City Centre % % %
Downtown Area Total
Convenience Retail 632,200 32% 181,800 31% 1,018,300 27% 1,832,300 100%
Grocery & Supermarkets 316,400 16% 35,800 6% 461,000 12% 813,200 100%
Pharmacy 30,700 2% 3,200 1% 51,100 1% 85,000 100%
Alcohol 16,400 1% 11,700 2% 33,100 1% 61,200 100%
Services 110,000 6% 91,000 15% 253,400 7% 454,400 100%
Financial Services 99,500 5% 14,800 2% 139,200 4% 253,500 100%
Healthcare Services 59,200 3% 25,300 4% 80,400 2% 164,900 100%
Comparison Retail 873,300 44% 153,900 26% 1,221,800 32% 2,249,000 100%
Apparel 241,000 12% 34,600 6% 233,000 6% 508,600 100%
Cosmetics, Health, Bath & Beauty 69,400 3% 3,000 1% 44,600 1% 117,000 100%
Electronics & Appliances 156,600 8% 6,900 1% 101,200 3% 264,700 100%
Footwear & Accessories 29,800 1% 2,700 0% 27,500 1% 60,000 100%
Home Furnishings 168,500 8% 42,300 7% 244,500 6% 455,300 100%
Home Improvement 50,000 3% 2,600 0% 325,800 9% 378,400 100%
Jewellery & Watches 9,000 0% 2,200 0% - 0% 11,200 100%
Multimedia, Books & Music 29,800 1% 7,800 1% 5,900 0% 43,500 100%
Sports & Recreational Goods 41,500 2% 14,600 2% 133,700 4% 189,800 100%
Pet Goods, Toys, Hobbies 77,700 4% 37,200 6% 105,700 3% 220,600 100%
Restaurants & Entertainment 241,000 12% 134,000 22% 707,800 19% 1,082,800 100%
F&B 138,100 7% 95,400 16% 401,400 11% 634,900 100%
Entertainment - 0% 21,500 4% 197,600 5% 219,100 100%
Leisure 102,900 5% 17,100 3% 108,800 3% 228,800 100%
Auto Related 140,800 7% 24,600 4% 619,700 16% 785,100 100%
Motor Vehicles and Parts Dealers 56,900 3% 2,200 0% 305,300 8% 364,400 100%
Auto Service 77,300 4% 21,400 4% 175,100 5% 273,800 100%
Gas Station 6,500 0% 1,000 0% 139,200 4% 146,700 100%
Vacant 104,900 5% 101,300 17% 232,300 6% 438,500 100%
Total Retail 1,992,200 100% 595,600 100% 3,799,800 100% 6,387,600 100%
Table 3 outlines the retail composition of each Study Area by category. The retail
composition of the City Centre Study Area is heavily skewed towards convenience and
comparison retail users, while the Historic Downtown Study Area has a more balanced
tenant mix featuring a high proportion of F&B.C i t y C e n t r e & H i s t o r i c D o w n t o w n C o m m e r c i a l S t u d y | 20 Figure 6 (page 22) outlines the distribution of retail throughout both the City Centre and Historic Downtown Study Areas. One of the key differences that can be observed when comparing the two Study Areas is that unit sizes within the City Centre are significantly larger than those in the Historic Downtown, mirroring a trend that can be seen across much of North America. As automobile and suburban culture rapidly expanded in the Mid-20th Century retail underwent a seismic shift that saw the development of large scale suburban projects that had few land restraints. The City Centre Study Area (Figure 7, pg. 23) caters to some of the densest, most populated neighbourhoods in Abbotsford with a diverse convenience retail mix situated along major arterials in the study area. Major national grocery retails such as Save on Foods, Independent Grocer, and the Real Canadian Superstore can be found alongside ancillary everyday goods and services such as liquor stores, butchers, dry cleaners, hair dressers, shoe repair stores etc. Due in part to its central location the City Centre is also home to a disproportionately high amount of financial services such as banks which benefit from locating along busy thoroughfares. The City Centre contains 40% of Abbotsford’s comparison retail, primarily located south of Fraser Way in the Sevenoaks Shopping Centre, along with several other smaller power centres such as Clearbrook Town Square and West Oaks Mall. Comparison retail within the City Centre contains almost a wide variety of domestic and international retailer such as Hudson’s Bay, Sears, Best Buy, Bed, Bath & Beyond, Sports Chek, Canadian Tire, etc. Although these reputable retailers offer a wide selection of products, they are also available in almost every other municipality in the Lower Mainland (particularly Surrey, Langley, and Vancouver), and stock goods widely available online, increasing the likelihood of sales leakage. Both the City Centre and the Historic Downtown currently have limited entertainment venues, such as theatres and cinemas. Entertainment venues typically draw from a wide distance and can provide surrounding businesses with increased foot traffic (such as theatre patrons eating dinner before a performance). This effect is particularly pronounced in walkable neighbourhoods. Leisure options are well represented in the City Centre, which contains major gyms such as Trevor Linden / She’s Fit, Good Life Fitness, and VRC Fitness. The City Centre’s food and beverage offering contains many national and international F&B operators including both full service restaurants (Moxie’s, White Spot, Boston Pizza), and quick service restaurants (McDonalds, Wendy’s, A&W). These restaurants are concentrated along South Fraser Way. Other locally operated food and beverage operations can be found, particularly quick service restaurants in convenience strip centres.
You can also read